Embed Size (px)
Citation preview
115
MORTALITY OF INDIAN ASSURED LIVES
BY D. D. MARKAN, B.Sc., F.I.A.
THE standard table of mortality of assured lives used in India before the nationalization of life insurance business was the Oriental’s (1925-35) table. This was derived from the experience of lives assured with the leading insurance company, ‘Oriental’, during 1925-35. A paper dealing with this experience was submitted to the Institute by the late L. S. Vaidy- anathan (J.I.A., 70, 15). Substantial changes in mortality rates which had occurred during the decade and a half that had elapsed since the pub- lication of this table led the Indian actuaries to modify the table for the purposes of the last general revision of premium rates which took place in 1954. The modification adopted by the Oriental was to take 70% of its 1925-35 qs up to age 50, gradually increasing the percentage to 100% at 70, and keeping it uniform at that level thereafter. The Indian Life Assurance Offices’ Association had by this time already started collecting data for the purposes of a study of the combined mortality experience of life offices in India which could not, however, be completed on account of nationalization. The data submitted to the Association by the Oriental pertaining to the years 1953-54, were subsequently analysed by Life Insurance Corporation in connexion with the framing of a scheme in terms of Sec. 49(2)(k) of the LIC Act, 1956. This investigation is interesting inasmuch as it brought to a focus the changes in mortality which had oc- curred since the publication of Oriental’s (1925-35) table. A paper dealing with the experience during 1961 of nine Integrated Head Office Units of leading Indian Insurers (IHOs) and fifteen Divisional Offices of LIC was submitted jointly by the author and V. H. Vora to the Actuarial Society of India (T.A.S. 1963, 1). These studies showed that very sub- stantial reduction in mortality rates had taken place over the last three decades, the greatest proportionate reductions being at ages below 50. A pressing need was therefore felt for a new table to provide an efficient and up-to-date instrument for life assurance calculations.
2. Commencing from the policy anniversary in 1961, all the offices of the Corporation and the above-mentioned nine IHOs have been contri- buting data for LIC’s Continuous Mortality Investigation, After the publication of the experience of lives assured with LIC during 1961, it was decided to make the first mortality investigation of assured lives in India, covering the period 1961-64. This period was considered suitable as some preliminary investigations, referred to earlier, had already been made and also there were no abnormal occurrences during this period.
3. The form in which the data were collected is given in Appendix I of our paper to the Actuarial Society of India (T.A.S. 1963, 1). For the purposes of the construction of the standard table, the experience of medically examined male lives accepted at ordinary rates under the
116 Mortality of Indian Assured Lives
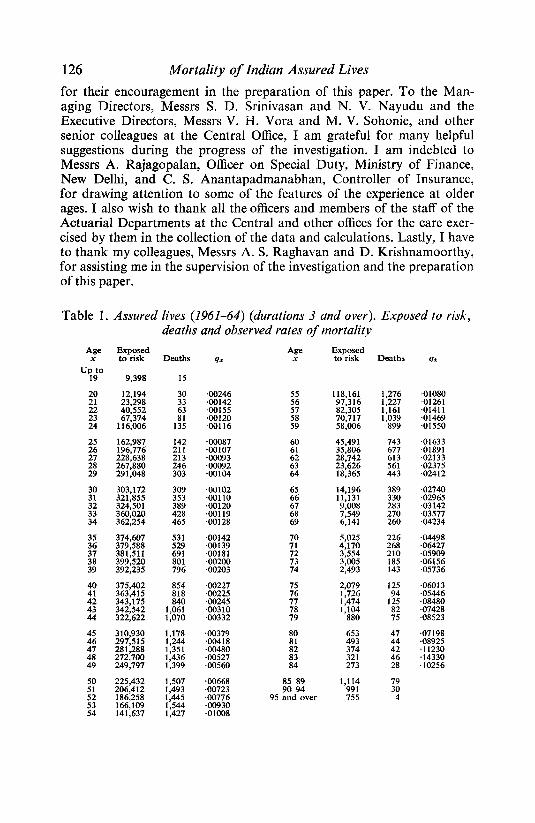
whole life and endowment assurance plans was used. The exposed to risk, deaths and observed rates of mortality for durations 3 and over are given in Table 1, and the comparison of actual deaths for durations 0 to 2 with expected deaths according to the contemporaneous mortality at durations 3 and over is given in Table 3. The aggregate figures for all ages are given in the following table:
Durations Duration 0 Duration 1 Duration 2 3 and over
Exposed to risk 1,152,079 1,134,223 1,279,080 9,75,692 Deaths 1,935 2,429 2,693 37,455
The data are voluminous enough to provide a clear picture of the present level of mortality rates of assured lives in India. In the analysis that follows it will be well to bear in mind that whereas at durations 3 and over the bulk of the data at younger ages pertains to policies issued by the Corporation, at ages 50 and above the bulk pertains to policies issued by the nine IHOs whose experience is likely to be more favourable than the combined average experience of the erstwhile insurers. Although this introduces some heterogeneity the practical advantages obtained by combining the data with a view to having adequate exposed-to-risk at all ages are so overwhelming in constructing an efficient and reliable instrument for life assurance calculations, that this course was adopted.
4. Since 1961, the LIC has been issuing increasing numbers of policies on a non-medical basis. As the experience under this class of business needs to be carefully watched during the initial stages, steps were taken early to collect the data in a suitable form so that the mortality experience could be analysed and compared with that of medically examined lives. The mortality experience of this class of business is included in the present investigation.
5. No standard experience of female assured lives in India exists. The data relating to female lives accepted at ordinary rates were compiled in a suitable form for the evaluation of female assured lives’ mortality. Though the volume of the available data is rather small and pertains only to female lives considered to be on a par with male lives, yet for the first time we have a definite picture of the relative mortality of male and female lives assured.
6. From the point of view of practical convenience, the census method was used for the evaluation of mortality rates of both non-medical business and female lives assured.
Duration of selection
7. In the construction of assured lives’ mortality tables the problem of selection generally gives rise to considerable difficulty. In India the degree
Mortality of Indian Assured Lives 117
of selection is found to be relatively small. In the Oriental’s (1925–535) table the select period was taken to be one year. For the purpose of the present examination the data were collected separately for duration 0, 1, 2, and 3 and over. Before undertaking a detailed examination thereof it appears necessary to refer to certain special peculiarities of the data on which the standard table is based.
8. It may be recalled that in his paper the late L. S. Vaidyanathan (J.I.A. 70, 30) had devoted a special section to errors in age, which are inherent in the data of assured lives in India.
9. Soon after its establishment, the LIC undertook an intensive drive to develop insurance business in the interior rural areas. As a result, nearly 36% of new policies issued at present are from rural areas, con- siderably adding to the existing difficulties of getting satisfactory proof of age at the time of effecting assurances. On the other hand the intro- duction of a Salary Savings Scheme by the LIC under which the premiums are deducted from salary by the employer and remitted to the Corpor- ation, and which has proved very popular in urban centres, has had an opposite effect, for under these policies a satisfactory record of age is almost invariably available. The policies issued under this scheme form at present nearly 20% of the new policies issued.
10. Production of satisfactory proof of age at the proposal stage is generally insisted upon by LIC offices, failing which efforts are made to secure it as early as possible, after the issue of the policy. Anyway, in recent years a general awareness is shown by the agency organization to the practical need for getting the age admitted along with the proposal. Accordingly a considerable improvement has now taken place in the admission of age: the percentage of policies issued with age admitted was 46·3 in the financial year 1965–66, 53·9 in the financial year 1966–67, and 57·6 in the financial year 1967-68.
11. It will be clear from the above that in considering the results of the present investigation it is to be borne in mind that in the majority of cases exposed-to-risk at durations 0, 1 and 2, age had not been proved at the time of proposal. A certain degree of caution is, therefore, necessary in comparing the rates at duration 0, 1 and 2 with those at durations 3 and over. It is generally found that when proof of age is submitted within a reasonable time after the issue of the policy, say a couple of years, the chances of the original age being understated are practically the same as of its being overstated. Where, however, there has been a deliberate understatement of age with a view to deriving the benefit of lower pre- miums, there would be an attempt to delay the submission of proof of age as long as possible. In a recent review of pending matured claims, it was found that the non-admission of age was responsible for nearly one-eighth of the cases. Longer delay of submission of proof of age is, therefore, more likely to be associated with understatement of age. It may be taken that with the greater spread of education, the understatement
118 Mortality of Indian Assured Lives
at younger ages is not likely to be significant but in the middle age-groups it is likely to be substantial. At ages 50 and above, no policy is issued by the Corporation unless age is first proved. At duration 0, therefore, the effect of understatement would be substantial only at ages 40–49. At durations 1 and 2, the exposed to risk at ages 50 and above includes a block of policies issued at ages below 50 with a substantial proportion of cases where age is understated. The exposed to risk at durations 3 and over at middle and higher age-groups includes policies issued at all earlier entry ages, several years ago, and the result of the alterations in age since effected is to reduce the proportion of cases where the age is understated. Under these conditions the mortality rates at durations 3 and over would appear to be relatively low as compared with the rates at durations 1 and 2. In the above argument, it is assumed that the deaths are shown against their correct age because the settlement of claims depends upon the age being first proved to the satisfaction of the insurer. Another rele- vant factor in this connexion is the fact that the nine IHOs’ experience is likely to be more favourable than the average experience of the lives assured with the erstwhile insurers.
12. In this connexion, it is interesting to note that according to a recent sample check of alterations in age during the months of January to March 1968 in a divisional office, it was found that in 115 cases of alterations due to understatement of age the average understatement was by 1·45 years- Further, 23% of these were carried out in the first year; 9% l-2 years after issue; 44% 3-6 years after issue and 24% 7–10 years after issue-
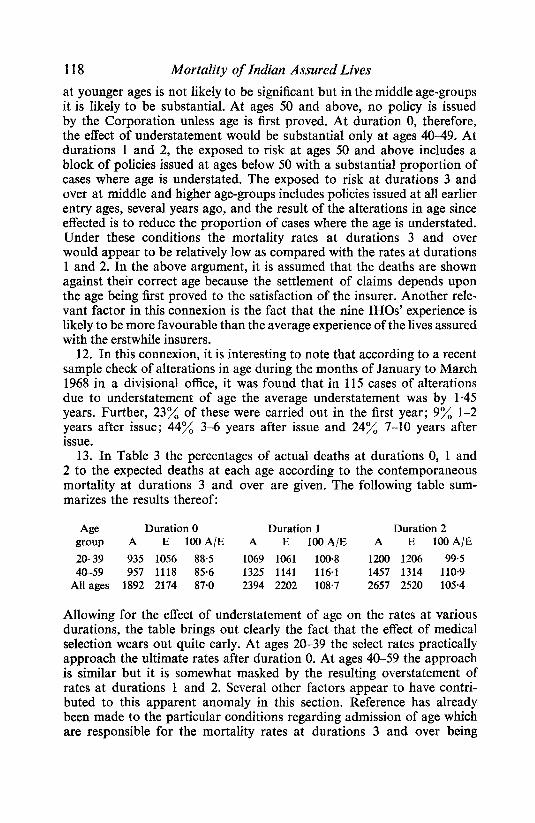
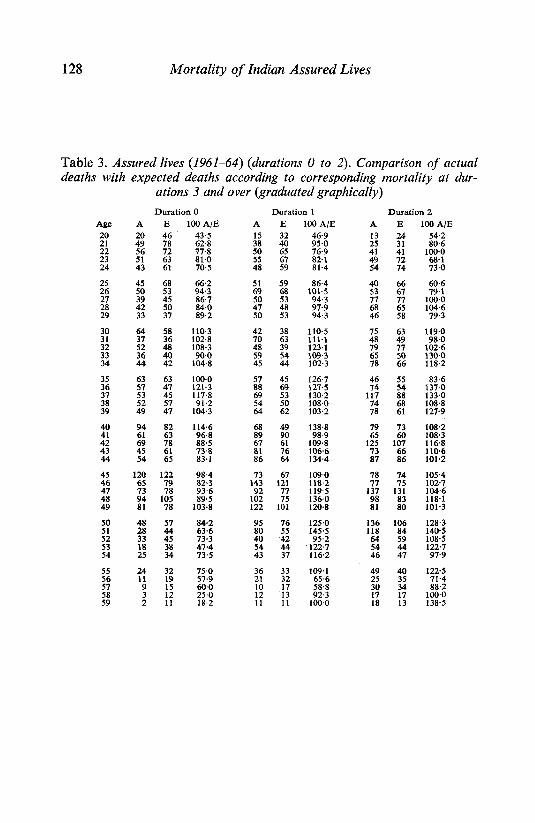
13- In Table 3 the percentages of actual deaths at durations 0, 1 and 2 to the expected deaths at each age according to the contemporaneous mortality at durations 3 and over are given- The following table sum- marizes the results thereof:
Age Duration 0 Duration 1 Duration 2
group A E 100 A/E A E 100 A/E A E 100 A/E
20—39 935 1056 88·5 1069 1061 100·8 1200 1206 99·5
40—59 957 1118 85·6 1325 1141 116·1 1457 1314 110·9
All ages 1892 2174 87·0 2394 2202 108·7 2657 2520 105·4
Allowing for the effect of understatement of age on the rates at various durations, the table brings out clearly the fact that the effect of medical selection wears out quite early- At ages 20-39 the select rates practically approach the ultimate rates after duration 0- At ages 40-59 the approach is similar but it is somewhat masked by the resulting overstatement of rates at durations 1 and 2. Several other factors appear to have contri- buted to this apparent anomaly in this section. Reference has already been made to the particular conditions regarding admission of age which are responsible for the mortality rates at durations 3 and over being
Mortality of Indian Assured Lives 119
relatively low as compared with the rates at durations 1 and 2. Again at durations 1 and 2 the effect is somewhat magnified as a result of the withdrawal of healthy lives resulting from the lapsing of policies by a fairly large proportion of policyholders after the payment of one or more instalments of premiums.
14. It was decided that for practical purposes, it would be sufficient to take the selection to last only one year and to take the ungraduated rates for durations 1 and over as being suitable for constructing the ultimate table.
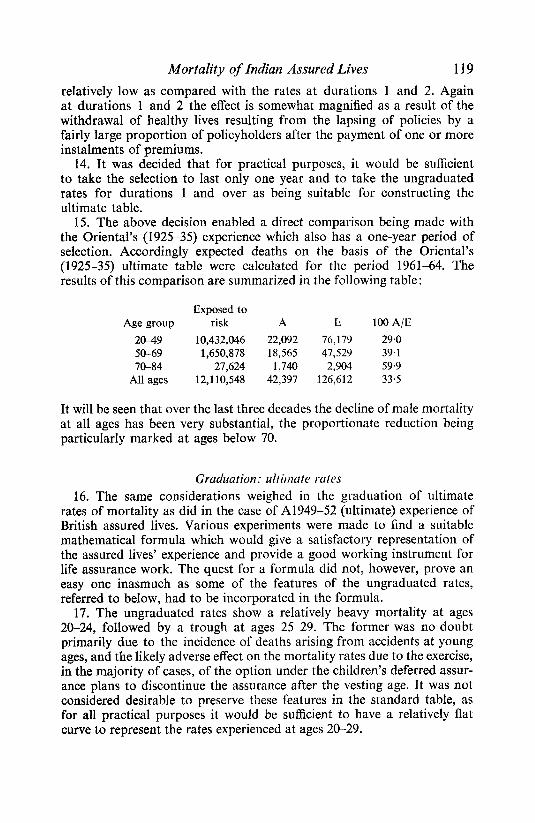
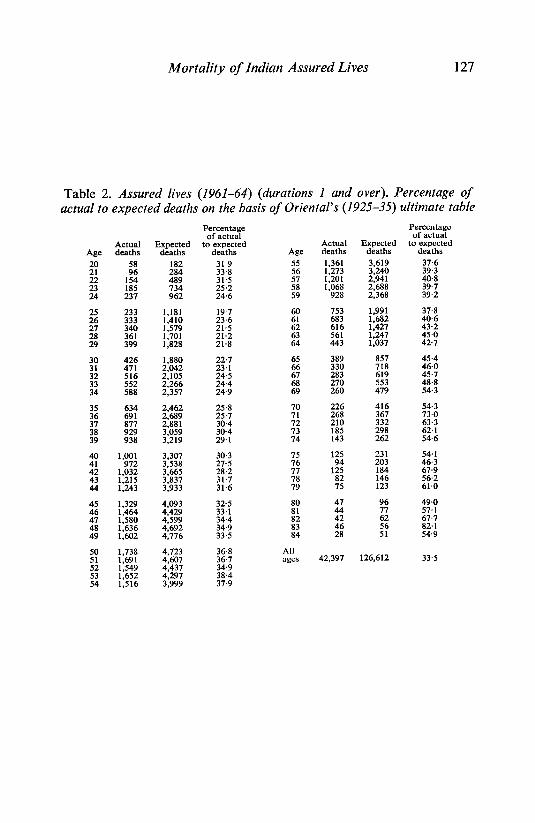
15. The above decision enabled a direct comparison being made with the Oriental’s (1925-35) experience which also has a one-year period of selection. Accordingly expected deaths on the basis of the Oriental’s (1925-35) ultimate table were calculated for the period 1961-64. The results of this comparison are summarized in the following table:
Exposed to Age group risk A E 100 A/E
20–49 10,432,046 22,092 76,179 29·0 50-69 1,650,878 18,565 47,529 39·1 70-84 27,624 1,740 2,904 59·9
All ages 12,110,548 42,397 126,612 33·5
It will be seen that over the last three decades the decline of male mortality at all ages has been very substantial, the proportionate reduction being particularly marked at ages below 70.
Graduation: ultimate rates
16. The same considerations weighed in the graduation of ultimate rates of mortality as did in the case of A1949-52 (ultimate) experience of British assured lives. Various experiments were made to find a suitable mathematical formula which would give a satisfactory representation of the assured lives’ experience and provide a good working instrument for life assurance work. The quest for a formula did not, however, prove an easy one inasmuch as some of the features of the ungraduated rates, referred to below, had to be incorporated in the formula.
17. The ungraduated rates show a relatively heavy mortality at ages 20-24, followed by a trough at ages 25-29. The former was no doubt primarily due to the incidence of deaths arising from accidents at young ages, and the likely adverse effect on the mortality rates due to the exercise, in the majority of cases, of the option under the children’s deferred assur- ance plans to discontinue the assurance after the vesting age. It was not considered desirable to preserve these features in the standard table, as for all practical purposes it would be sufficient to have a relatively flat curve to represent the rates experienced at ages 20-29.
120 Mortality of Indian Assured Lives
18. It has already been observed earlier that the decline in male mor- tality during the last three decades has been very substantial, particularly at ages below 50. Accordingly, between ages 30 and 50, a rapidly increasing progression of rates was required to represent the actual experience.
19. As the data for the standard table comprise whole life and endow- ment assurances, under both with-profit and non-profit policies, regard must be had to the existence of a differential between the whole life and endowment mortality. This differential ceases to have any relevance at ages above 70 where the data consist of whole life policies only. As a result the transition of rates from 55 to higher ages has to be considerably steeper than that disclosed by the actual experience.
20. Again, at ages 75 and above the proportion of the paid-up policies included in the whole life non-profit data has an increasing influence on the rates particularly as the major portion of the data at advanced ages included in the present investigation pertains to policies issued by erst- while insurers, whereunder in a sizeable proportion of cases contact with the life assured is believed to have been lost. It is necessary, therefore, to ensure that in the published tables the rates at ages 75 and above, while being in line with the progression of rates at ages below that age, should be progressively higher than the ungraduated rates so as to offset as much as practicable the effect on the rates of mortality at these ages due to the non-exclusion of paid-up policies.
21. Incorporation of the above features of the ungraduated rates in a single mathematical formula presented a considerable difficulty. To resolve the same, various experiments were carried out with the prime consider- ation of representing the ultimate experience by a smoothly progressing series of rates rather than to achieve the ‘best’ fit, satisfying the rigorous statistical tests for adherence to data.
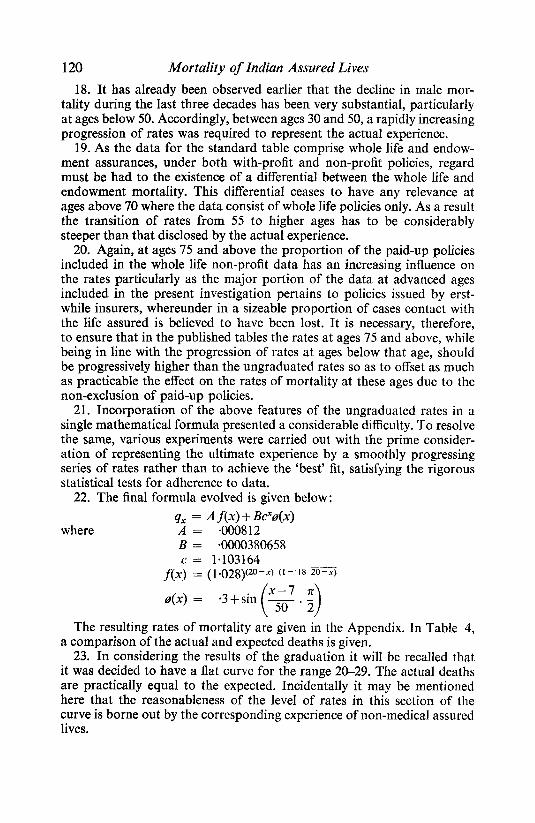
22. The final formula evolved is given below:
qx = A f(x) + Bcxo(x)
where A = ·000812 B = ·0000380658 c = 1·103164
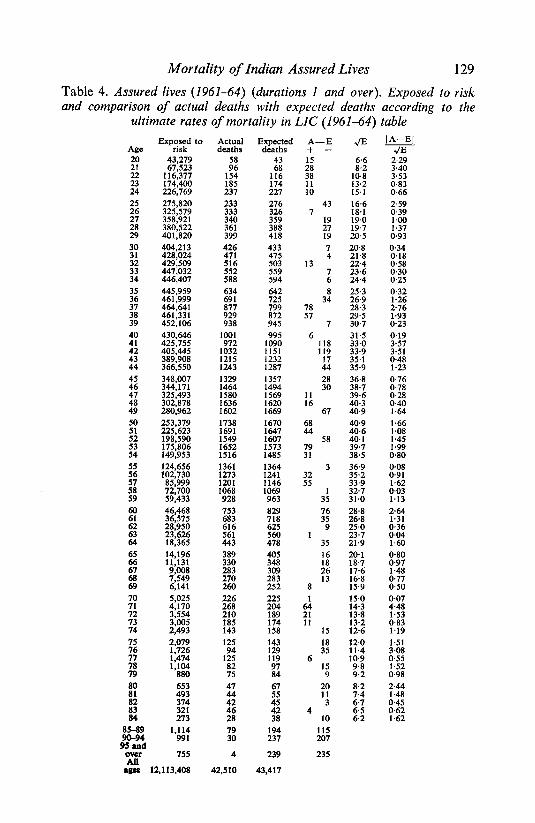
The resulting rates of mortality are given in the Appendix. In Table 4, a comparison of the actual and expected deaths is given.
23. In considering the results of the graduation it will be recalled that it was decided to have a flat curve for the range 20-29. The actual deaths are practically equal to the expected. Incidentally it may be mentioned here that the reasonableness of the level of rates in this section of the curve is borne out by the corresponding experience of non-medical assured lives.
Mortality of Indian Assured Lives 121
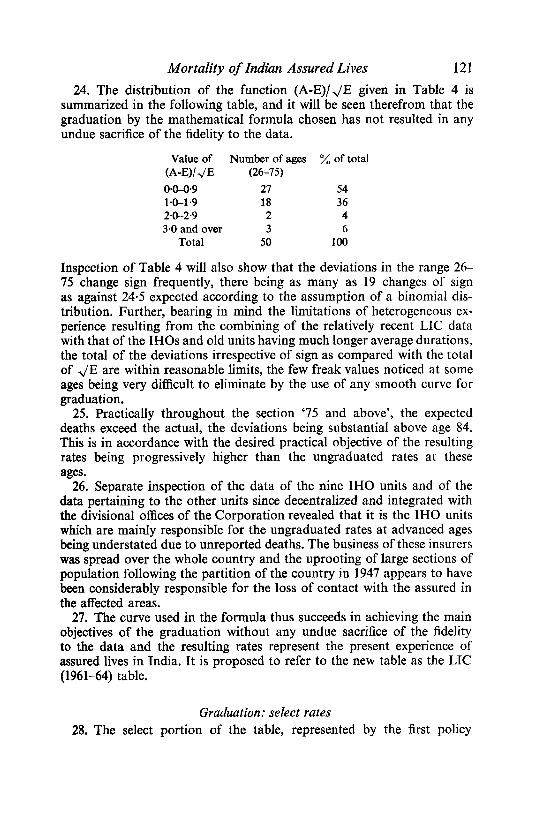
24. The distribution of the function (A-E)/ E given in Table 4 is summarized in the following table, and it will be seen therefrom that the graduation by the mathematical formula chosen has not resulted in any undue sacrifice of the fidelity to the data.
Value of Number of ages % of total (A-W)/ E (26-75)
0·0-0·9 27 54 1·1-1·9 18 36 2·0-2·9 2 4 3·0 and over 3 6
Total 50 100
Inspection of Table 4 will also show that the deviations in the range 26- 75 change sign frequently, there being as many as 19 changes of sign as against 24·5 expected according to the assumption of a binomial dis- tribution. Further, bearing in mind the limitations of heterogeneous ex- perience resulting from the combining of the relatively recent LIC data with that of the IHOs and old units having much longer average durations, the total of the deviations irrespective of sign as compared with the total of E are within reasonable limits, the few freak values noticed at some ages being very difficult to eliminate by the use of any smooth curve for graduation.
25. Practically throughout the section ‘75 and above’, the expected deaths exceed the actual, the deviations being substantial above age 84. This is in accordance with the desired practical objective of the resulting rates being progressively higher than the ungraduated rates at these ages.
26. Separate inspection of the data of the nine IHO units and of the data pertaining to the other units since decentralized and integrated with the divisional offices of the Corporation revealed that it is the IHO units which are mainly responsible for the ungraduated rates at advanced ages being understated due to unreported deaths. The business of these insurers was spread over the whole country and the uprooting of large sections of population following the partition of the country in 1947 appears to have been considerably responsible for the loss of contact with the assured in the affected areas.
27. The curve used in the formula thus succeeds in achieving the main objectives of the graduation without any undue sacrifice of the fidelity to the data and the resulting rates represent the present experience of assured lives in India. It is proposed to refer to the new table as the LIC (1961-64) table.
Graduation: select rates 28. The select portion of the table, represented by the first policy
122 Mortality of Indian Assured Lives
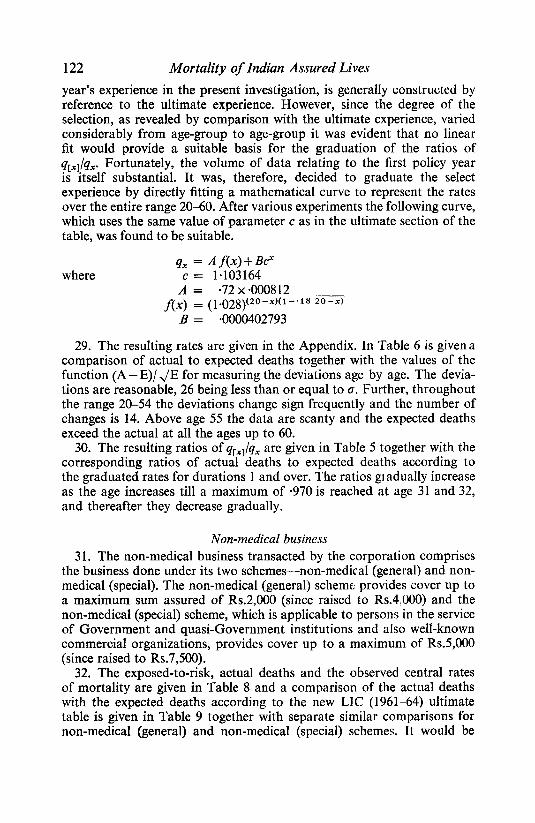
year’s experience in the present investigation, is generally constructed by reference to the ultimate experience. However, since the degree of the selection, as revealed by comparison with the ultimate experience, varied considerably from age-group to age-group it was evident that no linear fit would provide a suitable basis for the graduation of the ratios of q[x]/qx. Fortunately, the volume of data relating to the first policy year is itself substantial. It was, therefore, decided to graduate the select experience by directly fitting a mathematical curve to represent the rates over the entire range 20-60. After various experiments the following curve, which uses the same value of parameter c as in the ultimate section of the table, was found to be suitable.
where qx = A f(x) + Bcx
c = 1·103164 A = ·72×·000812 __
f(x) = (1.028)(2o-x)(1-·18 20-x)
B = ·0000402793
29. The resulting rates are given in the Appendix. In Table 6 is given a comparison of actual to expected deaths together with the values of the function (A – E)/ E for measuring the deviations age by age. The devia- tions are reasonable, 26 being less than or equal to Further, throughout the range 20–54 the deviations change sign frequently and the number of changes is 14. Above age 55 the data are scanty and the expected deaths exceed the actual at all the ages up to 60.
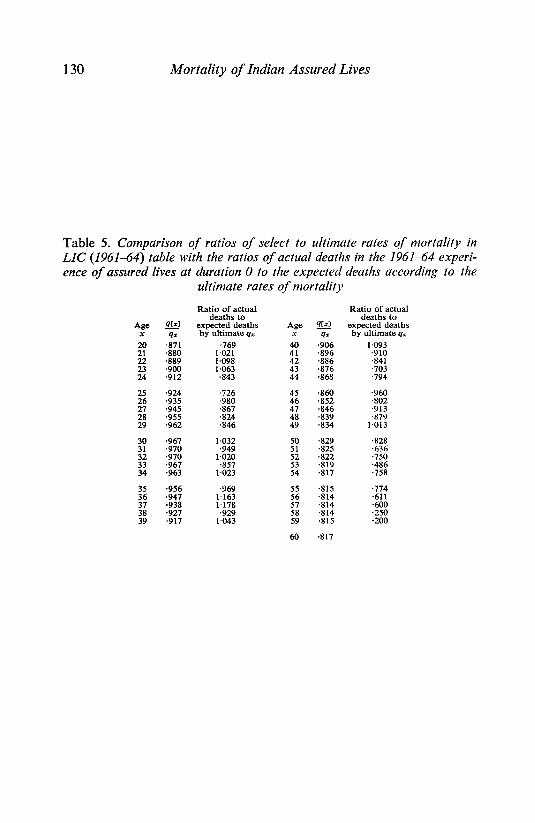
30. The resulting ratios of q[x]/qx are given in Table 5 together with the corresponding ratios of actual deaths to expected deaths according to the graduated rates for durations 1 and over. The ratios gradually increase as the age increases till a maximum of ·970 is reached at age 31 and 32, and thereafter they decrease gradually.
Non-medical business
31. The non-medical business transacted by the corporation comprises the business done under its two schemes-non-medical (general) and non- medical (special). The non-medical (general) scheme provides cover up to a maximum sum assured of Rs.2,000 (since raised to Rs.4,000) and the non-medical (special) scheme, which is applicable to persons in the service of Government and quasi-Government institutions and also well-known commercial organizations, provides cover up to a maximum of Rs.5,000 (since raised to Rs.7,500).
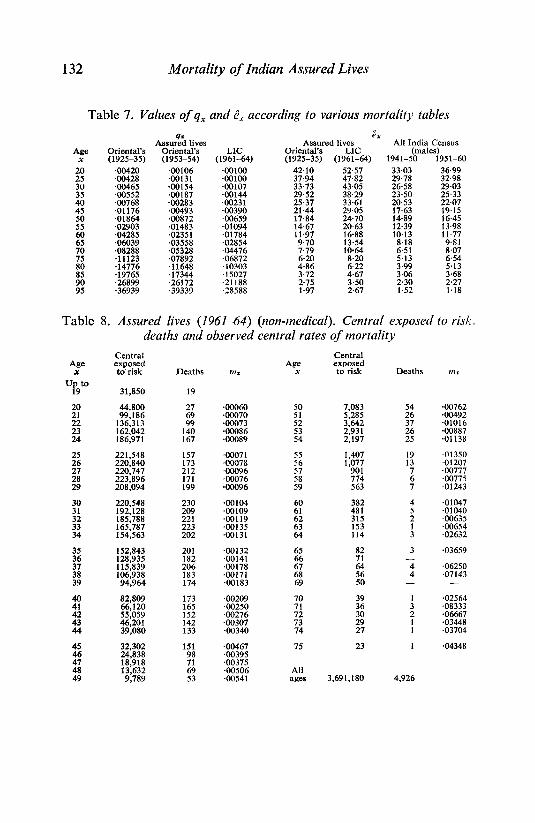
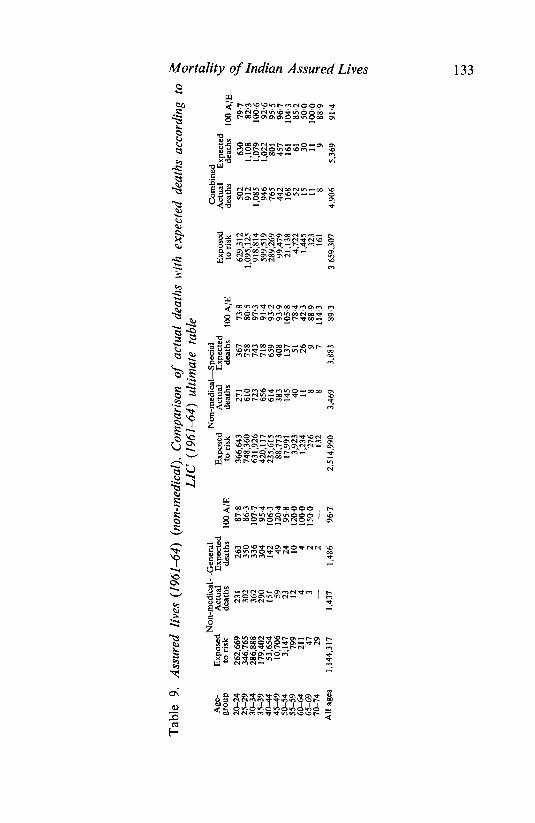
32. The exposed-to-risk, actual deaths and the observed central rates of mortality are given in Table 8 and a comparison of the actual deaths with the expected deaths according to the new LIC (1961-64) ultimate table is given in Table 9 together with separate similar comparisons for non-medical (general) and non-medical (special) schemes. It would be
Mortality of Indian Assured Lives 123
seen from the last three columns of Table 9, that in the combined experi- ence the actual deaths are less than the expected deaths except in the case of age groups 30-34 and 50-54, but the difference is not significant. Whereas on a priori considerations one may expect the non-medical experience to be heavier than or on a par with the medical, it is not expected to be significantly lower. The non-medical experience incidentally gives corroborative evidence of the actual level of ultimate rates as shown in the new main table.
33. So far as the separate experiences under the non-medical (general) scheme and the non-medical (special) scheme are concerned, it is observed that except in certain age-groups the special scheme experience is throughout lighter than that of the general scheme. The actual deaths in the combined non-medical experience are 91·4% of those expected by the standard ultimate table. While this is mainly attributable to the greater concentration of the exposed-to-risk at younger ages and the shorter average duration of policies in the non-medical experience, it will probably be correct to infer that the safeguards adopted by LIC under the non-medical scheme have on the whole proved to be satisfactory.
Mortality experience of female assured lives 34. As compared with the data pertaining to the main table, the quantity
of the data relating to female assured lives is small. This is to be expected in a developing country like India where until recently only a few families in the higher social strata paid any attention to the education of females, and, barring a few professions, there were very few females who had an earned income of their own to feel the need for insurance. The develop- ment of insurance amongst females in India has therefore been rather late and slow. Further, the mortality experience of female lives assured with the Corporation immediately after nationalization, when it was de- cided to accept assurances on female lives on the same terms as male lives, was found to be adverse as compared with that of male lives assured during the same period, resulting in the placing of certain restrictions for acceptance of female lives for insurance. Broadly speaking, female pro- posers are now divided into three categories, namely: (a) women with earned income; (b) women with unearned income, who pay income tax and/or have sizable property likely to attract Estate Duty; and (c) others. Only female lives considered to be on a par with the male lives on account of their educational qualifications and socio-economic status and accepted both before and after the adoption of the new scheme of categorization at ordinary rates on the same terms as male lives are included in the present investigation.
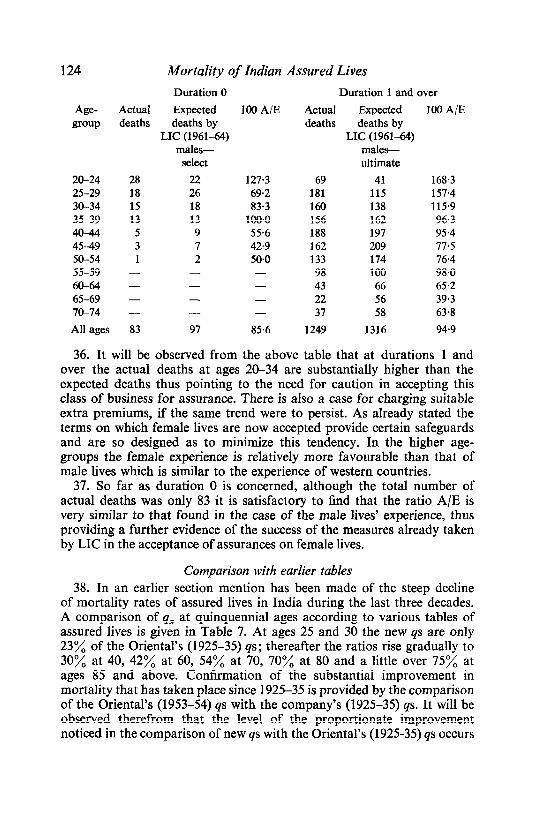
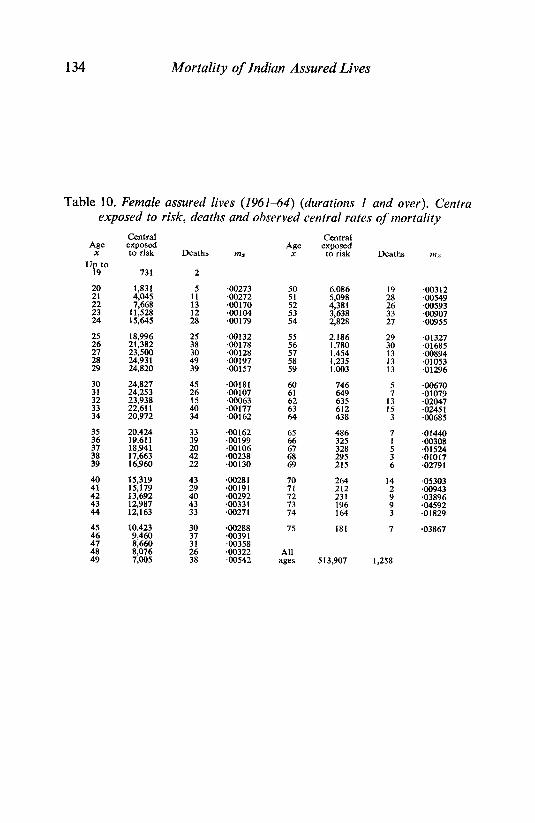
35. In Table 10 are given the exposed to risk, actual deaths and the observed rates of mortality for durations 1 and over. The following table gives a comparison of the actual and expected deaths on the basis of the LIC (1961–64) table:
124 Mortality of Indian Assured Lives
Age-
group
20-24 25-29
30-34 35-39
40-44 45-49 50-54
55-59
60-64 65-69
70-74
All ages
Duration 0
Actual Expected deaths deaths by
LIC (196164) males–
select
28 22 18 26
15 18 13 13
5 9
3 7
1 2
100 A/E
127·3
69·2
83·3 100·0
55·6 42·9 50·0
83 97
— — —
85·6
Duration 1 and over
Actual Expected 100 A/E
deaths deaths by LIC (1961-64)
males— ultimate
69 41 168·3
181 115 157·4 160 138 115·9
156 162 96·3 188 197 95·4 162 209 17·5
133 174 76·4 98 100 98·0
43 66 65·2
22 56 39·3 37 58 63·8
1249 1316 94·9
36· It will be observed from the above table that at durations 1 and over the actual deaths at ages 20–34 are substantially higher than the expected deaths thus pointing to the need for caution in accepting this class of business for assurance. There is also a case for charging suitable extra premiums, if the same trend were to persist. As already stated the terms on which female lives are now accepted provide certain safeguards and are so designed as to minimize this tendency. In the higher age- groups the female experience is relatively more favourable than that of male lives which is similar to the experience of western countries.
37. So far as duration 0 is concerned, although the total number of actual deaths was only 83 it is satisfactory to find that the ratio A/E is very similar to that found in the case of the male lives’ experience, thus providing a further evidence of the success of the measures already taken by LIC in the acceptance of assurances on female lives.
Comparison with earlier tables 38. In an earlier section mention has been made of the steep decline
of mortality rates of assured lives in India during the last three decades. A comparison of qx at quinquennial ages according to various tables of assured lives is given in Table 7. At ages 25 and 30 the new qs are only 23% of the Oriental’s (1925-35) qs; thereafter the ratios rise gradually to 30% at 40, 42% at 60, 54% at 70, 70% at 80 and a little over 75% at ages 85 and above. Confirmation of the substantial improvement in mortality that has taken place since 1925-35 is provided by the comparison of the Oriental’s (1953-54) qs with the company’s (1925-35) qs. It will be observed therefrom that the level of the proportionate improvement noticed in the comparison of new qs with the Oriental’s (1925-35) qs occurs
Mortality of Indian Assured Lives 125
several ages earlier in the case of the 1953––54 qs indicating that the sub- stantial improvement in mortality which had commenced at younger ages is still to expend itself. The progressive improvement shown by the com- parison of these tables is not confined to younger sections only, the pro- portionate reduction in the new qs at advanced ages is, however, much smaller.
39. The resulting effect on the longevity of the assured lives is reflected in the values of ex given in the next section of the table. It will be observed therefrom that new e20 is 25% higher than that by the earlier table. The proportionate increase continuously rises thereafter until it reaches a maximum value of 41% at age 60; above age 65 the improvement shows a gradual reduction until it reaches the level of 26% at age 85. The values of ex according to the All India Census 1951–60 as compared with that for the Census 1941–50 also show substantial improvement during the decennium; the proportionate increase being 12% at age 20, which propor- tionate improvement is again reached at age 55 after falling down to a minimum of 7½% at age 40; thereafter the improvement continues to rise with age and is as much as 29% at age 80. At ages 90 and 95 there is actually a small deterioration instead of an improvement.
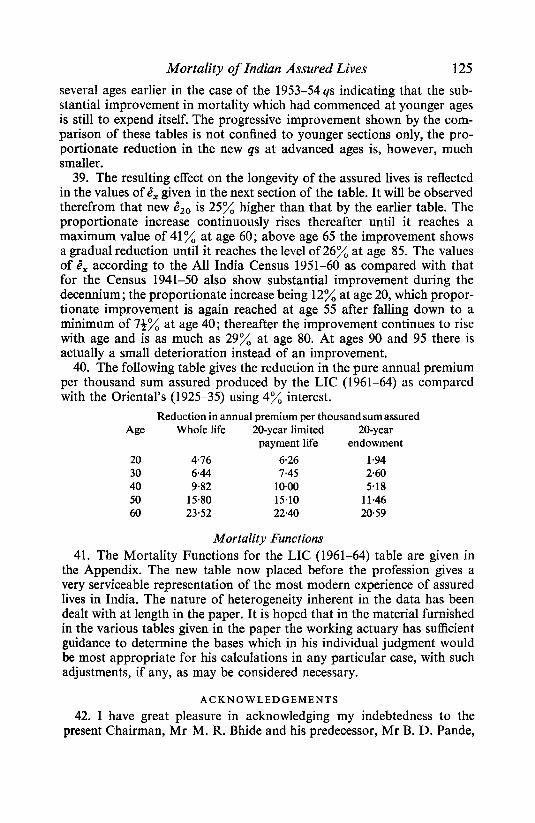
40. The following table gives the reduction in the pure annual premium per thousand sum assured produced by the LIC (1961–64) as compared with the Oriental’s (1925–35) using 4% interest.
Reduction in annual premium per thousand sum assured
Age Whole life 20–year limited 20–year payment life endowment
20 4·16 6·26 1·94 30 6·44 14·5 2·60 40 9·82 10·00 5·18 50 15·80 15·10 11·46 60 23·52 22·40 20·59
Mortality Functions 41. The Mortality Functions for the LIC (1961–64) table are given in
the Appendix. The new table now placed before the profession gives a very serviceable representation of the most modern experience of assured lives in India. The nature of heterogeneity inherent in the data has been dealt with at length in the paper. It is hoped that in the material furnished in the various tables given in the paper the working actuary has sufficient guidance to determine the bases which in his individual judgment would be most appropriate for his calculations in any particular case, with such adjustments, if any, as may be considered necessary.
ACKNOWLEDGEMENTS
42. I have great pleasure in acknowledging my indebtedness to the present Chairman, Mr M. R. Bhide and his predecessor, Mr B. D. Pande,
126 Mortality of Indian Assured Lives
for their encouragement in the preparation of this paper. To the Man- aging Directors, Messrs S. D. Srinivasan and N. V. Nayudu and the Executive Directors, Messrs V. H. Vora and M. V. Sohonie, and other senior colleagues at the Central Office, I am grateful for many helpful suggestions during the progress of the investigation. I am indebted to Messrs A. Rajagopalan, Officer on Special Duty, Ministry of Finance, New Delhi, and C. S. Anantapadmanabhan, Controller of Insurance, for drawing attention to some of the features of the experience at older ages. I also wish to thank all the officers and members of the staff of the Actuarial Departments at the Central and other offices for the care exer- cised by them in the collection of the data and calculations. Lastly, I have to thank my colleagues, Messrs A. S. Raghavan and D. Krishnamoorthy, for assisting me in the supervision of the investigation and the preparation of this paper.
Table 1. Assured lives (1961-64) (durations 3 and over). Exposed to risk, deaths and observed rates of mortality
Age x Up to
19
20 21 22
23 24
25 26 27 28
29
30 31 32 33 34
35 36 37 38 39
40 41 42
43 44
45
46 47 48 49
50 51
52 53 54
Exposed to risk Deaths qx
9,398 15
12,194 23,298 40,552 67,374
116,006
33
81 135
·.00246 ·00142 ·00155 ·0120 ·00116
162,987 142 ·00087 196,776 211 ·00107 228,638 213 ·00093 267,880 246 ·00092 291,048 303 ·00104
303,172 309 ·00102 321,855 353 ·00110 324,501 389 ·00120 360,020 428 ·00119 362,254 465 ·00128
Age x
55 56 57
58 59
60 61 62 63
64
65 66 67 68
69
70 71 72 73
74
75 76
77 78
79
80 81 82
83
84
85–89 90–94
95 and over
374,607 379,588 381,511 399,520 392,235
531 ·00142 529 ·00139 691 ·00181 801 ·00200 796 ·00203
375,402 363,415 343,175 342,542 322,622
854 ·00227 818 ·00225 840 ·00245
1,061 ·00310 1,070 ·00332
310,930 297,515
281,288 272,700
249,797
1,178 ·00379 1,244 ·00418 1,351 ·00480 1,436 ·00527 1,399 ·00560
225,432 1,507 ·00668 206,412 1,493 ·00723 186,258 1,445 ·00776 166,109 1,544 ·00930 141,637 1,427 ·01008
Exposed to risk
118,161 97,316 82,305 70,717 58,006
Deaths qx
1,276 ·01080 1,227 ·01261 1,161 ·01411 1,039 ·01469
899 ·01550
45,491 743 ·01633 35,806 677 ·01891 28,742 613 ·02133 23,626 561 ·02375 18,365 443 ·02412
14,196 389 11,131 330 9,008 283 7,549 270 6,141 260
·02740 ·02965
·03577 .03142
·04234
5,025 226 ·04498 4,170 268 ·06427 3,554 210 ·05909 3,005 185 ·06156 2,493 143 ·05736
2,079 1,726 1,474 1,104
880
125
125 94
75 82
·06013 ·05446 ·08480
·08523
653 493
321 374
273
47
42 44
46 28
·07198 ·08925 ·11230 ·14330 ·10256
1,114 991
755
79 30
4
Mortality of Indian Assured Lives 127
Table 2. Assured lives (1961–64) (durations 1 and over). Percentage of actual to expected deaths on the basis of Oriental’s (1925–35) ultimate table
Age 20 21 22 23 24
25 26 27 28 29
30 31 32
33 34
35 36 37 38 39
40 41 42 43 44
45 46 47 48 49
50 51 52 53 54
Actual deaths
58 96
154 185 237
Expected deaths
182 284 489 734 962
Percentage of actual
to expected deaths 31·9 33·8 31·5 25·2 24·6
Expected deaths 3,619 3,240 2,941 2,688 2,368
233 333 340 361 399
1,181 1,410 1,579 1,701 1,828
753 683 616 561 443
37·8 40·6 43·2 45·0 42·7
426 471 516 552 588
1,880 2,042 2,105 2,266 2,357
634 22 877 929 938
2,462 2,689 2,881 3,059 3,219
Age 55 56 57 58 59
60 61 62 63 64
65 66 67 68 69
70 71 72 73 74
75 76 77 78 79
80 81 82 83 84
All ages
1,001 972
1,032
1,243 1,215
3,307 30·3 3,538 27·5 3,665 28·2 3,837 31·7 3,933 31·6
1,329 1,464 1,580 1,636 1,602
4,093 4,429 4,599 4,692 4,776
47 96 44 77 42 62 46 56 28 51
1,738 4,723 1,691 4,607 1,549 4,437 1,652 4,297 1,516 3,999
19·7 23·6 21·5
21·8 21·2
23·1 22·7
24·5
24·9 24·4
25·7 25·8
30·4 30·4 29·1
32·5 33·1 34·4 34·9 33·5
36·8 36·7 34·9
37·9 38·4
Actual deaths
1,361 1,273 1,201 1,068
928
Percentage of actual
to expected deaths 37·6 39·3 40·8 39·7 39·2
1,991 1,682 1,427 1,247 1,037
389 330 283 270 260
857 718
553 619
479
45·4 46·0 45·7 48·8 54·3
226 416 54·3 268 367 73·0 210 332 63·3 185 298 62·1 143 262 54·6
125
125 94
82 75
231 54·1 203 46·3 184 67·9 146 56·2 123 61·0
49·0 57·1 67·7 82·1 54·9
42·397 126·612 33·5
128 Mortality of Indian Assured Lives
Table 3. Assured lives (1961–64) (durations 0 to 2). Comparison of actual deaths with expected deaths according to corresponding mortality at dur-
ations 3 and over (graduated graphically)
Duration 0 Duration 1 Duration 2 Age A E A E A E 20 20 46 15 32 13 24 21 49 78 38 40 25 31 22 56 72 50 65 41 41 100·0 23 51 63 55 67 49 72 24 43 61 48 59 54 74
25 45 68 51 59 40 66 26 50 53 69 68 53 67 27 39 45 50 53 77 77 100·0 28 42 50 47 48 97·9 68 65 29 33 37 50 53 46 58
30 64 58 42 38 75 63 31 37 36 70 63 48 49 32 52 48 48 39 79 77 33 36 40 59 54 65 50 130·0 34 44 42 45 44 78 66
35 63 63 57 45 46 55 36 57 47 88 69 74 54 137·0 37 53 45 69 53 117 88 38 52 57 54 50 108·0 74 68 39 49 47 64 62 78 61
40 94 82 68 49 79 73 108·2 41 61 63 96·8 89 90 65 60 42 69 78 88·5 67 61 125 107 43 45 61 73·8 81 76 106·6 73 66 110·6 44 54 65 86 64 87 86
45 120 122 73 67 78 74 46 65 79 143 121 77 75
47 73 78 93·6 92 77 137 131 48 94 105 102 75 98 83 49 81 78 122 101 81 80
50 48 57 95 76 136 106 128·3 51 28 44 80 55 118 84 140·5 52 33 45 40 42 64 59 108·2 53 18 38 47·4 54 44 54 44 122·7 54 25 34 43 37 46 47 97·9
55 24 32 36 33 49 40 56 11 19 21 32 25 35 71·4 57 9 15 10 17 30 34 58 3 12
100 A/E
43·5 62·8 77·8 81·0 70·5
66·2 94·3 86·7 84·0 89·2
110·3 102·8 108·3 90·0
104·8
100·0 121·3 117·8 91·2
104·3
114·6
83·1
98·4 82·3
89·5 103·8
84·2 63·6 73·3
73·5
75·0 57·9 60·0 25·0 12 13 17 17
59 2 11 18·2
100 A/E
46·9 95·0 76·9 82·1 81·4
86·4 101·5
94·3
94·3
110·5 111·1 123·1 109·3 102·3
126·7 127·5 130·2
103·2
138·8 98·9
109·8
134·4
109·0 118·2 119·5 136·0 120·8
125·0 145·5 95·2
122·7 116·2
109·1 65·6 58·8 92·3
11 11 100·0 18 13
100 A/E 54·2 80·6
68·1 73·0
60·6 79·1
104·6 79·3
119·0 98·0
102·6
118·2
83·6
133·0 108·8 121·9
108·3 116·8
101·2
105·4 102·7 104·6 118·1 101·3
122·5
88·2 100·0 138·5
Mortality of Indian Assured Lives 129
Table 4. Assured lives (1961–64) (durations 1 and over). Exposed to risk and comparison of actual deaths with expected deaths according to the
ultimate rates of mortality in LIC (1961–64) table
Age 20 21 22 23 24
25 26 27 28 29 30 31 32 33 34
35 36 37 38 39 40 41 42 43 44
45 46 47 48 49 50 51 52 53 54 55 56 57 58 59 60 61
62 63 64 65 66 67 68 69 70 71 72 73 74
75 76 77 78 79
80 81 82 83 84
Exposed to risk
43,279 67,523
116,377 174,400 226,769
275,820 325,579 358,921 380,522 401,820
404,213 428,024
429,509 447,032 446,407
445,959 461,999 464,641 461,331 452,106
430,646 425,755
405,445 389,908 366,550 348,007
344,171 325,493 302,878
280,962
253,379 225,623 198,590 175,806 149,953
124,656 102,730
85,999 72,700 59,433
46,468 36,575 28,950 23,626 18,365
14,196 11,131
9,008 7,549 6,141
5,025 4,170 3,554 3,005 2,493
2,079 1,726 1,474 1,104
880
653 493 374
321 273
1,114 991
58 96
Actual
154
deaths
185 237
233 333 340 361 399
426 471 516 552 588 634
691 877 929 938
1001 972
1032 1215 1243
1329 1464 1580 1636 1602 1738
1691 1549 1652 1516
1361 1273
1201 1068 928
753 683 616
561 443 389 330 283 270 260 226
268 210 185 143 125
94 125
82 75 47
44 42
46 28
79 30
Expected deaths
43 68
116 174 227
276 326
359 388 418
433 475 503 559 594 642 725 799
872 945 995
1090 1151 1232 1287
1357 1494 1569 1620 1669
1670 1647 1607 1573 1485
1364 1241 1146 1069 963 829 718
625 560
478
405 348 309 283 252
225 204 189 174 158
143 129 119 97 84 67
55 45
42 38
194 237
A—E + –
15 28 38 11
10
43 7
19 27 19
7 4
13 7 6 8
34 78
57 7
6 118 119
17 44
28 30
11 16
67 68
44 58
79 31
3 32
55
35
76 35 9
1 35
16 18 26 13
8
1 64
21 11
15 18
35 6
15 9
20 11
3 4
10
115 207
6·6 8·2
10·8 13·2 15·1
16·6 18·1 19·0 19·7 20·5
20·8 21·8 22·4 23·6 24·4
25·3 26·9 28·3
29·5 30·7
31·5 33·0 33·9 35·1 35·9
36·8 38·7 39·6 40·3 40·9
40·9 40·6 40·1 39·7 38·5 36·9
35·2 33·9 32·7 31·0 28·8
26·8 25·0 23·7 21·9
20·1 18·7 17·6 16·8 15·9
15·0 14·3
13·8 13·2 12·6 12·0 11·4 10·9 9·8 9·2
8·2 7·4
6·7 6·5 6·2
A—E
2·29 3·40 3·53 0·83 0·66
2·59 0·39 1·00 1·37 0·93
0·34 0·18 0·58 0·30 0·25
0·32 1·26 2·76 1·93 0·23
0·19 3·57 3·51 0·48 1·23
0·76 0·78 0·28 0·40 1·64
1·66 1·08 1·45 1·99 0·80
0·08 0·91 1·62 0·03 1·13
2·64 1·31 0·36
0·04 1·60 0·80
0·97 1·48 0·77 0·50
0·07 4·48 1·53 0·83 1·19
1·51 3·08 0·55 1·52 0·98
2·44 1·48 0·45 0·62 1·62
85–89 90–94
95 and over 755 All
ages 12, 113, 408
4
42,510
239
43,417
235
130
Age x 20 21
22 23 24
25 26 27 28 29
30 31 32 33 34
35 36 37 38 39
Mortality of Indian Assured Lives
Table 5. Comparison of ratios of select to ultimate rates of mortality in LIC (1961–64) table with the ratios of actual deaths in the 1961–64 experi- ence of assured lives at duration 0 to the expected deaths according to the
ultimate rates of mortality
Ratio of actual deaths to
q[x] qx
expected deaths by ultimate qx
·871 ·769 ·880 1·021
·889 1·098 ·900 1·063 ·912 ·843
·924 ·726 ·935 ·980 ·945 ·867 ·955 ·824 ·962 ·846
·967 1·032 ·970 ·949 ·970 1·020 ·967 ·857 ·963 1·023
·956 ·969 ·947 1·163 ·938 1·178
·927 ·929 ·917 1·043
Age x 40 41 42 43 44
45 46 47 48 49
50 51 52 53 54
55 56 57 58 59
60
Ratio of actual deaths to
q[x] expected deaths qx by ultimate qx
·906 1·093 ·896 ·910 ·886 ·841 ·876 ·703 ·868 ·794
,860 ·960 ·852 ·802 ·846 ·913 ·839 ·879 ·834 1·013
·829 ·828 ·825 ·636 ·822 ·750 ·819 ·486 ·817 ·758
·815 ·774 ·814
·814 ·611 ·600
·814 ·250 ·815 ·200
·817
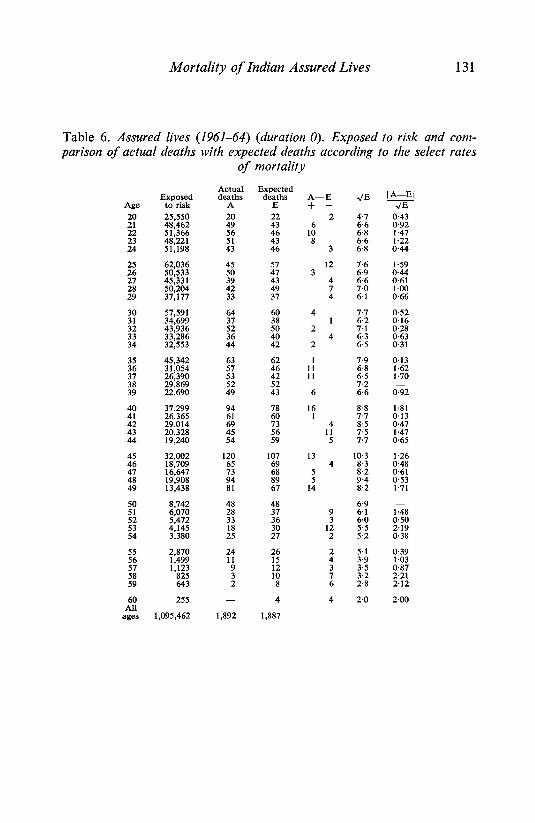
Mortality of Indian Assured Lives 131
Table 6. Assured lives (1961–64) (duration 0). Exposed to risk and com-
parison of actual deaths with expected deaths according to the select rates
of mortality
Actual Expected Exposed deaths deaths A—E
Age to risk A E + – 20 25,550 20 22 2 4·7 0·43 21 48,462 49 43 6 6·6 0·92 22 51,366 56 46 10 6·8 1·47 23 48,221 51 43 8 6·6 1·22 24 51,198 43 46 6·8 6·8 0·44
25 62,036 45 57 12 7·6 1·59 26 50,533 50 47 3 6·9 0·44 27 45,331 39 43 4 6·6 0·61 28 50,204 42 49 7 7·0 1·00 29 37,177 33 37 4 6·1 0·66
30 57,591 64 60 4 7·7 0·52 31 34,699 37 38 1 6·2 0·16 32 43,936 52 50 2 7·1 0·28 33 33,286 36 40 4 6·3 0·63 34 32,553 44 42 2 6·5 0·31
35 45,342 63 62 1 7·9 0·13 36 31,054 57 46 11 6·8 1·62 37 26,390 53 42 11 6·5 1·70 38 29,869 52 52 7·2 — 39 22,690 49 43 6 6·6 0·92
40 37,299 94 78 16 8·8 1·81 41 26,365 61 60 1 7·7 0·13 42 29,014 69 73 4 8·5 0·47 43 20,328 45 56 11 7·5 1·47 44 19,240 54 59 5 7·7 0·65
45 32,002 120 107 13 10·3 1·26 46 18,709 65 69 4 8·3 0·48 47 16,647 73 68 5 8·2 0·61 48 19,908 94 89 5 9·4 0·53 49 13,438 81 67 14 8·2 1·71
50 8,742 48 48 6·9 — 51 6,070 28 37 9 6·1 1·48 52 5,472 33 36 3 6·0 0·50 53 4,145 18 30 12 5·5 2·19 54 3,380 25 27 2 5·2 0·38
55 24 26 2,870 2 5·1 0·39 56 1,499 11 15 4 3·9 1·03 57 1,123 9 12 3 3·5 0·87 58 825 3 10 7 3·2 2·21
59 643 2 8 6 2·8 2·12
60 255 — 4 4 2·0 2·00 All
ages 1,095,462 1,892 1,887
132 Mortality of Indian Assured Lives
Table 7. Values of qx and x according to various mortality tables
qx Assured lives Assured lives All India Census
Age Oriental's Oriental's LIC Oriental's LIC (males) x (1925–35) (1953–54) (1961–64) (1925–35) (1961–64) 1941–50 1951–60
20 ·00420 ·00106 ·00100 42·10 52·57 33·03 36·99 25 ·00428 ·00131 ·00100 37·94 47·82 29·78 32·98 30 ·00465 ·00154 ·00107 33·73 43·05 26·58 29·03 35 ·00552 ·00187 ·00144 29·52 38·29 23·50 25·33 40 ·00768 ·00283 ·00231 25·37 33·61 20·53 22·07 45 ·01176 ·00493 ·00390 21·44 29·05 17·63 19·15 50 ·01864 ·00872 ·00659 17·84 24·70 14·89 16·45 55 ·02903 ·01483 ·01094 14·67 20·63 12·39 13·98 60 ·04285 ·02351 ·01784 11·97 16·88 10·13 11·77 65 ·06039 ·03558 ·02854 9·70 13·54 8·18 9·81 70 ·08288 ·05328 ·04476 7·79 10·64 6·51 8·07 75 ·11123 ·07892 ·06872 6·20 8·20 5·13 6·54 80 ·14776 ·11648 ·10303 4·86 6·22 3·99 5·13 85 ·19765 ·17344 ·15027 3·72 4·67 3·06 3·68 90 ·26899 ·26172 ·21188 2·75 3·50 2·30 2·27 95 ·36939 ·39339 ·28588 1·97 2·67 1·52 1·18
Table 8. Assured lives (1961–64) ( non-medical). Central exposed to risk.
deaths and observed central rates of mortality
Central Central Age exposed Age exposed
x to risk Deaths mx x to risk Deaths mx Up to
19 31,850 19
20 44,800 27 ·00060 50 7,083 54 ·00762 21 99,186 69 ·00070 51 5,285 26 ·00492 22 136,313 99 ·00073 52 3,642 37 ·01016 23 162,042 140 ·00086 53 2,931 26 ·00887 24 186,971 167 ·00089 54 2,197 25 ·01138
25 221,548 157 ·00071 55 1,407 19 ·01350 26 220,840 173 ·00078 56 1,077 13 ·01207 27 220,747 212 ·00096 57 901 7 ·00777 28 223,896 171 ·00076 58 774 6 ·00775 29 208,094 199 ·00096 59 563 7 ·01243
30 220,548 230 ·00104 60 4 ·01047 31 192,128 209 ·00109 61 5 ·01040 32 185,788 221 ·00119 62 2 ·00635 33 165,787 223 ·00135 63 1 ·00654
34 154,563 202 ·00131 64 3 ·02632
35 152,843 201 ·00132 65 3 ·03659 36 128,935 182 ·00141 66 — 37 115,839 206 ·00178 67 4 ·06250 38 106,938 183 ·00171 68 4 ·07143 39 94,964 174 ·00183 69 — —
40 82,809 173 ·00209 70 ·02564 41 66,120 165 ·00250 71 ·08333 42 55,059 152 ·00276 72 ·06667 43 46,201 142 ·00307 73 ·03448 44 39,080 133 ·00340 74 ·03704
45 32,302 151 ·00467 75 ·04348 46 24,838 98 ·00395 47 18,918 71 ·00375 48 13,632 69 ·00506 All 49 9,789 53 ·00541 ages 3,691,180 4,926
Mortality of Indian Assured Lives 133
134 Mortality of Indian Assured Lives
Deaths
Table 10. Female assured lives (1961–64) (durations 1 and over). Centra
exposed to risk, deaths and observed central rates of mortality
Age x
Up to 19
20 21 22
23 24
25 26 27 28 29
30 31 32 33 34
35 36 37 38 39
40 41 42 43 44
45 46 47
48 49
Central exposed to risk Deaths mx mx
731 2
1,831 5 4,045 11
7,668 13 11,528 12 15,645 28
18,996 25 21,382 38 23,500 30 24,931 49 24,820 39
24,827 45 24,253 23,938
45 15
22,611 40 20,972 34 20,424 33 19,611 39 18,941 20 17,663 16,960
42 22
15,319 43 15,179 29 13,692 40 12,987 43 12,163 33
10,423 30 9,460 37 8,660 8,076
31 26
7,005 38
·00273 ·00272 ·0170 ·00104 ·0179
19 28 26 33 27
·00178 ·00132
·00128 ·00197 ·00157
·00181 ·00107 ·00063 ·0177 ·00162
60 61 62 63
64
65 66 67 68 69
5 ·00670 7 ·01079
13 ·02047 15 ·02451 3 ·00685
·00162 ·00199 ·00106 ·00238 ·0130
7 1 5
3 6
·00191 ·00281
·00292 ·00331 ·00271
·00288 ·00391 ·00358 ·00322 ·00542
Age x
50 51 52 53 54
55 56
58 57
59
70 71 72 73 74
75
All ages
Central exposed to risk
6,086 5,098 4,381 3,638 2,828
2,186 1,780 1,454 1,235 1,003
29 30 13 13 13
746 649 635 612 438
486 325 328 295 215
264 212 231 196 164
181
14 2 9 9 3
7
513,907 1,258
·00312 ·00549 ·00593 ·00907 ·00955
·01327 ·01685 ·00894 ·01053 ,01296
·00308 ·01440
·01524 ·01017 ·02791
·05303 ·00943 ·03896
·01829 ·04592
·03867
Mortality of Indian Assured Lives 135
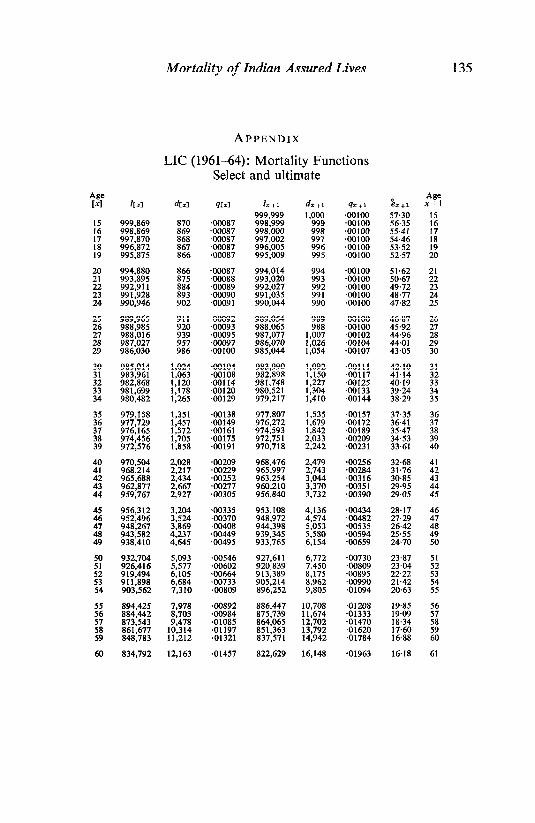
APPENDIX
LIC (1961–64): Mortality Functions
Select and ultimate
Age Age [x] l[x] d[x] q[x] lx+1 dx+1 qx+1 x+1 x+1
999,999 1,000 ·00100 57·30 15 15 999,869 870 ·00087 998,999 999 ·00100 56·35 16 16 998,869 869 ·00087 998,000 998 ·00100 55·41 17 17 997,870 868 ·00087 997,002 997 ·00100 54·46 18 18 996,872 867 ·00087 996·005 996 ·00100 53·52 19 19 995,875 866 ·00087 995·009 995 ·00100 52·57 20
20 994,880 866 ·00087 994,014 994 ·00100 51·62 21 21 993,895 875 ·00088 993,020 993 ·00100 50·67 22 22 992,911 884 ·00089 992,027 992 ·00100 49·72 23 23 991,928 893 ·00090 991,035 991 ·00100 48·77 24 24 990,946 902 ·00091 990,044 990 ·00100 47·82 25
25 989,965 911 ·00092 989,054 989 ·00100 46·87 26 26 988,985 920 ·00093 988,065 988 ·00100 45·92 27 27 988,016 939 ·00095 987,077 1,007 ·00102 44·96 28 28 987,027 957 ·00097 986,070 1,026 ·00104 44·01 29 29 986,030 986 ·00100 985,044 1,054 ·00107 43·05 30
30 985,014 1,024 ·00104 983,990 1,092 ·00111 42·10 31 31 983,961 1,063 ·00108 982,898 1,150 ·00117 41·14 32 32 982,868 1,120 ·00114 981,748 1,227 ·00125 40·19 33 33 981,699 1,178 ·00120 980,521 1,304 ·00133 39·24 34 34 980,482 1,265 ·00129 979,217 1,410 ·00144 38·29 35
35 979,158 1,351 ·00138 977,807 1,535 ·00157 37·35 36 36 977,729 1,457 ·00149 976,272 1,679 ·00172 36·41 37 37 976,165 1,572 ·00161 974,593 1,842 ·00189 35·47 38 38 974,456 1,705 ·00175 972,751 2,033 ·00209 34·53 39 39 972,576 1,858 ·00191 970,718 2,242 ·00231 33·61 40
40 970,504 2,028 ·00209 968,476 2,479 ·00256 32·68 41 41 968,214 2,217 ·00229 965,997 2,743 ·00284 31·76 42 42 965,688 2,434 ·00252 963,254 3,044 ·00316 30·85 43 43 962,877 2,667 ·00277 960,210 3,370 ·00351 29·95 44 44 959,767 2,927 ·00305 956,840 3,732 ·00390 29·05 45
45 956,312 3,204 ·00335 953,108 4,136 ·00434 28·17 46 46 952,496 3,524 ·00370 948,972 4,574 ·00482 27·29 47 47 948,267 3,869 ·00408 944,398 5,053 ·00535 26·42 48 48 943,582 4,237 ·00449 939,345 5,580 ·00594 25·55 49 49 938,410 4,645 ·00495 933,765 6,154 ·00659 24·70 50
50 932,704 5,093 ·00546 927,611 6,772 ·00730 23·87 51 51 926,416 5,577 ·00602 920,839 7,450 ·00809 23·04 52 52 919,494 6,105 ·00664 913,389 8,175 ·00895 22·22 53 53 911,898 6,684 ·00733 905,214 8,962 ·00990 21·42 54 54 903,562 7,310 ·00809 896,252 9,805 ·01094 20·63 55
55 894,425 7,978 ·00892 886,447 10,708 ·01208 19·85 56 56 884,442 8,703 ·00984 875,739 11,674 ·01333 19·09 57 57 873,543 9,478 ·01085 864,065 12,702 ·01470 18·34 58 58 861,677 10,314 ·01197 851,363 13,792 ·01620 17·60 59 59 848,783 11,212 ·01321 837,571 14,942 ·01784 16·88 60
60 834,792 12,163 ·01457 822,629 16,148 ·01963 16·18 61
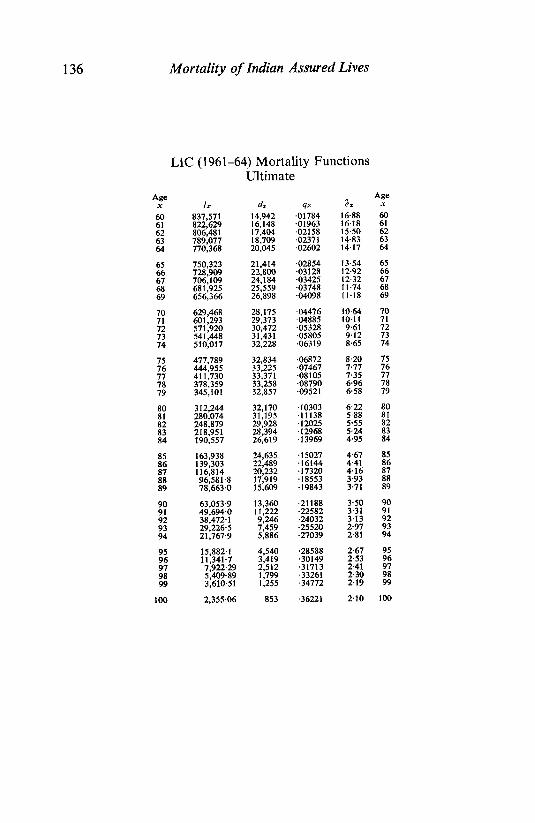
136 Mortality of Indian Assured Lives
Age Age
x lx x
60 837,571 60 61 822,629 61 62 806,481 62 63 789,077 63 64 770,368 64
65 750,323 ·02854 65 66 728,909 ·03128 66
67 706,109 ·03425 67 68 681,928 ·3748 68 69 656,366 ·04098 69
70 28,175 70 71 29,373 71
72 30,472 72 73 31,431 73 74 32,228 74
75 ·6872 8·20 75
76 ·7467 7·77 76 77 ·08105 7·35 77 78 ·08790 6·96 78 79 ·09521 6·58 79
80 32,170 6·22 80 81 31,195 5·88 81
82 29,928 5·5 82 83 28,394 5·24 83 84 26,619 4·95 84
85 85 86 86
87 87 88 88
89 89
90 ·21188 90
91 ·22582 91
92 ·24032 92
93 ·25520 93 94 ·27039 94
95 95
96 96 97 97 98 98 99 99
100
dx qx 14,942 ·01784 16,148 ·01963 17,404 ·02158 18,709 ·02371 20,045 ·02602
16·88 16·18 15·50 14·83
14·17
21,414 22,800 24,184
25,559 26,898
13·54 12·92 12·32 11·74 11·18
629,468 601,293
571,920 541,448 510,017
·04476 ·04885 ·05328
·05805 ·6319
10·64
10·11 9·12 8·65
477,789 444,955 411,730 378,359
345,101
32,834 33,225 33,371 33,258 32,857
312,244 280,074
248,879 218,951 190,557
·10303
·12025 ·11138
·12968 ·13969
163,938 139,303 116,814 96,581·8 78,663·0
24,635 22,489 20,232 17,919 15·609
·15027 ·16144
·17320 ·18553 ·19843
4·67 4·41 4·16
3·71
63,053·9 13,360 49,694·0 11,222 38·472·1 9,246 29,226·5 7,459 21,767·9 5,886
3·50 3·31 3·13 2·91 2·81
15,882·1 11,341·7 7,922·29
3,610·51
4,540 3,419 2,512 1,799 1,255
·28588 ·30149
·33261 ·31713
·34772
2·67 2·53 2·41 2·30 2·19
2·355·06 853 ·36221 2·10 100
LIC (1961–64) Mortality Functions
Ultimate