Embed Size (px)
Citation preview

58
CHAPTER # 3
METHODOLOGY
59
METHODOLOGY
Any chemical analysis demands reliability in terms of experimental results. The accuracy of
results depends upon following the correct procedures. Standard Procedures are followed to
ensure proper results with a minimum of errors.
During the course of this work, data obtained from the samples was, analysed for certain critical
parameters which help to ascertain the levels of pollution in the sample water. The particulars of
such parameters, the scientific principles involved, the procedure of experimentation, the regents
used and the calculations performed for arriving at the results for each parameter , is given in the
following pages.
The water samples for this purpose were taken from selected stations (S1, S2, S3 & S4).
Photographs of each sampling point along the Mithi River are attached. The work of collection
of samples was done during the different seasons viz. pre-monsoon, monsoon and post monsoon.
The present study was carried out on River “Mithi” which flows through the heart of Mumbai
City. It originates in the hills of SGNP (East) and then flows through Vihar, Powai lakes and
along its course proceeds to its destination in the “Mahim Bay”. The aggregate length of the
River from its origin to its destination where it meets the sea is around 18 Kms. The work of
sampling and other related issues was carried out over a period of 12 months; commencing in
October 2011 and ending in September 2012. The aforesaid work comprised of both – a review
of physiochemical parameters as well as bacteriological parameters. Parameters like, pH,
Electrical Conductivity (EC), turbidity, Dissolved Oxygen (D.O.), Biochemical Oxygen Demand
(BOD), Chemical Oxygen Demand (COD), Total Hardness (TH), Total Alkalinity (TAK), NO32-,
PO43-, Chlorides were ascertained on the basis of samples. In addition, presence of “Heavy
Metals”, such as Arsenic (As), Lead (Pb), Cadmium (Cd), Mercury (Hg), Chromium (Cr) etc.
have also been covered. Fecal Coliform and Total Colifrom as well as Total Bacterial have been
studied. The physicochemical parameter were analysed by standard methods prescribed by
APHA (2005) for analysis of quality of water.
The sampling points on the course followed by the Mithi River from its starting points near
Powai Lake to the point where it meets the Arabian Sea were selected on the basis of a pre
60
sampling investigation carried out along the course of the river. The intention behind undertaking
such a process was to identify points where the level of pollution was very high. After
identifying such points, samples were drawn as per plans at such sampling points. At the mouth
of the river – its width is narrow at the place of its origination; but it increases as the river flows
along its course towards its destination. Near the Sea, the river is 100 feet wide. The region
through which the river flows is surrounded by dense population levels, large number of
residential complexes and slums (including Dharavi slum). Also several commercial activities –
both authorized and unauthorized are carried out on lands adjacent to its banks. A few
unauthorized works are - scrap dealers, oil/paint drum cleaners, cattle shed etc. Some of the
polluting units have been closed by the action of the various authorities. A large quantity of
waste water, sewage etc. is discharged into the river. The wastes also contain treated/untreated
industrial effluents which carry a number of chemicals and toxic metals. Raw sewage leads to
organic pollution. The Mithi River therefore acts as a carrier or a drainage channel of waste
water, sewage and other industrial effluents from a very densely populated area to the Arabian
Sea. The high level of pollution also affects the lives of the people staying near the river.
Different kind of infections and diseases are spread due to the unclean environment. The river
water seeping through the ground may contaminate drinking water.
The heavy deposition of silt from the waste water/ sewage and industrial effluents has
considerably narrowed the river bed and the depth of the river. As a result, during the deluge in
Mumbai in July 2005, there was heavy flooding in the areas surrounding the river and many
people lost their life. Thereafter the Authorities have made efforts to enhance the depth of the
river bed by removing the accumulated silt/ wastes. Efforts to beautify the areas near the river
are being made. Highly polluting industries have been ordered to be shut down.
To study the levels of pollution the following sampling points have been selected. (Photographs
of Mithi River from each of these points are attached page 62-65.)
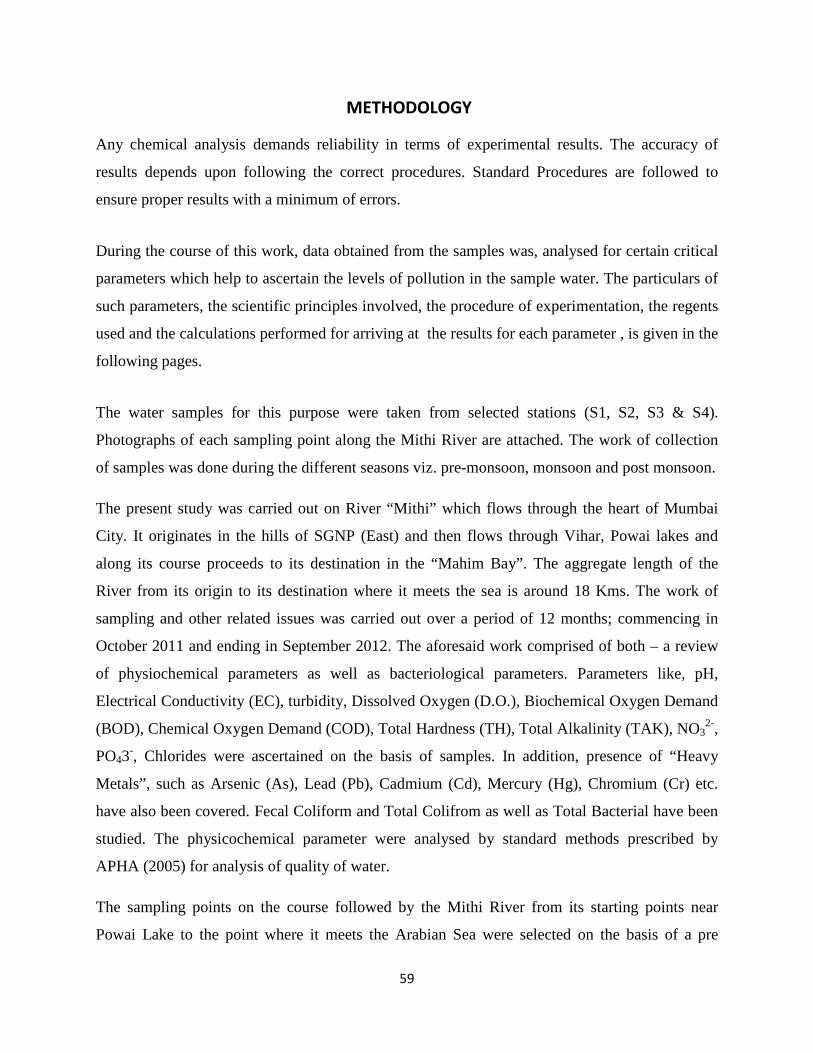
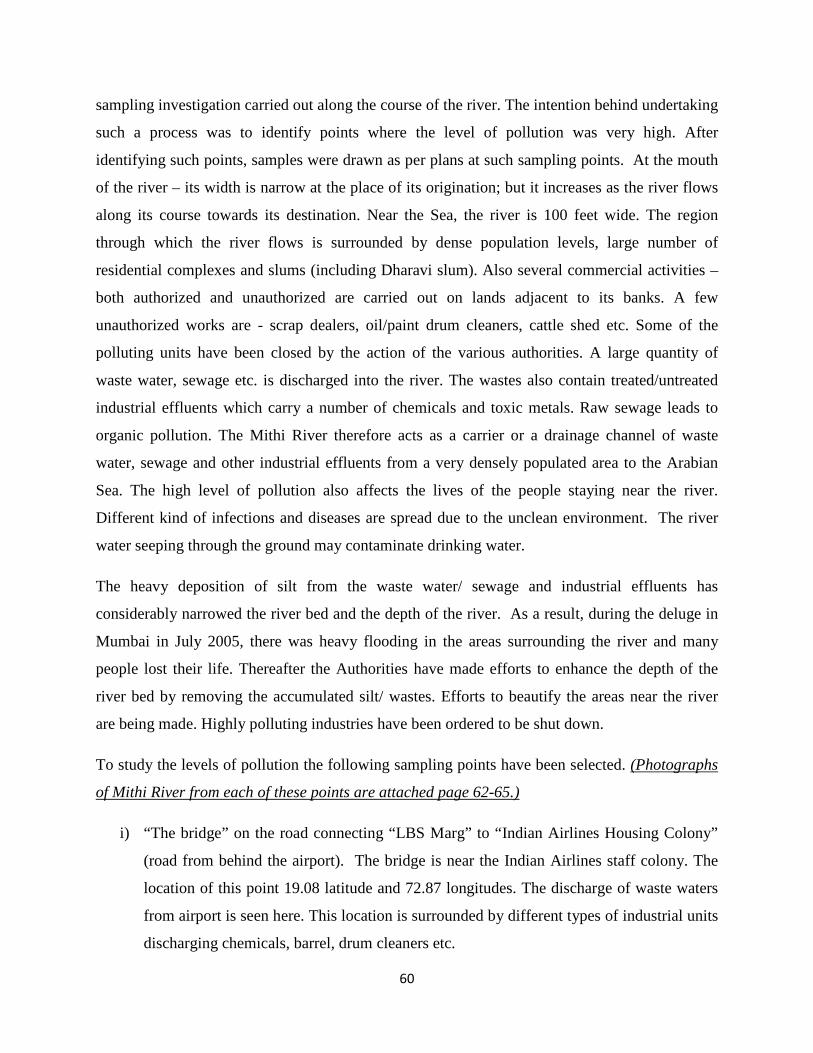
i) “The bridge” on the road connecting “LBS Marg” to “Indian Airlines Housing Colony”
(road from behind the airport). The bridge is near the Indian Airlines staff colony. The
location of this point 19.08 latitude and 72.87 longitudes. The discharge of waste waters
from airport is seen here. This location is surrounded by different types of industrial units
discharging chemicals, barrel, drum cleaners etc.
61
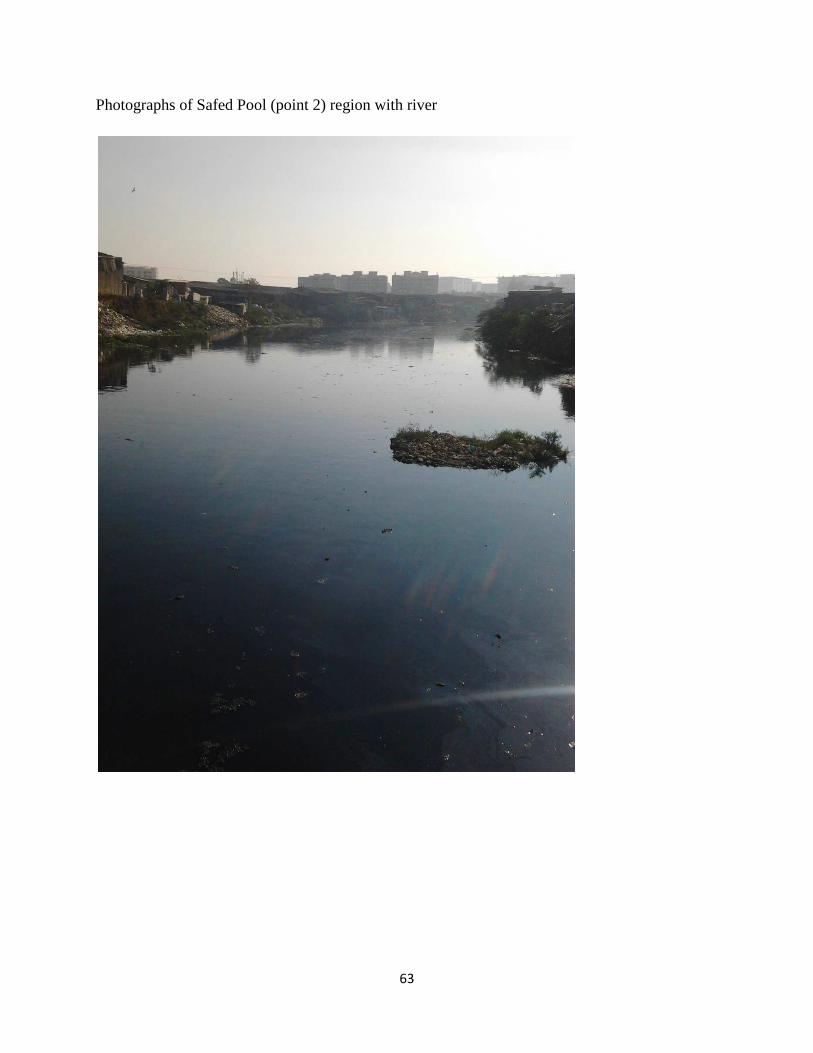
ii) Safed Pool. This place is surrounded by industrial units (mostly authorized). The co-
ordinates of this point is 19.09 latitude and 72 .88 longitude.
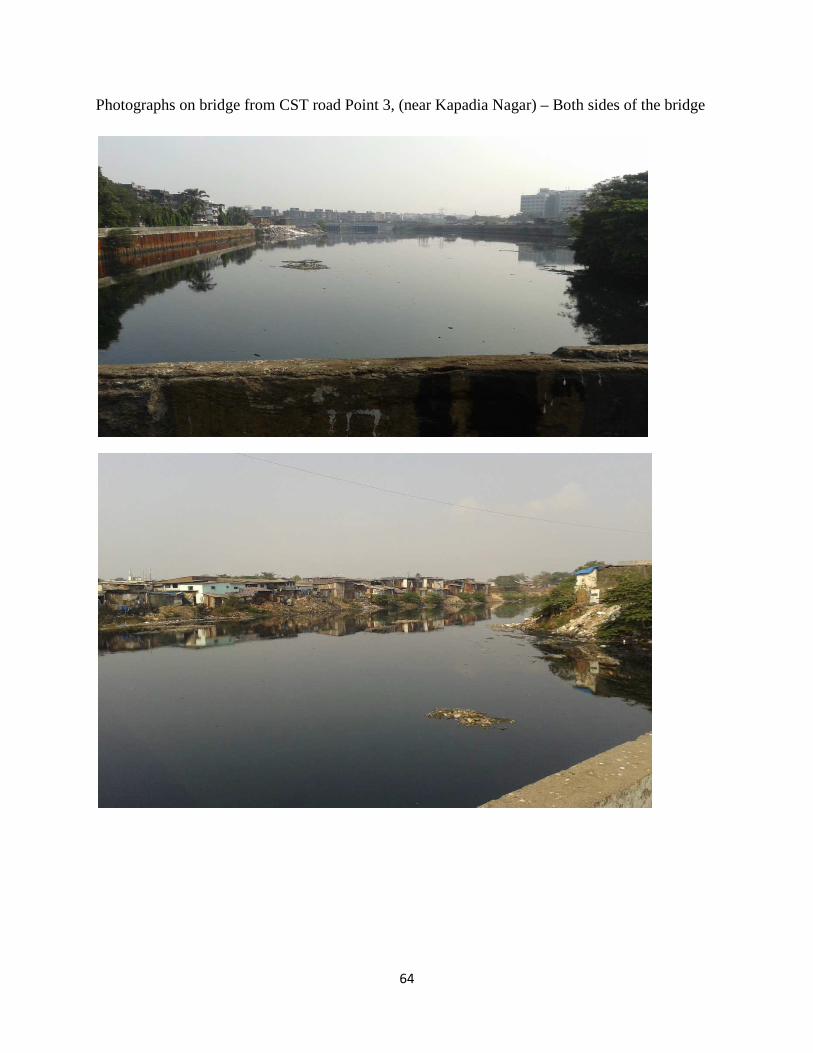
iii) The bridge on CST road near Kapadia Nagar. There are many small industrial units, scrap
dealers etc. A Thickly populated area. The coordinates of this location are latitude 19.07
and 72.88 longitude.
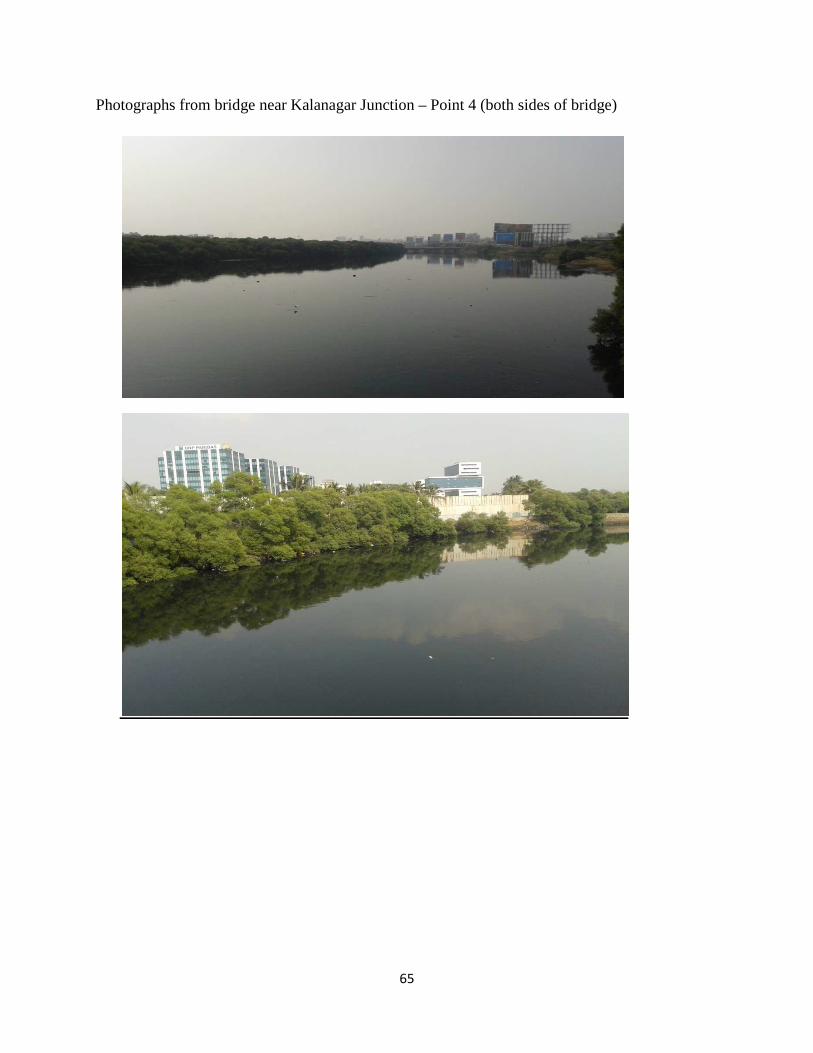
iv) Bridge near Kalanagar (bridge near Junction of “Bandra Kurla road’- with “Dharavi
Road”). The co-ordinates of this point are latitude 19.054 and 72.85 longitude. This is
the place near the final meeting place of the river with the sea. All the wastes discharged
into the river at the earlier points increase the concentration of harmful chemicals and
metals at this point. The Mahim Sanctuary, where birds of various species come for
nesting is near by. The pollution levels here have to be controlled and kept low – to avoid
damage to a precious eco-system.
62
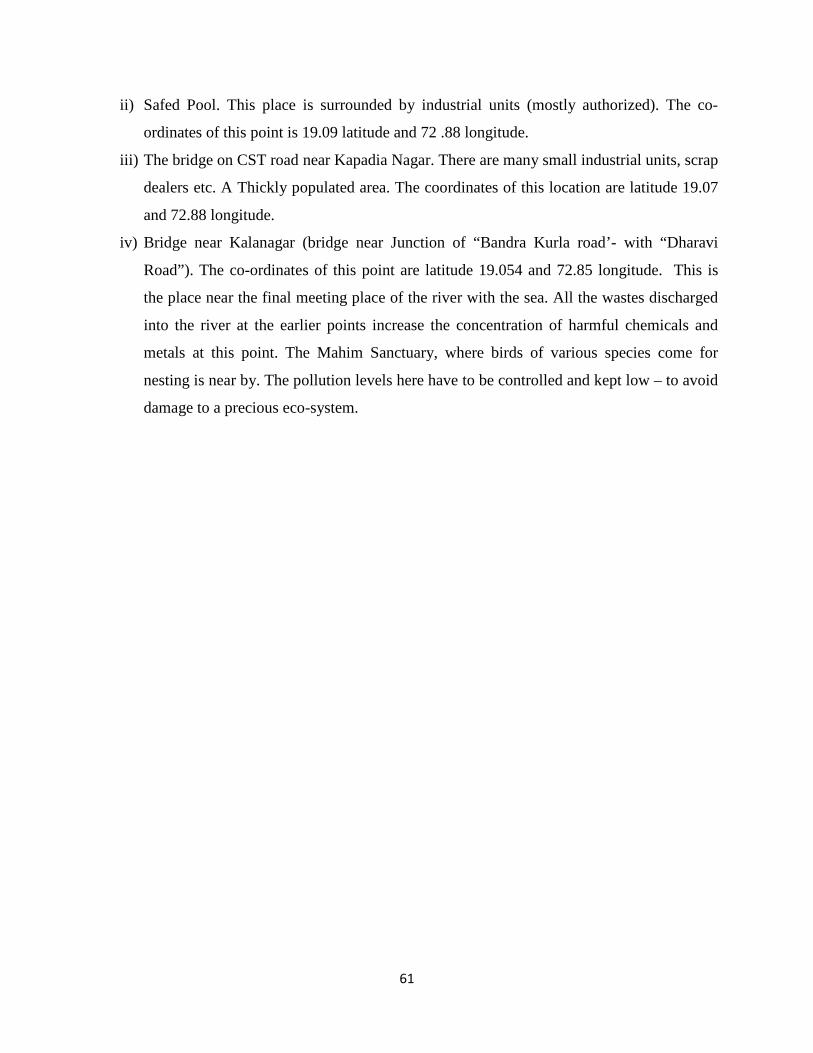
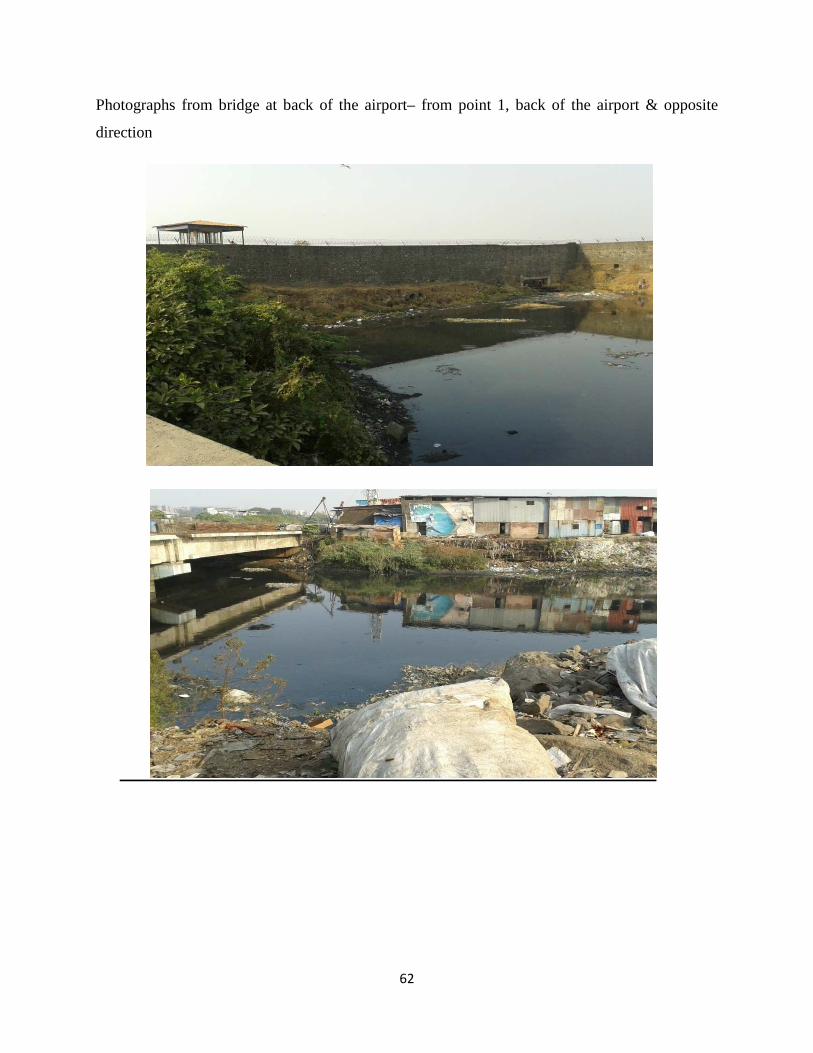
Photographs from bridge at back of the airport– from point 1, back of the airport & opposite
direction
63
Photographs of Safed Pool (point 2) region with river
64
Photographs on bridge from CST road Point 3, (near Kapadia Nagar) – Both sides of the bridge
65
Photographs from bridge near Kalanagar Junction – Point 4 (both sides of bridge)
66
Climatic factors in the Mithi region:
The region through which the river flows lies in the heart of Mumbai “Metropolis” and is
quite near the Arabian Sea. The Mithi River flows within a geographical region covered by
18o 53’ North to 19 o 16’ North latitude and from 72o 00’ east to 72o 59’ east longitude –
(Source Internet). The region receives a heavy rainfall, measuring 2100 – 2200 mm (on an
average basis). Month wise distribution of rainfall around Mithi region –
- 95 % mostly falls in the period June to September.
- 70% mostly falls in the months July & August
- 50 % of this occurs in just 2 to 3 events
On an average basis, the minimum and the maximum temperature recorded year wise varies
between 16 oC to 40oC. Normally, the temperature is near the mean with extremes being
reached for short periods in summer and winter. The region has a humid climate, with
relative humidity ranging between 55 % to 86 %.
Geographical spread of Mithi River (By NEERI report – Top Sheet No. 47 A /16)
- 19o 00’ to 19o 15’ North Latitude
- 72o 45’ 10 72o73’ East Longitude.
Quality Control - Quality Assurance:
The polythene bottles used for collection of sample water were clean, free from dust, heavy
metals as well as free from organic matter. In order to avoid contamination while transporting
from sampling station to laboratory bottles were sealed with paraffin wax. Samples drawn for
bacterial analysis were kept at a very low temperature (4 - 6 o C). Suitable refrigeration facilities
were used to avoid bacterial multiplication during transportation from sampling station to test
laboratory. All glassware were washed properly, soaked in acid bath overnight, washed in the
morning and rinsed with distilled water.
67
Regents used for chemical analysis, are to be taken from analytical grade. Accuracy of the
regents was checked by taking a blank reading.
Water Sampling ( including sample preparation process):
The importance of physicochemical investigation is determined by the sampling programme
being followed. A sample should be representive of the various features in the population. To
ensure this, the principles of random sampling need to be followed strictly.
Collection of water samples is done randomly, twice in the morning and evenings, two times in a
week from the four locations selected on the course of the “Mithi River”. The samples drawn in
different seasons, over a period of one year, were analyzed. Two types of Polythene bottles were
used for collection of water samples (grab) – i) two and half litres and ii) two litres. In order to
remove any contamination due to previous use, firstly acid bath (HCl) was used to soak the
bottles to clean them; further they were washed/rinsed with normal water to ensure that traces of
acids, if any, are removed. Then they were washed with distilled water. Thereafter, at the time of
taking the samples, again the sample water is used to wash the bottles. The concerned water
sample is then collected form the pre-determined sampling point; without leaving much air gap.
Paraffin Wax is then used to seal the sample bottle. Relevant particulars such as date are written
on the sample bottle.
Sample for heavy metal analysis
Water samples are collected in the same manner, a 500 ml sample is acidified with concentrated
HNO3 (A.R.) to prevent precipitation of metals.
Physico-chemical analysis of sample water
Parameters like temperature, pH, E.C., D.O. were immediately measured after collecting the
sample. D.O. is measured by Winkler’s Method (azide modification), was immediately fixed by
adding manganese sulphate and alkaline iodide-azide solution. In case of samples collected for
bacteriological examination, the bottle was kept in an ice box to keep it cool (4 to 6) oC and
avoid bacterial multiplication during transport. Analysis of samples for other physicochemical
parameters was done as early as possible within 48 hours of sample collection.
68
Analysis of Heavy Metal (using atomic absorption spectrophotometer (AAS)).
The presence and levels of metals is easily and satisfactorily determined by AAS (AAS 7000).
After pretreatment of the sample, the levels of the metals in the sample are determined by direct
aspiration of the sample in the specified flame and by setting of the appropriate wavelengths,
using ‘Holious’ cathode lamp. Instructions of the manufacturer are followed.
Procedure for preparation of the sample: A 50 cm3 of selected sample water was taken and 25
cm3 of concentrated HNO3 was added to it. The samples were kept overnight for digestion. The
digested samples were dried till evaporation and 4 cm3 perchloric acids were added to it. The
samples were then concentrated to half. These samples were filtered into 50.0 cm3 standard
volume flask using Whatman No. 41 filter paper. The volume was made up to the mark using de-
ionized water. After this, the respective element is determined by directly aspirating the sample
in the specified flame and setting appropriate wavelengths.
A calibration curve is prepared by using standard solutions of elements to be analysed. Mercury
(Hg) was analysed with cold vapour atomic absorption spectroscopy. Arsenic (As) is determined
with hydride generation, coupled with atomic absorption spectrophotometer.
69
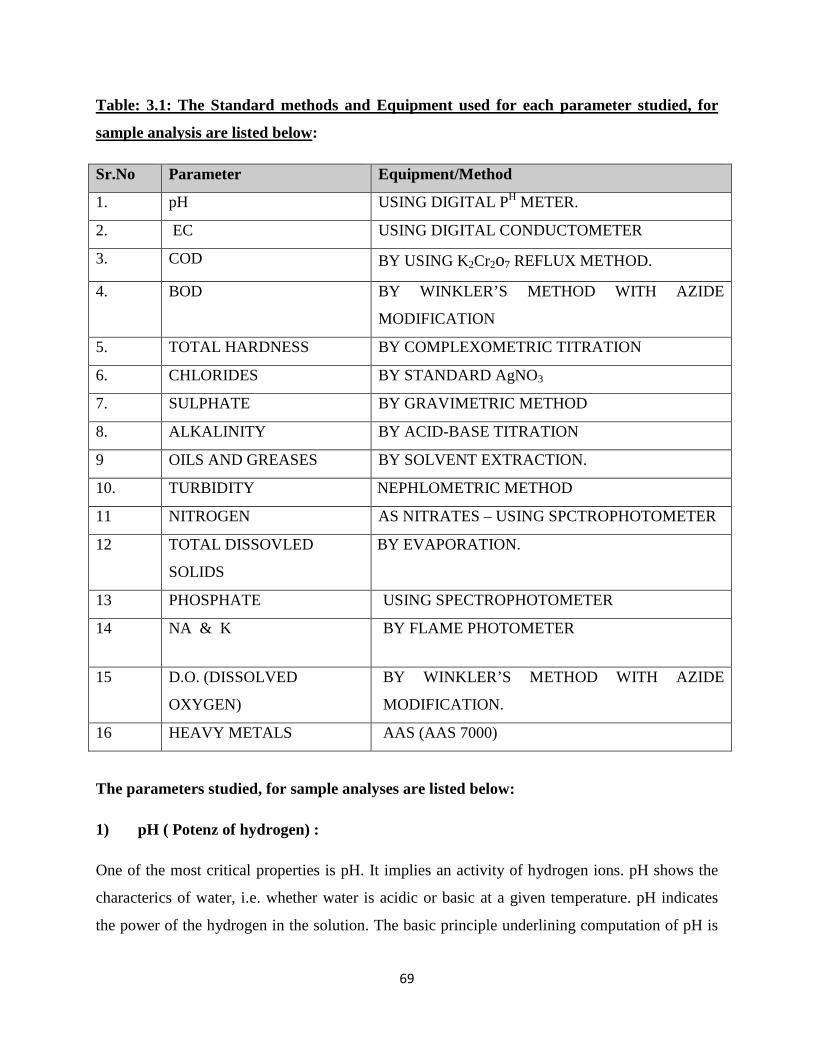
Table: 3.1: The Standard methods and Equipment used for each parameter studied, for
sample analysis are listed below:
Sr.No Parameter Equipment/Method
1. pH USING DIGITAL PH METER.
2. EC USING DIGITAL CONDUCTOMETER
3. COD BY USING K2Cr2o7 REFLUX METHOD.
4. BOD BY WINKLER’S METHOD WITH AZIDE
MODIFICATION
5. TOTAL HARDNESS BY COMPLEXOMETRIC TITRATION
6. CHLORIDES BY STANDARD AgNO3
7. SULPHATE BY GRAVIMETRIC METHOD
8. ALKALINITY BY ACID-BASE TITRATION
9 OILS AND GREASES BY SOLVENT EXTRACTION.
10. TURBIDITY NEPHLOMETRIC METHOD
11 NITROGEN AS NITRATES – USING SPCTROPHOTOMETER
12 TOTAL DISSOVLED
SOLIDS
BY EVAPORATION.
13 PHOSPHATE USING SPECTROPHOTOMETER
14 NA & K BY FLAME PHOTOMETER
15 D.O. (DISSOLVED
OXYGEN)
BY WINKLER’S METHOD WITH AZIDE
MODIFICATION.
16 HEAVY METALS AAS (AAS 7000)
The parameters studied, for sample analyses are listed below:
1) pH ( Potenz of hydrogen) :
One of the most critical properties is pH. It implies an activity of hydrogen ions. pH shows the
characterics of water, i.e. whether water is acidic or basic at a given temperature. pH indicates
the power of the hydrogen in the solution. The basic principle underlining computation of pH is
70
the quantification of electromotive force (E.M.F.) of cell. To enable this process, it is necessary
to have an indicator electrode (eg.glass electrode) immersed in the sample solution and a
reference electrode (eg. Calomel electrode).
The negative logarithm of hydrogen ions concentration of a given solution is taken to be the
value of pH. In the form of equations, it can be expressed as –
pH = -Log10 [H+]
The pH scale comprises of numeral values from 0 to 14. Determination of the pH of a solution is
done by using digital pH meter and is found to be the most accurate method free of interferences.
Two types of standard buffers solutions are used to calibrate pH meter– pH 4 buffer and pH 7
buffer.
The pH of the solution was recorded from the ELICO pH analyser LI614. Measurement of pH is
carried out following the manual of instructions of the manufacturer. After calibration of pH
meter, electrode is washed with distilled H2O and rinsed with the sample solution and dipped
into the sample water till the system is stabilized and shows a constant reading. The reading is
then recorded and taken as the pH of the sample water.
2) EC – Electrical Conductivity
Conductivity is the capacity of water to carry an electric current and it varies with number &
types of ions present. EC is a measure of this conductivity; it is expressed in unit Siemens per
cm. The conductivity or specific conductance of water depends upon the substances dissolved in
it. Conductivity measurement gives a practical estimate for variation in dissolved mineral content
in water supply. The conductivity of water also depends upon the temperature of the water. Since
the conductivity of a substance varies with temperature it is essential to note down the
temperature of water samples as soon as they are taken.
The measurement of electrical conductivity of water is done using digital ELICO CM 180
conductometer, by following the instruction mentioned in the manual from the manufacturer of
the conductometer. Before taking the reading for the water samples the instrument is calibrated.
Measurements are carried out at 25o C.
71
3) CHEMICAL OXYGEN DEMAND (COD)
Different kinds of chemical compounds are present in water. The chemical oxygen demand as
the name itself indicates is the oxygen requirement of sample for oxidation of organic material
and oxidisable inorganic matter. In COD test the sample is subjected to an oxidation process by
using a strong oxidising agent due to which both biological oxidisable and biologically inert
organic matter get oxidised. COD is generally considered as the oxygen equivalent of organic
matter oxidisable by potassium dichromate. COD is expressed in (mg/L) consumed under
specified conditions in oxidisation of organic and oxidisable inorganic matter corrected for
influence of chlorides. COD is useful to study the waste water plant treatment and monitoring the
polluted water bodies. COD result can be obtained in 3-4 hrs, thus it has more advantages over
the BOD, because BOD requires 3-5 days. COD data is very useful in knowing the toxic
conditions as well as the presence of biologically inert organic materials. This test is of great
importance in evaluating the pollution potential of effluents of paper & pulp industries, pesticide
industry, rayon and other chemical manufacturing units.
Principle: The organic matter of the sample gets oxidized to H2O, NH3 and CO2 by refluxing
with known excess amount of K2Cr2O7 in H2SO4 solution. After refluxing for 2 hours, the flask
was cooled and the excess of dichromate (unused) is determined by titrating the reflux solution
with ferrous ammonium sulphate solution of 0.1 normality (exact).
6 Fe2+ + Cr2O72- � 14 H+ +2Cr3+ + 7H2O
Silver Sulphate is added as a catalyst to promote oxidization. Mercuric sulphate is added to
eliminate the interferences due to chlorides, nitrates, etc.
Requirements:
Apparatus: Round bottom reflux flask, reflux condenser, burette, pipette, measuring flask,
conical flask etc.
72
Regents:
1 Sulphuric acid – Silver sulphate regent: - 10.1 gms of silver sulphate was dissolved in 1
dm3 of concentrated H2SO4 and kept it for 2 days to dissolve.
2 K2Cr2O7 (0.25N). 12.258 gms of potassium dichromate (which is dried in oven at about
102-103o C for about one day, was dissolved in distilled water and diluted upto the mark
1 dm3 of volumetric flask.
3 Ferrous ammonium sulphate (F.A.S.) solution (0.1N) – Dissolved 39.29 gms of ferrous
ammonium sulphate in distilled water, 20 cm3 of concentrated H2SO4 is added to the
solution of F.A.S. cooled and diluted upto1 dm3 in a volumetric flask.
4 Murcuric Sulphate.
5 Ferroin Indicator: 0.695 gms ferrous sulphate (FeSO4, 7H2O) and 1.485 gms 1, 10 –
phenanthroline monohydrate were dissolved in distilled H2O and diluted it to 100 cm3
with distilled water.
6 Sulfamic acid
Procedure:-
1. Placed 0.400 Gms HgSO4 in a clean, dry reflux flask.
2. Added 20 cm3 of sample water and mix it well. Then pumice stone was added, followed by
10 cm3 of 0.25N K2Cr2O7 solution.
3. Carefully added 30 cm3 of H2SO4 – Ag2SO4 mixture keeping the flask in ice bath to avoid
rise in temperature with constant stirring.
4. The precaution should be taken such that if the colour of the solution turns to green then
fresh sample with lesser aliquot or add more dichromate and acid.
5. The flask is then connected to the reflux condenser and refluxes it for 2 hours.
6. After digestion cool the flask completely and wash down the condenser with distilled H2O.
7. The digested solution titrated against 0.1 N F.A.S. solution using ferroin indicator. The end
point will be blue green to wine red.
8. Reflux blank in same manner using distilled H2O instead of sample.
73
Calculation:-
COD (mg/l) = ((A-B) x N x 8000) / (cm3 of sample)
A= Volume of FAS used for blank (in cm3)
B= Volume of FAS used for sample (in cm3)
N= Normality of FAS.
4) BIOCHEMICAL OXYGEN DEMAND (BOD)
Biochemical oxygen demand is the amount of oxygen consumed by microorganisms while
stabilizing biologically decomposable organic matter and certain inorganic materials such as
sulphides & ferrous ions (specific incubation) under aerobic conditions.
BOD refers to the quantity of oxygen required by bacterial and other micro organisms in
biochemical degradation and transformation of organic matter under aerobic conditions.
The scientific idea behind computation of BOD is the quantification of dissolved oxygen content
of the water sample drawn, at the time of drawing the sample and again after 3 days (72hours). In
the mean time the sample is incubated at 20 oC. The main objective of BOD is to ascertain the
amount of oxygen utilised for biochemical degradation of organic matter (carbonaceous demand)
Samples devoid of oxygen or containing less amount of oxygen are diluted several times with
special amounts of distilled H2O (aerated distilled water) in order to provide sufficient amounts
of oxygen.
The sampling procedure for method of BOD determination requires that -(i) sample bottles are
fully filled to the top with sample water and (ii) thereafter closing the bottle with an air tight
cork of the proper size. The flask is then incubated at 20oC for 3 days. The measurements of
dissolved oxygen are done initially and again after (72 hours). The difference in the two
measurements indicates the reduction in the oxygen level as a result of the micro-organisms
present in water sample and hence represents BOD computation.
74
Apparatus:
1. A Clean dry BOD bottle of 300 cm3 capacity.
2. Pipettes (1 cm3, 5 cm3 & 10 cm3).
3. Measuring cylinder
4. Conical flask
5. Burette
6. Incubator to be controlled at 20 oC +1 or -1
Reagents:
1. Phosphate buffer: - Dissolved 8.500 Gms of KH2PO4, 21.750 gms K2HPO4, 33.400 gms of
Na2HPO4.7H2O and 1.700 gms NH4Cl in distilled H2O. PH adjusted to 7.2.
2. Aerated distilled water for dilution of sample.
3. Magnesium sulphate solution – Dissolved 22.500 Gms MgSO4. 7H20 in distilled H2O and
diluted up to 1dm3.
4. CaCl2 solution. Dissolved 27.500 gms anhy. CaCl2 and diluted upto 1dm3.
5. FeCl3 solution – Dissolved 0.250 gms FeCl3. 6H2O in distilled H2O and diluted upto 1dm3.
6. Manganese sulphate solution – Dissolved 480 gms of tetra hydrate
7. Alkali iodide azide solution – Dissolved 500 gms NaOH and 150 gms of KI in distilled H2O
and diluted upto1dm3.
8. Conc H2SO4
9. Standard Na2S2O3 solution (0.025N) – dissolved 6.205 gms Na2S2O3.5H2O in distilled H2O
and diluted upto1dm3.
10. Starch Indicator freshly prepared.
Procedure:
1) Process for water dilution: – Compressed air is continuously passed through the water
container for 24 hours -48 hours. This ensures that the maximum value of D.O. is obtained.
The temperature of the sample bottle is maintained at 20oC.
75
2) Every litre of diluted water is added with 1 cm3 of phosphate buffer, magnesium sulphate,
and calcium chloride solution. The mixture is shaken well.
3) The sample was neutralized ( PH =7)
4) The sample is then diluted to obtain about 50 % depletion of D.O. (but not less than 2
mg/lit.). The residual oxygen after 3 days of incubation should not be less than 1 mg/lit.
5) Samples of different dilution were prepared.
6) The samples filled in labeled bottles, overflowing to the brim. Put the stopper immediately.
7) One bottle to be used for measuring initial D.O. and 2 bottles kept in an incubator at about
20 oC for 3 days.
8) Blank prepared in duplicate by filing BOD bottle with aerated H2O to measure o2
consumption in dilutie H2O.
9) D.O. of water sample bottles (Sample and Blank) were fixed by adding 2 cm3 MnSO4
followed by 2 cm3of Alkali – iodide- azide.
10) D.O of sample and blank determined on initial day and after 3 days.
Calculation - BOD of sample
BOD = (Do- D1)–(Co- C1)) x Decimal fraction of sample used.
DO = D.O. of the sample bottle on the zeroth day.
D1 = D.O. Of the sample bottle on the 3rd day
CO= D.O of the blank bottle on zeroth day.
C1= D.O of the blank bottle on 3rd day.
(C0-C1) = Depletion of D.O in dilution water alone.
(D0-D1)= Depletion of D.O. in sample plus dilution water.
5) TOTAL HARDNESS
The hardness in water is mainly due to accumulation of salts from soil, geological deposits and
also from waste water from industrial units and residential units. This ability or capacity of water
reacting to soap is termed as “Total Hardness”. Harder the water, greater will be the quantity
76
required for lather formation. The scaling of water pipes, boilers, and aqua guard filters is due to
more hard water. One unique component of water does not determine or account for its
“Hardness”; rather it depends upon numerous reasons and combinations of cat ions and anions.
Calcium (Ca) and Magnesium (Mn) are the main ions which impart “Hardness” to fresh water.
The degree of hardness is classified in terms of equivalent CaCo3 concentration.
Hardness can be of two types.
i) Hardness due to Carbonate which is temporary –( Temporary)
ii) Hardness which is not due to Carbonate – which is (Permanent.)
Heating to a high temperature removes carbonate hardness in the form of CO2.. Likewise
precipitation removes hardness. Non carbonate hardness is caused by the presence of hardness
causing cations like sulphate, chlorides or nitrates. This type of hardness is permanent and cannot
be removed by boiling.
• Principle: Eriochrome Black T forms wine red colour complex at pH 10.0+/- 0.1.
• The titrant EDTA has greater affinity for Ca 2+ and Mg2+ ions. When EDTA is added
calcium and magnesium ions forms blue coloured complex indicating end point by sharp
color change from wine red to blue. At pH above 12.0 only magnesium ions forms
complex with EDTA, at this point murexide indicator forms pink colour with calcium
ions and on addition of EDTA colour changes from pink to purple indicating the end
point.
• Metal ions interference can be removed by adding inhibitor.
Reagents:
i) Buffer Solution: By dissolving 16.9 Gms of ammonium chloride in 143 ml ammonia
solution. Further prepared solution of 1.179 g. of disodium salt of EDTA and 780 mg
MgSO4. 7H2O in 50 ml distilled H2O and add it to the first solution. And dilute the
combined solution to 250 ml.
ii) Inhibitor: By dissolving 4.5 gms of hydroxyl amine hydrochloride in 100 ml of 95% ethyl
alcohol.
77
iii) Eriochrome Black T- Prepared by mixing 0.5 Gms of dye with 100 Gms of NaCl as dry
powder.
iv) Murexide Indicator. Prepared by mixing of 200 g. of murex dye with 100 g. of NaCl.
v) 2N NaOH: By dissolving 40 Gms. of sodium hydroxide in 500 dm3 of distilled water.
vi) 0.01 M EDTA solution:-By dissolving 3.723 Gms EDTA sodium salt in distilled water and
diluted it in 1000 dm3.
vii) Standard Calcium solution: - 0.01 M Calcium solutions is prepared and used for
standardization of 0.01M EDTA solution.
Procedure:
i) 25 cm3 of well mixed sample was taken in a conical flask.
ii) And 2cm3 of buffer solution and one cm3 inhibitor was added to it. Swirl it and pinch of
Eriochrome black T was added and immediately titrated against EDTA solution (0.01M).
At the end point colour changes from wine red to blue.
iii) Take a blank reading.
iv) Amount of EDTA required by the sample
C = (A-B) Volume of EDTA, A= Sample, B= Blank.
v) Calculation :
Total Hardness = C x D x 1000
(Mg/lit) ml of sample
C = Volume of EDTA required by sample.
D= mg CaCo3 equivalent to 1 ml of EDTA.
6) CLORIDES
Chlorides are generally present in natural water. The presence of chlorides in natural waters may
be attributed to dissolution of salts, effluent discharge from chemical factories, irrigation
discharges, sewage disposal, refuse lechates and effect of sea water intrusions in coastal regions.
This results in the pollution of both terrenian and sub terrenian waters. Chlorides impart a salty
78
taste to water. The chemical composition of water determines this taste. When Calcium and
Magnesium ions are not present in water a salty taste may be developed even when sodium
levels are 250 mg per litre. However, when there is a predominance of Calcium and Magnesium
ions in water, a salty taste may not be developed even when the sodium concentration is 1000
mg/Litre. A concentration of 250 mg/L of chlorides is determined in some water containing Na
ions. When calcium and magnesium ions present in large amount a chloride concentration about
1000mg/L (quite high) does not give salty taste. Orchards, fields, etc., structures made from
concrete (bridge – houses) and metal pipes etc. (residential – industrial) are affected due to high
chloride levels. Three methods are suggested for estimation of chlorides. High levels of
Chlorides in water have bad effect on agricultural plantation.
1. Argento metric Method
2. Potentio metric Method
3. Titration against standard silver nitrate solution.
Principle: Silver nitrate reacts with chloride ions to form slightly soluble white ppt of silver
chloride .At the end point when all the chloride ions got precipitated, with the next drop of silver
nitrate; silver ions react with chromate to give reddish brown silver chromate indicating the end
point.
Regents:
i) Potassium Chromate Indicator: 50 g. of potassium chromate was dissolved in distilled
water. Silver nitrate is added till definite red participate is formed. Allow the solution to
remain for 10- 12 hours and then filter and dilute to 1 dm3.
ii) Silver Nitrate Solution (0.0141N): By dissolving 2.395 g. of AgNO3 and diluting it to one
litre. Standardisation is done using 0.141 N sodium chloride solutions.
iii) Sodium Chloride Solution: Dissolve 824.1 mg NaCl dried at 140oC and dilute to 1000 ml.
Procedure:
i) 50 ml of sample was taken, the pH was adjusted to 7-8 & one ml of potassium chromate
solution was added to it.
ii) Then titrated against standardized silver nitrate solution till AgCrO4 starts precipitating.
79
iii) Standardisation of AgNO3 is done against NaCl solution.
iv) Run the Blank – without sample.
Calculation:
Chloride (in Mg/L) = (A-B) x N x 35.45 x 1000/ Volume of the sample (in ml)
A = ml of AgNO3 required by sample.
B = ml of AgNO3 required by blank.
N = Normality of AgNO3 used.
7) SULPHATE – SO42-
Sulphate ions are usually present in water. They are usually present in soluble salts. Mostly they
originate from oxidization of sulphate ores, solution of gypsum and anhydrite industrial wastes
etc. Surplus tri-oxide produced by photolytic catalytic oxidization of sulphur dioxide combine
with water vapuor forms. Sulphuric acid comes down as water or snow.
In weathering process gypsum (calcium sulphate) is dissolved and sulphide minerals are partly
oxidized, giving rise to soluble forms of sulphate, which is carried away by the river flow. A
laxative effect is produced if water containing a high level of sulphate is consumed. In human, in
order to have a purgative effect, the quantity of magnesium sulphate needs to be above 1000
milligrams per litre. . Infants, small children may be more easily affected. In industries, high
sulphate concentration leads to deposits in boilers, pipes etc. Sulphates in higher concentration
causes scaling in water supplies .It also leads to problem of corrosion and odour in waste water
treatment as it gets reduced to hydrogen sulphide.
Sulphate concentration is quantitatively decided by using gravimetric method or Turbidometric
method. Of these two methods gravimetric method is more precise in its applicability to all
types of waters and waste waters.
80
Gravimetric method for determination of sulphate ion concentration
Sulphate ions are precipitated as BaSO4 in the presence of hydrochloric acid. The precipitated
barium sulphate is filtered, dried, ignited and weighed as barium sulphate.
BaCl2 + SO42- => BaSO4 + 2Cl-
Reagents:-
i) Methyl Red Indicator: Prepared by dissolving 100 mg Methyl red in distilled water and
diluting to 100 cm3.
ii) 1:1 HCl
iii) Barium Chloride solution: Dissolve 100 g. of BaCl2. 2H2O in 1000 cm3 distilled water (If
turbidity of formed solution is rejected).
iv) Silver nitrate – nitric acid reagent: By dissolving 8.5 g. of AgNO3 and 0.5 ml concentrated
HNO3 and make the volume to 500 cm3 with distilled water.
Procedure:
i) Take 200 ml of filtered sample in 400 ml beaker.
ii) Adjust pH of sample to 4.5 – 5 with HCl using methyl red indictor (to get orange colour)
and add additional 2 ml HCl.
iii) Boil the solution for about 1 minute and add 10 ml hot barium chloride solution slowly
from the pipette with constant stirring.
iv) Keep the beaker on a boiling water bath to digest the precipitate at 80o – 90o C, preferably
overnight.
v) Filter the contents of filter paper through ash less filter paper Whitman No. 40. Wash the
precipitate with warm water until the washings give no opalescence with silver nitrate
reagents.
vi) Place the filter paper in a previously weighed silica cubicle and ignite it in a electric
incinerator. Cool it in dessicator and find out the weight.
vii) Weight of the residue (BaSO4) Weight of ( Cubicle + residue) - Weight of Cubicle
Calculation SO42- = mg of BaSO4 x 411.5/ Volume of Sample taken
81
8) ALKALINITY – USING ACIDIMETRIC SOLUTION
Presence of carbonate, bicarbonates and hydroxides ions imparts alkalinity to water. Other than
these presences of silicates, phosphates and borates also contribute to alkalinity. Alkalinity of
water is a measure of its capacity to neutralize acids. However major portion of alkalinity in H2O
is due to hydroxides, carbonates and bi-carbonates. The value of alkalinity enables us to decide
upon the quantity of chemicals to be applied for “Waste Water treatment processes.” It
particularly helps in coagulation, softening and operational control of anaerobic digestion.
Principle: Alkalinity of sample water can be estimated by titrating with standard sulphuric acid
using phenolphthalein and methyl orange indicators.
Ca (OH) 2 +H2SO4 �CaSO4 + 2H20
2CaCO3 + H2SO4 �Ca (HCO3)2 + CaSO4
Ca (HCO3)2 + K2SO4 � CaSO4 + 2CO2 + 2H2O
Reagents:
i) Standard H2SO4 solution (0.02N). Prepare 1 N H2SO4 solution. Place 1000 ml of
concentrated H2SO4 in 1000 ml standard flask and diluted with distilled H2O.
ii) Take 20 ml of 1 N H2SO4 in 1000 ml volume flask. And dilute it to 1 lit.
iii) Phenolphthalein Indicator.
iv) Methyl Orange indicator.
Procedure:
i) 25 ml water sample was taken and to that two-three drops of phenolphthalein Indicator were
added.
ii) If solution turns pink then titrate it against 0.02 N H2SO4 solution till it turns colorless.
iii) Note down the reading for phenolphthalein Indicator.
iv) Now add 2-3 drops of methyl orange indicator to the solution and continue the titration till
end point orange colour is obtained.
82
Calculation:
Alkalinity (mg/L) as CaCO3 = A/BxNx50000/Volume of the sample (in ml)
A= Phenolphthalein reading
B = Methyl Orange reading
N= Normality of H2SO4 used.
Total Alkalinity (Mg CaCO3) = B x N x 50000/Volume of the Sample
9) OILS AND GREASES
Solvent Extraction Method :
Oils and greases are present in domestic and industrial wastes. Sludge when disposed in river
water leads to water pollution and also decreases waste water treatment efficiency. In case these
wastes are present in excess amount, it results in environmental degradation. Various aerobic and
anaerobic processes go on in water. Oils and Grease obstruct such processes. This is harmful to
the environment and related eco-system.
Principle: Oils and greases are dissolved in suitable solvent (organic) and separated from
aqueous phase. The solvent layer is then evaporated and residue weighed as oils and grease.
Organic solvents, such as, Trifluoroethane or pet ether are generally used.
Regents:
i) 1:1 Sulphuric acid
ii) Petroleum Ether
iii) Sodium Sulphate anhydrous Na2SO4
Procedure:
i) Place appropriate amounts of sample water in separating funnel (1 Litre).
ii) Add about 5 ml H2SO4 to make PH =2 or less than 2.
iii) Wash the sample bottle with petroleum ether about 30 ml and add it to the separating funnel.
83
iv) Shake the mixture vigorously for two minutes and then gently for 5 to 10 minutes.
v) Let the layers separate. The upper one is petroleum ether and the lower is the sample.
vi) Discard the lower layer of the sample through the separating funnel.
vii) If clear solvent layer is not obtained add 1 gm Na2SO4, if necessary.
viii) Run the solvent layer from separating funnel through a funnel with filter paper into pre-
weighed distillation flask.
ix) Wash the separating funnel and filter paper with little petroleum ether to remove any
residual oil and grease.
x) Evaporate petroleum ether on a water bath and take the final weight and take the final
weight of distillation flask after cooling it in a dessicator.
Calculation:
A = Weight of (distillation flask + residue)
B= Weight of empty distillation flask.
A-B = Weight of the residue =(C)
Oil & Grease (Mg) = C x 1000/Volume of the sample (ml)
10) TURBIDITY BY NEPHELOMETRIC METHOD
Many particles may be present in waters. These particles deflect or absorb light and do not allow
it to travel in a straight line. The quantification of this characterics of water, which reduces
transparency, is called “Turbidity”. Turbidity is an expression of Tyndall effect (O.P.) that
causes scattering of light and absorption. Scttering of light depends upon shape size and
Rerractive Index (R.I.) of suspended matter. The presence of such particulate matter in water is
caused by the process of siltation, very minute organic and inorganic matter and various micro
organisms. Highly Turbid waters reduce visibility in the Water and considering the serene looks
of the natural environment are not considered desirable.
We have seen the definition of “Turbidity”. The amount and angular distribution of scattered
light is governed not only by the quantity of insoluble substances but also by their shape and size
and refractive index.
84
Neophelometric Method. In nephalometer the intensity of light scattered by the sample under
particular condition is compared with the intensity of light scattered by standard reference
suspension, under same conditions. Higher the intensity of scattered light will corresponds to the
higher the turbidity.
Apparatus: 1) Nephelometer 2) Sample tubes.
Regents:
i) Stock turbidity suspension
a) Solution A: Prepared by dissolving 1.00 gm of hydrazine sulphate in distilled water and
diluted it to 100 cm3
b) Solution B: Prepared by dissolving 10 gm hexa methylene tetramine in distilled water and
dilute it to 100 cm3.
c) Solution C: - Mix 5 ml of solution A and 5 ml of solution B. Let it stand for 24 hours at 25o
C + or – 3o C and dilute it to 100 ml. The turbidity of this solution is 400 NTU.
ii) Standard turbidity suspension:-
Dilute 10 ml of solution C to 100 ml with distilled water. The turbidity of this suspension is
40 NTU, should be prepared daily.
Procedure:
i) The sample is shaken thoroughly so that, the air bubble subsides.
ii) The Nephelometer adjusted at 100 using 40 NTU (standard suspension).
iii) If the sample has turbidity more than 40 NTU, then sample should be diluted so that its
turbidity can be read on the same scale. Every division on the scale is equal to 0.4 NTU
turbidity.
Calculation:
Turbidity (NTU) =Neplelometer reading x 0.4 x dilution factor
85
Interferences:
Measurement of turbidity may be interfered by the presence of debris and other rapidly settleable
matter.
11) NITROGEN AS NITRATES USING SPECTROPHOTOMETER :
Lakes, rivers and other sources of water in nature have nitrates. Nitrates are a result of a vey high
oxidation of nitrogen compounds or its derivatives. Nitrogen is present in various forms in lakes,
rivers etc. When decomposition of nitrogen products takes place, it results in the formation of
nitrates. However, in rivers, lakes and other water bodies nitrates are initially low. There are a
number of sources of wastes, like chemical fertilizers, decayed animal and vegetable matters,
domestic effluents, industrial wastes, atmospheric washout, sewage sludge, etc which increase
the quantity of nitrogenous compounds. Excess of nitrates in drinking water is very hazardous –
especially for infants, wherein intestine nitrates are converted into nitriates which may cause
methemoglobianaemia. Excess of nitrates in surface water may stimulate the growth of plants as
they take nitrates which are (which acts as nutrients) converted to protein cells. Stimulating the
growth of plants, especially algae may cause blooming of algae, which leads to eutorification.
Phenol disalphonic acid method (PDA):
Principle: Phenol disalphonic acid can be used for determining nitrogen as nitrates. Since
nitrates reacts with phnol disulphonic acid to form nitro derivative which in alkaline media
develops yellow colour to solution. The intensity of colour is proportional to concentration of
nitrates. The brighter this yellow tinge, the greater the amount of nitrates present in water and
vice versa.
Apparatus:
i) Spectrophotometer
ii) Nesslers tubes
86
Reagents:
i) Phenol disalphonic acid (PDA): 25 gms phenol is dissolved in 150 ml concentrated H2SO4
and then 75 ml of fuming H2SO4 is added. Stirred well and heated on water bath for two
hours.
ii) Ammonium Hydroxide: 30% ammonia solution prepared.
iii) Stock nitrate solution: 721.8 mg of anhydrous KNO3 dissolved in distilled water and diluted
to 1 dm3 solution.
iv) Standard nitrate solution: By evaporating 50 ml of stock nitrate solution to nearly dryness on
a boiling water bath and dissolving residue obtained in 2 ml PDA reagent and distilled water
is added to make the volume 500 ml. (1 ml = 10 ugN.)
Procedure:
i) 100 ml of filtered water sample is taken in a beaker.
ii) Sufficient amount of silver sulphate added which remove chlorides (1 mg/L C1 = 1 ml
AgSO4 solution) the mixture slightly heated and the precipitate of AgCl filtered.
iii) The filtrate is evaporated to dryness.
iv) After cooling, 2 ml of PDA added residue gets dissolved into it.
v) Then it is diluted with distilled H2O and then 6 ml of NH3 solution added and filtered.
Yellow colour is developed. Then it is diluted to 100 cm3 with distilled water.
vi) Blank reading was taken using distilled water instead sample water.
Result
i) The absorbance is recorded at 410 nm with light path of one centimeter to obtain reading for
NO3- as N in mg/l.
ii) The calibration curve was prepared using suitable aliquots of standard nitrate solution.
12) TOTAL DISSOVLED SOLIDS
Water contains solids in both forms – i.e. Dissolved and undissolved. These undissolved solids
are referred as suspended solids. These can be removed by filtration. Dissolved solids can be
measured by evaporation method.
87
Principle:
Various types of salts are found dissolved in natural waters. Total dissolved salts are determined
as the residue left after the evaporation of the filtered sample.
Dissolved solids are undesirable for many reasons. They form scales, cause foaming in a boiler,
accelerate corrosion etc.
Apparatus – Requirements:
i) Glass Fibre filter
ii) Suction Pump
iii) Evaporating Dish
iv) Muffle Furnace
v) Oven
vi) Desiccators
Procedure:
i) A clean evaporating dish was taken then dried in a muffler furnace for about one hour at
500oC to 550
oC and then it is kept in desiccators and weighed.
ii) 250 ml of water sample was filtered at suction pump using glass fibre filter. 100 ml of
filtered sample taken and then placed in evaporating dish on a hot plate.
iii) When all the water is nearly evaporated keep the dish in a drying oven at 180oC for 1 hour.
iv) It is then cooled in desiccators and weighed.
Calculation:
Total Dissolved Solids = (C-D) x 1000/ Volume of Sample in cm3
C= Final weight of evaporating Dish.
D = Initial weight of evaporating Dish
88
13) PHOSPHATES PO43- BY UV VISIBLE SPECTROPHOTOMETER
Phosphates present in small proportion in water are essential for biological degradation of waste
water; also they reduce scale formation and increase the carrying capacity of water mains.
Corrosion of pipes is also reduced to some extent by phosphates. However, presence of
phosphates in large quantities indicates pollution due to contamination with sewage /industrial
wastes. Further, it also promotes growth of unwanted organisms.
Principle: Molybdate regent reacts with orthophosphate under acidic conditions to form
molybdophosphoric acid which on reduction with Sncl2 forms molybdenum blue. The intensity
of this blue colour complex is proportional to the concentration of phosphate in the solution.
Interferences due to presence of nitrites are removed by adding sulphanic acid before addition of
ammonium molybdate.
Regents:
i) Stock phosphate solution: Prepared by dissolving 0.711 Gms of anhy, KH2PO4 in distilled
H2O and diluted to1 dm3.
ii) Ammonium Molybdate solution :
Soln 1: 31.4 Gms of ammonium molybdate dissolved in 200 ml distilled H2O.
Soln 2: 252 cm3 of concentrated H2SO4 added to 400 cm3 distilled H2O.
Soln 1 is added to soln 2 and diluted to 1 dm3.
iii) 3N NaOH Solution: 12 gms of NaOH dissolved in 100 cms distilled H2O.
iv) Strong Acid Solution: 300 cm3 of concentrated H2SO4 plus 600 cm3 of distilled H2O + 4
cms3 of concentrated HNO3 diluted to 1 dm3.
v) SnCl2 Solution: 2.5 Gms of SnCl2.2H2O dissolved in 100 ml of glycerol heated on water
bath to get clear solution.
vi) Phenolpthalien Indicator.
Procedure:
Phosphate measurement in the sample solution is carried out as total phosphates i.e. organic
phosphates and all other phosphates including polyphosphates are first converted into ortho
phosphates by digestion/boiling with sulphuric acid solution for at least 90 minutes. 100 ml of
89
the sample concentrated to about 25- 30 cm3 and then again diluted to 100 cm3 with distilled
H2O.
Caliberation graph is prepared by preparing phosphate working solution from standard phosphate
solution to cover the range. Blank is prepared by taking distilled H2O. Intensity of the blue
coloured complex of phosphate solution, measured at 690 nn and 1 cm light path in about 10
minutes after development of colour.
Calibration curve was plotted for absorbance to mg of phosphates. Similarly, intensity of the
blue coloured complex of sample solution (digested) – diluted as per requirement is measured in
a similar manner to phosphate solution for caliberation curve. Amount of phosphates in the
sample is determined by using standard calibration curve.
14) DETERMINATION OF NA AND K BY FLAME PHOTOMETRY
Sodium is present in number of minerals. Rock Salt (NaCl), sewage, industrial effluents, sea
water intrusion in coastal areas and use of Na compounds for corrosion control and water
softening process all contribute to sodium concentration in water because of highly soluble
sodium salts and minerals.
Na (Sodium) is highly soluble in H2O and it imparts softness to water. In ground water Na
concentration varies widely but normally ranges between 6 mg/L to 120 mg/L. The
concentration may range from 1 milligram/litre to 310 milligram/litre in surface level water.
Principle: It is based upon emission spectroscopy. When the solution is ignited by the flame the
electrons get exited from ground states to higher energy states. When the electrons return to their
original state light is emitted and the intensity of this light is measured.
Procedure: - In order to ensure that the equipments functions properly, the “Instruction Mannual”
issued by the equipment manufacturer has to be followed.
Reagents required:
i) Stock NaCl solution: 2.5418 gms of NaCl dissolved and diluted to 1000 ml with glass
distilled water; 1 ml= 1 mg Na (1000 ppm, stock solution).
90
ii) Intermediate Solution: By diluting 10 cm3 of stock sodium chloride solution with glass
distilled H2O to 100 cm3 (1 ml =100 ug Na).
iii) Standard solution: By diluting 10 ml of intermediate Na solution to 100 cm3 with glass
distilled H2O.
Calculation:
MgNa/L = Reading x Dilution factor
Potassium (K); Concentration of K are generally up to 20 mg/L. It has similarity to Na in
chemical nature. Ratio of Na to K is 10:1 or 20:1, it remains mostly in solution.
Reagents required.
i) Stock Potassium solution: 1.907 gms of dry KCl dissolved in 1 dm3 of glass distilled H2O
(One ml= 1 mg K) (1000 ppm, stock solution)
ii) Intermediate Potassium Solution: Prepared by dilutng10 ml of stock Potassium solution with
glass distilled H2O to 100 cm3. (1ml= 100 Ug K).
iii) Standard Potassium Solution: 10 ml of intermediate potassium solution diluted with glass
distilled H2O to 100 ml. (1ml= 10 Ug K).
For further analysis, K filter is used instead of Na filter.
15) D.O. – DISSOLVED OXYGEN
Different levels of oxygen get dissolved in sea, river, and lake waters. The capacity of water to
dissolve oxygen depends on three characterics of water – temperature, pressure and salinity. It is
very much essential to life of fish and other aquatic organisms. The levels of dissolved oxygen
reflect the “Quality of Water” and are one of its most important parameter. Various biological
and physical processes take place in water. Dissolved Oxygen level is a critical parameter which
91
measures the quantum of such physical and biological processes going on in water. It is directly
proportional to such biological processes.
In industrial waters D.O is a nuisance as it corrodes water. Non polluted waters are normally
saturated with D.O which reaches maximum in the afternoon and falls again at night. Oxygen
depletion takes place in polluted waters due to decomposition of organic matter, oxidization
reactions, presence of iron and rise in temperature. D.O is therefore very important in deciding
the quality of water.
Iodometric Method is followed widely for determination of Dissolved Oxygen, since it is quite
accurate. Following this procedure is also highly reliable.
Principle: In this method divalent manganese solution and a strong alkali-iodide reagent are
added to the sample water. A stopper is then used to close the glass bottle. The oxygen present in
sample water rapidly oxidizes the dispersed divalent manganese to its higher valency which
precipitates as brown colour with alkali-iodide reagent. On acidification, manganese reverts back
to divalent state and liberates iodine from potassium iodide equivalent to original content of
dissolved oxygen. The liberated iodine is then titrated with standard sodium thiosulphate
solution, using starch as an indicator. Thus,
MnSO4 + 2KOH �Mn (OH) 2 + K2SO4
2 Mn (OH) 2 + O2 (DO) � 2 MnO (OH) 2
(Brown colour)
Mn (OH) 2 + H2SO4 � MnSO4 + 3H2O
Mn (SO4)2 + 2KI � MnSO4 + K2SO4 +I2
2Na2S2O3 + I2 � Na2S4O6 + 2NaI
Presence of oxidising and reducing materials in the sample interferes with D.O determination.
Presence of oxidising material produces positive error where as reducing substances give
negative error.Interferaces due to presence of nitrites are very obvious in surface waters .these
errors can be removed by using sodium azide (alkali-iodide -azide) is very suitable for polluted
water also for BOD determination.
92
Sample collection and preservation - Sample collection of 300 ml in narrow mouth BOD
bottle. Bottle has to be filled without entrapment of any air by overflowing the bottle and stopper
is to be replaced. Record the sample temperature as soon as it is collected. D.O may be fixed by
addition of 2 ml manganese sulphate solution and 2 ml alkali-iodide-azide reagent to the sample
in BOD bottle. The final titration should be performed within 8 hours of the fixation of D.O.
Reagents:
i) Manganese sulphate solution -By dissolving 36.4 gm manganese sulphate mono hydrate
(MnSO4.H2O) in distilled water and diluting it to 100 cm3.
ii) Alkali-iodide-azide reagent ;
a) 125 gms NaOH and 37.5 gms KI dissolved and diluted to 250 cm3.
b) 2.5 gms NaN3 dissolved in 10 ml distilled water
c) Sodium azide solution poured in alkali iodide solution and mixed well.
iii) Concentrated sulphuric acid.
iv) Starch solution.
v) Sodium Thiosulphate solution: 24.820 gms sodium thiosulphate dissolved in freshly boiled
an cooled distilled water and dilute it to 1 dm3 and standardisation is done against 0.1 N
K2Cr2O7 solution.
vi) 0.025N Na2S2O3 Solution. 250 ml of 0.1 N Na2S2O3 Solution diluted to1 dm3 with distilled
water
1 ml 0.025N Na2S2O3 Solution = 0.2 mg D.O.
Procedure
i) The sample collected in BOD bottle as per sampling for D.O.
ii) 2 ml manganese sulphate solution is added; followed by addition of 2 ml alkali-azide
solution. Addition is done by separate pipettes putting them well inside the solution. The
bottles were stoppered without allowing for any entry of air. Then the solution is shaken
thoroughly inverting the bottles.
iii) Once precipitate get settled down leaving clear supernatant solution, the stopper removed
carefully from bottle and at this stage concentrated H2SO4 added.
93
iv) The bottle then closed by stopper and mixed thoroughly till the dissolution of precipitate
takes place and titrated immediately against 0.025 N Na2S2O3 solutions by using starch as
an indicator.
Calculation:
DO (mg/L) = (0.2x1000) x (0.025N) ml of thiosulphate solution /200
(If thiosulphate solution = 0.025 N exactly)
HEAVY METAL :
Heavy metals are a term used to describe those metals which have an atomic number higher than
iron (Fe) and have a density more than 5 grams per cubic centimeter. Heavy metals used in
certain category of industries, are most deleterious ecologically. They have a specific gravity 4-5
times that of water. They usually belong to the atomic number 22 – 34 and 40- 52. Such metals
are members of actinides & lanthanide series.
Heavy Metal content in water samples: There are a number of chemicals which enter into water
bodies as a result of human activities or from rocks as a result of weathering. Metals cycle in the
environment through bio-chemical cycles and get redistributed between various components of
the environment. Natural levels of these elements are usually harmless to organisms but
pollution by way of mining activities, agricultural run offs (pesticides/ herbicides), industrial
effluents and fossil fuels have considerably increased their global levels.
Chemicals & Regents used in heavy metal determination
Regents and chemicals used for evaluating the presence of various heavy metals were of
analytical grade (AR). Accuracy of the regent would be checked by taking a blank reading.
In order to calculate the different parameters of the study, standard operating procedures were
followed in laboratory. In case any equipment was to be used, the operating guidelines issued by
94
the equipment manufacturer were followed. All laboratory glass wares were thoroughly cleaned
by acid (HCl) before analysis. In order to remove the traces of acid the glassware was also
washed in the tap water. Thereafter, the apparatus were rinsed by using deionised distilled water
in order to ensure proper cleaning to avoid any error.
Preparation of Water Samples
Collection of water samples is done randomly, twice in the morning and evenings, twice every
week from the pre determined sampling locations on the course of “Mithi River”. The samples
drawn in different seasons, over a period of one year, were analyzed. In order to collect water
samples polythene bottles having a volume of two litres were used. The grab sampling method
was followed. In order to ensure that any probable acid spots were removed, the bottles were
washed in normal water, after washing them in HCl solution. Then they were washed with
distilled water. These bottles were then washed twice or thrice, in the river waters at the time of
drawing the sample. Then the bottles were filled with sample water without leaving much air
gap. Water samples were acidified immediately after collection to minimize absorption of heavy
metals on the wall of the bottle (APHA, 1998). The sample bottles were then stoppered and
sealed with paraffin wax and kept in a ice box to maintain the temperature between 4-6oc.
Water sample from the surface is collected in polythene bottles after rinsing the bottles 3 to 4
times in the water where the sample is being collected. Water sample from the bottom of
shallow water can be collected by lowering polythene bottles to the bottom, while opening and
closing the bottle stopper inside the water. Sample is collected from the centre not near the bank
of the river. Composite samples may be taken.
For estimation of metal ions, sample should be preserved by adding H2SO4 (pH 2-3).
Take 50 cm3 of selected sample water. Add 25 cm3 of concentrated HNO3. The samples were
kept overnight for digestion. The digested samples were dried till evaporation and 4 cm3
perchloric acids were added to it. The samples were then concentrated to half. These samples
were filtered into 50.0 cm 3 standard volume flask using Whatman No. 41 filter paper. The
volume was made up to the mark using de- ionized water. After this, the respective element is
95
determined by directly aspirating the sample in the specified flame and setting appropriate
wavelengths.
The calibration curves were plotted for standard solutions of respective metals for their
absorbance against concentration. The concentration of metal in the water sample is determined
from its absorbance by using these calibration curves.
Heavy metal analysis by atomic absorption spectrophotometer (A.A.S.).
The concentration levels of metals, like Cadmium (Cd), Chromium (Cr), Arsenic (As),
Aluminum (Al), Lead (Pb), Iron (Fe), Zinc (Zn) and Manganese (Mn) is easily and satisfactorily
determined by AAS (AAS 7000). After pretreatment of the sample, the level of various metals in
the sample is determined by directly aspirating the sample in the specified flame and by setting
the appropriate wavelengths, using Holious cathode lamp. Instructions of the manufacturer are
followed. A calibration curve is prepared by using standard solutions of elements to be analysed.
Mercury (Hg) was analysed with cold vapour atomic absorption spectroscopy, while
determination of Arsenic (As) requires hydride generation together with atomic absorption
spectrophotometer.
Quality Control/ Assurance
The regents & Chemicals used were of Analytical Grade (AR). The drawing of “Water samples”
was done in clean polythene bottles. Before use bottles were cleaned, washed and rinsed with
sample water.This was done to ensure that these bottles were free of impurities particulate matter
both organic and inorganic. In order to avoid contamination during transporting from sampling
station to laboratory bottles were sealed with paraffin wax. Regent blanks were verified to ensure
that there are no impurities in the regents due to environmental factors. All glassware ware was
washed properly then soaked in acid bath overnight, washed in the morning and rinsed with
distilled water.
96
BACTERIOLOGICAL ANALYSIS :
TOTAL BACTERIA, TOTAL COLIFORM & FECAL COLI FORM
Materials and methods:
The Membrane Filter (MF) method is used to ascertain the presence of E. coli and other forms of
Coliform Bacteria which are present in the water samples drawn from the environment. These
methods used for determination of total and Fecal counts, are well established and are available
in standard text books/ reference manuals (Section 9222, Standard Methods for the Analysis of
Water and Wastewater, US EPA). As per the works (Mates et al., 1989) recently carried out,
the MF methods have standardised for regular procedural use by the US EPA (Fed. Reg, 1991;
US EPA, 2000; 2002).
1) Serial Dilution method technique: used for the analysis of TOTAL HETEROTROPHIC
BACTERIAL counts.
The plate count method is used for ascertaining heterotrophic bacterial counts. It consists of
growing bacteria colonies on a “plate” using a specific kind of nutrients. These bacteria
colonies can be seen without any optical aids and can also be counted. In order for this
method to be of any use, the dilution of the original sample has to be properly carried out.
One of the requirements relate to the number of colonies of the required bacteria that should
be grown. Ideally, this number should range between (say) 30 – 300. If the number is less
than 30 then the procedure becomes statistically unstable. If the number is more than 300
then there is overlapping in the counting of these colonies and hence the count tends to
become incorrect. In order to ensure that the correct number of colonies is grown
arrangements may have to be made to the sample several times.
In the present case, several serial dilutions of the samples of the scale (1:10, 1:100, 1:1000
etc.) were made. Sterile water was used and the required bacterium was grown on
nutrient agar (NA) media in a plate/dish. The plate was sealed and then incubated at the
required temperature. The temperature of 37o C was followed. The process of counting was
conducted at the end of the incubation period.
97
2) Membrane Filter technique for TOTAL COLIFORM AND FE CAL COLIFORM count
This method is used to assess the quality of water. As a procedure it has now won acceptance
from several countries. The quantum of microbes in water sample is ascertained by this
method. This method comprises of filtering the sample water through kind of sieves. The
pore size has to be 0.45 microns. This process retains the bacteria; while allowing the water
to flow out through the sieve. The filter/sieve is then incubated on a selective medium and
the number of colonies is counted after the incubation period. Several tests have been carried
out to verify the effects of different types of “media” to be used for incubation and the
incubating conditions – time, temperature etc.(Grabow et al., 1979; Rice et al., 1987). The
two media commonly used are “m-Endo-type media” and Tergitol-TTC in North America
(APHA 1998) and in Europe (AFNOR, 1990) respectively.
In order to analyse the Total Coliforms in the river water samples, membrane filter method was
adopted. A dilute waste water sample was filtered through a sterile 0.45 micron membrane filter.
Slowly, without any disturbance, the funnel/jar containing water was removed from the
filter/plate. The filter membrane was then placed on a Petri dish with the help of a sterile filter.
The Petri dish contained “m-Endo” in case of Total Coliform and “m-FC agar” in case of Fecal
Coliform. It was ensured that there are no air bubbles under the filter.
This Membrane Filtration (MF) method was repeated three times for the lowest sample dilutions
(1:1000. 1:100 and 1:10). In order to avoid growth of bacteria (other than the required), the petri
dish containing Fecal Coliform was removed from the 35o C incubator after 120 minutes of
incubation and placed in a 44.5o C incubator. The Petri dishes/plates were removed from the
second air incubator after 1440 minutes (24 hours) on the next day. The number of colonies of
“Total” and “Fecal Coliform” were then counted. The colour of these colonies is helpful in their
ascertaining their count. The Total Colifom colonies were pink to dark. Some of the TC colonies
had greenish/golden tinge. The Fecal coliform colonies were bluish in colour.
As a group, the Total Coliform Bacteria can be divided into four different kinds. Specifically,
the four genera in “the Enterobacteriaceae” family are “Eschercia”, “Klesbisella”,
“Citrobactor” and “Enterobacter”. The most dominant indicator of Fecal pollution turns out
to be the Escherichia (E. coli Species).