Embed Size (px)
Citation preview
1/14
Overview for 2nd Quarter of FY2013 andForecasts for FY2013 as a whole
October 25, 2012Hino Motors, Ltd.
Yoshio ShiraiPresident, Member of the Board
Photo: Hino Dutro 70th anniversary special edition

2/14
This material contains forward-looking statements regarding the performance, goals,plans, and strategies of Hino Motors (including its consolidated subsidiaries). Theseforward-looking statements are based on determinations and assumptions that havebeen derived from information currently available, and may differ considerably from realperformance figures and future operations at Hino Motors due to uncertainties inherent insuch determinations and assumptions, and other variables including changes in futurecorporate operations as well as shifts in internal and external conditions.
Reminders regarding insider trading:Investors who receive nonpublic information on important facts directly from a company(primary information recipients) are prohibited from selling or buying stocks prior to thisinformation becoming "public" (Article 166 of the Financial Instruments and ExchangeAct).According to the enforcement ordinance of this law, information is deemed to have been
made "public" once 12 hours have elapsed after the company discloses this informationto two or more press organizations, or when the information, after a notification to thesecurities exchange, is listed by electronic means (TDnet's Timely Disclosure andViewing Service) as prescribed by the Cabinet Office Ordinance.
Forward-looking statements and insider tradingForward-looking statements and insider trading

3/14
Contents
1. Summary of the first half of FY2013
2. Forecasts for FY2013 as a whole
3. Topics
4/14
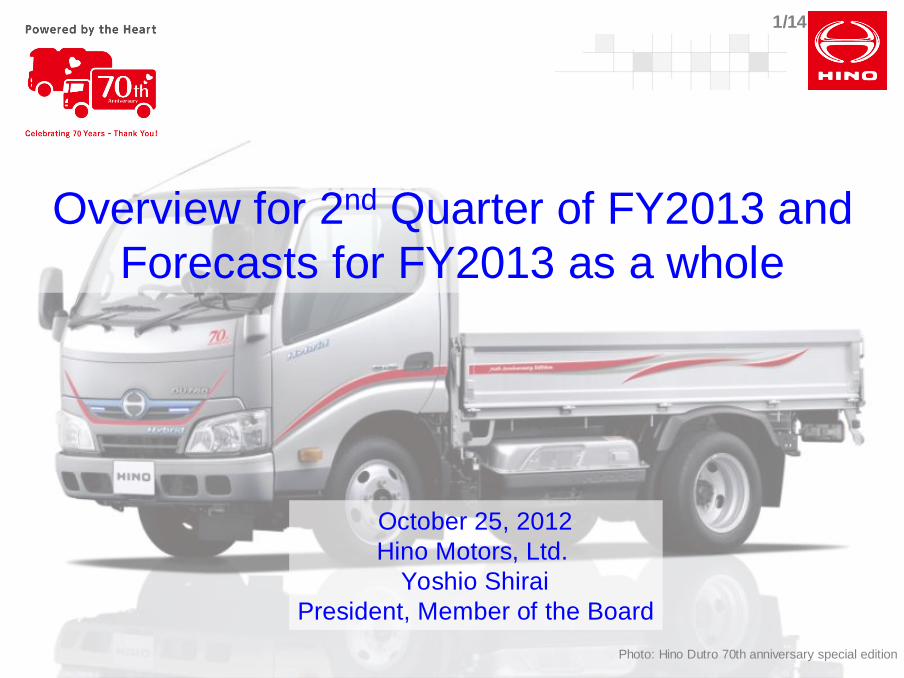
1st half, FY13 1st half, FY12 Change Change %
Japan 19.6 15.2 + 4.4 + 29.2%
Overseas 56.1 41.0 + 15.1 + 36.8%
Global 75.7 56.2 + 19.5 + 34.7%
Toyota brand 85.7 63.2 + 22.6 + 35.7%
(Thousand units)
1st half, FY13 1st half, FY12 Change Change %
Net sales 745.4 575.7 + 169.7 + 29.5%
Operating income 29.7 14.9 + 14.8 + 99.3%
Net income 18.5 0.6 + 17.9 31.2 times
Dividends (per share) 8 yen 3 yen + 5 yen 2.7times
< Unit Sales >
< Consolidated Income Statement, Dividends > (Billions of yen)
・Japan: Performance was better than expected owing to demand from post-earthquake reconstruction
demand, eco-car subsidy, and expansion of sales of the new light-duty truck among other factors.
・Overseas: Unit sales increased owing to solid domestic demand in emerging economies
e.g., Thailand and Indonesia.
1. Summary of the first half of fiscal 2013

5/14
2. Projections for fiscal 2013 as a whole <Recognition of the business climate>
Few signs suggestinga reversal for the better
Japan:
・Steady demand due to post-earthquake reconstruction
・End of eco-car subsidy
Japan:
・Steady demand due to post-earthquake reconstruction
・End of eco-car subsidy
【Current business climate】【【Current business climateCurrent business climate】】
Overseas:・Credit crisis in Europe and economic slowdown in China Concerns that these may have an effect on emerging economies
・Exchange rates (strong yen, weak euro)
Overseas:・Credit crisis in Europe and economic slowdown in China Concerns that these may have an effect on emerging economies
・Exchange rates (strong yen, weak euro)
Steer our business with close attention to external circumstances.Steer our business with close attention to external circumstances.

6/142. Forecasts for FY2013 as a whole
・Japan: The number of unit sales was updated to reflect the upturn in the first half.
・Overseas: The numbers vary from country to country but no change in total.
Forecast for FY13 FY12performance
Change (%)
Updated plan Previous plan Againstprevious plan
AgainstPrevious FY
Japan 40.0 39.0 36.9+ 1.0
(+2.6%)+3.1
(+ 8.4%)
Overseas 114.0 114.0 91.6-
(-)+ 22.4
(+ 24.5%)
Global 154.0 153.0 128.5+ 1.0
(+ 0.7%)+25.5
(+ 19.9%)
Toyota brand 185.1 178.5 153.3+ 6.6
(+ 3.7%)+ 31.8
(+ 20.8%)
< Unit Sales >
Forecast for FY13 FY12performance
Change (%)
Updated plan Previous plan Againstprevious plan
Againstprevious FY
Net sales 1,480.0 1,480.0 1,314.6-
(-)+ 165.4
(+ 12.6%)
Operating income 53.0 47.0 37.5+ 6.0
(+ 12.8%)+ 15.5
(+ 41.2%)
Net income 33.0 28.0 16.3+ 5.0
(+ 17.9%)+ 16.7
(2.0 times)
Dividends (per share) 16 yen 10 yen 8 yen (+60%) (2.0 times)
(Thousand units)
(Billions of yen)< Consolidated Income Statement, Dividends >

7/143. Mid-term corporate plan <Overview>
Mid-term corporate plan (announced in April 2012):
・Growth strategy centering on overseas markets
・Structural reforms and organizational improvements to achieve good profitability
in a rapidly changing business climate
Steadily engagedin the promotionof these pillars

8/143. Topic ① <Global production structure: Koga Plant>
Position of theKoga Plant
Position of theKoga Plant
➢ Modularized assembly of finished heavy- and medium-duty
vehicles
➣ Axle and propeller shaft assembly
➣ KD packing & export
➢ Modularized assembly of finished heavy- and medium-duty
vehicles
➣ Axle and propeller shaft assembly
➣ KD packing & export
➣ Heavy- and medium-duty vehicle
production base
➣ KD export base
➣ Heavy- and medium-duty vehicle
production base
➣ KD export base
Concept Roles
FY2013 FY2014 FY2015 FY2016 ~ 2021
Operationalimage
Operationalimage
KD packing
Units
・Production commenced in May 2012 (KDs for Thailand).
・Shipment of KDs for Indonesia began in October.
・Construction of an axle factory is scheduled to begin this FY.
・Production commenced in May 2012 (KDs for Thailand).
・Shipment of KDs for Indonesia began in October.
・Construction of an axle factory is scheduled to begin this FY.
Photographed on May 5, 2012
Vehicles

9/14
Are
afo
rexp
an
sio
n
・The factory is to be expanded onto adjacent property.A reserve contract for land has been signed.
・A differential gear center is to be constructed with productionprojected to begin in the first half of FY2015.
・Commencement of operations at the heavy-duty engine factoryis being considered for FY2016 or later.
3. Topic ② <Global production structure : Nitta Plant>
➣ Unit production basePosition ofthe Nitta
Plant
➢ Vertically integrated production of engines, transmissions, anddifferential carriers (casting, machining, and heat treatments)
➣ Base for supplying overseas facilities with rough molded
material made in-house
Concept Roles
Existing area
390,000㎡
Nitta Plant
Differential gears forheavy- and medium-dutyvehicles・ Machining・ Heat treatment・ Assembly
Consolidate.
Heavy-duty engines・ Machining・ Assembly
170,000㎡

10/143. Topic ③ <Global production structure : Malaysia>
Malaysia has grown into the 3rd pillar after Indonesia andThailand thanks primarily to growth in light-duty truck sales.
Malaysia has grown into the 3rd pillar after Indonesia andThailand thanks primarily to growth in light-duty truck sales.
Core regional production centers
Production structure in AsiaProduction structure in Asia
Othercountry
Othercountry
Malaysia
Japan
Global production structure(under establishment)
Global production structure(under establishment)
Production structure in Asia will beregionally enhanced centering aroundThailand and Indonesia.
Mutuallycomplementary
Self
Manufacturing
Secure supply capability.
Implement cost reduction.
Shorten lead times.
Establishes the manufacturing subsidiary "Hino Motors Manufacturing (Malaysia) Sdn. Bhd.”(previously outsourced)
Thailand Indonesia
0
5
10
FY08 FY09 FY10 FY11 FY12 FY13 (Plan)0
10
20
30
40Unit sales (Other than light-duty trucks)
Unit sales (Light-duty trucks)
Share in overall truck market (%)
(Thousand) (%)
Triple crownin the sharefor FY2012
(Light & Medium-duty trucks, Buses)

11/143. Topic ④ <Total support>
Examples(Japan)
Approaches to providing services that are true to what Hino stands for.
Laterally disseminate this expertise to overseas operations.
・Dr. Dutro visitation diagnostics services
Contribute tocustomers'businesses.
Improving servicequality
・Optimum placement of service centers(Actions in the first half:
Two relocated, one newly built)
Suggesting preventiveservicing
・Improving servicing efficiency
・ Increasing servicing lanes dedicated tolight-duty trucks
Better safetymanagement
・Safety support for customers(Accident prevention workshops:
About 300 scheduled to be held this FY)

12/14
HV
PHV EV
IPS
Basic performance(QDR)
FC
3. Topic ⑤ <Environmental technologies>
IPSIPS
Hino Dutro PHVDevelopment is moving forwardtowards commercialization.
Hino Poncho electric busBegan public service inSumida-ku and Hamura City inMarch 2012.
FCFC
PHVPHV
Inductive Power Supply hybrid busVerification tests were implemented thatwere timed for the 2011 Tokyo MotorShow.
FC busCollaborative development withToyota Motors with a projectedmarket launch in 2016.
Vision: ◆To respond to increasingly heightened awareness and needs regardingthe environment through state-of-the-art technology
◆To commercialize next-generation environmental technologies with HV at the core
HVHV
Hino Dutro Hybrid
EVEV

13/14
【The 3 headwinds】①Slowdown in global economic growth.
⇒ Slower growth of demand for commercial vehicles.②An entrenched strong yen.
⇒ Ongoing challenges with regard to price competitiveness.③Intensifying competition in ASEAN countries.
⇒ Global manufacturers also entering the market, which will lead to massive competition.
Projections <Recognition of the business climate>
Exercising caution in steeringthe company and responding flexibly
to changes in the business climate
Hino's actionsSolid implementation and promotion
of structural reforms andorganizational improvements
・Pay close attention to trendsin Japan and overseas.
・Make investments in smaller tranches.・Increase flexibility in production
operations.
・Further enhancement of product capabilities:- Expand market-best fit vehicles.
・Strengthening of total support:- Expedite the expansion of service operations that
are true to what Hino stands for.
・ Establishing global production structure:- Reform the manufacturing process through modularization.- Create core regional production centers.
Strengthening of marketdevelopment efforts
Africa
Establish a stableprofit foundation.

14/14
"HINO Dream Truck & Bus Art Contest"
Hino Motors Sales (Thailand) Ltd. is alsocelebrating its 50th anniversary.
PT. Hino Motors Manufacturing Indonesiais also celebrating its 30th anniversary.

1/17IR
Senior Managing Director
Akimasa Yamamoto
Senior Managing Director
Akimasa Yamamoto
Financial Results for
Second Quarter of FY2013(From April 1, 2012 to September 30, 2012)
Financial Results forFinancial Results for
Second Quarter of FY2013Second Quarter of FY2013(From April 1, 2012 to September 30, 2012)(From April 1, 2012 to September 30, 2012)
October 25, 2012
Hino Motors, Ltd.
October 25, 2012
Hino Motors, Ltd.

2/17IR
1. Sales Turnover

3/17IR
Global Unit Sales
(Units)
FY20131st Half
('12/4-9)
FY20121st Half
('11/4-9)Change Change (%)
Japan 19,618 15,181 +4,437 +29.2%
Asia 37,223 26,645 +10,578 +39.7%Central and SouthAmerica 5,911 5,331 +580 +10.9%
North America 4,256 2,779 +1,477 +53.1%
Europe/Africa 4,176 2,966 +1,210 +40.8%
Oceania 2,623 1,992 +631 +31.7%
Middle East 1,882 1,281 +601 +46.9%
Overseas Total 56,071 40,994 +15,077 +36.8%
Total 75,689 56,175 +19,514 +34.7%
By
Geo
gra
ph
icR
eg
ion

4/17IR
Truck and Bus Market in Japan
(Units)
FY20131st Half('12/4-9)
FY20121st Half('11/4-9)
Change Change (%)
Heavy-duty trucks 5,682 4,342 +1,340 +30.9%(share) (31.6%) (34.6%) (-3.0p)
Medium-duty trucks 5,183 5,176 +7 +0.1%(share) (37.2%) (46.2%) (-9.0p)
Total heavy- and
medium-duty trucks10,865 9,518 +1,347 +14.2%
(share) (34.0%) (40.1%) (-6.1p)
Light-duty trucks 7,651 4,852 +2,799 +57.7%(share) (20.7%) (18.1%) (+2.6p)
Buses 1,102 811 +291 +35.9%(share) (30.0%) (29.3%) (+0.7p)
Total 19,618 15,181 +4,437 +29.2%(share) (27.1%) (28.5%) (-1.4p)
Heavy-duty trucks 17,986 12,565 +5,421 +43.1%Medium-duty trucks 13,941 11,197 +2,744 +24.5%
Total heavy- and
medium-duty trucks31,927 23,762 +8,165 +34.4%
Light-duty trucks 36,905 26,823 +10,082 +37.6%Buses 3,675 2,767 +908 +32.8%
Total 72,507 53,352 +19,155 +35.9%
Hin
oR
eg
iste
red
Jap
an
Mark
et

5/17IR
2. Consolidated Financial Results

6/17IR
Consolidated Unit Sales
(Units)
FY2013
1st Half
('12/4-9)
FY2012
1st Half
('11/4-9)Change Change (%)
20,261 16,042 +4,219 +26.3%
36,005 25,687 +10,318 +40.2%
6,447 4,771 +1,676 +35.1%
5,113 2,412 +2,701 2.1 times
4,665 2,224 +2,441 2.1 times
2,636 1,855 +781 +42.1%
1,701 1,282 +419 +32.7%
56,567 38,231 +18,336 +48.0%
76,828 54,273 +22,555 +41.6%
Supplies and parts for
overseas production3,466 1,902 +1,564 +82.2%
80,294 56,175 +24,119 +42.9%
Overseas Total
Total
Total
By
Geo
gra
ph
icR
eg
ion
Japan
Asia
Central and South
America
North America
Europe/Africa
Oceania
Middle East

7/17IR
Toyota Brand Vehicles and Engines
(Units)
FY2013
1st Half('12/4-9)
FY2012
1st Half('11/4-9)
Change Change (%)
SUV 62,922 47,453 +15,469 +32.6%
22,817 15,721 +7,096 +45.1%
Total 85,739 63,174 +22,565 +35.7%
(Units)
FY2013
1st Half
('12/4-9)
FY2012
1st Half
('11/4-9)Change Change (%)
6,204 7,511 -1,307 -17.4%
9,428 11,270 -1,842 -16.3%
Total 15,632 18,781 -3,149 -16.8%
* Engines are Hino shipment base.
En
gin
es
To
yo
taB
ran
d
Japan
Overseas
Loading Vehicles

8/17IR
Consolidated Income Statement
(Billions of yen)
ItemFY20131st Half
('12/4-9)
FY20121st Half
('11/4-9)
Change Change (%)
Net sales 745.4 575.7 +169.7 +29.5%<4.0%> <2.6%> <+1.4p>
Operating income 29.7 14.9 +14.8 +99.3%Non-operating income
(loss)(1.1) (1.8) +0.7 -
Investment gain (loss)
on equity method (0.5) (0.7) +0.2 -
<3.8%> <2.2%> <+1.6p>
Ordinary income 28.1 12.4 +15.7 2.3 timesExtraordinary income 0.8 0.2 +0.6 4.0 timesExtraordinary loss 1.3 6.6 -5.3 -80.3%
<3.7%> <1.0%> <+2.7p>Net income
before income taxes and
minority interests27.6 6.0 +21.6 4.6 times
<2.5%> <0.1%> <+2.4p>
Net income 18.5 0.6 +17.9 31.2 timesNote: Figures in parentheses (<>) indicate income margin.

9/17IR
Consolidated Net Sales
(Billions of yen)
FY2013
1st Half
('12/4-9)
FY2012
1st Half
('11/4-9)
Change Change (%)
Heavy-duty trucks 69.4 55.5 +13.9 +25.0%Medium-duty trucks 28.4 27.9 +0.5 +2.1%
Total heavy- and
medium-duty trucks97.8 83.4 +14.4 +17.4%
Light-duty trucks 27.9 17.7 +10.2 +57.2%Buses 18.6 12.6 +6.0 +48.0%
Subtotal 144.3 113.7 +30.6 +27.0%
Completed vehicles 210.4 143.5 +66.9 +46.6%Supplies and parts for
overseas production2.7 1.4 +1.3 +87.3%
Subtotal 213.1 144.9 +68.2 +47.0%
357.4 258.6 +98.8 +38.2%40.1 38.1 +2.0 +5.3%85.6 87.0 -1.4 -1.6%
Vehicles 182.5 137.1 +45.4 +33.1%Overseas unit supply
business 63.1 41.9 +21.2 +50.7%
Others 16.7 13.0 +3.7 +28.2%Subtotal 262.3 192.0 +70.3 +36.6%
745.4 575.7 +169.7 +29.5%
Ja
pa
nO
vers
eas
Total trucks and buses
Service parts
Others
To
yo
ta
Total net sales

10/17IR
Consolidated Operating Income (Loss) by Segments
(Billions of yen)
Net salesOperating
income (loss)Net sales
Operating
income (loss)Net sales
Operating
income (loss)
<3.5%> <1.8%> +26.0% 2.5 times
Japan 605.4 21.2 480.4 8.4 +125.0 +12.8
<4.2%> <4.8%> +38.7% +20.0%
Asia 204.7 8.5 147.6 7.1 +57.1 +1.4
<2.0%> <-1.4%> +68.1% -
70.8 1.4 42.1 (0.6) +28.7 +2.0
Consolidated
adjustment (135.5) (1.4) (94.4) (0.0) -41.1 -1.4
<4.0%> <2.6%> +29.5% +99.3%
Total 745.4 29.7 575.7 14.9 +169.7 +14.8
Other Areas
FY2013
1st Half
('12/4-9)
FY2012
1st Half
('11/4-9)
Change
Note: Figures in parentheses (<>) indicate operating income (loss) margin.
Percentages in the column "Change" indicate year-on- year change.

11/17IR
Analysis of Consolidated Operating Income
Increase in operating income: ¥14.8 billion (¥14.9 billion to ¥29.7 billion)Increase in operating income: ¥14.8 billion (¥14.9 billion to ¥29.7 billion) (Billions of yen)

12/17IR
Trends in the Quarterly Consolidated Sales and Operating Income
SalesSales
Operating IncomeOperating Income
15
10
5
0
20
400
300
200

13/17IR
3. Sales Forecastsfor FY2013

14/17IR
Global Unit Sales
(Thousand units)
FY2013
('12/4-'13/3)Forecasts
announced at
this time
FY2012('11/4-'12/3)
Results
Change Change(%)
FY2013
('12/4-'13/3)Forecasts
announced
on April 26
Change Change(%)
40.0 36.9 +3.1 +8.4% 39.0 +1.0 +2.6%
114.0 91.6 +22.4 +24.5% 114.0 - -
154.0 128.5 +25.5 +19.9% 153.0 +1.0 +0.7%
185.1 153.3 +31.8 +20.8% 178.5 +6.6 +3.7%
*Including Dyna for Indonesia.
Japan
Overseas
Total
Toyotabrand (*)

15/17IR
4. Consolidated Financial Forecastsfor FY2013

16/17IR
Consolidated Income Statement
(Billions of yen)
Item
FY2013
('12/4-'13/3)
Forecasts
announced at
this time
FY2012
('11/4-'12/3)
Results
Change Change(%)
FY2013
('12/4-'13/3)
Forecasts
announced on
April 26
Change Change(% )
1,480.0 1,314.6 +165.4 +12.6% 1,480.0 - -
<3.6%> <2.9%> <+0.7p> <3.2%> <+0.4p>
53.0 37.5 +15.5 +41.2% 47.0 +6.0 +12.8%
<3.4%> <2.6%> <+0.8p> <3.0%> <+0.4p>
50.0 34.6 +15.4 +44.6% 45.0 +5.0 +11.1%
<2.2%> <1.2%> <+1.0p> <1.9%> <+0.3p>
33.0 16.3 +16.7 2.0 times 28.0 +5.0 +17.9%Note: Figures in parentheses (<>) indicate income margin.
Net sales
Operating income
Ordinary income
Net income

17/17IR
Analysis of Consolidated Operating Income(Year-on-year comparison)
Increase in operating income: ¥15.5 billion (¥37.5 billion to ¥53.0 billion)Increase in operating income: ¥15.5 billion (¥37.5 billion to ¥53.0 billion)(Billions of yen)
![Conference Call Results Q2 2015 - GEA engineering … Group Conference Call...Q2 12 Q3 12 Q4 12 Q1 13 Q2 13 Q3 13 Q4 13 Q1 14 Q2 14 Q3 14 Q4 14 Q1 15 Q2 15 [EURm] 1.06 1.05 1.07 1.05](https://img.pdfslide.net/doc/110x75/5f308a5968effd5a733a4c31/conference-call-results-q2-2015-gea-engineering-group-conference-call-q2-12.jpg)