Embed Size (px)
Citation preview
12-1
Activity-Activity-Based Based
CostingCosting
Prepared by Douglas Cloud
Pepperdine University
Prepared by Douglas Cloud
Pepperdine University
12-2
1. Discuss the limitations of using only unit-based drivers to assign costs.
2. Provide a detailed description of activity-based product costing.
3. Explain how homogenous cost pools can be used to reduce the number of activity rates.
4. Describe activity-based system concepts including an ABC relational database and ABC software.
ObjectivesObjectivesObjectivesObjectives
After studying this After studying this chapter, you should chapter, you should
be able to:be able to:
After studying this After studying this chapter, you should chapter, you should
be able to:be able to:
12-3
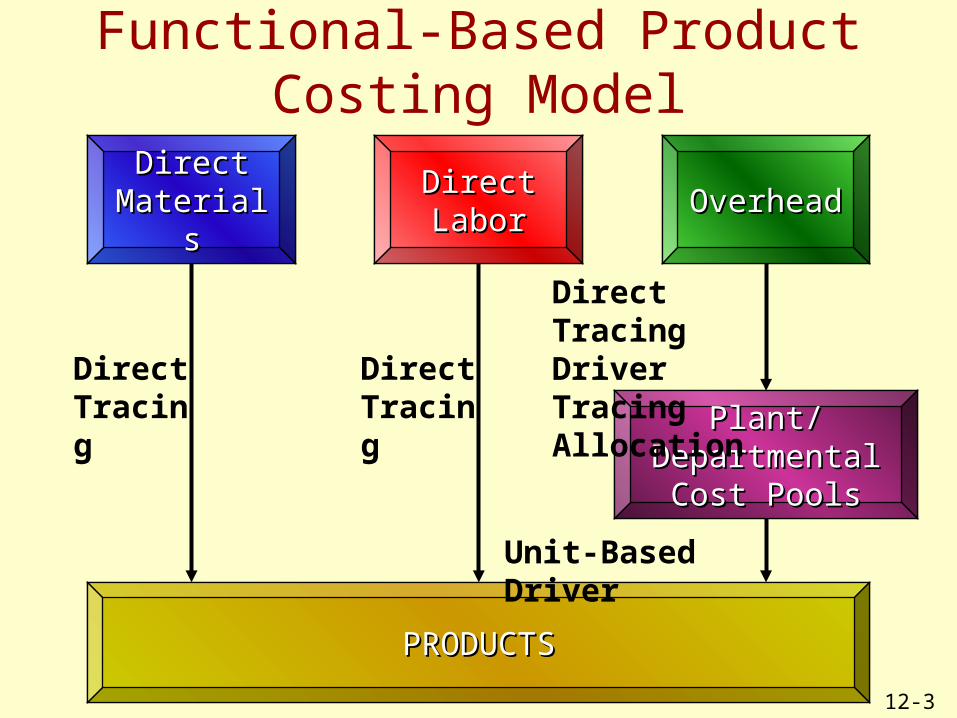
Functional-Based ProductCosting Model
Direct Direct MaterialsMaterials
Direct Direct LaborLabor
OverheadOverhead
PRODUCTSPRODUCTS
Direct Tracing
Direct Tracing
Plant/Departmental Plant/Departmental Cost PoolsCost Pools
Direct Tracing Driver Tracing Allocation
Unit-Based Driver
12-4
Goodmark Company—An ExampleGoodmark Company—An Example
Goodmark Company produces two products: scented and regular birthday cards.

12-5
Goodmark Company—An ExampleGoodmark Company—An Example
Scented Cards Regular Cards TotalScented Cards Regular Cards Total
Unit produced per year 20,000 200,000 --Prime costs $160,000 $1,500,000 $1,660,000Direct labor hours 20,000 160,000 180,000Number of setups 60 40 100Machine hours 10,000 80,000 90,000Inspection hours 2,000 16,000 18,000Number of moves 180 120 300
Product Costing DataProduct Costing Data
12-6
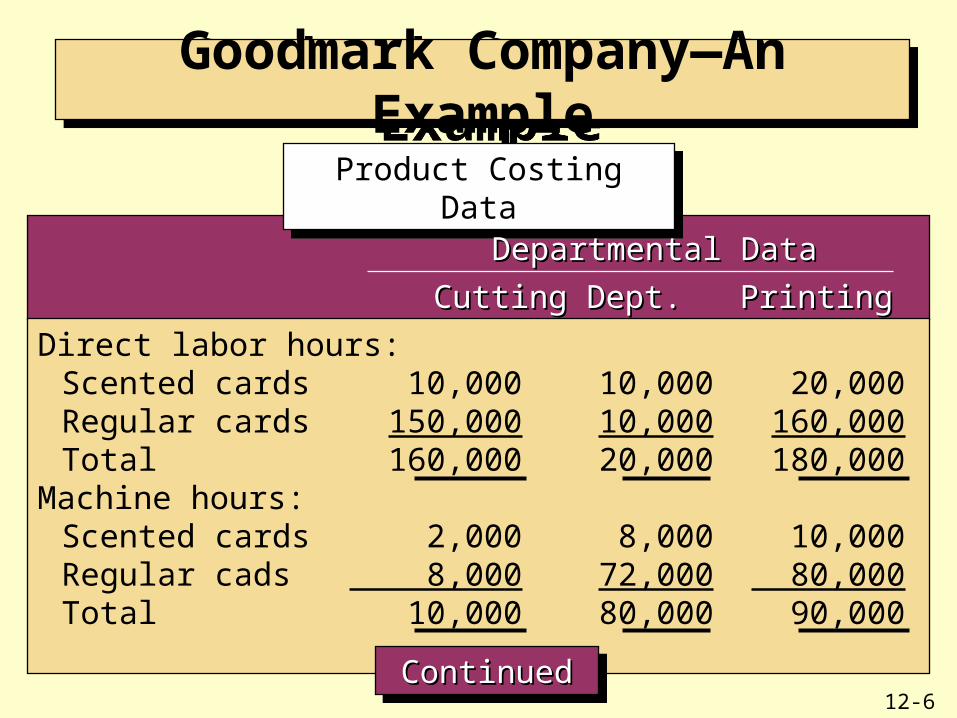
Goodmark Company—An ExampleGoodmark Company—An Example
Cutting Dept. Printing Dept. TotalCutting Dept. Printing Dept. Total
Direct labor hours:Scented cards 10,000 10,000 20,000Regular cards 150,000 10,000 160,000Total 160,000 20,000 180,000
Machine hours:Scented cards 2,000 8,000 10,000Regular cads 8,000 72,000 80,000Total 10,000 80,000 90,000
Product Costing DataProduct Costing Data
Departmental DataDepartmental Data
ContinuedContinuedContinuedContinued
12-7
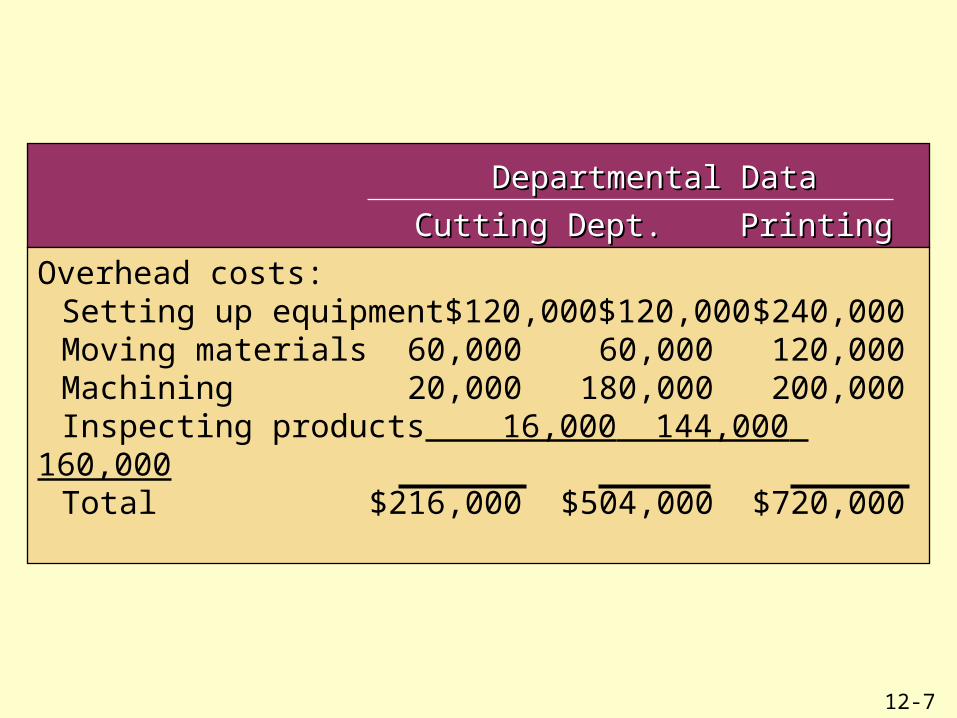
Cutting Dept. Printing Dept. TotalCutting Dept. Printing Dept. Total
Overhead costs:Setting up equipment $120,000 $120,000 $240,000Moving materials 60,000 60,000 120,000Machining 20,000 180,000 200,000Inspecting products 16,000 144,000 160,000Total $216,000 $504,000 $720,000
Departmental DataDepartmental Data
12-8
Goodmark Company—An ExampleGoodmark Company—An Example
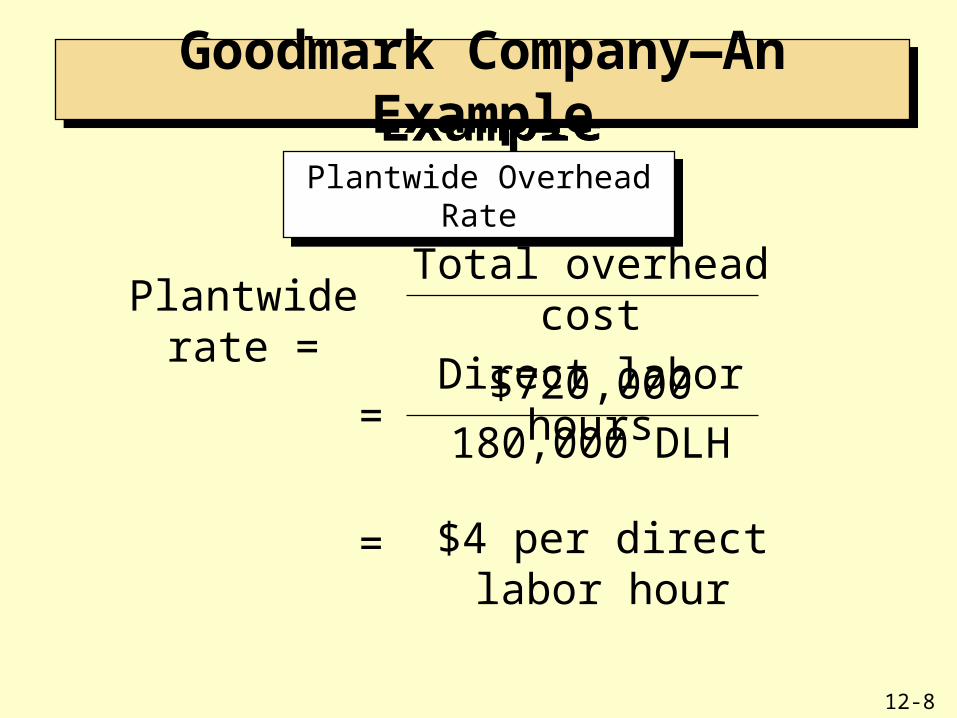
Plantwide Overhead RatePlantwide Overhead Rate
Plantwide rate =Total overhead cost
Direct labor hours
=$720,000
180,000 DLH
= $4 per direct labor hour
12-9
Goodmark Company—An ExampleGoodmark Company—An Example
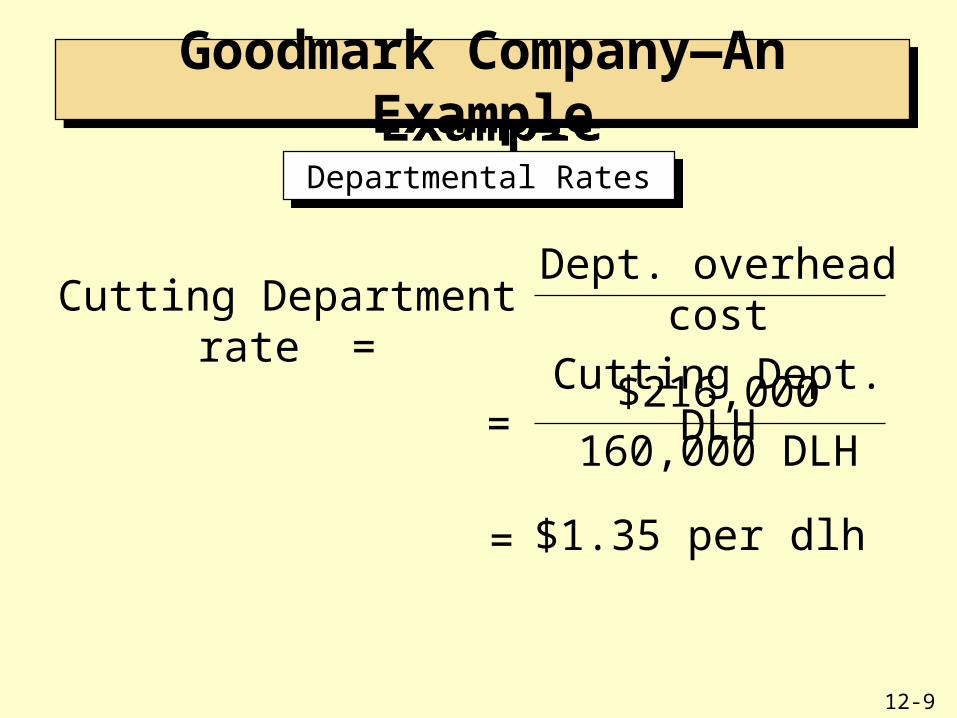
Departmental RatesDepartmental Rates
Cutting Department rate =Dept. overhead cost
Cutting Dept. DLH
=$216,000
160,000 DLH
= $1.35 per dlh
12-10
Goodmark Company—An ExampleGoodmark Company—An Example
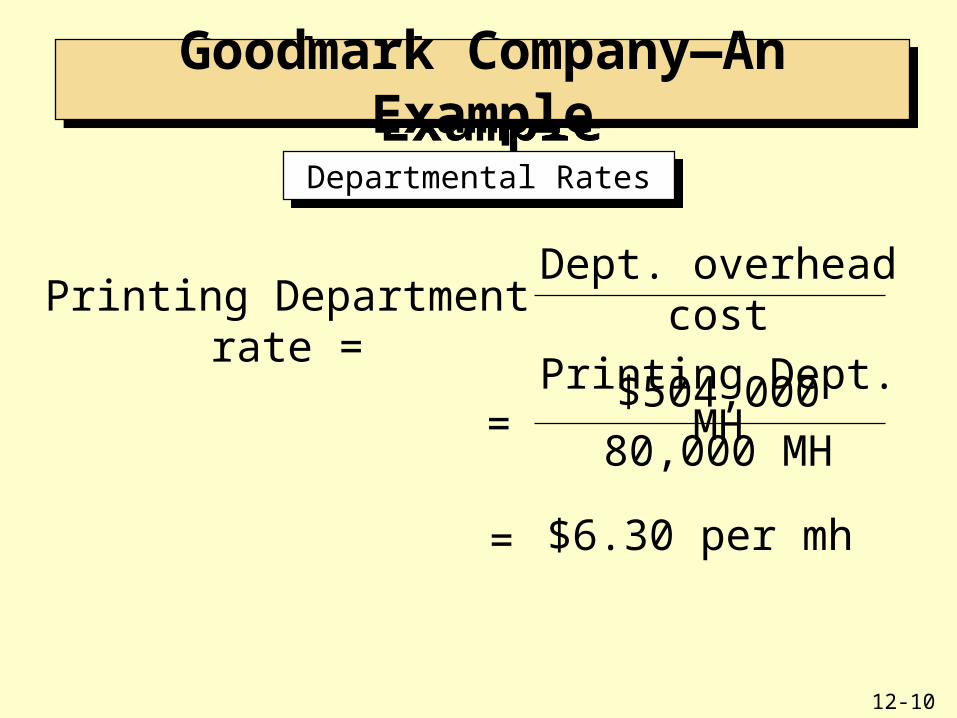
Departmental RatesDepartmental Rates
Printing Department rate =Dept. overhead cost
Printing Dept. MH
=$504,000
80,000 MH
= $6.30 per mh
12-11
Goodmark Company—An ExampleGoodmark Company—An Example
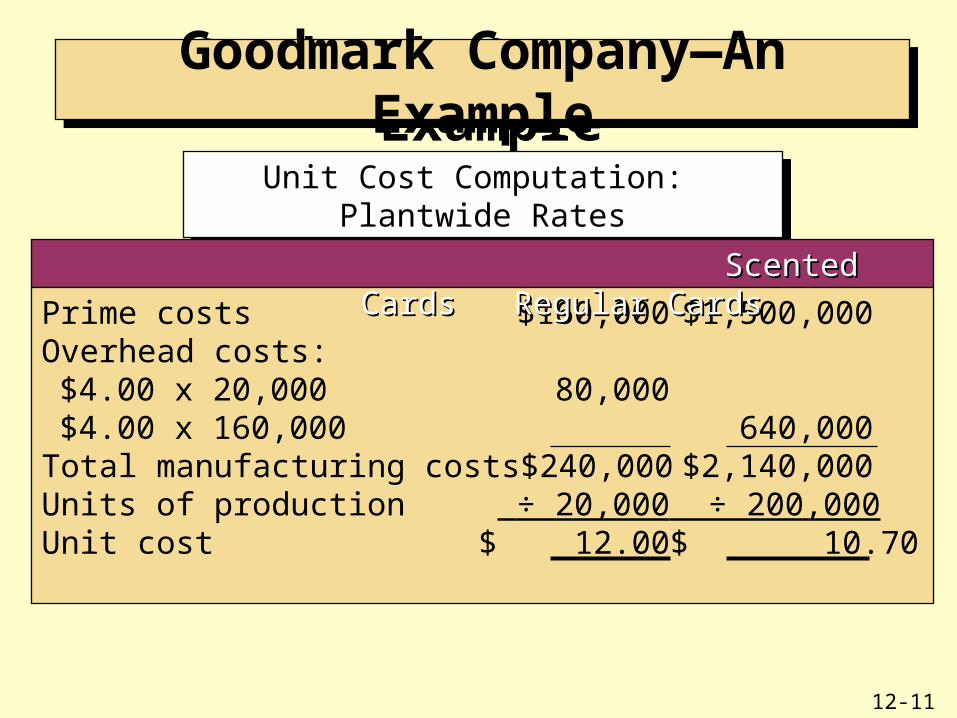
Unit Cost Computation: Plantwide RatesUnit Cost Computation: Plantwide Rates
Prime costs $160,000 $1,500,000Overhead costs:
$4.00 x 20,000 80,000$4.00 x 160,000 640,000
Total manufacturing costs $240,000 $2,140,000Units of production ÷ 20,000 ÷ 200,000Unit cost $ 12.00 $ 10.70
Scented Cards Regular CardsScented Cards Regular Cards

12-12
Goodmark Company—An ExampleGoodmark Company—An Example
Unit Cost Computation: Departmental RatesUnit Cost Computation: Departmental Rates
Scented Cards Regular CardsScented Cards Regular Cards
Prime costs $160,000 $1,500,000Overhead costs:
[($1.35 x 10,000) + ($6.30 x 8,000)] 63,900[($2.35 x 150,000) + ($6.30 x 72,000)] 656,100
Total manufacturing costs $223,900 $2,156,100Units of production ÷ 20,000 ÷ 200,000Unit cost $ 11.20 $ 10.78*
*Rounded to nearest cent
*
12-13
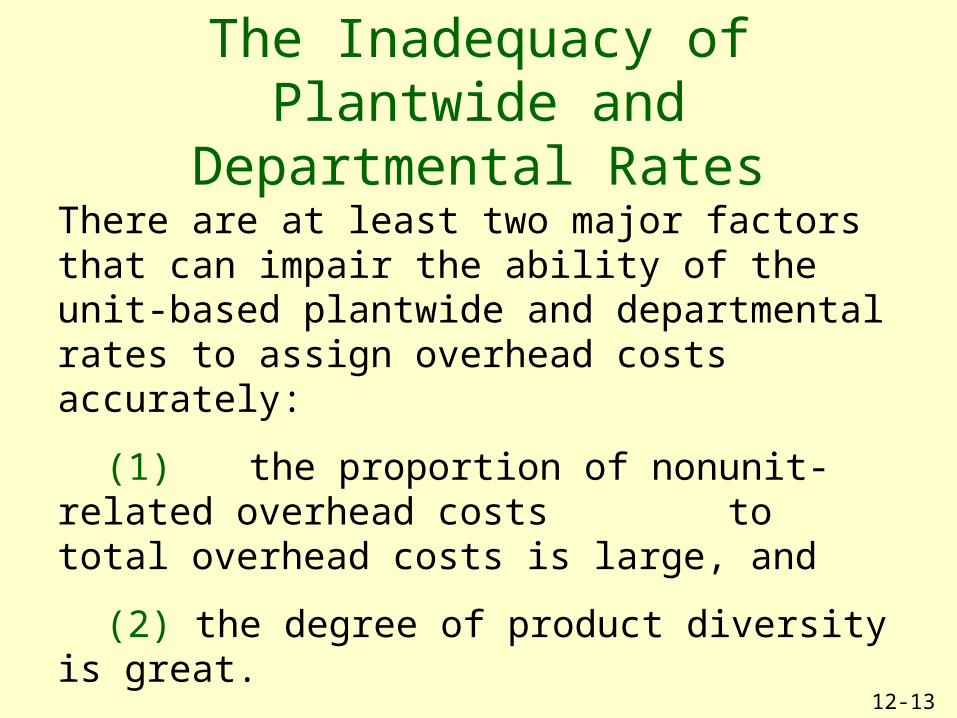
The Inadequacy of Plantwide and Departmental Rates
There are at least two major factors that can impair the ability of the unit-based plantwide and departmental rates to assign overhead costs accurately:
(1) the proportion of nonunit-related overhead costs to total overhead costs is large, and
(2) the degree of product diversity is great.
12-14
Goodmark Company—An ExampleGoodmark Company—An Example
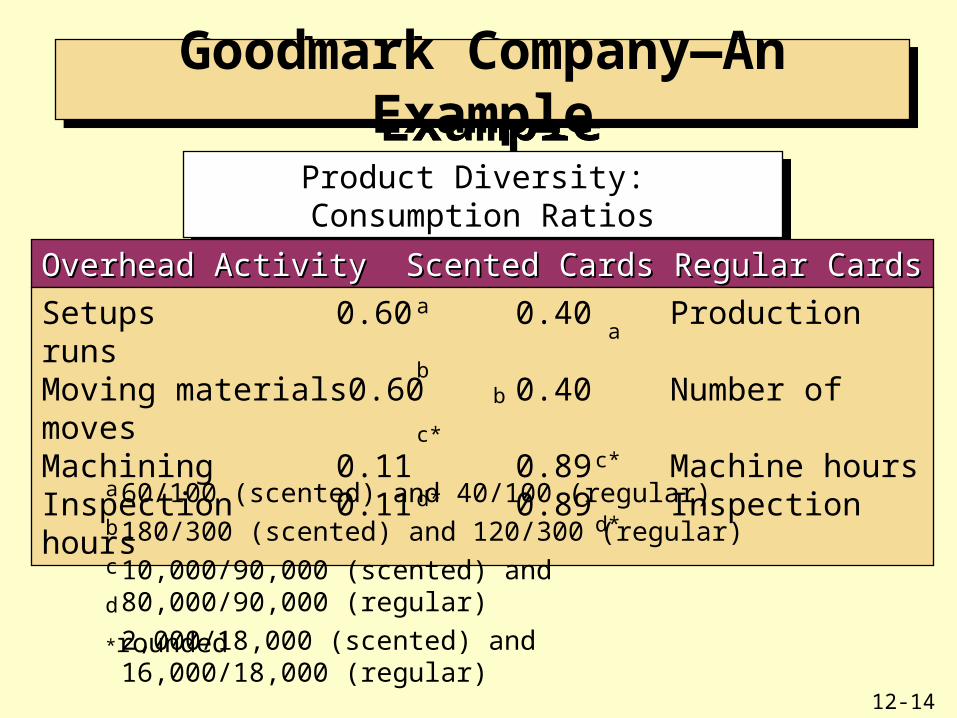
Product Diversity: Consumption RatiosProduct Diversity: Consumption Ratios
Overhead Activity Scented Cards Regular Cards Activity DriversOverhead Activity Scented Cards Regular Cards Activity Drivers
Setups 0.60 0.40 Production runsMoving materials 0.60 0.40 Number of movesMachining 0.11 0.89 Machine hoursInspection 0.11 0.89 Inspection hours
a a
b b
c* c*
d* d*
a
b
c
d
60/100 (scented) and 40/100 (regular)
180/300 (scented) and 120/300 (regular)
10,000/90,000 (scented) and 80,000/90,000 (regular)
2,000/18,000 (scented) and 16,000/18,000 (regular)*rounded
12-15
Goodmark Company—An ExampleGoodmark Company—An Example
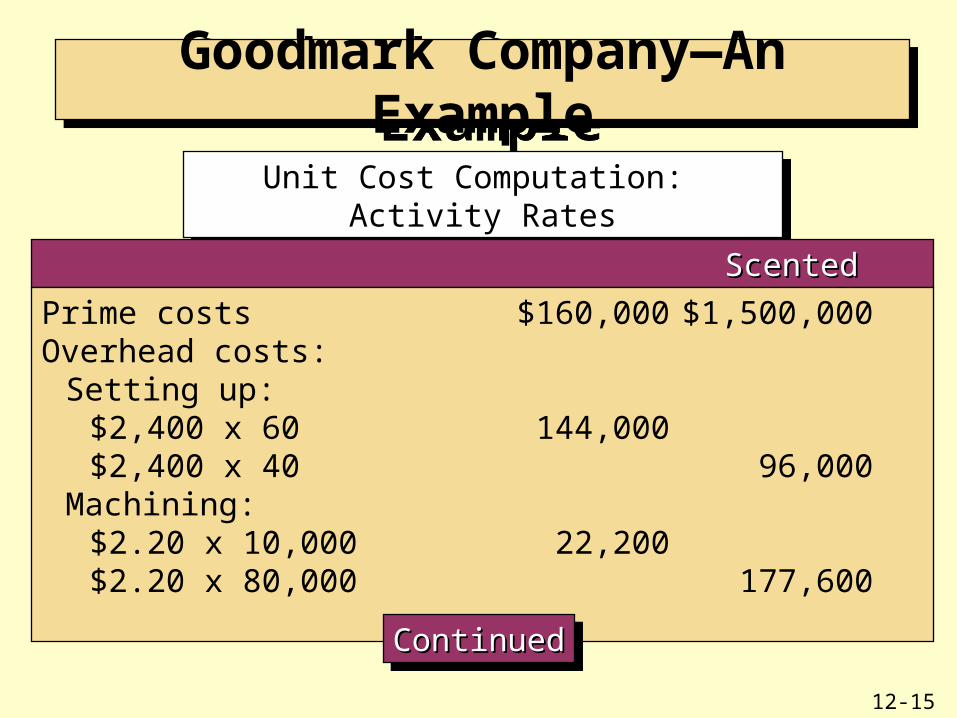
Unit Cost Computation: Activity RatesUnit Cost Computation: Activity Rates
Scented Cards Regular CardsScented Cards Regular Cards
Prime costs $160,000 $1,500,000Overhead costs:
Setting up:$2,400 x 60 144,000$2,400 x 40 96,000
Machining:$2.20 x 10,000 22,200$2.20 x 80,000 177,600
ContinuedContinuedContinuedContinued
12-16
Scented Cards Regular CardsScented Cards Regular Cards
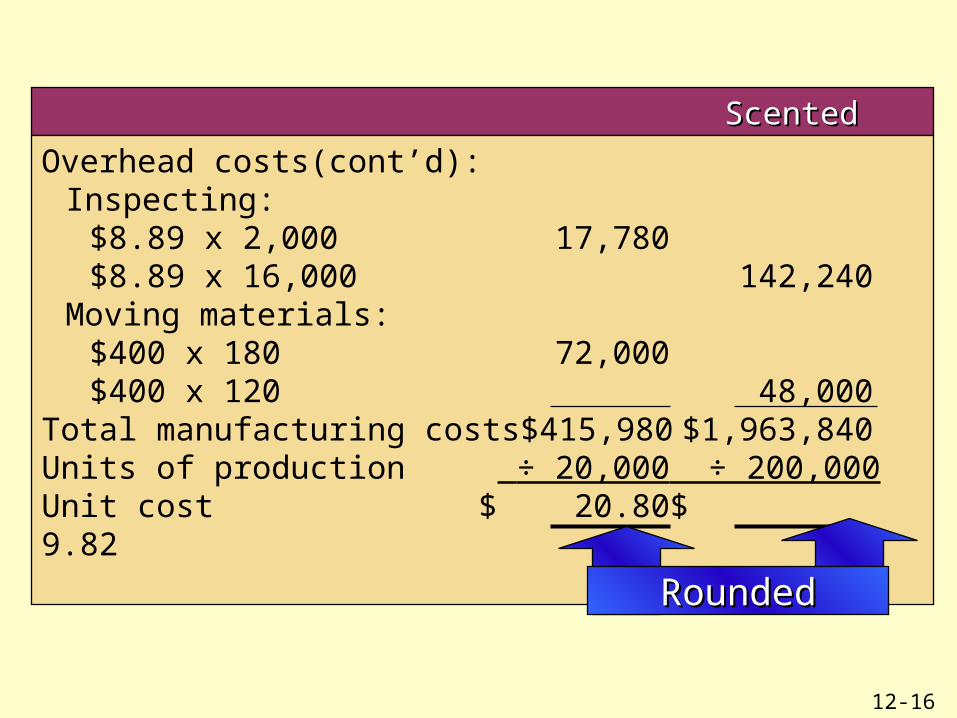
Overhead costs(cont’d):Inspecting:
$8.89 x 2,000 17,780$8.89 x 16,000 142,240
Moving materials:$400 x 180 72,000$400 x 120 48,000
Total manufacturing costs $415,980 $1,963,840Units of production ÷ 20,000 ÷ 200,000Unit cost $ 20.80 $ 9.82
RoundedRounded
12-17
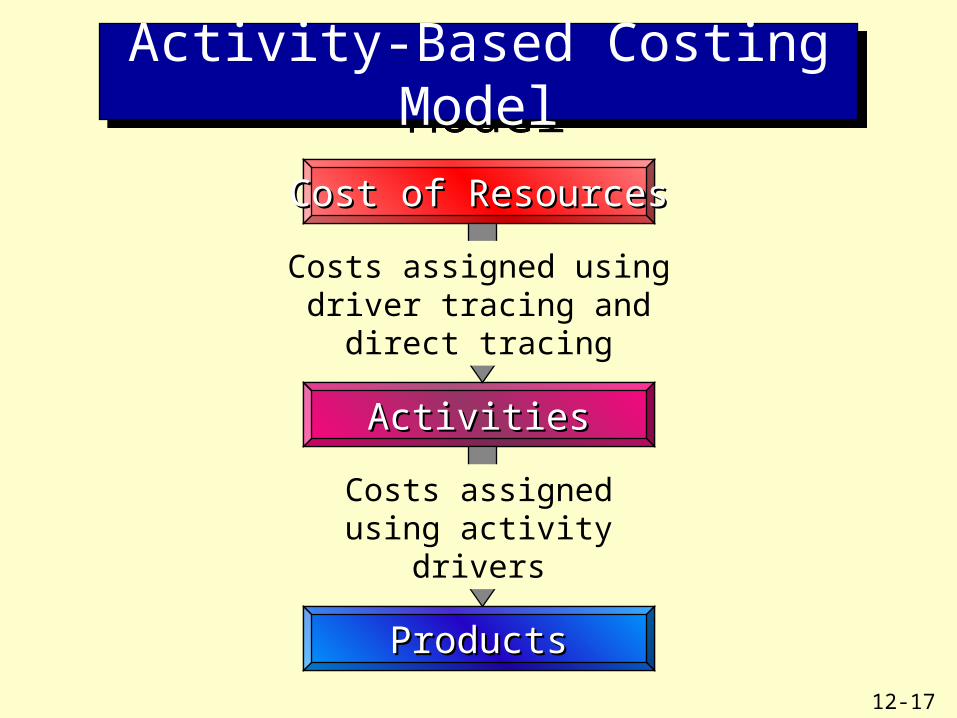
Activity-Based Costing ModelActivity-Based Costing Model
Cost of ResourcesCost of Resources
ActivitiesActivities
Costs assigned using driver tracing and direct tracing
ProductsProducts
Costs assigned using activity drivers
12-18
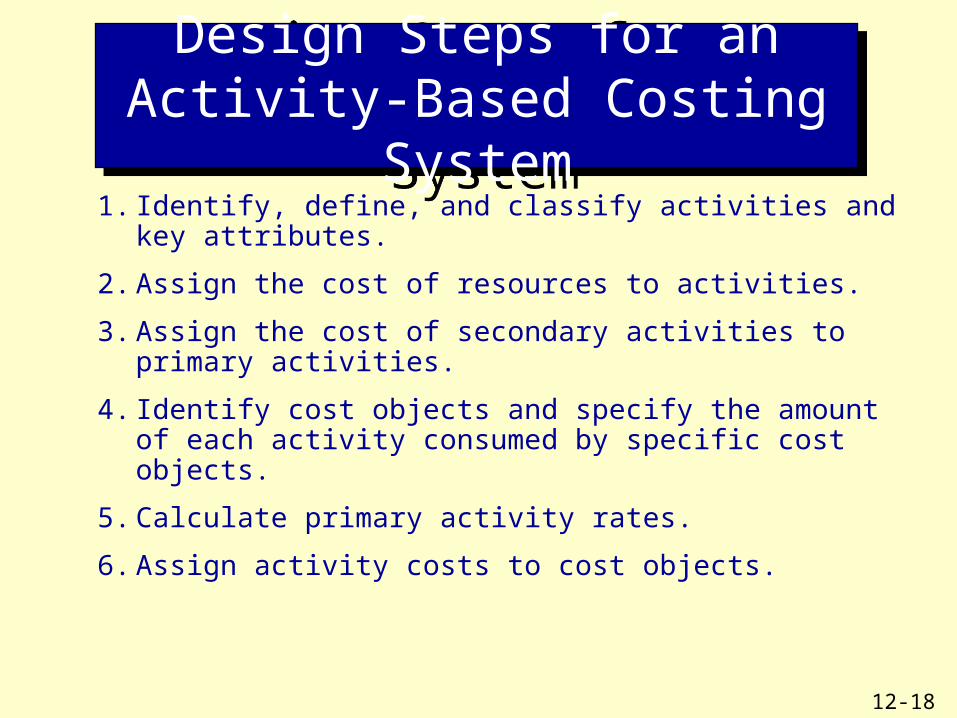
1. Identify, define, and classify activities and key attributes.
2. Assign the cost of resources to activities.
3. Assign the cost of secondary activities to primary activities.
4. Identify cost objects and specify the amount of each activity consumed by specific cost objects.
5. Calculate primary activity rates.
6. Assign activity costs to cost objects.
Design Steps for an Activity-Based Costing System
Design Steps for an Activity-Based Costing System
12-19
A primary activity is an activity that is consumed by a final cost object such as a product or customer.
A secondary activity is one that is consumed by intermediate cost objects such as primary activities, materials, or other secondary activities.
Activity-Based CostingActivity-Based Costing
12-20
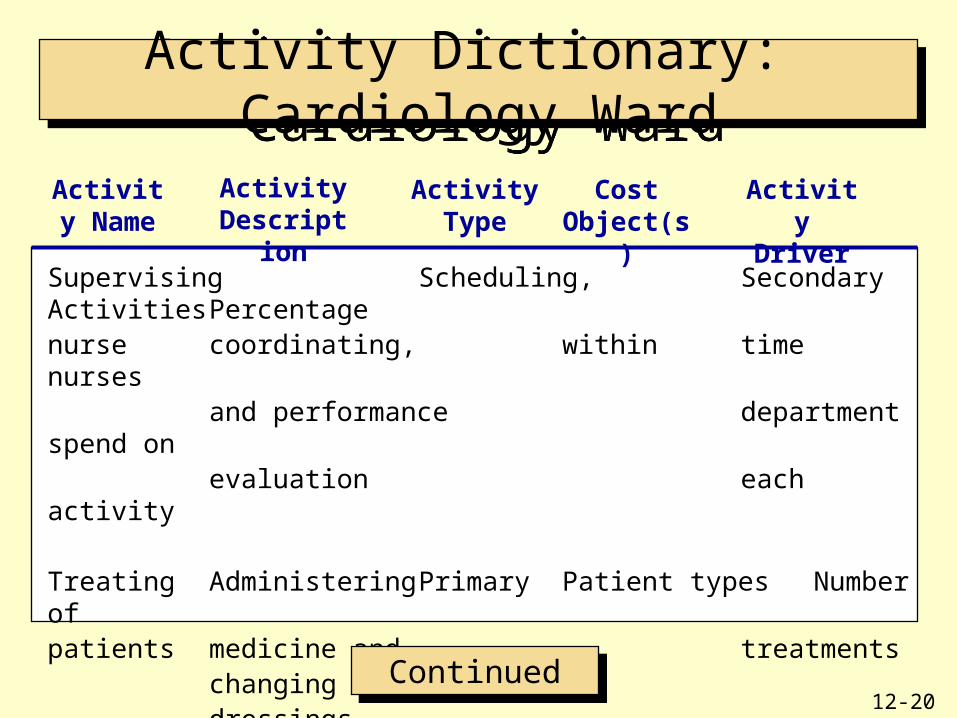
Activity Dictionary: Cardiology WardActivity Dictionary: Cardiology Ward
Supervising Scheduling, Secondary Activities Percentagenurse coordinating, within time nurses
and performance department spend onevaluation each activity
Treating Administering Primary Patient types Number ofpatients medicine and treatments
changingdressings
Activity Name
Activity Description
Activity Type
Cost Object(s)
Activity Driver
ContinuedContinued
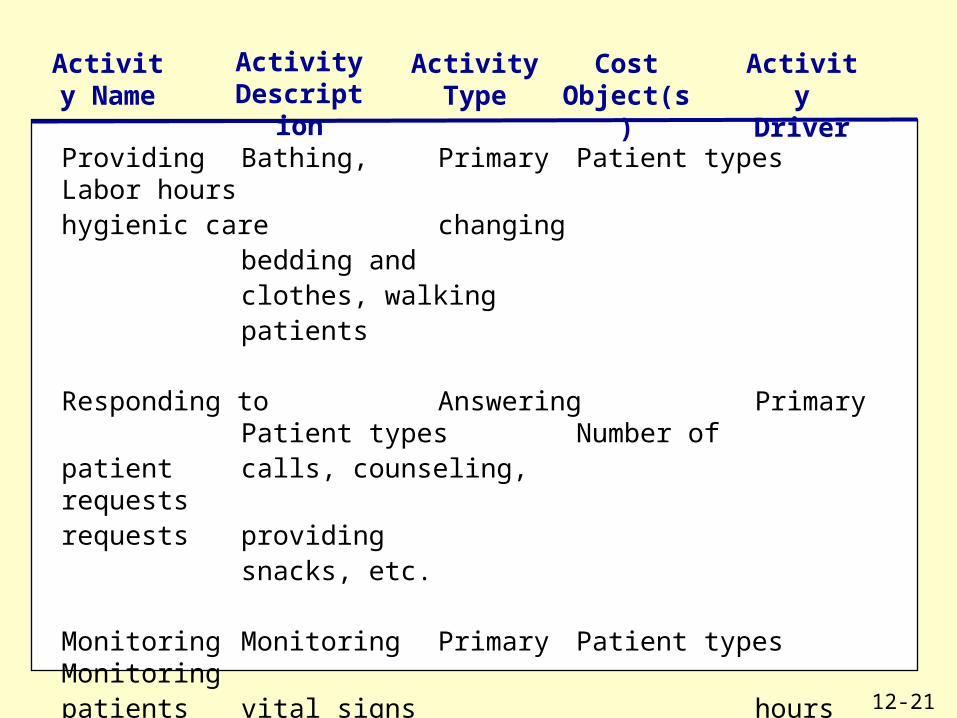
12-21
Activity Name
Activity Description
Activity Type
Cost Object(s)
Activity Driver
Providing Bathing, Primary Patient types Labor hourshygienic care changing
bedding andclothes, walkingpatients
Responding to Answering Primary Patient types Number ofpatient calls, counseling, requestsrequests providing
snacks, etc.
Monitoring Monitoring Primary Patient types Monitoringpatients vital signs hours
and postingpatient information
12-22
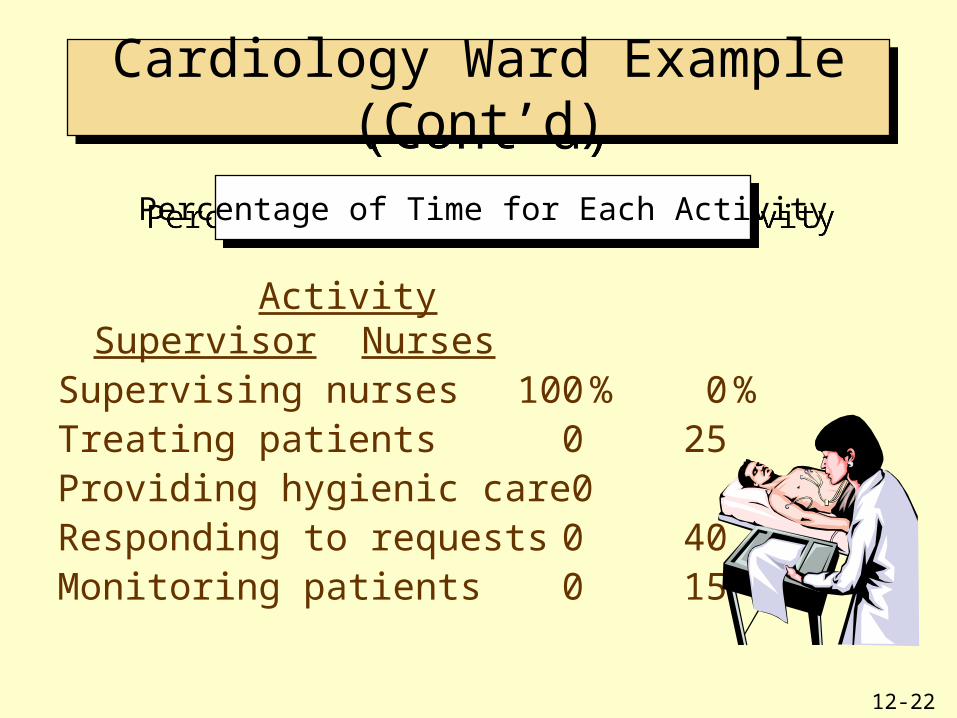
Cardiology Ward Example (Cont’d)Cardiology Ward Example (Cont’d)
Activity Supervisor NursesSupervising nurses 100 % 0 %Treating patients 0 25Providing hygienic care 0 20Responding to requests 0 40Monitoring patients 0 15
Percentage of Time for Each ActivityPercentage of Time for Each Activity
12-23
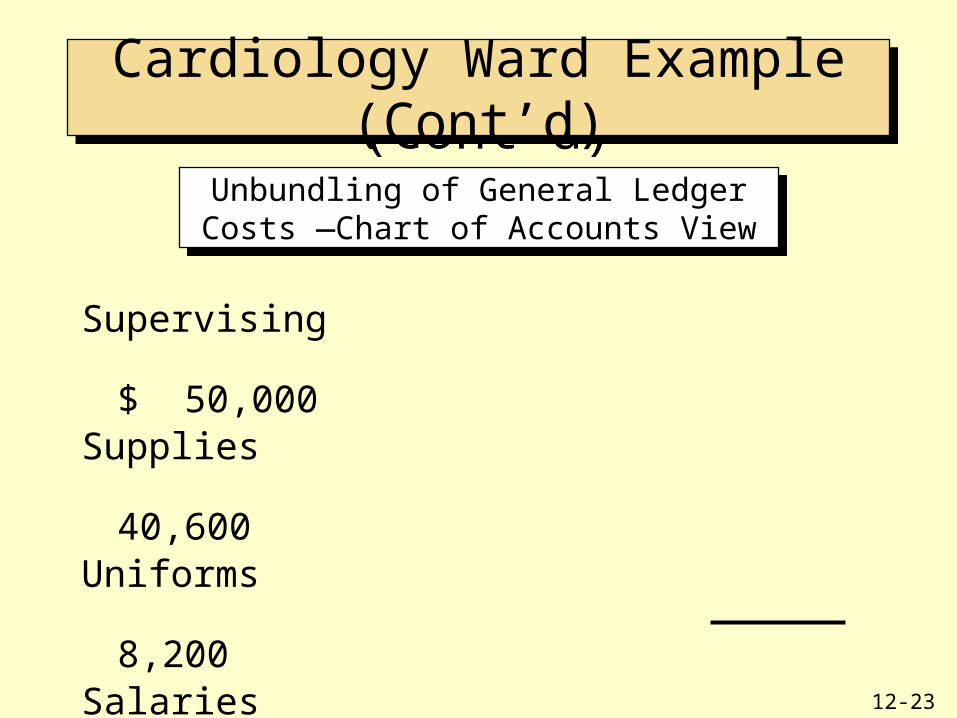
Unbundling of General Ledger Costs —Chart of Accounts View
Unbundling of General Ledger Costs —Chart of Accounts View
Supervising
$ 50,000Supplies
40,600Uniforms
8,200Salaries
300,000Computer
1,200Monitor
80,000 Total
$480,000
Cardiology Ward Example (Cont’d)Cardiology Ward Example (Cont’d)
12-24
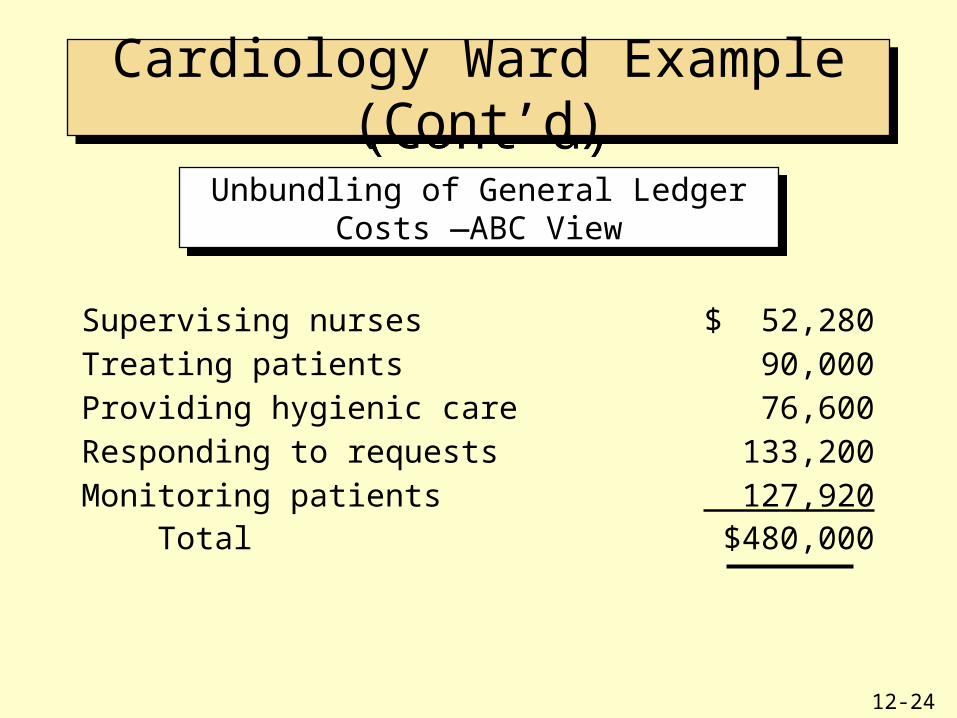
Unbundling of General Ledger Costs —ABC View
Unbundling of General Ledger Costs —ABC View
Supervising nurses $ 52,280
Treating patients 90,000
Providing hygienic care 76,600
Responding to requests 133,200
Monitoring patients 127,920 Total $480,000
Cardiology Ward Example (Cont’d)Cardiology Ward Example (Cont’d)
12-25
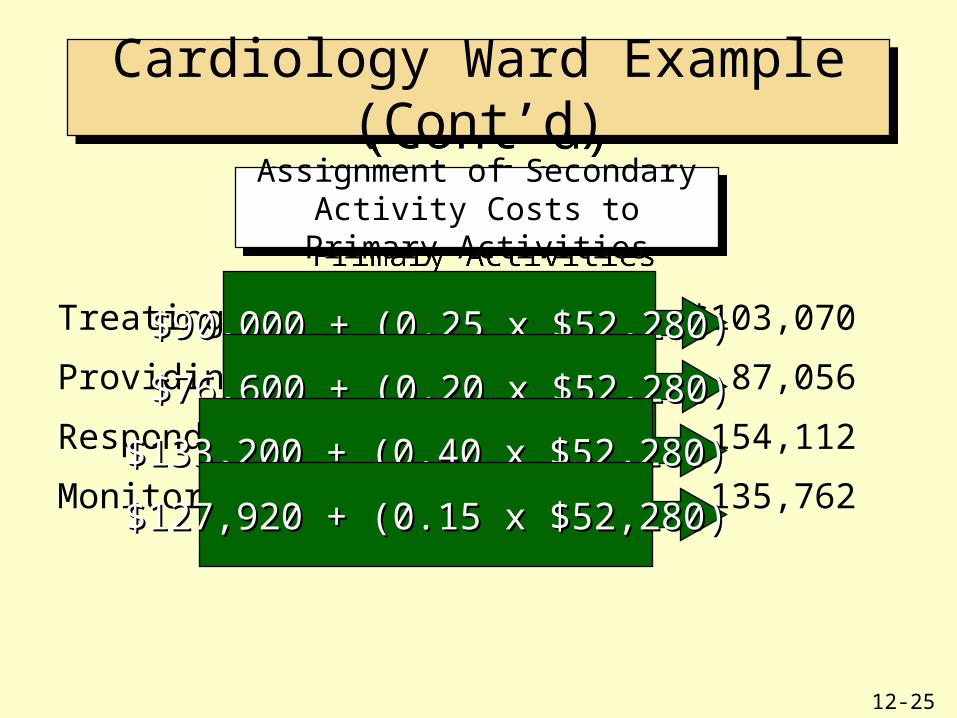
Treating patients $103,070
Providing hygienic care 87,056
Responding to requests 154,112
Monitoring patients 135,762
Assignment of Secondary Activity Costs to Primary Activities
Assignment of Secondary Activity Costs to Primary Activities
Cardiology Ward Example (Cont’d)Cardiology Ward Example (Cont’d)
$90,000 + (0.25 x $52,280)$90,000 + (0.25 x $52,280)
$76,600 + (0.20 x $52,280)$76,600 + (0.20 x $52,280)
$133,200 + (0.40 x $52,280)$133,200 + (0.40 x $52,280)
$127,920 + (0.15 x $52,280)$127,920 + (0.15 x $52,280)
12-26
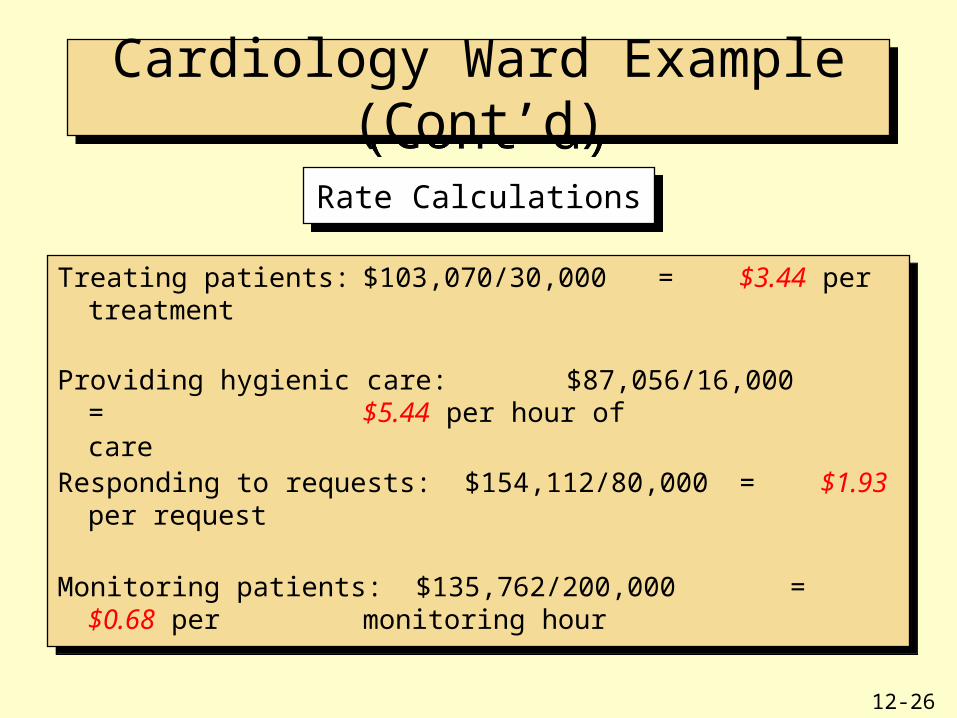
Treating patients: $103,070/30,000 = $3.44 per treatment
Providing hygienic care: $87,056/16,000 = $5.44 per hour ofcare
Responding to requests: $154,112/80,000 = $1.93 per request
Monitoring patients: $135,762/200,000 = $0.68 per monitoring hour
Treating patients: $103,070/30,000 = $3.44 per treatment
Providing hygienic care: $87,056/16,000 = $5.44 per hour ofcare
Responding to requests: $154,112/80,000 = $1.93 per request
Monitoring patients: $135,762/200,000 = $0.68 per monitoring hour
Rate CalculationsRate Calculations
Cardiology Ward Example (Cont’d)Cardiology Ward Example (Cont’d)
12-27
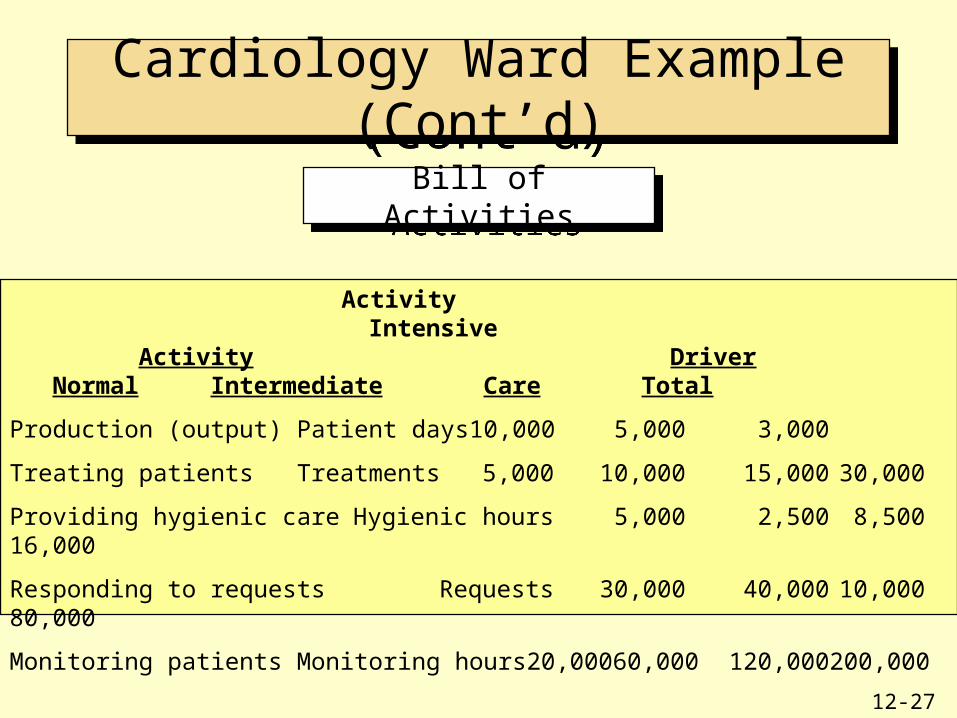
Bill of ActivitiesBill of Activities
Cardiology Ward Example (Cont’d)Cardiology Ward Example (Cont’d)
Activity Intensive Activity Driver Normal Intermediate Care Total
Production (output) Patient days 10,000 5,000 3,000
Treating patients Treatments 5,000 10,000 15,000 30,000
Providing hygienic care Hygienic hours 5,000 2,500 8,500 16,000
Responding to requests Requests 30,000 40,000 10,000 80,000
Monitoring patients Monitoring hours 20,000 60,000 120,000 200,000
12-28
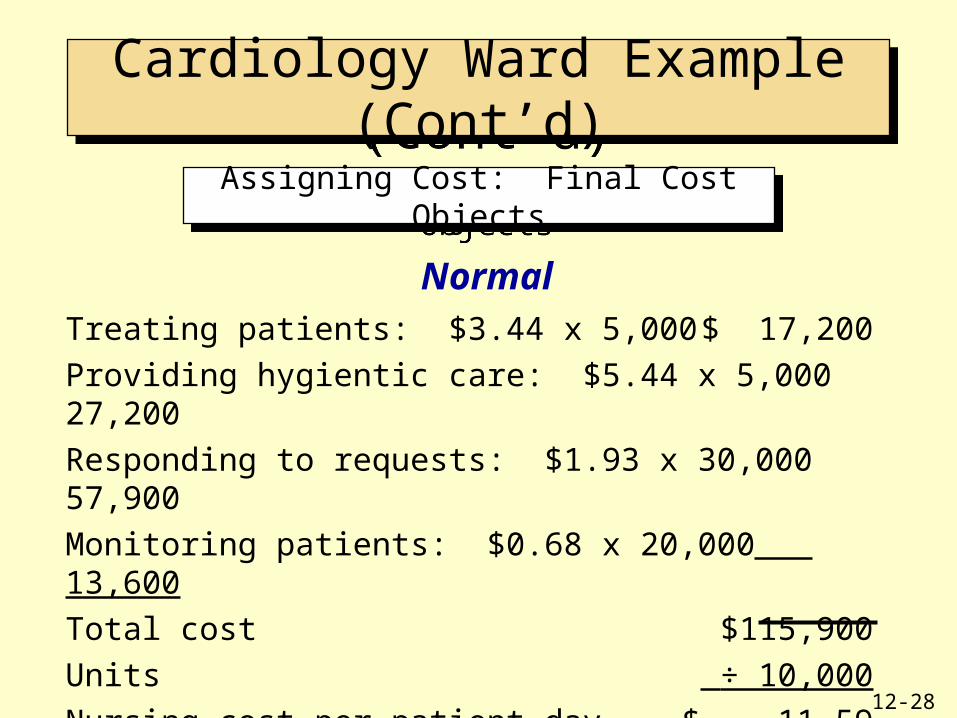
Assigning Cost: Final Cost ObjectsAssigning Cost: Final Cost Objects
Cardiology Ward Example (Cont’d)Cardiology Ward Example (Cont’d)
NormalTreating patients: $3.44 x 5,000 $ 17,200
Providing hygientic care: $5.44 x 5,000 27,200
Responding to requests: $1.93 x 30,000 57,900
Monitoring patients: $0.68 x 20,000 13,600
Total cost $115,900
Units ÷ 10,000
Nursing cost per patient day $ 11.59
12-29
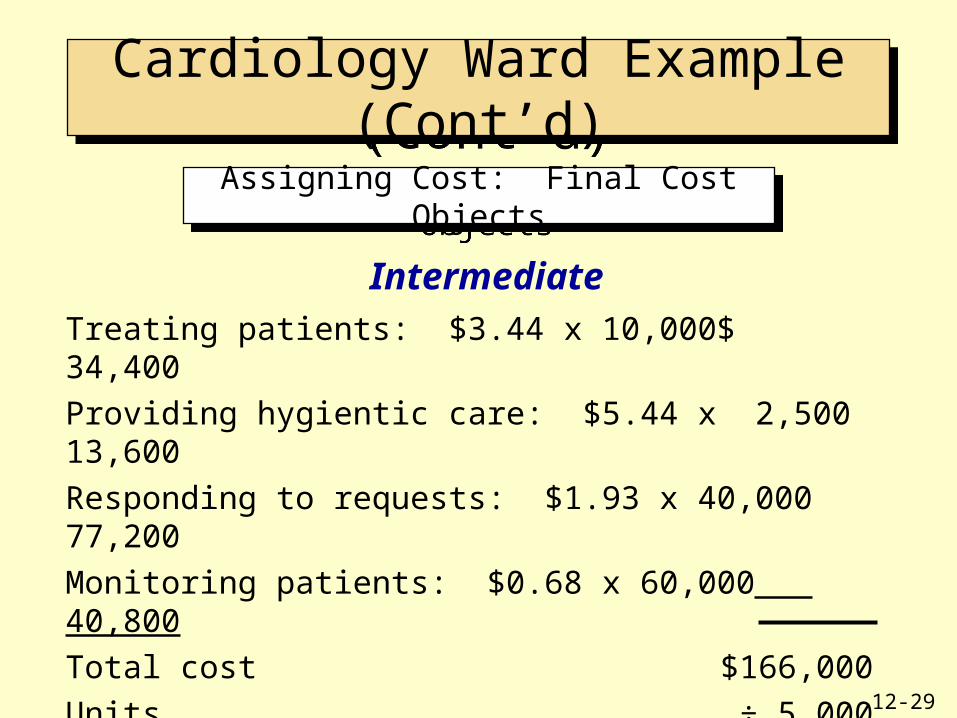
Assigning Cost: Final Cost ObjectsAssigning Cost: Final Cost Objects
Cardiology Ward Example (Cont’d)Cardiology Ward Example (Cont’d)
IntermediateTreating patients: $3.44 x 10,000 $ 34,400
Providing hygientic care: $5.44 x 2,500 13,600
Responding to requests: $1.93 x 40,000 77,200
Monitoring patients: $0.68 x 60,000 40,800
Total cost $166,000
Units ÷ 5,000
Nursing cost per patient day $ 33.20
12-30
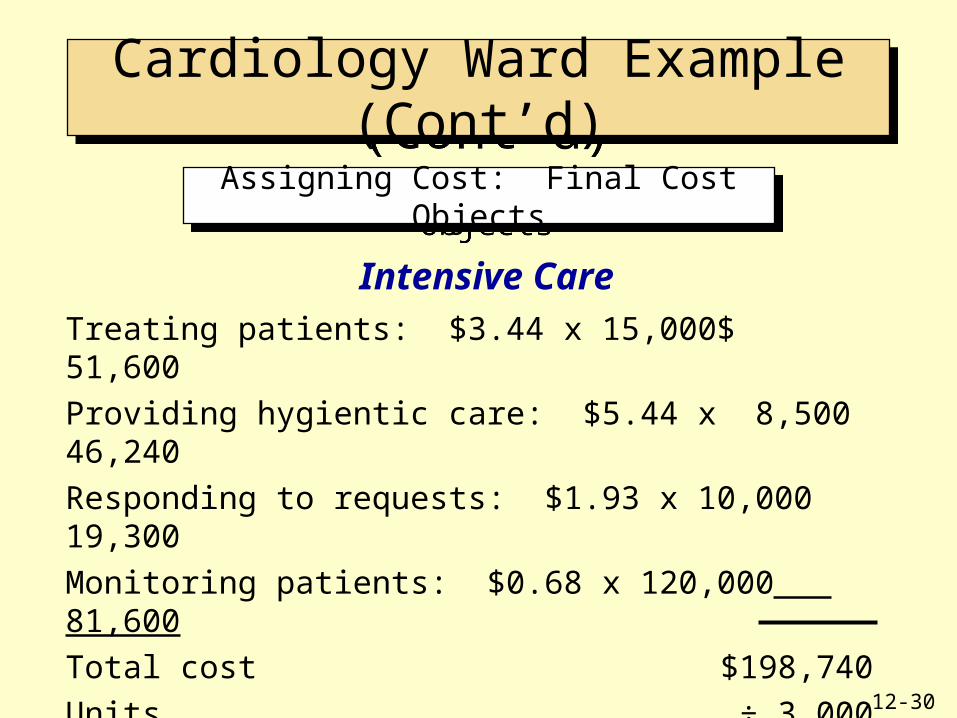
Assigning Cost: Final Cost ObjectsAssigning Cost: Final Cost Objects
Cardiology Ward Example (Cont’d)Cardiology Ward Example (Cont’d)
Intensive CareTreating patients: $3.44 x 15,000 $ 51,600
Providing hygientic care: $5.44 x 8,500 46,240
Responding to requests: $1.93 x 10,000 19,300
Monitoring patients: $0.68 x 120,000 81,600
Total cost $198,740
Units ÷ 3,000
Nursing cost per patient day $ 66.25
12-31
Unit-level activities are those that are performed each time a unit is produced.
Examples: Power and machine hours are used each time a unit is produced. Direct materials and direct labor activities are also unit-level activities, even though they are not overhead costs.
Activity-Level ClassificationActivity-Level Classification
12-32
Activity-Level ClassificationActivity-Level Classification
Batch-level activities are those that are performed each time a batch of products is produced.
Examples: Setups, inspections, purchasing, and material handling.
12-33
Activity-Level ClassificationActivity-Level Classification
Product-level (sustaining) activities are those activities performed that enable the various products of a company to be produced. These activities and their costs tend to increase as the number of different products increases.
Examples: Engineering changes, developing product-testing procedures, introducing new products, and expediting goods.
12-34
Activity-Level ClassificationActivity-Level Classification
Facility-level activities are those that sustain a factory's general manufacturing processes.
Examples: Plant management, landscaping, maintenance, security, property taxes, and plant depreciation.
12-35
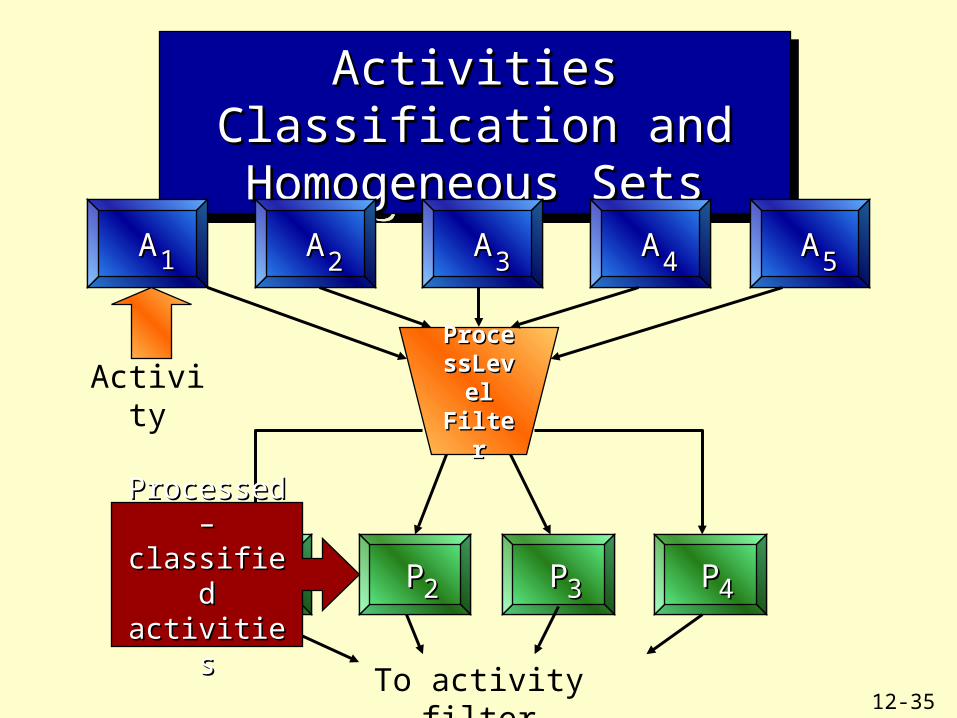
Activities Classification and Activities Classification and Homogeneous SetsHomogeneous Sets
Activities Classification and Activities Classification and Homogeneous SetsHomogeneous Sets
AA AA AA AA AA11 22 33 44 55
ProcesProcessLevel sLevel FilterFilter
Activity
PP PP PP PP11 22 33 44
To activity filter
Processed –Processed –classified classified activitiesactivities
12-36
ActivitActivity Level y Level FilterFilter
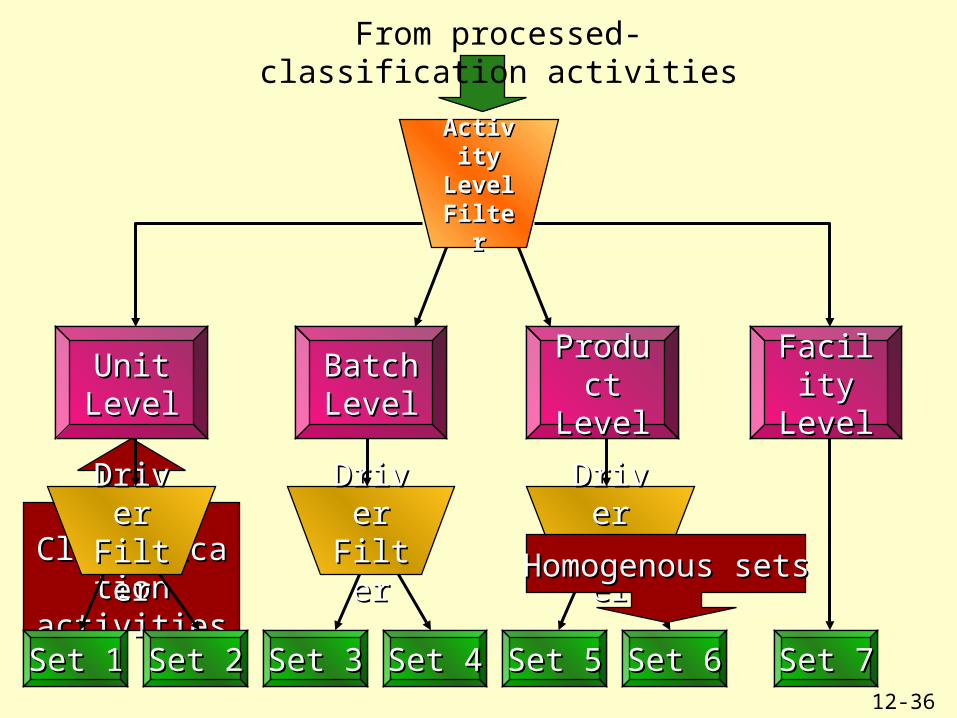
From processed-classification activities
Unit Unit LevelLevel
Batch Batch LevelLevel
Product Product LevelLevel
Facility Facility LevelLevel
Level-Level-Classification Classification
activitiesactivities
DriveDriver r
FilterFilter
DriveDriver r
FilterFilter
DriveDriver r
FilterFilter
Set 1Set 1 Set 2Set 2 Set 3Set 3 Set 4Set 4 Set 5Set 5 Set 6Set 6 Set 7Set 7
Homogenous setsHomogenous sets
12-37
ABC DatabaseABC DatabaseABC DatabaseABC Database
An ABC database is the collected data sets that are organized and interrelated for use by an organization’s activity-based costing information system.
A data set is a grouping of logically related data.

12-38
ChapteChapterr
End ofEnd of

12-39