Embed Size (px)
Citation preview

インベスターズガイド
INVESTOR ’S GU IDE
2008
目次Contents
1 ………ビジネスモデルBusiness Model
2 ………労働力人口推移Population by Labour Force Status
3 ………正規・非正規雇用者数The Number of Regular and Non-Regular Staff
4 ………完全失業率・有効求人倍率Unemployment Rate and Active Opening Ratio
5 ………人材サービス市場Human Resource Service Market
7 ………労働者派遣法Worker Dispatch Law
8 ………主要財務指標(連結)Key Indicators(Consolidated)
10………セグメント別業績推移Segment Results
12………人材派遣の営業計数Temporary Staffing/Contracting Market Data
13………連結貸借対照表Consolidated Balance Sheets
15………連結損益計算書Consolidated Statements of Income
16………連結キャッシュ・フロー計算書Consolidated Statements of Cash Flows
18………四半期業績Quarterly Results
20……… 沿革History
22………ネットワークNetwork
23………主なグループ会社Major Group Companies
25………会社情報及び株式情報Corporate Information / Stock Information

ビジネスモデル Business Model
1
人材派遣・請負「労働者派遣法」に基づき、厚生労働大臣の許可を受け、派遣スタッフを募集・登録し、企業へ派遣する「一般労働者派遣」を行っています。派遣スタッフは当社と期間を定めて雇用契約を結び、派遣先企業の指揮命令のもと、業務に従事します。派遣先企業から労働時間単位または月単位で派遣料金を徴収して売上計上し、派遣スタッフに支払う給与や社会保険、有給休暇などの法定福利厚生費などを売上原価に計上しています。 主なグループ会社/パソナ パソナテック パソナスパークル パソナソーシング パソナユース
人材紹介「職業安定法」に基づき、転職希望者を募集、登録すると同時に、企業の求人情報を収集し相互のニーズをマッチングさせる有料職業紹介事業を行っています。転職希望者に対してはキャリアコンサルティングや適職診断を実施し、最適な求人案件を無料で紹介。求人企業には、人材を紹介し採用時に紹介料を徴収、売上計上しています。 主なグループ会社/パソナキャリア パソナグローバル パソナフォーチュン パソナテンプトゥーパーム 海外グループ各社
再就職支援早期退職制度、セカンドキャリア支援制度による退職者や退職予定者に対し、再就職が決定するまでの間、求人企業の開拓やキャリアカウンセリング、教育、研修などのサポート業務を実施しています。顧客企業からコンサルティング報酬として対価を受け、求人企業に対しては、無料で人材を紹介しています。 主なグループ会社/パソナキャリア
アウトソーシング企業の福利厚生(保養所、スポーツクラブ、人間ドックなど)業務、給与計算業務、試験運営業務等のアウトソーシング事業を行っています。福利厚生のアウトソーシング事業では、会員企業から入会金および会員数に応じた月会費を収受し、個人会員がサービスを利用する際には一定の補助金を支給しています。サービス提供者である各施設への送客手数料、サービスメニューを記載したガイドブックへの掲載手数料も徴収、会費と合わせて売上計上しています。 主なグループ会社/ベネフィット・ワン ベネフィットワン・パートナーズ 全国試験運営センター
その他事業保育事業、介護関連事業、語学研修事業等を行っています。 主なグループ会社/パソナフォスター パソナエデュケーション NARP
Temporary Staffing / ContractingOperating within the scope of the Worker Dispatch Law, licensed by the Ministry of Health, Labour and Welfare, Pasona engages in temporary staffing activities. Business includes the recruiting, registration and dispatch of temporary staff to client companies. Temporary staffing payments are collected from client firms calculated on either an hourly or a monthly basis and recorded by the Company as sales. Salaries paid by Pasona to temporary staff including social insurance, paid leave and welfare expenses are reported as cost of sales. Principal Group companies Pasona Inc., Pasona Tech, Inc., Pasona Sparkle Inc., Pasona Sourcing Inc. Pasona Youth Inc.
Placement / RecruitingRegulated by the Employment Security Law, Pasona is engaged in the recruitment and registration of personnel seeking a career change. In addition, the Company collects information relating to the personnel needs of companies and provides a fee-based service that endeavors to match employer and employee demands. Pasona also formulates optimal career counseling free of charge for those seeking new employment. In the event a client firm employs personnel through Pasona’s placement and recruiting services, a placement fee is charged and recorded as sales.Principal Group companies Pasona Career Inc., Pasona Global Inc., Pasona Fortune Inc., Pasona Temp to Perm Inc., overseas group companies
OutplacementPasona provides support to retirees, as well as those considering retirement of both the early retirement and second career support systems, across a wide variety of areas. In its outplacement business, the Company cultivates client firms and provides career counseling, education and training to assist job seekers. Pasona receives a consulting fee from the client firm for its service. The introduction of personnel to client firms is free of charge.Principal Group company Pasona Career Inc.
OutsourcingThrough its outsourcing business, Pasona provides a variety of welfare benefit programs. At the same time, the Company undertakes salary calculation and examination management on an agency basis. In the outsourcing of welfare benefit programs, Pasona receives an enrollment fee from client firms and a monthly fee. A fixed subsidy is also paid for services used by individual members. In addition, the Company collects a commission in connection with the publication of a guidebook outlining fees paid to service providers and facility service menus. These publication commissions are recorded as sales.Principal Group companies Benefit One Inc., Benefit One Partners Inc., National Examination Center Inc.
OtherIn addition to the aforementioned businesses, Pasona is engaged in childcare, nursing care, language education and training and other activities.Principal Group companies Pasona Foster Inc., Pasona Education Co., Limited, NARP Inc.
【 人材派遣の収益モデル 】Temporary Staffing Earnings Model
売上Sales
派遣契約Temporary
staffing contract
派遣元Temporary staffing
company
パソナPasona
派遣先Client firms
顧客企業Client Firms
派遣スタッフTemporary Staff
雇用関係Employmentrelationship
指揮命令権Supervision
and instruction
業務の提供Provision of workand services
業務の依頼Request for work
and services
請負元Contracting
company
パソナPasona
請負先Client firms
顧客企業Client Firms
就労者Staff
雇用関係Employmentrelationship
指揮命令権Supervision and instruction
完成業務の提供Provision of completed work
and services
派遣料金Fee
原価Cost of sales
スタッフ給与Staff payroll
社会保険有給休暇等法定福利Legal welfare includingsocial insurance and paid holidays
粗利Gross profit
【 人材派遣のしくみ 】Temporary Staffing Business Structure
面接採用試験Interview and employment test
採用・入社Recruitment, Enter company
求人企業 Companies seeking
workes
転職希望者Worker seeking a career change
パソナPasona
登録者紹介Registeredjob seekerplacement
成約料Commission 登録
Job seekerregistration
企業紹介Corporateplacement
求人依頼Request forplacement /recruiting
パソナ登録Pasona
registration
【 請負のしくみ 】Contracting Business Structure
【 アウトソーシング(福利厚生)の収益モデル 】 Outsourcing Business (Welfare Benefits) Earnings Model
【 アウトソーシング(福利厚生)のしくみ 】Outsourcing Business (Welfare Benefit) Structure
業務委託契約Business
outsourcingagreement
入会金・月会費Enrollment fee,
Monthlymembership fee
利用申込みApplication
情報提供Informationprovision
業務提携Businesspartner
提携契約料Contract fee利用補助金等
Utilization subsidyand other
送客・掲載手数料Commission and Advertising fee予約・手配
ReservationArrangement
メニュー利用 Menu usage
ベネフィット・ワン
BenefitOne
サービス提供企業(宿泊施設、
スポーツクラブ等)Corporate
serviceprovider
(Accommodation,sports club,
other)
企業(法人会員)Client firms (Corporatemember)
従業員Employees
派遣先企業との
面接・選考Interview
andscreeningwith client
firm
*派遣期間は最長6ヶ月Note: Maximum temporary staffing term: six months
派遣開始Commencement
of temporarystaffing
派遣先・スタッフ双方の意思確認
Confirmationof client firm
andstaff intentions
派遣先入社Entry intoclient firm
【 紹介予定派遣のしくみ 】Temp to Perm Business Structure
売上Sales
直営施設収入送客・掲載手数料Revenues fromdirectly operated facilities/ Commission and Advertising fee
福利厚生会費等Welfare benefitmembership fee, other
原価 ガイドブック・会報誌 オペレーター人件費 直営施設運営費 利用補助金Cost of sales Guidebook Newsletter / magazine Operator personnel expenses Operating expenses for directly operated facilitates Unilization subsidy
粗利Gross profit
サービス利用者Service
user キャリアカウンセリング・再就職斡旋Career counseling, Outplacement
顧客企業Client firms
求人企業
Companies seekingworkes
候補者紹介(無料)Candidate introduction (free service)
業務委託契約Business outsourcingagreement
コンサルティング報酬Consultingcompensation
【 再就職支援のしくみ 】Outplacement Business Structure
パソナPasona
【 人材紹介のしくみ 】Placement / Recruiting Business Structure

労働力人口推移 Population by Labour Force Status
2
1990
1991
1992
1993
1994
1995
1996
1997
1998
1999
2000
2001
2002
2003
2004
2005
2006
2007
10,089
10,199
10,283
10,370
10,444
10,510
10,571
10,661
10,728
10,783
10,836
10,886
10,927
10,962
10,990
11,007
11,020
11,043
6,384
6,505
6,578
6,615
6,645
6,666
6,711
6,787
6,793
6,779
6,766
6,752
6,689
6,666
6,642
6,650
6,657
6,669
6,249
6,369
6,436
6,450
6,453
6,457
6,486
6,557
6,514
6,462
6,446
6,412
6,330
6,316
6,329
6,356
6,382
6,412
4,835
5,002
5,119
5,202
5,236
5,263
5,322
5,391
5,368
5,331
5,356
5,369
5,331
5,335
5,355
5,393
5,472
5,523
134
136
142
166
192
210
225
230
279
317
320
340
359
350
313
294
275
257
3,657
3,649
3,679
3,740
3,791
3,836
3,852
3,863
3,924
3,989
4,057
4,125
4,229
4,285
4,336
4,346
4,355
4,367
63.3
63.8
64.0
63.8
63.6
63.4
63.5
63.7
63.3
62.9
62.4
62.0
61.2
60.8
60.4
60.4
60.4
60.4
4,911
4,965
5,002
5,044
5,078
5,108
5,136
5,180
5,209
5,232
5,253
5,273
5,294
5,308
5,318
5,323
5,327
5,342
3,791
3,854
3,899
3,935
3,951
3,966
3,992
4,027
4,026
4,024
4,014
3,992
3,956
3,934
3,905
3,901
3,898
3,906
3,713
3,776
3,817
3,840
3,839
3,843
3,858
3,892
3,858
3,831
3,817
3,783
3,736
3,719
3,713
3,723
3,730
3,753
3,001
3,084
3,145
3,193
3,202
3,215
3,238
3,264
3,243
3,215
3,216
3,201
3,170
3,158
3,152
3,164
3,194
3,226
77
78
82
95
112
123
134
135
168
194
196
209
219
215
192
178
168
154
1,095
1,088
1,090
1,101
1,122
1,139
1,140
1,147
1,177
1,199
1,233
1,277
1,333
1,369
1,406
1,416
1,425
1,432
77.2
77.6
77.9
78.0
77.8
77.6
77.7
77.7
77.3
76.9
76.4
75.7
74.7
74.1
73.4
73.3
73.2
73.1
5,178
5,233
5,281
5,326
5,366
5,402
5,435
5,481
5,519
5,552
5,583
5,613
5,632
5,654
5,672
5,684
5,693
5,701
2,593
2,651
2,679
2,681
2,694
2,701
2,719
2,760
2,767
2,755
2,753
2,760
2,733
2,732
2,737
2,750
2,759
2,763
2,536
2,592
2,619
2,610
2,614
2,614
2,627
2,665
2,656
2,632
2,629
2,629
2,594
2,597
2,616
2,633
2,652
2,659
1,834
1,918
1,974
2,009
2,034
2,048
2,084
2,127
2,124
2,116
2,140
2,168
2,161
2,177
2,203
2,229
2,277
2,297
57
59
60
71
80
87
91
95
111
123
123
131
140
135
121
116
107
103
2,562
2,561
2,590
2,639
2,669
2,698
2,712
2,716
2,747
2,790
2,824
2,848
2,895
2,916
2,930
2,929
2,930
2,935
50.1
50.7
50.7
50.3
50.2
50.0
50.0
50.4
50.1
49.6
49.3
49.2
48.5
48.3
48.3
48.4
48.5
48.5
男女計 Total
15歳以上人口
Population of over fifteens
15歳以上人口
Population of over fifteens
総数Total
総数Total
就業者Labour force
employed雇用者
Employees
完全失業者Labour force
unemployed
非労働力人口
Population not in the
labour force
労働力人口 Population of the labour force 労働力人口 Population of the labour force労働力人口比率(%)
Labour force participation
rate
就業者Labour force
employed雇用者
Employees
完全失業者Labour force
unemployed
非労働力人口
Population not in the
labour force
労働力人口比率(%)
Labour force participation
rate
15歳以上人口
Population of over fifteens
総数Total
労働力人口 Population of the labour force
就業者Labour force
employed雇用者
Employees
完全失業者Labour force
unemployed
非労働力人口
Population not in the
labour force
労働力人口比率(%)
Labour force participation
rate
男 Males 女 Females
労働力人口 15歳以上人口のうち、就業者と完全失業者を合わせたもの就業者 従業者と休業者を合わせたもの 従業者:調査期間中に賃金、給料、諸手当、内職収入などの収入を伴う仕事を1時間以上したもの。家族従業者の割合は無給であっても仕事をしたとする。 休業者:仕事を持ちながら、調査週間中少しも仕事をしなかった者のうち、 1)雇用者で給料、賃金の支払いを受けている者または受けることになっている者 2)自営業主で、自分の経営する事業を持ったままで、その仕事を休み始めてから30日にならない者。 なお、家族従業者で調査期間中に少しも仕事をしなかった者は休業に含めず、完全失業者又は非労働力人口のいずれかとしている。雇用者 会社、団体、官公庁または自営業主や家庭に雇われて、給料、賃金を得ている者及び会社、団体の役員完全失業者 次の3つの条件を満たす者 1)仕事がなくて調査期間中に少しも仕事をしなかった(就業者ではない) 2)仕事があればすぐに就くことができる 3)調査期間中に仕事を探す活動や事業を始める準備をしていた(過去の求職活動の結果を持っている場合も含む)非労働力人口 15歳以上人口で就業者、完全失業者のいずれにもあてはまらない者労働力人口比率 15歳以上人口に占める労働力人口の割合=(労働力人口÷15歳以上人口)×100
Labor Force Sum of the employed and the unemployed over the age of 15Labor Force Employed Sum of employed persons at work and employed persons not at work: Employed persons at work: Persons engaged in work equivalent to more than one hours wage, salary, allowance or additional income during the survey weeks. The ratio of family workers shall be deemed to have worked despite the lack of compensation. Employed persons not at work: Of those persons in employment, who did not work during the survey weeks (1) persons, who received or were deemed to have received a salary or wages from an employer, and (2) the self-employed, who have taken time off for a period not exceeding 30 consecutive days. Family workers, who did not work during the survey period are not included in this category. This segment is included in either the unemployed or population not in the labor force.Employees Persons who work for wages or salary as employees of companies, private stores, organizations, public corporations, government, public offices, etc.Labor Force Unemployed Persons that fulfill the following three criteria: (1) Without work and did not work during the survey period (unemployed), (2) able to commence work immediately should work become available, and (3) undertook activities to gain employment during the survey period or are preparing to commence work (includes persons awaiting results of previous efforts to gain employment).Population not in the Labor Force Persons that cannot be categorized as employed over the age of 15 and labor force unemployed.Percentage of the Labor Force in the Population Percentage of the labor force to the population over the age of 15 = (The labor force ÷ The Population over the age of 15) x 100
出典:総務省「労働力調査」Source: "Labour Force Survey" Statistics Bureau, Ministry of International Affairs and Communications
人数(万人) N
um
ber o
f perso
ns (10 th
ou
sand
perso
ns)

正規 ・ 非正規雇用者数 The Number of Regular and Non-Regular Staff
3
「役員を除く雇用者」に占める正規/非正規の割合~男女計 Proportion of regular staff and non-regular staff in employees other than executive of company or corporation
「役員を除く雇用者」に占める雇用形態別割合(2007年)~男女計 Proportion of types in employees other than executive of company or corporation (2007) ~Males/Females Total
正規の職員・従業員: 66.5%Regular staffs
その他: 2.6%Other
出典: 総務省「労働力調査」Source: "Labour Force Survey" Statistics Bureau, Ministry of International Affairs and Communications
アルバイト: 6.6%Temporary workers
パート: 15.9%Part-time workers
契約社員・嘱託: 5.8%Contract employees or entrusted employees
派遣社員: 2.6%Dispatched workers
2007 Ave.2006 Ave.2005 Ave.2004 Ave.2003 Ave.2002 Ave.Feb.2001Feb.2000Feb.1999Feb.1998Feb.1997Feb.1996Feb.1995Feb.1994Feb.19930
10
20
30
40
50
60
70
80
90
100 正規の職員・従業員/Regular staffs
非正規の職員・従業員/Non-regular staffs
‘07年平均‘06年平均‘05年平均‘04年平均‘03年平均‘02年平均‘01年2月‘00年2月‘99年2月‘98年2月‘97年2月‘96年2月‘95年2月‘94年2月‘93年2月
Feb. 1995
Feb. 2000
Feb. 2001
2002 Average
2003 Average
2004 Average
2005 Average
2006 Average
2007 Average
Feb. 1995
Feb. 2000
Feb. 2001
2002 Average
2003 Average
2004 Average
2005 Average
2006 Average
2007 Average
1995年2月
2000年2月
2001年2月
2002年平均
2003年平均
2004年平均
2005年平均
2006年平均
2007年平均
1995年2月
2000年2月
2001年2月
2002年平均
2003年平均
2004年平均
2005年平均
2006年平均
2007年平均
3,176
3,180
3,192
3,165
3,152
3,152
3,164
3,191
3,232
1,994
2,087
2,150
2,172
2,191
2,220
2,243
2,290
2,328
2,876
2,892
2,923
2,867
2,853
2,851
2,864
2,894
2,941
1,904
2,011
2,076
2,073
2,095
2,124
2,143
2,194
2,234
2,620
2,553
2,557
2,437
2,410
2,385
2,357
2,375
2,402
1,159
1,077
1,083
1,052
1,034
1,025
1,018
1,036
1,039
256
338
366
431
444
466
507
517
538
745
934
994
1,021
1,061
1,098
1,125
1,159
1,194
全産業All industries
雇用者Employees
役員を除く雇用者総数Employees other than
executive of company or corporation
正規の職員・従業員
Regular staffs
非正規の職員・従業員
Non-regular staffs
正規の職員・従業員
Regular staffs
非正規の職員・従業員
Non-regular staffs
非正規の職員・従業員 Non-regular staffs
パート・アルバイトPart-time
workers and temporary
workers
パートPart-time workers
アルバイトTemporary workers
派遣社員・契約社員Dispatched
workers and contract
employees
パート・アルバイトPart-time
workers and temporary
workers
派遣社員・契約社員Dispatched
workers and contract
employees
派遣社員Dispatched workers
契約社員・嘱託Contract employees or entrusted employees
その他Other
人数(万人) N
um
ber o
f perso
ns (10 th
ou
sand
perso
ns)
91.1
88.3
87.5
85.0
84.4
83.7
82.3
82.1
81.7
60.9
53.6
52.1
50.7
49.4
48.3
47.5
47.2
46.5
8.9
11.7
12.5
15.0
15.6
16.3
17.7
17.9
18.3
39.1
46.4
47.9
49.3
50.6
51.7
52.5
52.8
53.5
5.2
8.0
8.9
8.0
8.2
8.3
8.6
8.5
8.7
35.5
42.1
42.9
39.8
40.8
40.5
40.7
40.0
40.7
1.0
1.9
2.2
2.2
2.2
2.5
2.7
2.7
2.8
28.1
33.0
34.0
31.6
32.7
32.6
32.8
32.5
33.1
4.2
6.1
6.8
5.8
6.0
5.8
6.0
5.8
5.8
7.4
9.1
8.9
8.2
8.1
7.8
7.9
7.5
7.6
3.7
3.7
3.6
7.0
7.3
8.1
9.1
9.3
9.6
3.7
4.4
5.0
9.5
9.8
11.2
11.8
12.8
12.8
. . .
0.3
0.4
0.3
0.5
1.0
1.5
1.7
1.8
. . .
1.2
1.6
1.6
1.8
2.7
2.9
3.6
3.6
. . .
3.4
3.2
4.3
4.4
4.8
5.2
5.2
5.5
. . .
3.2
3.3
5.2
5.3
5.6
6.1
6.1
6.1
150
232
261
229
235
236
247
247
255
675
846
891
825
855
860
872
878
909
28
56
63
63
63
70
77
79
83
535
663
706
655
685
693
703
713
739
122
176
198
166
171
166
171
168
172
140
183
185
170
170
166
169
165
170
106
106
105
202
209
230
260
270
283
70
88
103
196
206
238
253
281
285
. . .
98
94
122
125
136
149
150
161
. . .
64
69
108
111
119
130
133
137
. . .
. . .
. . .
70
71
66
69
71
69
. . .
. . .
. . .
55
58
62
60
70
68
出典:総務省「労働力調査」1990年、1995年、2000年、2001年の「契約社員・嘱託」については、従業員・割合ともに「その他」区分の値も含む。Source: "Labour Force Survey" Statistics Bureau, Ministry of International Affairs and CommunicationsFigures for "Contract employees or entrusted employees" in 1990, 1995, 2000 and 2001 include figures of "Other" for the number of staffs and proportion of non-regular staff.
パートPart-time workers
アルバイトTemporary workers
派遣社員Dispatched workers
契約社員・嘱託Contract employees or entrusted employees
「役員を除く雇用者」に占める割合(%)Proportion of regular staff and non-regular staff in employees other than executive of company or corporation
. . .
9
11
10
13
28
42
49
53
. . .
25
34
33
37
57
63
78
80
男 Males
女 Females
(%)
66.566.566.5
33.533.5
79.279.279.2
20.820.820.8
2007年
33.5

完全失業率・有効求人倍率 Unemployment Rate and Active Opening Ratio 地域別 By Region
4
66.5
33.5
79.2
20.8
(失業率:%、有効求人倍率:倍) (Unemployment rate: %, Active operating ratio: times)
全国
北海道
東北
南関東
北関東・甲信
北陸
東海
近畿
中国
四国
九州
2007
完全失業率
有効求人倍率
完全失業率
有効求人倍率
完全失業率
有効求人倍率
完全失業率
有効求人倍率
完全失業率
有効求人倍率
完全失業率
有効求人倍率
完全失業率
有効求人倍率
完全失業率
有効求人倍率
完全失業率
有効求人倍率
完全失業率
有効求人倍率
完全失業率
有効求人倍率
Unemployment rate
Active opening ratio
Unemployment rate
Active opening ratio
Unemployment rate
Active opening ratio
Unemployment rate
Active opening ratio
Unemployment rate
Active opening ratio
Unemployment rate
Active opening ratio
Unemployment rate
Active opening ratio
Unemployment rate
Active opening ratio
Unemployment rate
Active opening ratio
Unemployment rate
Active opening ratio
Unemployment rate
Active opening ratio
3.8
1.02
5.0
0.56
4.7
0.76
3.6
1.14
3.2
1.25
3.4
1.22
2.7
1.58
4.4
1.09
3.6
1.15
3.9
0.89
4.7
0.74
北海道 : 北海道 東 海 : 岐阜、 静岡、 愛知、 三重東 北 : 青森、 岩手、 宮城、 秋田、 山形、 福島 近 畿 : 滋賀、 京都、 大阪、 兵庫、 奈良、 和歌山南関東 : 埼玉、 千葉、 東京、 神奈川 中 国 : 鳥取、 島根、 岡山、 広島、 山口北関東 ・ 甲信 : 茨城、 栃木、 群馬、 山梨、 長野 四 国 : 徳島、 香川、 愛媛、 高知北 陸 : 新潟、 冨山、 石川、 福井 九 州 : 福岡、 佐賀、 長崎、 熊本、 大分、 宮崎、 鹿児島、 沖縄
出典 : 総務省「労働力調査」、厚生労働省「一般職業紹介状況」
Hokkaido: HokkaidoTohoku: Aomori, Iwate, Miyagi, Akita, Yamagata, FukushimaMinami Kanto: Saitama, Chiba, Tokyo, KanagawaKita Kanto: Koshin, Ibaraki, Tochigi, Gunma, Yamanashi, NaganoHokuriku: Niigata, Toyama, Ishikawa, FukuiTokai: Gifu, Shizuoka, Aichi, MieKinki: Shiga, Kyoto, Osaka, Hyogo, Nara, WakayamaChugoku: Tottori, Shimane, Okayama, Hiroshima, YamaguchiShikoku: Tokushima, Kagawa, Ehime, KochiKyushu: Fukuoka, Saga, Nagasaki, Kumamoto, Oita, Miyazaki, Kagoshima, Okinawa
Source: "Labour Force Survey" Statistics Bureau, Ministry of International Affairs and CommunicationsStatus of general employment, Ministry of Health, Labour and Welfare
Nationwide
Hokkaido
Tohoku
Minamikanto
KitakantoKosin
Hokuriku
Tokai
Kinki
Chugoku
Sikoku
Kyushu
完全失業率/有効求人倍率の推移 Trend of Unemployment Rate/Active Opening Ratio
9085 86 87 88 89 91 92 93 94 95 96 97 98 99 00 01 02 03 04 0605 07
(%)
0
1.0
2.0
3.0
4.0
5.0
6.0
(倍/times)
0
0.25
0.50
0.75
1.00
1.25
1.50
3.4
0.70
1996
完全失業率(%)Unemployment Rate(%)
有効求人倍率(倍)Active Opening Ratio(Times)
3.8
1.04
2007
完全失業率(%)Unemployment Rate(%)
有効求人倍率(倍)Active Opening Ratio(Times)
■完全失業率/Unemployment Rate■有効求人倍率*/Active Opening Ratio
2.8
0.62
2.8
0.70
2.5
1.01
2.3
1.25
2.1
1.40
2.1
1.40
2.2
1.08
2.5
0.76
2.9
0.64
3.2
0.63
1995199419931992199119901989198819871986
3.4
0.72
4.1
0.53
4.7
0.48
4.7
0.59
5.0
0.59
5.4
0.54
5.3
0.64
4.7
0.83
4.4
0.95
4.1
1.06
2006200520042003200220012000199919981997
1997 1998 1999 2000 2001 2002 2003 2004 2005 2006
3.4
0.72
3.8
0.54
2.9
0.80
3.8
0.58
2.5
1.02
2.6
1.08
2.7
0.96
4.0
0.60
2.7
1.02
3.2
0.88
3.8
0.57
4.1
0.53
4.9
0.44
3.9
0.54
4.5
0.45
3.0
0.75
2.9
0.68
3.3
0.70
4.9
0.42
3.4
0.75
3.7
0.68
4.6
0.43
4.7
0.48
4.9
0.44
4.2
0.48
5.1
0.41
3.6
0.68
3.5
0.59
3.9
0.61
5.6
0.38
3.9
0.64
4.1
0.62
5.0
0.40
4.7
0.59
5.5
0.46
4.4
0.59
4.8
0.55
3.8
0.86
3.6
0.70
3.7
0.77
5.9
0.48
3.9
0.72
4.1
0.66
5.4
0.46
5.0
0.59
5.9
0.48
5.0
0.49
4.9
0.63
4.1
0.79
3.9
0.64
4.1
0.80
6.3
0.49
4.2
0.70
5.1
0.65
5.6
0.45
5.4
0.54
6.0
0.47
5.9
0.44
5.4
0.56
4.4
0.64
4.0
0.58
4.1
0.74
6.7
0.45
4.3
0.66
5.2
0.61
6.1
0.41
5.3
0.64
6.7
0.49
5.6
0.54
5.1
0.67
4.6
0.78
4.0
0.69
4.0
0.90
6.6
0.57
4.3
0.78
4.8
0.66
5.9
0.49
4.7
0.83
5.7
0.54
5.4
0.64
4.6
0.91
4.1
1.02
3.7
0.87
3.5
1.22
5.6
0.78
4.3
0.96
4.9
0.78
5.5
0.59
4.4
0.95
5.3
0.57
5.0
0.68
4.3
1.11
3.7
1.09
3.3
1.06
3.2
1.41
5.2
0.92
3.8
1.10
4.3
0.84
5.3
0.67
4.1
1.06
5.4
0.59
4.8
0.77
4.0
1.25
3.5
1.19
3.4
1.22
3.0
1.56
5.0
1.08
3.5
1.19
3.9
0.89
5.0
0.73
*右目盛り(Right scale)

5
32.5%
42.6%
34.3%
25.1%
40.7%
26.1%
22.5%
人材派遣市場データ Staffing Industry Data
〔資料出所〕厚生労働省「労働者派遣事業の事業報告集計結果」Source: Report on temporary staffing services issued by the Ministry of Health, Labour and Welfare of Japan.
※一般派遣: 派遣会社に登録し、仕事の期間のみ雇用契約が生じる形態 特定派遣: 派遣会社に正社員として常用雇用され、派遣先で就業する形態General dispatch: Registered in a temporary employment agency with employment contracts that are effective only for the term of the employment. Specific dispatch: Full-time employee of a temporary employment agency who works at the company they are dispatched to
*1 「派遣労働者数」は、一般労働者派遣事業における常用雇用労働者数及び登録者数並びに特定労働者派遣事業における常用雇用労働者数の合計とする。「登録者」は過去1年間に雇用されたことのない者は除くThe “Total number of workers” is the total of regular employed workers plus the number of registered workers dispatched from general temporary employment agencies, and the regular employed workers dispatched from specific temporary employment agencies.“Registered workers” excludes persons that were not employed in the past one-year.
*2 常用換算: 常用雇用以外の労働者の年間総労働時間数の合計を当該事業所の常用雇用労働者の1人当たりの年間総労働時間数で除したものRegular circulation basis: The total number of annual labor hours for employees other than regular employees divided by the number of annual working hours per regular employee at that particular temporary employment agency.
44,082
10,107
54,189
2,989,734
220,734
3,210,468
1,518,188
(単位:億ドル/100 millions of dollars)
オフィス事務 Clerical
製造・工業 Manufacturing
人材サービス市場 Human Resource Service Market
(E)=推定 Estimate、(P)=予測・見込み Projection(備考1)2005年2月発表時に、国勢調査結果を反映して2001年数値に遡って市場規模が改訂された為、それ以前の数値と連続性はなくなった。(備考2)2004-2006年のPEO成長率の推定は、小規模事業者も網羅された新手法による。Note 1: At the time of announcement in February 2005, market scale data was retrospectively revised dating back to 2001 to incorporate the results of
the national census. Accordingly, there is no continuity with data prior to 2001.Note 2: PEO growth rate estimates are calculated utilizing a new method that includes small-scale enterprises.出典:「Staffing Industry Report - Vol.XVIII, No.4 Feb. 28, 2007」
(単位:億ドル/100 millions of dollars)
人材派遣 Temporary staffing
人材紹介 Placement and recruiting
PEO(人材管理代行)従業員リース PEO Employees lease
再就職支援 Outplacement
合計 Total
Net sales: General (100 millions of yen)
Net sales: Specific (100 millions of yen)
Net sales (100 millions of yen)
Total number of workers:General (Persons)
Number of workers:Specific (Persons)
Total number of workers:(General+Specific) (Persons)*1
Total number of workers regular calculation basis(General+Specific) (Persons)*2
売上高:一般(億円)
売上高:特定(億円)
売上高合計 (億円)
派遣労働者数:一般(人)延べ人数
派遣労働者数:特定(人)
派遣労働者数:(一般+特定)(人)*1
派遣労働者数:常用換算した場合(一般+特定)(人)*2
前期比 YOY
前期比 YOY
前期比 YOY
前期比 YOY
前期比 YOY
前期比 YOY
前期比 YOY
2006
【米国】人材サービス市場 United States : Human Resource Serivce Market 【米国】人材派遣市場 United States : Temporary Staffing Market
1,024
163
228
126
102
84
18
51
252
2009(P)
972
160
215
119
97
77
17
48
240
2008(P)
967
167
205
113
94
72
16
45
256
2007(E)
948
171
190
106
89
65
15
42
269
2006(E)
894
168
174
100
81
59
13
39
260
2005(E)
818
156
158
98
66
51
11
35
243
2004(E)
733
150
143
102
54
46
10
32
198
2003(E)
741
188
148
111
53
47
9
32
153
2002(E)
781
198
187
89
80
50
8
16
153
2001(E)
848
214
220
72
91
50
8
15
178
2000(E)
派遣事業 Tem
po
rary staffing
1,024
279
108
11
1,423
2009(P)
741
127
82
14
964
2002(E)
733
117
74
13
937
2003(E)
818
144
80
11
1,053
2004(E)
894
181
87
10
1,171
2005(E)
948
226
94
10
1,278
2006(E)
967
248
99
10
1,325
2007(E)
972
251
103
11
1,337
2008(P)
42.9%
32.9%
41.0%
12.7%
7.1%
12.4%
39.2%
21.7%
19.1%
21.2%
-4.7%
5.4%
-4.1%
19.7%
5.7%
2.4%
5.1%
12.4%
-7.9%
10.9%
7.2%
16.0%
13.4%
15.5%
23.2%
6.8%
21.8%
13.3%
21.5%
-0.4%
16.4%
28.5%
4.2%
26.1%
14.0%
18.7%
2.3%
14.5%
24.5%
115.5%
29.8%
36.1%
1.1%
-24.4%
-7.0%
22.2%
-13.6%
19.3%
28.5%
14.3%
26.1%
17.8%
4.2%
9.7%
4.7%
-9.7%
20.9%
-2.7%
12.8%
20.4%
-3.8%
18.1%
13.9%
23.6%
4.4%
16.3%
20.8%
-1.0%
18.3%
17.1%
15.0%
0.9%
9.2%
7.2%
-0.5%
6.3%
7.0%
0.3%
-4.6%
-1.8%
0.2%
0.1%
0.2%
1.0%
-11.0%
-13.8%
-12.2%
-11.9%
-13.6%
-12.1%
-10.0%
3.3%
-5.7%
-0.8%
6.7%
-7.7%
4.7%
-7.4%
31.4%
10.9%
22.9%
24.9%
8.7%
22.3%
19.3%
10,704
5,002
15,706
822,520
72,754
895,274
306,914
9,368
3,967
13,335
789,002
66,328
855,330
340,059
7,751
4,076
11,827
655,307
68,941
724,248
298,530
6,269
3,903
10,172
542,426
69,630
612,056
254,957
5,449
3,870
9,319
505,883
69,996
575,879
238,300
5,433
4,055
9,488
504,752
69,934
574,686
235,980
6,105
4,703
10,808
572,689
80,909
653,598
262,059
5,910
4,989
10,899
536,587
87,613
624,200
283,143
10,821
3,784
14,605
1,005,090
62,859
1,067,949
394,502
12,847
3,870
16,717
1,250,913
135,451
1,386,364
537,063
15,606
3,856
19,462
1,606,802
141,111
1,747,913
612,096
18,101
4,371
22,472
1,978,873
150,781
2,129,654
693,418
19,136
4,478
23,614
2,223,493
138,887
2,362,380
743,640
23,280
5,335
28,615
2,119,657
146,387
2,266,044
890,234
33,263
7,088
40,351
2,389,764
156,850
2,546,614
1,238,832
19981997199619951994199319921991 1999 2000 2001 2002 2003 2004 2005
IT系 IT
医療関連 Medical
会計・財務 Account and finance
技術系 Engineering
法務 Legal
その他 Other
専門系事務 S
pecialist clerk

6
人材サービス市場 Human Resource Service Market
GDPと人材派遣市場変化率の対比 1991-2007年度 GDP VS Staffing Markets Growth 1991-2007 人材派遣市場データ(グラフ) Staffing Industry Data (Graph)
〔資料出所〕厚生労働省「労働者派遣事業報告集計結果調査特別調査」Source: White Paper on Temporary Staffing Business, Ministry of Health, Labour and Welfare※売上高の数字は、一般と特定の合計 Figures for net sales represent the sum of the sales of General and Specific.
06
(億円/100 millions of Yen) (万人/10 thousand persons)
年度(Fiscal year)
0 0
50
100
150
250
300
350
400
450
500
550
91 92 93 94 95 96 97 98 99 00 01 02 03 0504
10,899 10,80811,827
15,706 14,605
16,717
19,462
22,472 23,614
13,335
40,351
54,189
28,615
■売上高:一般(億円)/Net sales: General■売上高:特定(億円)/Net sales: Specific■派遣労働者数:一般(万人)延べ人数/Total number of workers:General■派遣労働者数:常用換算した場合(一般+特定)/Total number of workers regular calculation basis(General+Specific)■派遣労働者数:特定(万人)/Number of workers:Specific
5,000
10,000
15,000
20,000
25,000
30,000
35,000
40,000
45,000
50,000
55,000
人材紹介市場データ Placement and Recruiting Industry Data
Net sales (100 millions of yen)売上高(億円) 1,718
2006 年度(Fiscal Year)
出典 : 厚生労働省「職業紹介事業報告」“専門的・技術的職業”“管理的職業”“事務的職業”の合計Source: Total for specialist, technical, administrative and clerical work-Report on employment placement issued by the Ministry of Health, Labour and
Welfare of Japan.
385 524 570 837
2001 2002 2003 2004
1,221
2005
Net sales (100 millions of yen)
出典:日本人材紹介事業協会 再就職支援協議会「再就職支援事業市場調査」Source: Survey on the reemployment support business market issued by the Japan Executive Search, and Recruitment Association and the Outplacement
Council.
再就職支援市場データ Outplacement Industry Data
196売上高(億円)
2006 年度(Fiscal Year)
220 320 370 300 214
2001
160
2000
146
1999
73
1998
38
1997 2002 2003 2004 2005
200
9,488 9,31910,172
2007
1.5
2006
2.5
34.3
2005
2.4
41.0
2004
2.0
21.2
2003
2.1
5.1
2002
1.1
15.5
2001
-0.8
16.4
2000
2.6
14.5
1999
0.7
-7.0
1998
-1.5
17.8
1997
0.0
12.8
1996
2.9
16.3
1995
2.5
9.2
1994
2.3
-1.8
1993
-1.0
-12.2
1992
1.1
-0.8
1991
2.2
22.9
GDP経済成長率(%)
-20
-10
0
10
20
30
40
50
0706050403020100999897969594939291■ 経済成長率(右目盛り)/GDP(Right scale)■ 人材派遣市場成長率(左目盛り)/Staffing markets growth(Left scale)
1996年派遣対象業務の拡大1996 Extension of the scope of temporary operations
1999年派遣対象業務原則自由化1999 Revised Worker Dispatch Law enacted
2000年紹介予定派遣解禁2000 Ban on temp-to-perm lifted1993年
細川連立内閣、定期預金金利完全自由化1993 Hosokawa coalition Cabinet, completely liberalized interest on fixed deposits
1997年大手金融機関の破綻1997 Major financial institutions go bankrupt
2001年日本再生・構造改革(小泉内閣)、米国同時多発テロ2001 Japan revitalization and structural reform (Koizumi Cabinet), 9/11 terrorist attacks in U.S.
2006年ゼロ金利政策解除2006 Zero interest policy terminated
2004年製造業務派遣解禁2004 Ban on certain types of manufacturing operations lifted
1999年欧州通貨統合、日銀ゼロ金利政策1999 European currencies unified, BOJ zero interest policy
2007年郵政民営化、福田内閣2007 Post Office privatized, Fukuda Cabinet
2005年中国人民元切り上げ、郵政民営化法成立2005 China revalues the yuan, Post Office privatization law passed
2003年イラク戦争2003 Iraq war
(%)(%)
Staffing markets growth人材派遣市場成長率(%)
-2.0
-1.5
-1.0
-0.5
0.0
0.5
1.0
1.5
2.0
2.5
4.0
3.0
5.0
4.5
3.5

7
労働者派遣法 Worker Dispatch Law
現在の派遣法規制 Current regulations under the Worker Dispatch Law 規制緩和の流れ History of Deregulation
1. Restrictions on the contract period for temporary staff1) There are no restrictions on contract periods for temporary
staff applicable to 26 job categories identified under government ordinance. * However, employers must propose direct employment to
the temporary staff when the company seeks to newly hire a full-time or part-time employee after the temporary staff has worked for the company for more than three years.
2) Types of deregulated and manufacturing operations are restricted to a maximum of three years. * However, in the event the temporary staffing period
exceeds one year, hearing procedures are an essential requirement.
* Furthermore, employers must propose direct employment to all temporary staff, who by mutual agreement seek to renew their contract after a period of three years.
3) Temporary to permanent employment is restricted to six months.* A company cannot employ the same temporary worker for
a period of more than six months. (Operating Guidelines by the Ministry of Health, Labour and Welfare)
2. Temporary Staffing — Prohibited Job Categories • Port transport services • Construction work • Security services • Medical-related services
(Excluding temporary to permanent employment, temporary staffing to social welfare facilities, alternative temporary staffing to cover maternity leave, child-care leave and nursing care leave, and temporary staffing of medical practitioners to remote rural areas)
• Operations relating to group negotiation or labor contract negotiation pursuant to the Labor Standards Law with employers as a part of personnel-related operations
• Operations undertaken by lawyers, international lawyers, judicial scriveners, registered land and building surveyors, certified public accountants, tax accountants, patent agents and certified social insurance labor consultants (excluding certain operations conducted by certified public accountants, patent agents, administrative scriveners, tax accountants and certified social insurance labor consultants)
List of 26 job categories under government ordinance 1. Information system development 2. Machine engineering and design 3. Broadcasting equipment operator 4. Production of broadcasting programs 5. Office equipment operator 6. Interpreter, translator, stenographer 7. Secretary 8. Filing 9. Research10. Finance11. Trade12. Demonstration13. Travel conductor14. Building maintenance and cleaning15. Building facility operator16. Reception, information services, parking facility management17. Research and development18. Office systems implementation planning and proposal19. Production and editing of printed material20. Advertising design21. Interior coordinator22. Announcer23. OA instruction24. Telemarketer25. Sales engineer marketing, Marketing of financial products26. Broadcasting program sets and props
〜
〜
主な出来事
労働者派遣法施行人材派遣市場の健全な育成を目的に施行ソフトウェア開発や秘書など適用対象業務13業務に限定してスタート (同年3業務追加、16業務に)
高齢者特例派遣事業スタート60歳以上の高齢者については、派遣対象業務が原則自由化される
派遣対象業務の拡大インテリアコーディネーターやOAインストラクターなど派遣適用対象業務が拡大(計26業務に)
職業紹介の規制緩和実施職業紹介の取扱業務が従来の29職業から原則自由化職業安定法も改正され、民間職業紹介が幅広く認知されるとともに、事業のルールが明確化される
派遣対象業務の原則自由化派遣対象業務が一部の禁止業務を除き原則自由化(ネガティブリスト化)営業職・販売職など「新職種」派遣期間を1年に限定してスタート
紹介予定派遣解禁紹介予定派遣(テンプ・トゥ・パーム)が解禁
雇用対策臨時特例法施行中高年については「新職種」の派遣期間が特例措置として3年に延長
派遣対象業務の拡大医療業務の派遣が一部解禁
派遣対象業務と派遣期間の拡大製造業務の派遣が解禁「新職種」の派遣期間の延長(1年⇒3年)紹介予定派遣の事前面接の解禁と派遣期間の拡大
派遣対象業務の拡大育児・介護休業取得者の代替要員について医療業務の派遣が解禁
派遣期間の延長製造業務の派遣期間の延長(1年⇒3年)
年
1986
1994
1996
1997
1999
1999
2000
2002
2003
2004
2006
2007
Major Event
Worker Dispatch Law enactedIntent of the law is to provide for healthy growth in the temporary staffing market. Thirteen occupations, such as software development and secretarial work were covered initially, with three more added during the first year.
Use of elderly as temporary staff beginsDispatch of workers over 60 years old liberalized in principle.
Extension of the scope of temporary operations The law is extended to cover a total of 26 occupations, including interior coordinators and office equipment instructors.
Deregulation of placement servicesRegulations governing placement of 29 occupations is liberalized in principle. The Employment Security Law is revised, raising the awareness of placement services in a wide range of public companies, while also clarifying business rules.
Revised Worker Dispatch Law enactedTemporary staffing occupations liberalized in principle (negative listing).“New types” of occupations such as sales and marketing positions liberalized but restricted to one year.
Ban on temp-to-perm lifted
Temporary Special Law for Employment Promotion enactedSpecial measure implemented extending tem-porary staffing period of middle-aged workers to three years for “new types” of occupations.
Extension of the scope of temporary operationsBan on certain types of medical occupations lifted.
Extension of the scope and term of temporary staffing operationsBan on certain types of manufacturing operations lifted. Dispatch period for“new types” of occupations extended from one to three years. Ban on pre-hire interviews for temp-to-perm positions lifted. Temporary staffing period exended.
Extension of the scope of temporary staffing operationsBan on replacements for child-care and family-care leave in medical occupations lifted.
Extension of the term of temporarystaffing operationsDispatch period for manufacturing operations extended from one to three years.
Year
1986
1994
1996
1997
1999
1999
2000
2002
2003
2004
2006
2007
1. 派遣期間の制限① 政令に定められた26業務は期間無制限* 但し、同一派遣社員が3年を超えて従事する部署に正社員・アルバイト・パート社員の新規採用を行おうとする場合、派遣先は派遣社員に対して直接雇用を申し込まなければならない。
② 自由化業務および製造業務最長3年* 但し派遣期間が1年を超える場合は、意見聴取の手続きを必要とする。
* この期間(3年)を超えると、派遣先は派遣社員に直接雇用を申し込まなければならない。
③ 紹介予定派遣は最長6ヵ月* 同一派遣社員を6ヵ月を超えて派遣することはできない。(厚生労働省「業務取扱要領」)
2. 派遣禁止業務 • 港湾運送業務 • 建設業務 • 警備業務 • 医療関係業務(紹介予定派遣、社会福祉施設への派遣、産休・育休・介護休業者の代替派遣、へき地への医師の派遣は除く)
• 人事労務関係業務のうち、派遣先において団体交渉又は労働基準法に規定する協定の締結等のための労使協議の際に使用者側の直接当事者として行う業務
• 弁護士、外国法律事務弁護士、司法書士、土地家屋調査士、公認会計士、税理士、弁理士、社会保険労務士の業務(公認会計士、弁理士、行政書士、税理士、および社会保険労務士の一部業務は除く)
参考 Reference
「政令26業務」一覧 1号:情報システム開発 2号:機械設計 3号:放送機器操作 4号:放送番組等の制作 5号:事務用機器操作 6号:通訳、翻訳、速記 7号:秘書 8号:ファイリング 9号:調査10号:財務11号:貿易12号:デモンストレーション13号:添乗14号:建築物清掃15号:建築設備運転等16号:受付・案内、駐車場管理等17号:研究開発18号:事業の実施体制の企画、立案19号:書籍等の制作・編集20号:広告デザイン21号インテリアコーディネーター22号:アナウンサー23号:OAインストラクション24号:テレマーケティングの営業25号:セールスエンジニアの営業、金融商品の営業26号:放送番組等における大道具・小道具
20.3
4.9
4.6
3.8 3.7
45.5
41.1
20.8
2.7
41.6

8
主要財務指標(連結) Key Indicators (Consolidated)
Net Sales and Gross Profit Margin
売上高と売上総利益率
236,945
08/5
6,444
08/5
29,468
08/5
154.2
08/5
(百万円 Millions of Yen) (%)
250,000
200,000
150,000
100,000
50,000
0
25
20
15
10
5
0売上高/Net Sales売上総利益率 /Gross Profit Margin
Operating Income and Operating Income Ratio
営業利益と営業利益率
(百万円 Millions of Yen) (%)
9,000
7,500
6,000
4,500
3,000
1,500
6
5
4
3
2
1
0営業利益/Operating Income営業利益率/Operating Income Ratio
Net Assets and Shareholders' Equity Ratio
純資産と自己資本比率
(百万円 Millions of Yen) (%)
30,000
25,000
20,000
15,000
10,000
5,000
0
60
50
40
30
20
10
0純資産/Net Assets自己資本比率 /Shareholders' Equity Ratio
Current Ratio
流動比率
(%)
0
300
250
200
150
100
50
流動比率/Current Ratio
前期比 YOY
2.5%
0.5pt
11.4%
1.5pt
-24.2%
-1.0pt
-24.6%
-1.0pt
-29.4%
-0.5pt
7.5%
9.5%
0.5pt
2.1pt
16.0%
14.4%
2008/5
236,945
20.8%
42,925
18.1%
6,444
2.7%
6,637
2.8%
2,962
1.3%
58,513
29,468
41.6%
154.2%
4,982
1,335
(百万円/Millions of Yen)主要経営指標 Key Indicators
Key Indicators
Net Sales
Gross Profit Margin*1
SGA Expenses
SGA Expenses Ratio
Operating Income
Operating Income Ratio
Ordinary Income
Ordinary Income Ratio
Net Income
Return on Sales
Total Assets
Net Assets*2
Shareholders' Equity Ratio*3,4
Current Ratio*5
Number of Employees*6
Number of contract workers of employees
*1*2
*3*4
*5*6
売上総利益/売上高×100 Gross Profit / Net Sales×100会計基準の変更に伴い、従来の株主資本を純資産とし2006年5月期は少数株主持分3,988百万円を含めた金額で表示しております。尚、普通株式に係る純資産額に相当する金額は、23,645百万円となっております。In line with changes in accounting standards, total shareholders’ equity is reported as net assets and includes an amount of ¥3,988 million representing minority interests from the fiscal year ended May 31, 2006. Under conventional standards, net assets applicable to common stock for the period under review was ¥23,645 million.普通株式に係る純資産/総資産×100 Net Assets Applicable to Common Stock / Total Assets×100会計基準の変更に伴い純資産の算出基準が変更されておりますが、2006年5月期も普通株式に係る純資産額に相当する金額より自己資本比率を算出しております。While the criteria for calculating net assets has changed in line with changes in accounting standards, Pasona has applied the conventional standard and utilized an amount equivalent to net assets applicable to common stock in the calculation of the shareholders’ equity ratio.流動資産/流動負債×100 Current Assets / Current Liabilities×100契約社員含む Include Contract Workers
0
156,979
179,156
20.220.9 20.8203,815
04/5 05/5 06/5
20.320.3
231,231
07/5
7,6488,238
7,745
4.94.9
4.64.6
3.83.8
8,507
3.73.74.9
4.6
3.8 3.7
04/5 05/5 06/5 07/5
20,644
27,634
42.5
15,732
48.145.545.545.5
04/5 05/5 06/5
26,904
41.141.141.1
07/5
160.2182.8 170.8
04/5 05/5 06/5
152.1
07/5
前期比 YOY
13.8%
-0.6pt
15.5%
0.2pt
-6.0%
-0.8pt
-5.4%
-0.8pt
-17.8%
-0.6pt
21.1%
33.9%
-2.6pt
-12.0pt
18.1%
17.4%
2006/5
203,815
20.2%
33,491
16.4%
7,745
3.8%
7,844
3.8%
3,588
1.8%
51,931
27,634
45.5%
170.8%
3,692
1,084
前期比 YOY
13.5%
0.1pt
15.1%
0.2pt
9.8%
-0.1pt
12.3%
0.0pt
17.0%
0.1pt
4.8%
-2.6%
-4.4pt
-18.7pt
16.3%
7.7%
2007/5
231,231
20.3%
38,542
16.6%
8,507
3.7%
8,807
3.8%
4,198
1.8%
54,425
26,904
41.1%
152.1%
4,293
1,167
前期比 YOY
14.1%
-0.1pt
15.5%
0.2pt
7.7%
-0.3pt
13.1%
-0.1pt
19.6%
0.1pt
15.9%
31.2%
5.6pt
22.6pt
17.1%
33.6%
2005/5
179,156
20.8%
28,992
16.2%
8,238
4.6%
8,289
4.6%
4,363
2.4%
42,884
20,644
48.1%
182.8%
3,127
923
前期比 YOY
15.7%
1.2pt
19.2%
0.5pt
34.5%
0.7pt
36.4%
0.7pt
79.9%
0.8pt
25.8%
86.9%
13.9pt
37.9pt
15.7%
11.3%
2004/5
156,979
20.9%
25,104
16.0%
7,648
4.9%
7,329
4.7%
3,647
2.3%
37,004
15,732
42.5%
160.2%
2,670
691
前期比 YOY
1.3%
1.5pt
7.7%
0.9pt
18.8%
0.6pt
27.3%
0.8pt
2.7%
0.0pt
10.9%
31.8%
4.5pt
0.7pt
10.4%
12.1%
2003/5
135,625
19.7%
21,058
15.5%
5,687
4.2%
5,373
4.0%
2,027
1.5%
29,425
8,418
28.6%
122.3%
2,308
621
前期比 YOY
23.9%
-2.6pt
17.1%
-0.9pt
-16.6%
-1.7pt
-22.7%
-1.9pt
—
—
-8.1%
112.6%
13.7pt
7.3pt
15.4%
25.6%
2002/5
133,822
18.2%
19,557
14.6%
4,786
3.6%
4,222
3.2%
1,974
1.5%
26,526
6,388
24.1%
121.6%
2,091
554
前期比 YOY
—
—
—
—
—
—
—
—
—
—
—
—
—
—
—
—
2001/5
108,031
20.8%
16,695
15.5%
5,742
5.3%
5,464
5.1%
(6,849)
-6.3%
28,849
3,004
10.4%
114.3%
1,812
441
本冊子のデータは、特に注記のない限り、2007年5月期までは株式会社パソナの連結または単体のデータであり、2008年5月期からは持株会社体制移行に伴い、株式会社パソナグループの連結データとなっております。Unless otherwise stated, the data included in this report for the periods up to and including the fiscal year ended May 31, 2007 are consolidated or non-consolidated data for Pasona Inc. Following the shift to a pure holding company, the data for the periods commencing the fiscal year ended May 31, 2008 and beyond are consolidated data for Pasona Group Inc.
経営指標
売上高
売上総利益率*1
販売費及び一般管理費
売上高販管費比率
営業利益
営業利益率
経常利益
経常利益率
当期純利益
売上高当期純利益率
総資産
純資産*2
自己資本比率*3,4
流動比率*5
従業員数*6
うち契約社員
20.820.820.3 20.8
2.72.72.7
41.641.641.6

9
2,0882,090
1,856
1,644
1,4341,253
37
6067 66
70
51
08/5 08/5 08/5
Return on Equity and Return on Assets
自己資本当期純利益率および総資産当期純利益率 Return on Sales
売上高当期純利益率
(%)
3.0
2.5
2.0
1.5
1.0
0.5
0
Price/Earnings Ratio and Price Book Value Ratio
株価収益率および株価純資産倍率
(倍 Times)
50
40
30
20
10
0株価収益率/Price/Earnings Ratio株価純資産倍率 /Price Book Value Ratio
Net Assets per Share
(円 Yen)
150,000
120,000
90,000
60,000
30,000
0自己資本当期純利益率/Return on Equity総資産当期純利益率 /Return on Assets
2005/5
47,510.68
1,500
15.1
25.0
5.2
-57.1
1,592
前期比 YOY
0.2pt
0.1pt
-6.2pt
-0.1pt
-61.4%
2005/5
16.2%
2.4%
24.0%
10.9%
9,933.92
2004/5
110,676.06
2,000
7.8
47.5
11.0
79.7
3,153
前期比 YOY
0.5pt
0.8pt
2.8pt
3.8pt
73.6%
2004/5
16.0%
2.3%
30.2%
11.0%
25,713.38
2003/5
61,600.04
-
-
20.7
5.0
-73.7
3,228
前期比 YOY
0.9pt
0.0pt
-14.6pt
-0.1pt
-79.9%
2003/5
15.5%
1.5%
27.4%
7.2%
14,813.83
2002/5
233,808.15
-
-
22.2
7.0
104.8
(2,438)
前期比 YOY
-0.9pt
—
—
—
—
2002/5
14.6%
1.5%
42.0%
7.1%
73,738.60
2001/5
114,147.33
-
-
-
-
-
(9,709)
前期比 YOY
—
—
—
—
—
2001/5
15.5%
-6.3%
—
—
(325,044.94)
収益性に関する経営指標 Profitability Indicators
バリュエーションに関する経営指標 Valuation Indicators
Key Indicators
SGA Expenses Ratio
Return on Sales
Return on Equity*1,8,9
Return on Assets*2
Net Income (Loss) per Share (Yen)*3,9
*4*5*6*7*8
*9*10
*1*2*3
1株当たり純資産
経営指標
売上高販管費比率
売上高当期純利益率
自己資本当期純利益率*1,8,9
総資産当期純利益率*2
1株当たり当期純利益(損失)(円)*3,9
経営指標
1株当たり純資産(BPS)(円)*4,8,9
1株当たり配当金(円)*9
配当性向(%)*5
株価収益率(PER)(倍)*6,9
株価純資産倍率(PBR)(倍)*7,8,9
1株当たり純資産成長率 (%)*8,9
フリーキャッシュ・フロー(百万円)
Key Indicators
Net Assets per Share (Yen)*4,8,9
Cash Dividends per Share (Yen)*9
Payout Ratio (%)*5
Price/Earnings Ratio (Times)*6,9
Price Book Value Ratio (Times)*7,8,9
BPS Growth Ratio (%)*8,9
Free Cash Flows (Millions of yen)
2006/5
54,599.58
1,800
21.7
27.1
4.1
14.9
2,553
前期比 YOY
0.2pt
-0.6pt
-7.8pt
-3.3pt
-16.5%
2006/5
16.4%
1.8%
16.2%
7.6%
8,292.17
2008/5
58,363.62
2,500
35.2
11.6
1.4
8.6
3,006
前期比 YOY
1.5pt
-0.5pt
-5.5pt
-2.7pt
-28.9%
2008/5
18.1%
1.3%
12.7%
5.2%
7,109.95
2007/5
53,759.81
2,000
20.0
23.1
4.3
-1.5
2,671
前期比 YOY
0.2pt
0.1pt
2.0pt
0.3pt
20.6%
2007/5
16.6%
1.8%
18.2%
7.9%
10,003.68
当期純利益/前・当期末純資産平均×100 Net Income / Average Net Assets×100当期純利益/前・当期末総資産平均×100 Net Income / Average Total Assets×100当期純利益/期中平均発行済株式総数 Net Income / Average Outstanding Shares
普通株式に係る純資産/期中平均発行済株式総数 Net Assets Applicable to Common Stock / Average Outstanding Shares配当金/当期純利益(連結) Cash Dividends / Net Income (Consolidated)年度末株価/1株当たり当期純利益×100 Stock Price (Year-end) / EPS×100年度末株価/1株当たり純資産×100 Stock Price (Year-end) / BPS×100会計基準の変更に伴い純資産額の算出基準が変更されておりますが、2006年5月期の1株当たり純資産、株価純資産倍率につきましても普通株式に係る純資産額に相当する金額で算出しております。While the criteria for calculating net assets has changed in line with changes in accounting standards, Pasona has applied the conventional standard and utilized an amount equivalent to net assets applicable to common stock in the calculation for net assets per share and price book value ratio for the fiscal year ended May 31, 2006.2002年7月22日付で株式1株につき5株、2004年7月20日付で株式1株につき3株の株式分割をそれぞれ実施 The Company conducted five-for-one and three-for-one stock splits on July 22, 2002 and July 20, 2004, respectively.2004年7月20日に分割後の発行済株式総数で調整した配当額 The cash dividend amount has been adjusted to account for the number of shares issued and outstanding after the stock split conducted on July 20, 2004 for reference purposes.
30.2
24.0
11.0 10.9
16.2
7.6
04/5 05/5 06/5
18.2
12.7
5.27.9
07/5
25.0
47.5
5.2
11.0
27.1
4.1
04/5 05/5 06/5
23.1
4.3
11.6
1.4
07/5
110,676.06
47,510.68
54,599.58
04/5 05/5 06/5
53,759.81 58,363.62
07/5
(%)
50.0
40.0
30.0
20.0
10.0
0
本冊子のデータは、特に注記のない限り、2007年5月期までは株式会社パソナの連結または単体のデータであり、2008年5月期からは持株会社体制移行に伴い、株式会社パソナグループの連結データとなっております。Unless otherwise stated, the data included in this report for the periods up to and including the fiscal year ended May 31, 2007 are consolidated or non-consolidated data for Pasona Inc. Following the shift to a pure holding company, the data for the periods commencing the fiscal year ended May 31, 2008 and beyond are consolidated data for Pasona Group Inc.
2.32.4
1.8
04/5 05/5 06/5
1.8
1.3
07/5 08/5
(667)*10
10
人材派遣・請負 人材紹介 再就職支援 アウトソーシング その他 消去または全社 合計
売上高 Net Sales
(百万円/Millions of Yen)
2007/52006/52005/52004/52003/5
人材派遣・請負 /人材紹介 再就職支援 アウトソーシング その他 消去または全社 合計
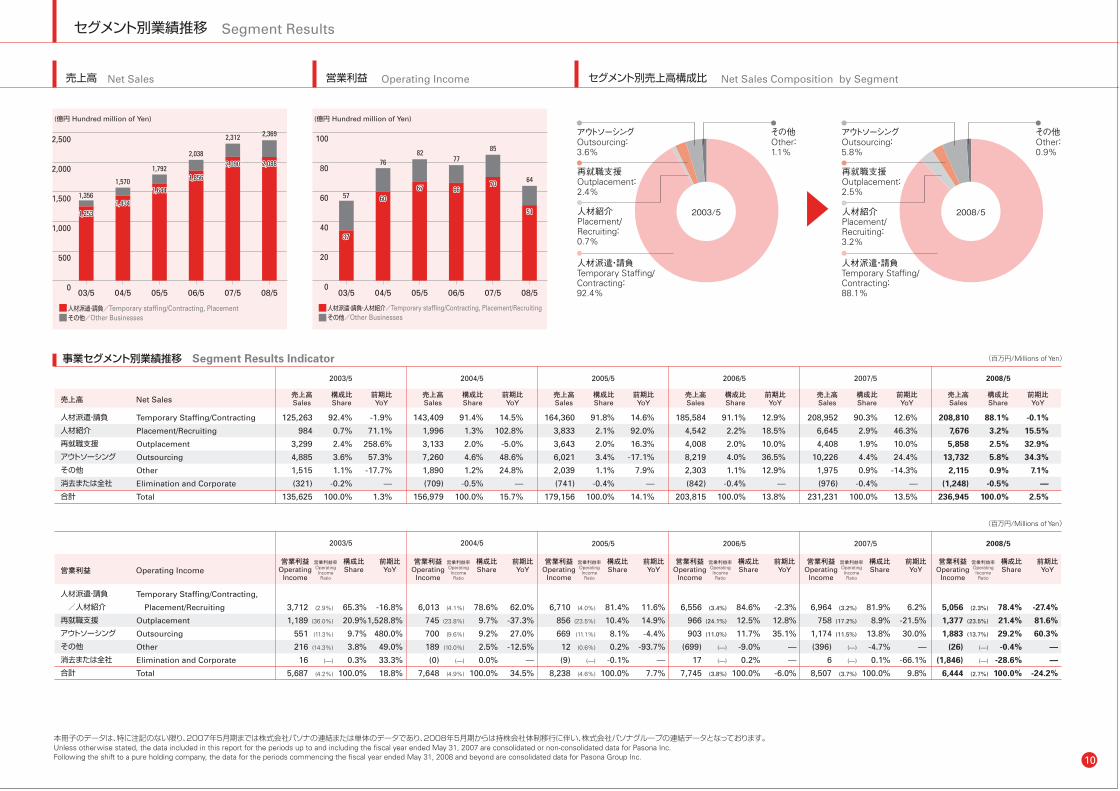
2008/5
-0.1%
15.5%
32.9%
34.3%
7.1%
—
2.5%
88.1%
3.2%
2.5%
5.8%
0.9%
-0.5%
100.0%
208,810
7,676
5,858
13,732
2,115
(1,248)
236,945
2008/5
-27.4%
81.6%
60.3%
—
—
-24.2%
78.4%
21.4%
29.2%
-0.4%
-28.6%
100.0%
5,056
1,377
1,883
(26)
(1,846)
6,444
(2.3%)
(23.5%)
(13.7%)
(—)
(—)
(2.7%)
営業利益 Operating Income
(百万円/Millions of Yen)
事業セグメント別業績推移 Segment Results Indicator
Temporary Staffing/Contracting
Placement/Recruiting
Outplacement
Outsourcing
Other
Elimination and Corporate
Total
Temporary Staffing/Contracting,
Placement/Recruiting
Outplacement
Outsourcing
Other
Elimination and Corporate
Total
2006/52005/52004/52003/5
12.9%
18.5%
10.0%
36.5%
12.9%
—
13.8%
91.1%
2.2%
2.0%
4.0%
1.1%
-0.4%
100.0%
185,584
4,542
4,008
8,219
2,303
(842)
203,815
14.6%
92.0%
16.3%
-17.1%
7.9%
—
14.1%
91.8%
2.1%
2.0%
3.4%
1.1%
-0.4%
100.0%
164,360
3,833
3,643
6,021
2,039
(741)
179,156
14.5%
102.8%
-5.0%
48.6%
24.8%
—
15.7%
91.4%
1.3%
2.0%
4.6%
1.2%
-0.5%
100.0%
143,409
1,996
3,133
7,260
1,890
(709)
156,979
-1.9%
71.1%
258.6%
57.3%
-17.7%
—
1.3%
前期比YoY
92.4%
0.7%
2.4%
3.6%
1.1%
-0.2%
100.0%
構成比Share
125,263
984
3,299
4,885
1,515
(321)
135,625
売上高Sales
2007/5
12.6%
46.3%
10.0%
24.4%
-14.3%
—
13.5%
90.3%
2.9%
1.9%
4.4%
0.9%
-0.4%
100.0%
208,952
6,645
4,408
10,226
1,975
(976)
231,231
前期比YoY
構成比Share
売上高Sales
前期比YoY
構成比Share
売上高Sales
前期比YoY
構成比Share
売上高Sales
前期比YoY
構成比Share
売上高Sales
前期比YoY
構成比Share
売上高Sales
-2.3%
12.8%
35.1%
—
—
-6.0%
84.6%
12.5%
11.7%
-9.0%
0.2%
100.0%
6,556
966
903
(699)
17
7,745
11.6%
14.9%
-4.4%
-93.7%
—
7.7%
81.4%
10.4%
8.1%
0.2%
-0.1%
100.0%
6,710
856
669
12
(9)
8,238
62.0%
-37.3%
27.0%
-12.5%
34.5%
78.6%
9.7%
9.2%
2.5%
0.0%
100.0%
6,013
745
700
189
(0)
7,648
-16.8%
1,528.8%
480.0%
49.0%
33.3%
18.8%
65.3%
20.9%
9.7%
3.8%
0.3%
100.0%
3,712
1,189
551
216
16
5,687
(2.9%)
(36.0%)
(11.3%)
(14.3%)
(—)
(4.2%)
(4.1%)
(23.8%)
(9.6%)
(10.0%)
(—)
(4.9%)
(4.0%)
(23.5%)
(11.1%)
(0.6%)
(—)
(4.6%)
(3.4%)
(24.1%)
(11.0%)
(—)
(—)
(3.8%)
6.2%
-21.5%
30.0%
—
-66.1%
9.8%
81.9%
8.9%
13.8%
-4.7%
0.1%
100.0%
6,964
758
1,174
(396)
6
8,507
(3.2%)
(17.2%)
(11.5%)
(—)
(—)
(3.7%)
前期比YoY
構成比Share
営業利益Operating
Income
営業利益率OperatingIncomeRatio
前期比YoY
構成比Share
営業利益Operating
Income
営業利益率OperatingIncomeRatio
前期比YoY
構成比Share
営業利益Operating
Income
営業利益率OperatingIncomeRatio
前期比YoY
構成比Share
営業利益Operating
Income
営業利益率OperatingIncomeRatio
前期比YoY
構成比Share
営業利益Operating
Income
営業利益率OperatingIncomeRatio
前期比YoY
構成比Share
営業利益Operating
Income
営業利益率OperatingIncomeRatio
セグメント別売上高構成比 Net Sales Composition by Segment売上高 Net Sales 営業利益 Operating Income
人材派遣・請負Temporary Staffing/Contracting:92.4%
再就職支援Outplacement:2.4%
その他Other:1.1%
アウトソーシングOutsourcing:3.6%
人材紹介Placement/Recruiting:0.7%
03/5 04/5 05/5 06/5 07/5 08/5
人材派遣・請負/Temporary staffing/Contracting, Placementその他/Other Businesses
03/5 04/5 05/5 06/5 07/5 08/5
(億円 Hundred million of Yen)
人材派遣・請負・人材紹介/Temporary staffing/Contracting, Placement/Recruitingその他/Other Businesses
(億円 Hundred million of Yen)
本冊子のデータは、特に注記のない限り、2007年5月期までは株式会社パソナの連結または単体のデータであり、2008年5月期からは持株会社体制移行に伴い、株式会社パソナグループの連結データとなっております。Unless otherwise stated, the data included in this report for the periods up to and including the fiscal year ended May 31, 2007 are consolidated or non-consolidated data for Pasona Inc. Following the shift to a pure holding company, the data for the periods commencing the fiscal year ended May 31, 2008 and beyond are consolidated data for Pasona Group Inc.
0
20
40
60
80
100
0
500
1,000
1,500
2,000
2,500
セグメント別業績推移 Segment Results
2003/5
人材派遣・請負Temporary Staffing/Contracting:88.1%
再就職支援Outplacement:2.5%
その他Other:0.9%
アウトソーシングOutsourcing:5.8%
人材紹介Placement/Recruiting:3.2%
2008/5
2,0882,0882,0902,090
1,8561,856
1,6441,644
1,4341,4341,2531,253
2,3692,312
2,038
1,792
1,570
1,356
2,088
3737
60606767 6666
7070
5151
2,090
1,4341,253
37
6067 66
70
51
57
7682
7785
641,644
1,856

11
セグメント別業績推移 Segment Results
派遣職種別売上高 Net Sales by Staffing Type
2007/5
クラリカル*1
テクニカル*2 ITエンジニアリング*3
営業・販売職*4
その他派遣・請負*5 派遣付随業務*6
人材派遣・請負事業計
Clerical*1
Technical*2
IT/Engineering*3
Sales*4
Other*5
Temporary staffing-related business*6
Total
職種 Staffing Type
(百万円/Millions of Yen)
地域別売上高 Net Sales by Region
北海道・東北 関東(東京以外) 東京 東海・北信越 関西 中国・四国・九州 海外 合計
Hokkaido, Tohoku
Kanto (except Tokyo)
Tokyo
Tokai, Hokushinetsu
Kansai
Chugoku, Shikoku, Kyushu
Overseas
Total
2008/5
-1.3%
-1.2%
5.2%
8.2%
-3.9%
-21.4%
-0.1%
54.2%
16.1%
10.7%
9.0%
9.9%
0.1%
100.0%
112,968
33,653
22,253
18,794
20,623
220
208,513
3.6%
-2.8%
5.5%
1.2%
-0.9%
3.5%
-15.3%
2.5%
2.2%
9.6%
49.4%
11.6%
16.2%
9.4%
1.6%
100.0%
5,331
22,821
116,944
27,489
38,361
22,258
3,738
236,945
地域 RegionType
(百万円/Millions of Yen)
2006/52005/52004/52003/5
18.2%
7.0%
8.4%
4.7%
8.2%
1.6%
12.9%
54.3%
16.8%
10.9%
7.4%
10.4%
0.2%
100.0%
100,629
31,204
20,100
13,789
19,292
322
185,339
51.9%
17.8%
11.3%
8.0%
10.9%
0.2%
100.0%
85,142
29,154
18,546
13,176
17,830
317
164,169
51.6%
18.5%
12.2%
7.9%
9.7%
0.2%
100.0%
73,881
26,452
17,442
11,254
13,896
250
143,178
53.5%
19.1%
13.2%
14.0%
0.2%
100.0%
66,975
23,873
16,549
17,487
253
125,139
15.2%
10.2%
6.3%
17.1%
28.3%
26.8%
14.7%
10.3%
10.8%
5.4%
43.8%
-1.2%
14.4%
-3.0%
3.5%
-11.9%
7.6%
—
-1.6%
13.7%
9.1%
5.2%
25.9%
11.3%
-12.9%
12.6%
54.8%
16.3%
10.1%
8.3%
10.4%
0.1%
100.0%
114,418
34,050
21,143
17,367
21,469
281
208,730
前期比YoY
構成比Share
売上高Sales
前期比YoY
構成比Share
売上高Sales
前期比YoY
構成比Share
売上高Sales
前期比YoY
構成比Share
売上高Sales
前期比YoY
構成比Share
売上高Sales
前期比YoY
構成比Share
売上高Sales
2007/5 2008/52006/52005/52004/52003/5
前期比YoY
構成比Share
売上高Sales
前期比YoY
構成比Share
売上高Sales
前期比YoY
構成比Share
売上高Sales
前期比YoY
構成比Share
売上高Sales
前期比YoY
構成比Share
売上高Sales
前期比YoY
構成比Share
売上高Sales
2.7%
7.8%
16.0%
20.7%
9.7%
13.6%
13.0%
13.8%
2.4%
10.4%
48.7%
10.3%
18.2%
8.5%
1.5%
100.0%
4,800
21,169
99,142
21,050
37,138
17,385
3,127
203,815
7.2%
10.9%
11.8%
29.0%
4.2%
23.7%
41.1%
13.5%
2.2%
10.2%
47.9%
11.8%
16.7%
9.3%
1.9%
100.0%
5,147
23,479
110,805
27,165
38,706
21,513
4,414
231,231
24.7%
16.4%
8.8%
17.3%
15.3%
22.9%
146.0%
14.1%
2.6%
11.0%
47.7%
9.7%
18.9%
8.6%
1.5%
100.0%
4,675
19,646
85,453
17,435
33,868
15,310
2,767
179,156
8.9%
9.3%
10.2%
10.7%
32.9%
25.7%
—
15.7%
2.4%
10.8%
50.0%
9.5%
18.7%
7.9%
0.7%
100.0%
3,750
16,871
78,524
14,867
29,380
12,460
1,125
156,979
-0.3%
0.2%
2.5%
2.7%
7.2%
-15.3%
—
1.3%
2.5%
11.4%
52.6%
9.9%
16.3%
7.3%
—
100.0%
3,445
15,440
71,287
13,432
22,109
9,909
—
135,625
本冊子のデータは、特に注記のない限り、2007年5月期までは株式会社パソナの連結または単体のデータであり、2008年5月期からは持株会社体制移行に伴い、株式会社パソナグループの連結データとなっております。Unless otherwise stated, the data included in this report for the periods up to and including the fiscal year ended May 31, 2007 are consolidated or non-consolidated data for Pasona Inc. Following the shift to a pure holding company, the data for the periods commencing the fiscal year ended May 31, 2008 and beyond are consolidated data for Pasona Group Inc.
派遣職種別売上高構成比 Net Sales Composition by Staffing Type
クラリカル(一般事務)Clerical:53.5%
その他Other:14.0%
テクニカル(専門事務)Technical:19.1%
ITエンジニアリングIT/Engineering:13.2%
派遣付随業務Temporary staffing-related business:0.2%
2003/5
クラリカル(一般事務)Clerical:54.2%
営業・販売職Sales:9.0%
その他Other:9.9%
テクニカル(専門事務)Technical:16.1%
ITエンジニアリングIT/Engineering:10.7%
派遣付随業務Temporary staffing-related business:0.1%
2008/5
地域別売上高構成比 Net Sales Composition by Region
東京Tokyo:52.6%
関東(東京以外)Kanto(except Tokyo):11.4%関西
Kansai:16.3%
中国・四国・九州Chugoku, Shikoku, Kyushu:7.3%
東海・北信越Tokai, Hokushinetsu:9.9%
北海道・東北Hokkaido, Tohoku:2.5%
2003/5
東京Tokyo:49.4%
関東(東京以外)Kanto(except Tokyo):9.6%関西
Kansai:16.2%
中国・四国・九州Chugoku, Shikoku, Kyushu:9.4%
東海・北信越Tokai, Hokushinetsu:11.6%
北海道・東北Hokkaido, Tohoku:2.2%
2008/5
*1
*2
*3*4*5*6
クラリカル(一般事務職) 様々な一般事務職の派遣であり、あらゆる業界のオフィスで必要とされる様々な事務職業務を担当する派遣分野 Clerical (Standard office work) staffing features various temporary jobs for standard office work, covering all fields of office staffing necessary for any industry. テクニカル(専門事務職) 専門事務職(経理、英文会計、FP、保険・証券関係、通訳・翻訳等)の派遣で、比較的高度な専門スキル、資格を要する事務職業務に関する派遣分野 Technical (Specialized office work) includes positions in accounting, English document operation, financial planning, insurance and securities work, and translation and interpretation. This work requires a comparatively high level of skill or certification. ITエンジニアリング ネットワーク技術者やプログラマ、製造・設計技術者、PCエキスパートなど、IT関連業務に関する派遣分野 IT/Engineering includes temp positions for network engineers, programmers, manufacturing and design engineers, PC experts, and other work in IT-related fields. 営業・販売職 1999年12月の労働者派遣法改正により、派遣が認められた営業職及び販売職の派遣分野 Marketing and sales are fields that were mad possible by the revised December 1999 Temporary Workers’ Law.その他 上記以外の派遣、請負等の分野とグループ内取引消去 Other includes temporary staffing, contracting and work other than the aforementioned excluding intersegment sales. 派遣付随業務 研修やEQ検査等の分野 Temporary staffing-related business includes training and EQ inspection work.
12
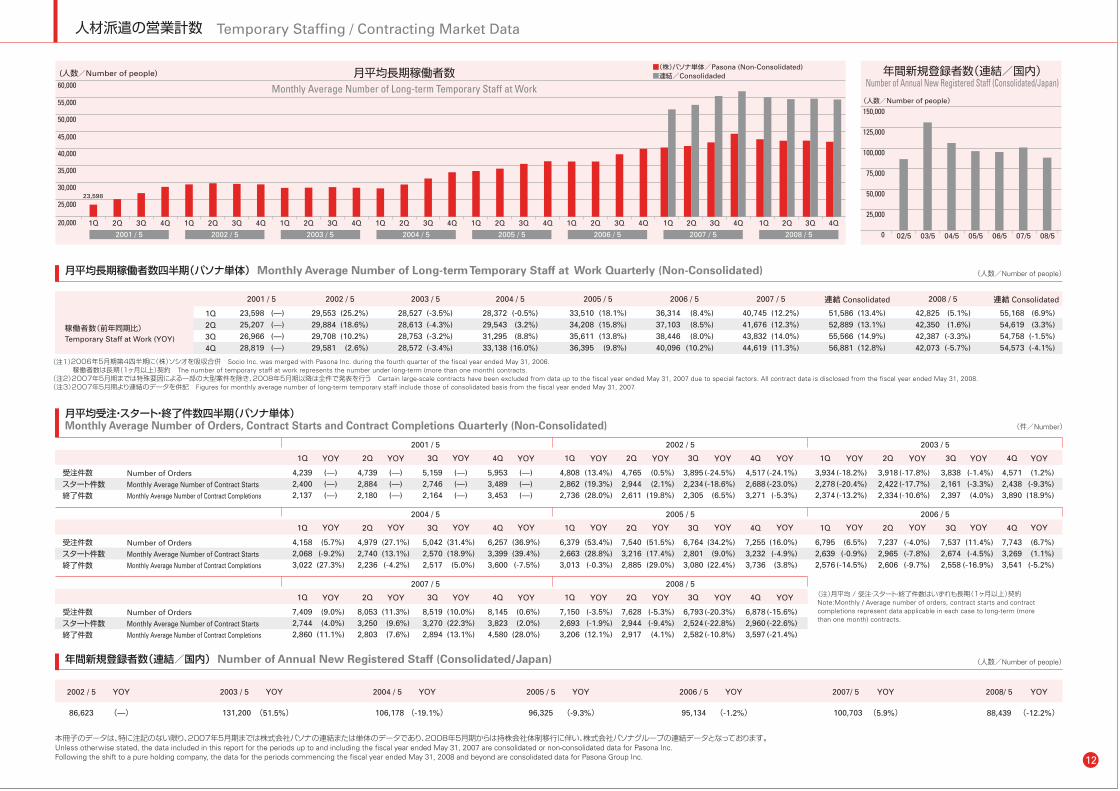
人材派遣の営業計数 Temporary Staffing / Contracting Market Data
月平均長期稼働者数
1Q
40,000
35,000
30,000
25,000
20,000 2Q 3Q 4Q
2001 / 5
1Q 2Q 3Q 4Q
2002 / 5
1Q 2Q 3Q 4Q
2003 / 5
1Q 2Q 3Q 4Q
2004 / 5
1Q 2Q 3Q 4Q
2005 / 5
1Q 2Q 3Q 4Q
2006 / 5
1Q 2Q 3Q 4Q 1Q 2Q 3Q
2007 / 5 2008 / 5
23,598
Monthly Average Number of Long-term Temporary Staff at Work
45,000
50,000
55,000
60,000
(人数/Number of people)
2002 / 5
29,55329,88429,70829,581
(25.2%)(18.6%)(10.2%) (2.6%)
2001 / 5
23,598 (—)25,207 (—)26,966 (—)28,819 (—)
1Q2Q3Q4Q
2004 / 5
28,372 29,543 31,295 33,138
2003 / 5
28,52728,61328,75328,572
(-3.5%)(-4.3%)(-3.2%)
(-3.4%)
2006 / 5
36,314 37,103 38,446 40,096
2007 / 5
40,745 41,676 43,832 44,619
連結 Consolidated
51,58652,88955,56656,881
2005 / 5
33,510 34,208 35,611 36,395
2008 / 5
42,82542,35042,38742,073
55,168 54,619 54,758 54,573
月平均長期稼働者数四半期(パソナ単体) Monthly Average Number of Long-term Temporary Staff at Work Quarterly (Non-Consolidated)
稼働者数(前年同期比)Temporary Staff at Work (YOY)
(人数/Number of people)
(注1)2006年5月期第4四半期に(株)ソシオを吸収合併 Socio Inc. was merged with Pasona Inc. during the fourth quarter of the fiscal year ended May 31, 2006.稼働者数は長期(1ヶ月以上)契約 The number of temporary staff at work represents the number under long-term (more than one month) contracts.
(注2)2007年5月期までは特殊要因による一部の大型案件を除き、2008年5月期以降は全件で発表を行う Certain large-scale contracts have been excluded from data up to the fiscal year ended May 31, 2007 due to special factors. All contract data is disclosed from the fiscal year ended May 31, 2008.(注3)2007年5月期より連結のデータを併記 Figures for monthly average number of long-term temporary staff include those of consolidated basis from the fiscal year ended May 31, 2007.
年間新規登録者数(連結/国内) Number of Annual New Registered Staff (Consolidated/Japan) (人数/Number of people)
86,623
2002 / 5
(—)
YOY
131,200
2003 / 5
(51.5%)
YOY
106,178
2004 / 5
(-19.1%)
YOY
96,325
2005 / 5
(-9.3%)
YOY
95,134
2006 / 5
(-1.2%)
YOY
100,703
2007/ 5
(5.9%)
YOY
88,439
2008/ 5
(-12.2%)
YOY
4Q
■(株)パソナ単体/Pasona (Non-Consolidated)■連結/Consolidaded 年間新規登録者数(連結/国内)
Number of Annual New Registered Staff (Consolidated/Japan)
0 02/5 03/5 04/5 05/5 06/5 07/5 08/5
(注)月平均 / 受注・スタート・終了件数はいずれも長期(1ヶ月以上)契約Note:Monthly / Average number of orders, contract starts and contract completions represent data applicable in each case to long-term (more than one month) contracts.
2002 / 52001 / 5 2003 / 5
(件/Number)月平均受注・スタート・終了件数四半期(パソナ単体)Monthly Average Number of Orders, Contract Starts and Contract Completions Quarterly (Non-Consolidated)
受注件数スタート件数終了件数
Number of Orders
Monthly Average Number of Contract Starts
Monthly Average Number of Contract Completions
1Q
4,2392,4002,137
(—)(—)(—)
YOY 3Q
5,1592,7462,164
(—)(—)(—)
YOY 4Q
5,9533,4893,453
(—)(—)(—)
YOY2Q
4,7392,8842,180
(—)(—)(—)
YOY 1Q
4,8082,8622,736
(13.4%)(19.3%)(28.0%)
YOY 2Q
4,7652,9442,611
(0.5%)(2.1%)
(19.8%)
YOY 3Q
3,8952,2342,305
(-24.5%)(-18.6%)
(6.5%)
YOY 4Q
4,5172,6883,271
(-24.1%)(-23.0%)
(-5.3%)
YOY 2Q
3,9182,4222,334
(-17.8%)(-17.7%)(-10.6%)
YOY1Q
3,9342,2782,374
(-18.2%)(-20.4%)(-13.2%)
YOY 3Q
3,8382,1612,397
(-1.4%)(-3.3%)(4.0%)
YOY 4Q
4,5712,4383,890
(1.2%)(-9.3%)(18.9%)
YOY
2005 / 52004 / 5 2006 / 5
受注件数スタート件数終了件数
Number of Orders
Monthly Average Number of Contract Starts
Monthly Average Number of Contract Completions
1Q
4,1582,0683,022
(5.7%)(-9.2%)(27.3%)
YOY 3Q
5,0422,5702,517
(31.4%)(18.9%)
(5.0%)
YOY 4Q
6,2573,3993,600
(36.9%)(39.4%)(-7.5%)
YOY2Q
4,9792,7402,236
(27.1%)(13.1%)(-4.2%)
YOY 1Q
6,3792,6633,013
(53.4%)(28.8%)(-0.3%)
YOY 2Q
7,5403,2162,885
(51.5%)(17.4%)(29.0%)
YOY 3Q
6,7642,8013,080
(34.2%)(9.0%)
(22.4%)
YOY 4Q
7,2553,2323,736
(16.0%)(-4.9%)(3.8%)
YOY 2Q
7,2372,9652,606
(-4.0%)(-7.8%)(-9.7%)
YOY1Q
6,7952,6392,576
(6.5%)(-0.9%)
(-14.5%)
YOY 3Q
7,5372,6742,558
(11.4%)(-4.5%)
(-16.9%)
YOY 4Q
7,7433,2693,541
(6.7%)(1.1%)
(-5.2%)
YOY
2008 / 52007 / 5
受注件数スタート件数終了件数
Number of Orders
Monthly Average Number of Contract Starts
Monthly Average Number of Contract Completions
1Q
7,4092,7442,860
(9.0%)(4.0%)
(11.1%)
YOY 3Q
8,5193,2702,894
(10.0%)(22.3%)(13.1%)
YOY 4Q
8,1453,8234,580
(0.6%)(2.0%)
(28.0%)
YOY2Q
8,0533,2502,803
(11.3%)(9.6%)(7.6%)
YOY 1Q
7,1502,6933,206
(-3.5%)(-1.9%)(12.1%)
YOY 2Q
7,6282,9442,917
(-5.3%)(-9.4%)(4.1%)
YOY 3Q
6,7932,5242,582
(-20.3%)(-22.8%)(-10.8%)
YOY 4Q
6,8782,9603,597
(-15.6%)(-22.6%)(-21.4%)
YOY
連結 Consolidated
(人数/Number of people)
本冊子のデータは、特に注記のない限り、2007年5月期までは株式会社パソナの連結または単体のデータであり、2008年5月期からは持株会社体制移行に伴い、株式会社パソナグループの連結データとなっております。Unless otherwise stated, the data included in this report for the periods up to and including the fiscal year ended May 31, 2007 are consolidated or non-consolidated data for Pasona Inc. Following the shift to a pure holding company, the data for the periods commencing the fiscal year ended May 31, 2008 and beyond are consolidated data for Pasona Group Inc.
150,000
125,000
100,000
75,000
50,000
25,000
(-0.5%)(3.2%)(8.8%)
(16.0%)
(18.1%)(15.8%)(13.8%) (9.8%)
(8.4%) (8.5%) (8.0%)
(10.2%)
(12.2%)(12.3%) (14.0%) (11.3%)
(13.4%)(13.1%)(14.9%)(12.8%)
(5.1%)(1.6%)
(-3.3%)(-5.7%)
(6.9%) (3.3%)
(-1.5%) (-4.1%)

13
連結貸借対照表 Consolidated Balance Sheets
¥
¥
2008/5
13,672
23,313
201
511
1,129
533
1,934
(81)
41,213
3,142
885
962
4,990
516
2,736
—
84
3,338
1,581
189
1,127
4,538
1,599
(64)
8,971
17,300
58,513
(百万円/Millions of Yen)
ASSETS
Current assets:
Cash and deposits
Notes and accounts receivable —trade
Marketable securities
Inventories
Deferred tax assets
Income tax receivable
Other current assets
Less allowance for doubtful receivables
Total current assets
Fixed assets:
Property and equipment:
Buildings
Land
Other tangibles
Total tangible fixed assets
Intangible assets:
Goodwill
Software
Consolidation adjustment account
Other intangibles
Total intangible fixed assets
Investments and other assets:
Investment securities
Long-term loans
Deferred tax assets
Lease guarantee deposits
Other investments
Less allowance for doubtful receivables
Total investments and other assets
Total fixed assets
Total assets
資産の部
流動資産
現金及び預金
受取手形及び売掛金
有価証券
たな卸資産
繰延税金資産
未収法人税等
その他
貸倒引当金
流動資産合計
固定資産
有形固定資産
建物
土地
その他
有形固定資産合計
無形固定資産
のれん
ソフトウェア
連結調整勘定
その他
無形固定資産合計
投資その他の資産
投資有価証券
長期貸付金
繰延税金資産
敷金及び保証金
その他
貸倒引当金
投資その他の資産合計
固定資産合計
資産合計
¥
¥
¥
¥
¥
¥
¥
¥
¥
¥
¥
¥
2006/5
14,284
21,022
461
348
950
5
1,928
(72)
38,928
2,023
793
746
3,563
—
1,713
585
92
2,390
1,523
165
907
3,309
1,246
(103)
7,048
13,003
51,931
2005/5
11,745
17,997
461
333
803
1
1,472
(69)
32,745
1,851
656
555
3,063
—
1,209
117
86
1,413
972
66
549
2,986
1,157
(70)
5,662
10,138
42,884
2004/5
10,149
16,078
462
193
915
87
1,114
(79)
28,921
1,039
656
276
1,972
—
1,110
262
86
1,460
751
133
1,220
2,194
419
(69)
4,651
8,083
37,004
2003/5
5,591
13,561
462
204
606
10
1,077
(83)
21,431
736
656
159
1,551
—
1,193
265
79
1,537
784
97
1,806
1,916
395
(95)
4,905
7,994
29,425
2002/5
4,854
11,836
462
124
317
13
780
(64)
18,324
666
655
95
1,417
—
1,116
327
74
1,517
756
135
2,511
1,662
250
(49)
5,266
8,201
26,526
2001/5
8,541
10,664
432
122
487
—
473
(49)
20,672
630
907
46
1,584
—
628
434
71
1,133
517
—
3,243
1,517
239
(59)
5,458
8,177
28,849
¥
¥
2007/5
11,470
23,667
361
320
1,106
5
2,240
(87)
39,086
2,531
793
1,060
4,384
765
1,799
—
82
2,647
1,846
187
787
4,073
1,503
(92)
8,306
15,338
54,425
本冊子のデータは、特に注記のない限り、2007年5月期までは株式会社パソナの連結または単体のデータであり、2008年5月期からは持株会社体制移行に伴い、株式会社パソナグループの連結データとなっております。Unless otherwise stated, the data included in this report for the periods up to and including the fiscal year ended May 31, 2007 are consolidated or non-consolidated data for Pasona Inc. Following the shift to a pure holding company, the data for the periods commencing the fiscal year ended May 31, 2008 and beyond are consolidated data for Pasona Group Inc.

14
連結貸借対照表 Consolidated Balance Sheets
¥
¥
¥
¥
¥
2008/5
1,773
112
2,404
11,259
2,096
2,639
—
1,910
14
4,521
26,731
7
51
—
813
943
430
68
2,313
29,045
—
—
—
—
—
—
—
—
—
—
5,000
8,887
12,682
(2,257)
24,312
41
(22)
19
5,136
29,468
58,513
¥
¥
¥
¥
¥
2007/5
1,387111
3,12211,3002,1692,665
—1,594
193,331
25,704
95745
706972
—24
1,81627,520
—
—————————
8,3587,493
10,636(4,287)22,200
9679
1754,528
26,90454,425
(百万円/Millions of Yen)
LIABILITIESCurrent liabilities: Accounts payable — trade Short-term loans payable Accounts payable — other Accrued expenses Income taxes payable Consumption taxes payable Deferred tax liabilities Reserve for bonus Reserve for directors’ bonus Other current liabilitiesTotal current liabilitiesLong-term liabilities: Long-term debt Long-term payables—other Deferred tax liabilities Allowance for employees’ severance retirement benefits Allowance for directors’ retirement benefits Allowance for head office relocation expenses Other long-term liabilities Total long-term liabilitiesTotal liabilitiesMINORITY INTERESTSMinority interestsSHAREHOLDERS’ EQUITYCommon stock Capital reserve Retained loss Capital surplus Retained earnings (loss)Net unrealized holding gain on other securitiesForeign currency translation adjustmentTotal shareholders’ equityTotal liabilities, minority interests and shareholders’equity
NET ASSETSShareholders’ equity Common stock Capital surplus Retained earnings Treasury stockTotal shareholders’ equityValuation and conversion Net unrealized holding gain on other securities Foreign currency translation adjustmentTotal valuation and conversionMinority interestsTotal net assets Total liabilities and net assets
負債の部流動負債 買掛金 短期借入金 未払金 未払費用 未払法人税等 未払消費税等 繰延税金負債 賞与引当金 役員賞与引当金 その他流動負債合計固定負債 長期借入金 長期未払金 繰延税金負債 退職給付引当金 役員退職慰労引当金 本社移転費用引当金 その他固定負債合計負債合計少数株主持分少数株主持分資本の部 資本金 資本準備金 欠損金 資本剰余金 利益剰余金 その他有価証券評価差額金 為替換算調整勘定資本合計負債、少数株主持分及び資本合計
純資産の部株主資本 資本金 資本剰余金 利益剰余金 自己株式株主資本合計評価・換算差額等 その他有価証券評価差額金 為替換算調整勘定評価・換算差額等合計少数株主持分純資産合計負債純資産合計
¥
¥
¥
¥
¥
2006/5
1,039191
2,4679,9442,6262,480
—1,279
1282,631
22,788
—3199
570794
—12
1,50824,297
—
—————————
8,3227,4577,664
—23,444
14061
2013,988
27,63451,931
¥
¥
¥
¥
¥
2005/5
721307
2,1698,5421,4142,047
—1,183
— 1,52917,916
—124
5398646
—12
1,18719,104
3,135
8,285——
7,4204,821
124(6)
20,64442,884
—————
——————
¥
¥
¥
¥
¥
2004/5
7231,4601,8297,0991,8562,144
—1,107
—1,835
18,056
—435
5267535
—12
1,25619,313
1,958
7,911——
7,046796
0(22)
15,73237,004
—————
——————
¥
¥
¥
¥
¥
2003/5
6402,6651,5656,4081,6641,638
—958
—1,983
17,524
1,065575
558
353—7
2,06519,589
1,417
6,062——
5,197(2,841)
(0)—
8,41829,425
—————
——————
¥
¥
¥
¥
¥
2002/5
2812,5311,1146,482
1242,368
—867
—1,296
15,066
3,105792
—32
233—2
4,16519,232
906
6,0625,1974,873
——0
—6,388
26,526
—————
——————
¥
¥
¥
¥
¥
2001/5
5122,3851,1295,8182,1324,374
0836
—893
18,082
6,777—0
25138
—3
6,94525,027
817
5,4254,4256,847
——0
—3,004
28,849
—————
——————
本冊子のデータは、特に注記のない限り、2007年5月期までは株式会社パソナの連結または単体のデータであり、2008年5月期からは持株会社体制移行に伴い、株式会社パソナグループの連結データとなっております。Unless otherwise stated, the data included in this report for the periods up to and including the fiscal year ended May 31, 2007 are consolidated or non-consolidated data for Pasona Inc. Following the shift to a pure holding company, the data for the periods commencing the fiscal year ended May 31, 2008 and beyond are consolidated data for Pasona Group Inc.
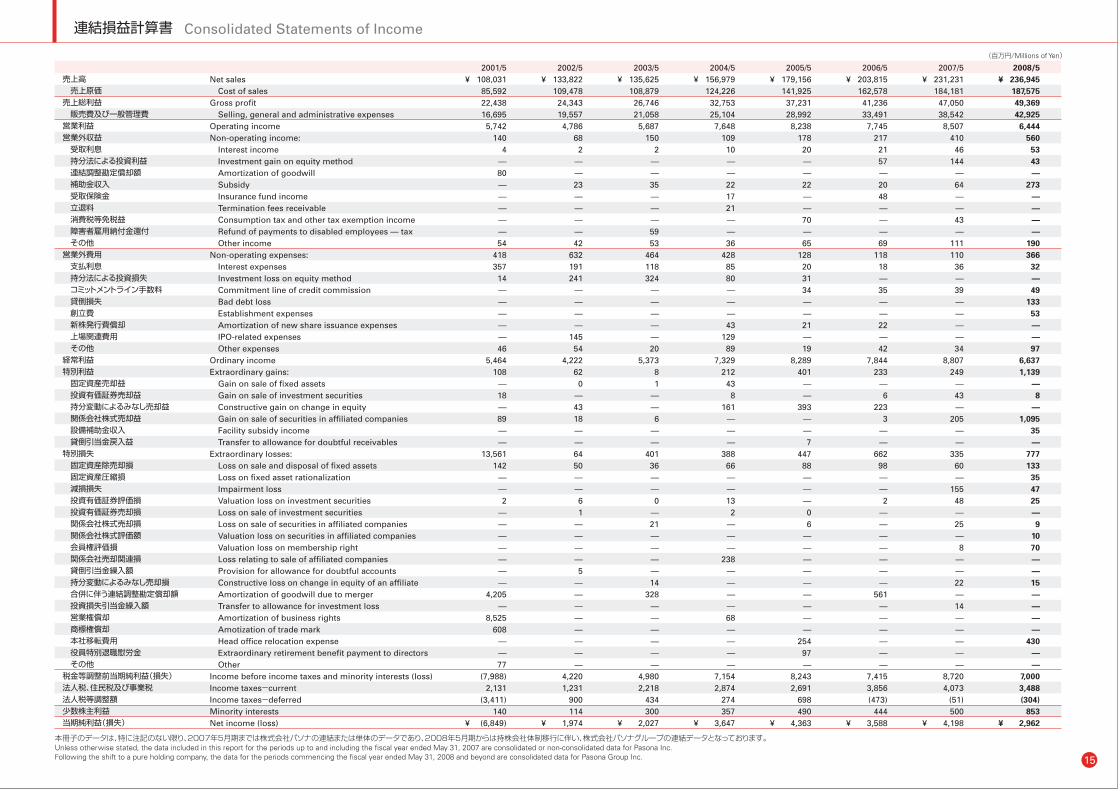
連結損益計算書 Consolidated Statements of Income
15
¥
¥
2008/5
236,945
187,575
49,369
42,925
6,444
560
53
43
—
273
—
—
—
—
190
366
32
—
49
133
53
—
—
97
6,637
1,139
—
8
—
1,095
35
—
777
133
35
47
25
—
9
10
70
—
—
15
—
—
—
—
430
—
—
7,000
3,488
(304)
853
2,962
¥
¥
2007/5231,231184,18147,05038,542
8,507410
46144
—64——43—
111110
36—39————34
8,807249
—43—
205——
33560—
15548—25—8
——22—14—————
8,7204,073
(51)500
4,198
売上高 売上原価売上総利益 販売費及び一般管理費営業利益営業外収益 受取利息 持分法による投資利益 連結調整勘定償却額 補助金収入 受取保険金 立退料 消費税等免税益 障害者雇用納付金還付 その他営業外費用 支払利息 持分法による投資損失 コミットメントライン手数料 貸倒損失 創立費 新株発行費償却 上場関連費用 その他経常利益特別利益 固定資産売却益 投資有価証券売却益 持分変動によるみなし売却益 関係会社株式売却益 設備補助金収入 貸倒引当金戻入益特別損失 固定資産除売却損 固定資産圧縮損 減損損失 投資有価証券評価損 投資有価証券売却損 関係会社株式売却損 関係会社株式評価額 会員権評価損 関係会社売却関連損 貸倒引当金繰入額 持分変動によるみなし売却損 合併に伴う連結調整勘定償却額 投資損失引当金繰入額 営業権償却 商標権償却 本社移転費用 役員特別退職慰労金 その他税金等調整前当期純利益(損失)法人税、住民税及び事業税法人税等調整額少数株主利益当期純利益(損失)
(百万円/Millions of Yen)
Net sales Cost of salesGross profit Selling, general and administrative expenses Operating incomeNon-operating income: Interest income Investment gain on equity method Amortization of goodwill Subsidy Insurance fund income Termination fees receivable Consumption tax and other tax exemption income Refund of payments to disabled employees — tax Other incomeNon-operating expenses: Interest expenses Investment loss on equity method Commitment line of credit commission Bad debt loss Establishment expenses Amortization of new share issuance expenses IPO-related expenses Other expenses Ordinary incomeExtraordinary gains: Gain on sale of fixed assets Gain on sale of investment securities Constructive gain on change in equity Gain on sale of securities in affiliated companies Facility subsidy income Transfer to allowance for doubtful receivablesExtraordinary losses: Loss on sale and disposal of fixed assets Loss on fixed asset rationalization Impairment loss Valuation loss on investment securities Loss on sale of investment securities Loss on sale of securities in affiliated companies Valuation loss on securities in affiliated companies Valuation loss on membership right Loss relating to sale of affiliated companies Provision for allowance for doubtful accounts Constructive loss on change in equity of an affiliate Amortization of goodwill due to merger Transfer to allowance for investment loss Amortization of business rights Amotization of trade mark Head office relocation expense Extraordinary retirement benefit payment to directors Other Income before income taxes and minority interests (loss)Income taxes-currentIncome taxes-deferredMinority interestsNet income (loss)
¥
¥
2006/5203,815162,57841,23633,4917,745
2172157—2048———69
11818—35——22—42
7,844233
—6
2233
——
66298——2
———————
561——————
7,4153,856(473)
4443,588
¥
¥
2005/5179,156141,92537,23128,9928,238
17820——22——70—65
128203134——21—19
8,289401
——
393——7
44788———06
—————————
25497—
8,2432,691
698490
4,363
¥
¥
2004/5156,979124,22632,75325,104
7,648109
10——221721——36
4288580———43
12989
7,329212
438
161———
38866——132
———
238————68————
7,1542,874
274357
3,647
¥
¥
2003/5135,625108,87926,74621,058
5,687150
2——35———5953
464118324
—————20
5,37381
——6
——
40136——0
—21————14
328——————
4,9802,218
434300
2,027
¥
¥
2002/5133,822109,47824,34319,5574,786
682
——23————42
632191241
————
14554
4,222620
—4318——6450——61
————5
————————
4,2201,231
900114
1,974
¥
¥
2001/5108,03185,59222,43816,695
5,742140
4—80—————54
418357
14—————46
5,464108
—18—89——
13,561142
——2
———————
4,205—
8,525608
——77
(7,988)2,131
(3,411)140
(6,849)
本冊子のデータは、特に注記のない限り、2007年5月期までは株式会社パソナの連結または単体のデータであり、2008年5月期からは持株会社体制移行に伴い、株式会社パソナグループの連結データとなっております。Unless otherwise stated, the data included in this report for the periods up to and including the fiscal year ended May 31, 2007 are consolidated or non-consolidated data for Pasona Inc. Following the shift to a pure holding company, the data for the periods commencing the fiscal year ended May 31, 2008 and beyond are consolidated data for Pasona Group Inc.

連結キャッシュ・フロー計算書 Consolidated Statements of Cash Flows
16
(百万円/Millions of Yen)
営業活動によるキャッシュ・フロー
税金等調整前当期純利益
減価償却費
減損損失
営業権償却
商標権償却
社債発行差額金償却額
その他償却費
連結調整勘定償却額
のれん償却額
貸倒損失
貸倒引当金の増加額(( )は減少額)
賞与引当金の増加額
役員賞与引当金の増加額(( )は減少額)
退職給付引当金の増加額
役員退職慰労引当金の増加額(( )は減少額)
本社移転費用引当金の増加額
受取利息及び受取配当金
補助金収入
支払利息
為替差損(( )は差益)
持分法による投資損失(( )は投資利益)
持分変動によるみなし売却損(( )は売却益)
固定資産売却益
固定資産除売却損
固定資産圧縮損
本社移転に伴う固定資産除売却損
投資有価証券売却益
投資有価証券売却損
投資有価証券評価損
関係会社売却関連損
関連会社株式売却益
関連会社株式売却損
関係会社株式評価損
売上債権の減少額(( )は増加額)
たな卸資産の減少額(( )は増加額)
その他資産の減少額(( )は増加額)
営業債務の増加額(( )は減少額)
未払消費税等の増加額(( )は減少額)
その他負債の増加額(( )は減少額)
役員賞与の支払額
その他
小計
利息及び配当金の受取額
利息の支払額
補助金の受取額
法人税等の支払額
営業活動によるキャッシュ・フロー
2002/5
4,220
213
—
—
—
—
32
150
—
—
3
30
—
6
95
—
(3)
—
191
0
241
(43)
(0)
50
—
—
—
1
6
—
(18)
—
—
(1,137)
(2)
(209)
381
(2,006)
193
(0)
—
2,397
7
(215)
—
(3,253)
(1,063)
¥
¥
2003/5
4,980
380
—
—
—
—
21
459
—
—
48
37
—
17
115
—
(4)
—
118
(0)
324
14
(1)
36
—
—
—
—
0
—
—
15
—
(1,099)
(78)
(146)
(206)
(809)
939
(4)
—
5,161
7
(131)
—
(721)
4,316
¥
¥
2004/5
7,154
557
—
—
—
—
94
219
—
—
(44)
122
—
191
181
—
(11)
—
85
6
80
(161)
(43)
66
—
—
(8)
2
13
238
—
—
—
(2,074)
13
76
744
482
(573)
(7)
—
7,405
15
(99)
—
(2,761)
4,559
¥
¥
2005/5
8,243
682
—
—
—
—
69
134
—
—
(7)
75
—
129
110
—
(23)
—
20
(4)
31
(393)
—
88
—
124
—
0
—
—
—
6
—
(2,098)
(107)
(294)
1,456
(76)
377
(61)
—
8,486
20
(24)
—
(3,182)
5,298
¥
¥
2006/5
7,415
939
—
—
—
—
17
688
—
—
34
83
128
169
148
—
(25)
—
18
5
(57)
(223)
—
98
—
—
(6)
—
2
—
(3)
—
—
(2,388)
(11)
(343)
1,112
385
1,416
(107)
—
9,495
37
(18)
—
(2,618)
6,895
¥
¥
2008/5
7,000
1,403
47
—
—
—
—
—
275
134
(26)
306
(4)
109
(28)
430
(60)
(308)
32
24
(43)
15
—
133
35
—
(8)
—
25
—
(1,095)
9
10
309
(189)
(81)
214
(0)
986
—
81
9,736
65
(33)
300
(4,093)
5,974
¥
¥
2007/5
8,720
1,071
155
—
—
—
16
—
276
—
26
323
(111)
136
177
—
(49)
—
36
(15)
(144)
22
—
60
—
—
(43)
—
48
—
(205)
25
—
(2,712)
14
(587)
1,395
242
1,507
(4)
12
10,397
54
(35)
—
(4,518)
5,897
¥
¥
Cash flows from operating activities:
Income before income taxes
Depreciation
Impairment loss
Amortization of business rights
Amortization of trade mark
Amortization of balance of issuance of bonds
Amortization of others
Amortization of consolidation adjustment account (excess of costs over assets acquired)
Amortization of goodwill
Bad debt loss
Increase (decrease) in allowance for doubtful receivables
Increase in reserve for bonus
Increase (decrease) in reserve for directors’ bonus
Increase in allowance for employees’ severance retirement benefits
Increase (decrease) in allowance for directors’ retirement benefits
Increase in allowance for head office relocation expenses
Interest and dividend income
Subsidy
Interest expenses
Foreign exchange loss (gain)
Investment loss (gain) on equity method
Constructive loss (gain) on change in equity
Gain on sale of fixed assets
Loss on sale and disposal of fixed assets
Loss on fixed asset rationalization
Loss on sale and disposal of fixed assets related to head office relocation
Gain on sale of investment securities
Loss on sale of investment securities
Valuation loss on investment securities
Loss relating to sale of affiliated companies
Gain on sale of securities in affiliated companies
Loss on sale of securities in affiliated companies
Valuation loss on securities of affiliated companies
Decrease (increase) in accounts receivable trade
Decrease (increase) in inventories
Decrease (increase) in other current assets
Increase (decrease) in accounts payable trade
Increase (decrease) in consumption tax payable
Increase (decrease) in other current liabilities
Directors’ bonuses paid
Other
Subtotal
Interest and dividends received
Interest paid
Subsidy received
Income taxes paid
Net cash (used in) provided by operating activities
¥
¥
2001/5
(7,988)
154
—
8,525
608
1
45
4,299
—
—
41
123
—
1
138
—
(4)
—
357
0
14
—
—
142
—
—
(18)
—
2
—
(89)
—
—
(8,980)
(79)
(283)
5,192
4,743
673
(4)
—
7,616
6
(306)
—
(106)
7,209
本冊子のデータは、特に注記のない限り、2007年5月期までは株式会社パソナの連結または単体のデータであり、2008年5月期からは持株会社体制移行に伴い、株式会社パソナグループの連結データとなっております。Unless otherwise stated, the data included in this report for the periods up to and including the fiscal year ended May 31, 2007 are consolidated or non-consolidated data for Pasona Inc. Following the shift to a pure holding company, the data for the periods commencing the fiscal year ended May 31, 2008 and beyond are consolidated data for Pasona Group Inc.
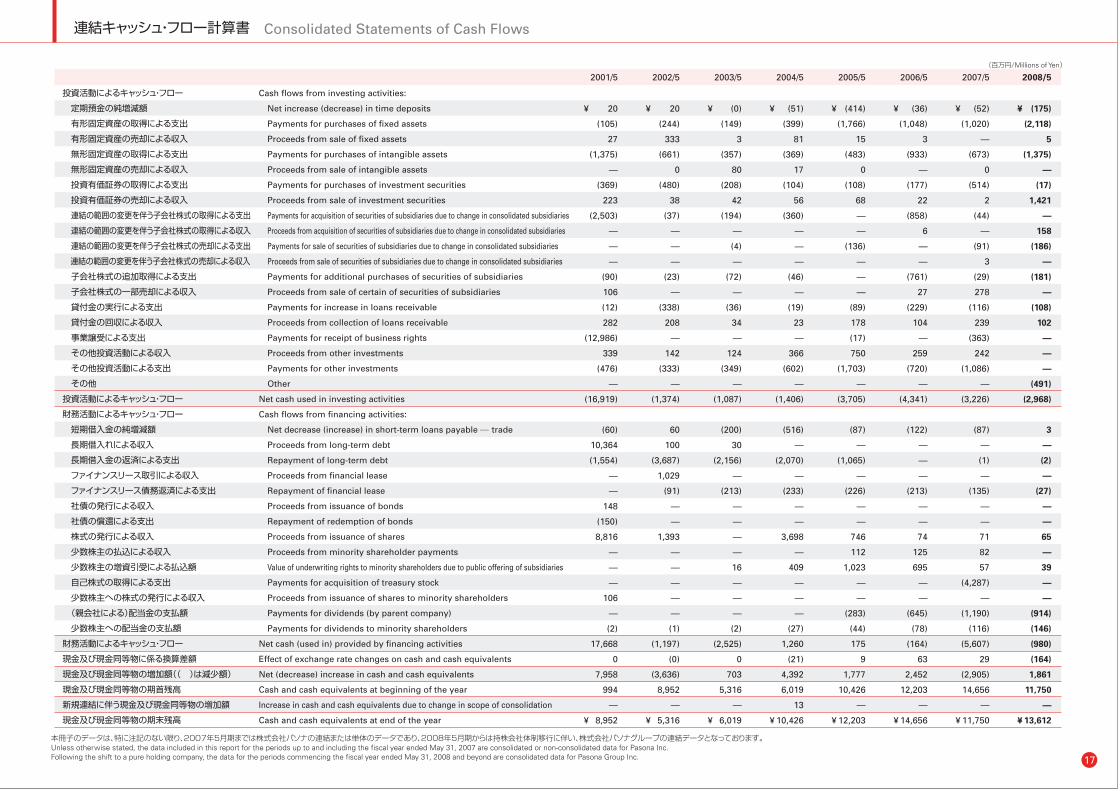
17
連結キャッシュ・フロー計算書 Consolidated Statements of Cash Flows
投資活動によるキャッシュ・フロー
定期預金の純増減額
有形固定資産の取得による支出
有形固定資産の売却による収入
無形固定資産の取得による支出
無形固定資産の売却による収入
投資有価証券の取得による支出
投資有価証券の売却による収入
連結の範囲の変更を伴う子会社株式の取得による支出
連結の範囲の変更を伴う子会社株式の取得による収入
連結の範囲の変更を伴う子会社株式の売却による支出
連結の範囲の変更を伴う子会社株式の売却による収入
子会社株式の追加取得による支出
子会社株式の一部売却による収入
貸付金の実行による支出
貸付金の回収による収入
事業譲受による支出
その他投資活動による収入
その他投資活動による支出
その他
投資活動によるキャッシュ・フロー
財務活動によるキャッシュ・フロー
短期借入金の純増減額
長期借入れによる収入
長期借入金の返済による支出
ファイナンスリース取引による収入
ファイナンスリース債務返済による支出
社債の発行による収入
社債の償還による支出
株式の発行による収入
少数株主の払込による収入
少数株主の増資引受による払込額
自己株式の取得による支出
少数株主への株式の発行による収入
(親会社による)配当金の支払額
少数株主への配当金の支払額
財務活動によるキャッシュ・フロー
現金及び現金同等物に係る換算差額
現金及び現金同等物の増加額(( )は減少額)
現金及び現金同等物の期首残高
新規連結に伴う現金及び現金同等物の増加額
現金及び現金同等物の期末残高
2002/5
20
(244)
333
(661)
0
(480)
38
(37)
—
—
—
(23)
—
(338)
208
—
142
(333)
—
(1,374)
60
100
(3,687)
1,029
(91)
—
—
1,393
—
—
—
—
—
(1)
(1,197)
(0)
(3,636)
8,952
—
5,316
¥
¥
2003/5
(0)
(149)
3
(357)
80
(208)
42
(194)
—
(4)
—
(72)
—
(36)
34
—
124
(349)
—
(1,087)
(200)
30
(2,156)
—
(213)
—
—
—
—
16
—
—
—
(2)
(2,525)
0
703
5,316
—
6,019
¥
¥
2004/5
(51)
(399)
81
(369)
17
(104)
56
(360)
—
—
—
(46)
—
(19)
23
—
366
(602)
—
(1,406)
(516)
—
(2,070)
—
(233)
—
—
3,698
—
409
—
—
—
(27)
1,260
(21)
4,392
6,019
13
10,426
¥
¥
2005/5
(414)
(1,766)
15
(483)
0
(108)
68
—
—
(136)
—
—
—
(89)
178
(17)
750
(1,703)
—
(3,705)
(87)
—
(1,065)
—
(226)
—
—
746
112
1,023
—
—
(283)
(44)
175
9
1,777
10,426
—
12,203
¥
¥
2006/5
(36)
(1,048)
3
(933)
—
(177)
22
(858)
6
—
—
(761)
27
(229)
104
—
259
(720)
—
(4,341)
(122)
—
—
—
(213)
—
—
74
125
695
—
—
(645)
(78)
(164)
63
2,452
12,203
—
14,656
¥
¥
2008/5
(175)
(2,118)
5
(1,375)
—
(17)
1,421
—
158
(186)
—
(181)
—
(108)
102
—
—
—
(491)
(2,968)
3
—
(2)
—
(27)
—
—
65
—
39
—
—
(914)
(146)
(980)
(164)
1,861
11,750
—
13,612
¥
¥
2007/5
(52)
(1,020)
—
(673)
0
(514)
2
(44)
—
(91)
3
(29)
278
(116)
239
(363)
242
(1,086)
—
(3,226)
(87)
—
(1)
—
(135)
—
—
71
82
57
(4,287)
—
(1,190)
(116)
(5,607)
29
(2,905)
14,656
—
11,750
¥
¥
(百万円/Millions of Yen)
Cash flows from investing activities:
Net increase (decrease) in time deposits
Payments for purchases of fixed assets
Proceeds from sale of fixed assets
Payments for purchases of intangible assets
Proceeds from sale of intangible assets
Payments for purchases of investment securities
Proceeds from sale of investment securities
Payments for acquisition of securities of subsidiaries due to change in consolidated subsidiaries
Proceeds from acquisition of securities of subsidiaries due to change in consolidated subsidiaries
Payments for sale of securities of subsidiaries due to change in consolidated subsidiaries
Proceeds from sale of securities of subsidiaries due to change in consolidated subsidiaries
Payments for additional purchases of securities of subsidiaries
Proceeds from sale of certain of securities of subsidiaries
Payments for increase in loans receivable
Proceeds from collection of loans receivable
Payments for receipt of business rights
Proceeds from other investments
Payments for other investments
Other
Net cash used in investing activities
Cash flows from financing activities:
Net decrease (increase) in short-term loans payable trade
Proceeds from long-term debt
Repayment of long-term debt
Proceeds from financial lease
Repayment of financial lease
Proceeds from issuance of bonds
Repayment of redemption of bonds
Proceeds from issuance of shares
Proceeds from minority shareholder payments
Value of underwriting rights to minority shareholders due to public offering of subsidiaries
Payments for acquisition of treasury stock
Proceeds from issuance of shares to minority shareholders
Payments for dividends (by parent company)
Payments for dividends to minority shareholders
Net cash (used in) provided by financing activities
Effect of exchange rate changes on cash and cash equivalents
Net (decrease) increase in cash and cash equivalents
Cash and cash equivalents at beginning of the year
Increase in cash and cash equivalents due to change in scope of consolidation
Cash and cash equivalents at end of the year
¥
¥
2001/5
20
(105)
27
(1,375)
—
(369)
223
(2,503)
—
—
—
(90)
106
(12)
282
(12,986)
339
(476)
—
(16,919)
(60)
10,364
(1,554)
—
—
148
(150)
8,816
—
—
—
106
—
(2)
17,668
0
7,958
994
—
8,952
本冊子のデータは、特に注記のない限り、2007年5月期までは株式会社パソナの連結または単体のデータであり、2008年5月期からは持株会社体制移行に伴い、株式会社パソナグループの連結データとなっております。Unless otherwise stated, the data included in this report for the periods up to and including the fiscal year ended May 31, 2007 are consolidated or non-consolidated data for Pasona Inc. Following the shift to a pure holding company, the data for the periods commencing the fiscal year ended May 31, 2008 and beyond are consolidated data for Pasona Group Inc.
2.8%
3.7%
4.4%
2.4%
4.0%
6.0%
3.5%
4.4%
5.2%
4.1%
3.1%
2.5%
3.8%
4.1%
4.8%
3.9%3.6%
2.6%
4.9% 4.8%4.7%
4.1%
5.5%
2.3%
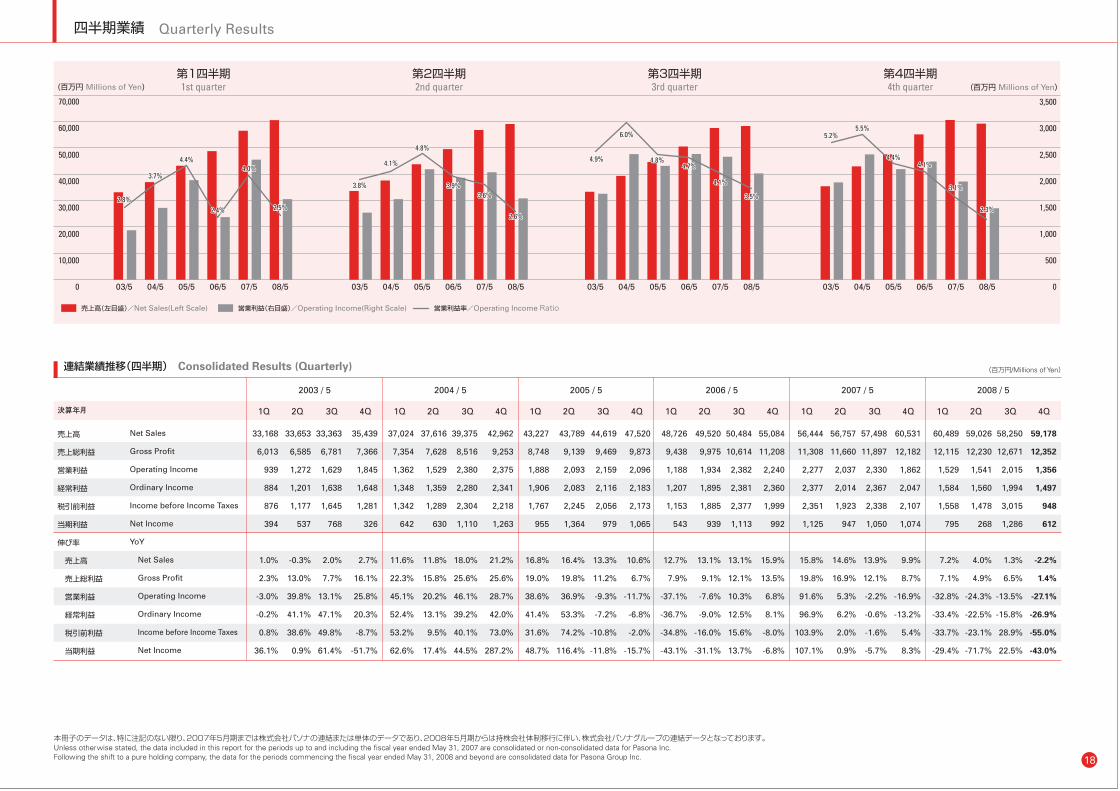
18
四半期業績 Quarterly Results
2005 / 52004 / 5
4Q3Q2Q1Q4Q3Q2Q1Q4Q3Q2Q1Q4Q3Q2Q1Q
2008 / 52007 / 52006 / 5
連結業績推移(四半期) Consolidated Results (Quarterly)
売上高
売上総利益
営業利益
経常利益
税引前利益
当期利益
伸び率
売上高
売上総利益
営業利益
経常利益
税引前利益
当期利益
決算年月
(百万円/Millions of Yen)
Net Sales
Gross Profit
Operating Income
Ordinary Income
Income before Income Taxes
Net Income
YoY
Net Sales
Gross Profit
Operating Income
Ordinary Income
Income before Income Taxes
Net Income
4Q3Q2Q1Q
37,024
7,354
1,362
1,348
1,342
642
11.6%
22.3%
45.1%
52.4%
53.2%
62.6%
37,616
7,628
1,529
1,359
1,289
630
11.8%
15.8%
20.2%
13.1%
9.5%
17.4%
39,375
8,516
2,380
2,280
2,304
1,110
18.0%
25.6%
46.1%
39.2%
40.1%
44.5%
42,962
9,253
2,375
2,341
2,218
1,263
21.2%
25.6%
28.7%
42.0%
73.0%
287.2%
2003 / 5
4Q3Q2Q1Q
33,168
6,013
939
884
876
394
1.0%
2.3%
-3.0%
-0.2%
0.8%
36.1%
33,653
6,585
1,272
1,201
1,177
537
-0.3%
13.0%
39.8%
41.1%
38.6%
0.9%
33,363
6,781
1,629
1,638
1,645
768
2.0%
7.7%
13.1%
47.1%
49.8%
61.4%
35,439
7,366
1,845
1,648
1,281
326
2.7%
16.1%
25.8%
20.3%
-8.7%
-51.7%
43,227
8,748
1,888
1,906
1,767
955
16.8%
19.0%
38.6%
41.4%
31.6%
48.7%
43,789
9,139
2,093
2,083
2,245
1,364
16.4%
19.8%
36.9%
53.3%
74.2%
116.4%
44,619
9,469
2,159
2,116
2,056
979
13.3%
11.2%
-9.3%
-7.2%
-10.8%
-11.8%
47,520
9,873
2,096
2,183
2,173
1,065
10.6%
6.7%
-11.7%
-6.8%
-2.0%
-15.7%
48,726
9,438
1,188
1,207
1,153
543
12.7%
7.9%
-37.1%
-36.7%
-34.8%
-43.1%
49,520
9,975
1,934
1,895
1,885
939
13.1%
9.1%
-7.6%
-9.0%
-16.0%
-31.1%
50,484
10,614
2,382
2,381
2,377
1,113
13.1%
12.1%
10.3%
12.5%
15.6%
13.7%
55,084
11,208
2,240
2,360
1,999
992
15.9%
13.5%
6.8%
8.1%
-8.0%
-6.8%
56,444
11,308
2,277
2,377
2,351
1,125
15.8%
19.8%
91.6%
96.9%
103.9%
107.1%
56,757
11,660
2,037
2,014
1,923
947
14.6%
16.9%
5.3%
6.2%
2.0%
0.9%
57,498
11,897
2,330
2,367
2,338
1,050
13.9%
12.1%
-2.2%
-0.6%
-1.6%
-5.7%
60,531
12,182
1,862
2,047
2,107
1,074
9.9%
8.7%
-16.9%
-13.2%
5.4%
8.3%
60,489
12,115
1,529
1,584
1,558
795
7.2%
7.1%
-32.8%
-33.4%
-33.7%
-29.4%
59,026
12,230
1,541
1,560
1,478
268
4.0%
4.9%
-24.3%
-22.5%
-23.1%
-71.7%
58,250
12,671
2,015
1,994
3,015
1,286
1.3%
6.5%
-13.5%
-15.8%
28.9%
22.5%
59,178
12,352
1,356
1,497
948
612
-2.2%
1.4%
-27.1%
-26.9%
-55.0%
-43.0%
売上高(左目盛)/Net Sales(Left Scale) 営業利益率/Operating Income Ratio営業利益(右目盛)/Operating Income(Right Scale)
0
2,500
2,000
1,500
1,000
500
0
50,000
40,000
30,000
20,000
10,000
1st quarter第1四半期
03/5 04/5 05/5 06/5 07/5 08/5
2.8%2.8%
3.7%3.7%
4.4%4.4%
2.4%2.4%
4.0%4.0%4.0%
2.8%
3.7%
4.4%
2.4%
2nd quarter第2四半期
03/5 04/5 05/5 06/5 07/5 08/5
3rd quarter第3四半期
03/5 04/5 05/5 06/5 07/5 08/5
6.0%6.0%
3.5%3.5%
4th quarter第4四半期
03/5 04/5 05/5 06/5 07/5 08/5
4.4%4.4%
5.2%5.2%
4.4%4.1%4.1%
3.1%3.1%3.1%
本冊子のデータは、特に注記のない限り、2007年5月期までは株式会社パソナの連結または単体のデータであり、2008年5月期からは持株会社体制移行に伴い、株式会社パソナグループの連結データとなっております。Unless otherwise stated, the data included in this report for the periods up to and including the fiscal year ended May 31, 2007 are consolidated or non-consolidated data for Pasona Inc. Following the shift to a pure holding company, the data for the periods commencing the fiscal year ended May 31, 2008 and beyond are consolidated data for Pasona Group Inc.
2.5%2.5%2.5%
(百万円 Millions of Yen)
70,000
60,000
3.8%3.8%3.8%
4.1%4.1%4.1%
4.8%4.8%4.8%
3.9%3.9%3.9%3.6%3.6%3.6%
2.6%2.6%2.6%
4.9%4.9%4.9%
6.0%
4.8%4.8%4.8%4.7%4.7%4.7%
4.1%4.1%4.1%
3.5%
5.2%5.5%5.5%5.5%
4.1%
(百万円 Millions of Yen)
3,500
3,000
2.3%2.3%2.3%
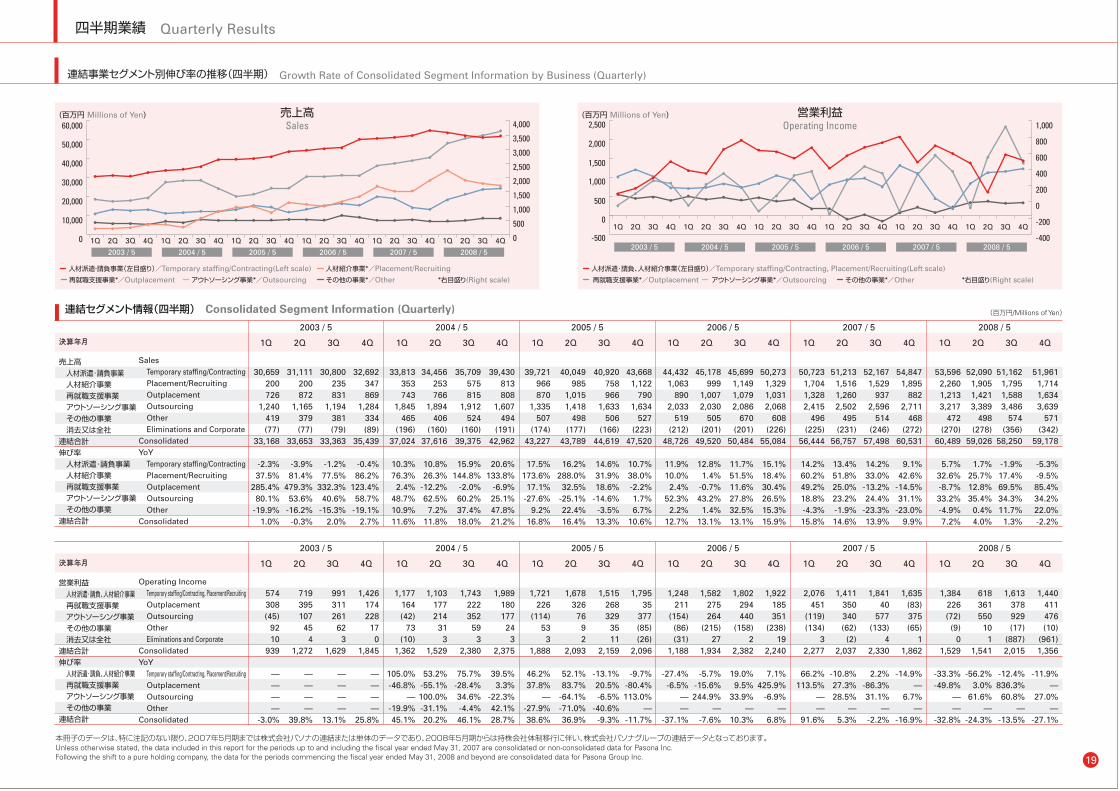
四半期業績 Quarterly Results
19
連結事業セグメント別伸び率の推移(四半期) Growth Rate of Consolidated Segment Information by Business (Quarterly)
(百万円 Millions of Yen)Sales売上高
人材派遣・請負事業(左目盛り)/Temporary staffing/Contracting(Left scale) 人材紹介事業*/Placement/Recruiting
再就職支援事業*/Outplacement アウトソーシング事業*/Outsourcing その他の事業*/Other
2005 / 52004 / 5
4Q3Q2Q1Q4Q3Q2Q1Q4Q3Q2Q1Q4Q3Q2Q1Q
2008 / 52007 / 52006 / 5
連結セグメント情報(四半期) Consolidated Segment Information (Quarterly)
売上高 人材派遣・請負事業 人材紹介事業 再就職支援事業 アウトソーシング事業 その他の事業 消去又は全社連結合計伸び率 人材派遣・請負事業 人材紹介事業 再就職支援事業 アウトソーシング事業 その他の事業連結合計
決算年月
(百万円/Millions of Yen)
Sales Temporary staffing/Contracting Placement/Recruiting Outplacement Outsourcing Other Eliminations and CorporateConsolidatedYoY Temporary staffing/Contracting Placement/Recruiting Outplacement Outsourcing Other Consolidated
4Q3Q2Q1Q
53,5962,2601,2133,217
472(270)
60,489
5.7%32.6%-8.7%33.2%-4.9%7.2%
52,0901,9051,4213,389
498(278)
59,026
1.7%25.7%12.8%35.4%
0.4%4.0%
51,1621,7951,5883,486
574(356)
58,250
-1.9%17.4%69.5%34.3%11.7%
1.3%
51,9611,7141,6343,639
571(342)
59,178
-5.3%-9.5%85.4%34.2%22.0%-2.2%
33,813353743
1,845465
(196)37,024
10.3%76.3%
2.4%48.7%10.9%11.6%
34,456253766
1,894406
(160)37,616
10.8%26.3%
-12.2%62.5%
7.2%11.8%
35,709575815
1,912524
(160)39,375
15.9%144.8%
-2.0%60.2%37.4%18.0%
39,430813808
1,607494
(191)42,962
20.6%133.8%
-6.9%25.1%47.8%21.2%
39,721966870
1,335507
(174)43,227
17.5%173.6%17.1%
-27.6%9.2%
16.8%
40,049985
1,0151,418
498(177)
43,789
16.2%288.0%
32.5%-25.1%22.4%16.4%
40,920758966
1,633506
(166)44,619
14.6%31.9%18.6%
-14.6%-3.5%13.3%
43,6681,122
7901,634
527(223)
47,520
10.7%38.0%-2.2%1.7%6.7%
10.6%
44,4321,063
8902,033
519(212)
48,726
11.9%10.0%2.4%
52.3%2.2%
12.7%
45,178999
1,0072,030
505(201)
49,520
12.8%1.4%
-0.7%43.2%
1.4%13.1%
45,6991,1491,0792,086
670(201)
50,484
11.7%51.5%11.6%27.8%32.5%13.1%
50,2731,3291,0312,068
608(226)
55,084
15.1%18.4%30.4%26.5%15.3%15.9%
50,7231,7041,3282,415
496(225)
56,444
14.2%60.2%49.2%18.8%-4.3%15.8%
51,2131,5161,2602,502
495(231)
56,757
13.4%51.8%25.0%23.2%-1.9%14.6%
52,1671,529
9372,596
514(246)
57,498
14.2%33.0%
-13.2%24.4%
-23.3%13.9%
54,8471,895
8822,711
468(272)
60,531
9.1%42.6%
-14.5%31.1%
-23.0%9.9%
2005 / 52004 / 5 2008 / 52007 / 52006 / 5
営業利益 人材派遣・請負、人材紹介事業 再就職支援事業 アウトソーシング事業 その他の事業 消去又は全社連結合計伸び率 人材派遣・請負、人材紹介事業 再就職支援事業 アウトソーシング事業 その他の事業連結合計
決算年月
Operating Income Temporary staffing/Contracting, Placement/Recruiting Outplacement Outsourcing Other Eliminations and Corporate ConsolidatedYoY Temporary staffing/Contracting, Placement/Recruiting Outplacement Outsourcing Other Consolidated
1,384226(72)
(9)0
1,529
-33.3%-49.8%
——
-32.8%
618361550
101
1,541
-56.2%3.0%
61.6%—
-24.3%
1,613378929(17)
(887)2,015
-12.4%836.3%
60.8%—
-13.5%
1,440411476(10)
(961)1,356
-11.9%—
27.0%—
-27.1%
1,177164(42)
73(10)
1,362
105.0%-46.8%
—-19.9%45.1%
1,103177214
313
1,529
53.2%-55.1%100.0%-31.1%20.2%
1,743222352
593
2,380
75.7%-28.4%34.6%-4.4%46.1%
1,989180177
243
2,375
39.5%3.3%
-22.3%42.1%28.7%
1,721226
(114)53
31,888
46.2%37.8%
—-27.9%38.6%
1,678326
7692
2,093
52.1%83.7%
-64.1%-71.0%36.9%
1,515268329
3511
2,159
-13.1%20.5%-6.5%
-40.6%-9.3%
1,79535
377(85)(26)
2,096
-9.7%-80.4%113.0%
—-11.7%
1,248211
(154)(86)(31)
1,188
-27.4%-6.5%
——
-37.1%
1,582275264
(215)27
1,934
-5.7%-15.6%244.9%
—-7.6%
1,802294440
(158)2
2,382
19.0%9.5%
33.9%—
10.3%
1,922185351
(238)19
2,240
7.1%425.9%
-6.9%—
6.8%
2,076451
(119)(134)
32,277
66.2%113.5%
——
91.6%
1,411350340(62)
(2)2,037
-10.8%27.3%28.5%
—5.3%
1,84140
577(133)
42,330
2.2%-86.3%31.1%
—-2.2%
1,635(83)375(65)
11,862
-14.9%—
6.7%—
-16.9%
本冊子のデータは、特に注記のない限り、2007年5月期までは株式会社パソナの連結または単体のデータであり、2008年5月期からは持株会社体制移行に伴い、株式会社パソナグループの連結データとなっております。Unless otherwise stated, the data included in this report for the periods up to and including the fiscal year ended May 31, 2007 are consolidated or non-consolidated data for Pasona Inc. Following the shift to a pure holding company, the data for the periods commencing the fiscal year ended May 31, 2008 and beyond are consolidated data for Pasona Group Inc.
2003 / 5
4Q3Q2Q1Q
30,659200726
1,240419(77)
33,168
-2.3%37.5%
285.4%80.1%
-19.9%1.0%
31,111200872
1,165379(77)
33,653
-3.9%81.4%
479.3%53.6%
-16.2%-0.3%
30,800235831
1,194381(79)
33,363
-1.2%77.5%
332.3%40.6%
-15.3%2.0%
32,692347869
1,284334(89)
35,439
-0.4%86.2%
123.4%58.7%
-19.1%2.7%
2003 / 5
4Q3Q2Q1Q
574308(45)
9210
939
————
-3.0%
719395107
454
1,272
————
39.8%
991311261
623
1,629
————
13.1%
1,426174228
170
1,845
————
25.8%
1Q 2Q 3Q 4Q
2008 / 5
1Q 2Q 3Q 4Q
2007 / 5
1Q 2Q 3Q 4Q
2006 / 5
1Q 2Q 3Q 4Q
2005 / 5
1Q 2Q 3Q 4Q
2004 / 5
1Q 2Q 3Q 4Q
2003 / 5
10,000
0
20,000
30,000
40,000
50,000
60,000
0
4,000
3,500
3,000
2,500
2,000
1,500
1,000
500
(百万円 Millions of Yen)Operating Income営業利益
人材派遣・請負、人材紹介事業(左目盛り)/Temporary staffing/Contracting, Placement/Recruiting(Left scale)
再就職支援事業*/Outplacement アウトソーシング事業*/Outsourcing その他の事業*/Other
1Q 2Q 3Q 4Q
2008 / 5
1Q 2Q 3Q 4Q
2007 / 5
1Q 2Q 3Q 4Q
2006 / 5
1Q 2Q 3Q 4Q
2005 / 5
1Q 2Q 3Q 4Q
2004 / 5
1Q 2Q 3Q 4Q
2003 / 5-500
500
0
1,000
1,500
2,000
2,500
-400
1,000
800
600
400
200
0
-200
4Q3Q2Q1Q 4Q3Q2Q1Q 4Q3Q2Q1Q 4Q3Q2Q1Q 4Q3Q2Q1Q
*右目盛り(Right scale) *右目盛り(Right scale)

沿革
20
1976
1983
1984
1985
1986
1989
1991
1993
2000
2001
2002
2003
2004
2
11
8
5
5
8
9
7
6
6
11
3
12
12
3
3
9
10
12
3
3
4
6
7
8—9
10
10
3
4
9
9
大阪市北区に人材派遣事業を主業務として、(株)テンポラリーセンターを設立人材派遣サービスのエリア・フランチャイズとして、岡山市に(株)テンポラリーセンター岡山(現(株)パソナ岡山)を設立人材派遣サービスのエリア・フランチャイズとして、京都市に(株)テンポラリーセンター京都(現(株)パソナ京都)を設立人材派遣サービスのエリア・フランチャイズとして、熊本市に(株)テンポラリーセンター中九州(現(株)パソナ中九州)を設立人材派遣サービスのエリア・フランチャイズとして、長崎市に(株)テンポラリーセンター長崎(現(株)パソナ長崎)を設立新日鐵グループの派遣子会社に資本参加し、エヌエスパーソネルサービス(株)(現(株)パソナソーシング)を設立東京都千代田区に障害者雇用促進のために、(株)テンポラリーサンライズを設立企業内保育所の運営代行会社、(株)チャイルドケアインターナショナル(現(株)パソナフォスター)を設立(株)テンポラリーセンターの商号を(株)パソナに変更(株)テンポラリーサンライズの商号を(株)パソナサンライズに変更*旧(株)パソナ(現(株)南部エンタープライズ)より人材関連事業に関する営業を譲受け、商号を(株)パソナに変更エヌエスパーソネルサービス(株)(現(株)パソナソーシング)の株式を追加取得し子会社化(株)パソナテックの株式を追加取得し子会社化大阪証券取引所ナスダック・ジャパン市場に上場給与計算業務の受託・コンサルティング業務を行う(株)ペイロールの株式を取得し子会社化(株)ファイナンシャル・ヒューマン・プラネット(現(株)ファイナンシャルサン)の株式を追加取得し関連会社化米国Automatic Data Processing Inc.(ADP)が(株)ペイロールに資本参加。商号を(株)パソナ・エーディーピー・ペイロールに変更し、関連会社化(株)大阪東芝経営センターを新株式引き受けによって子会社化し、家電流通業界向け人材派遣を行う、(株)パソナエンパワーに商号を変更Web人材派遣管理システム「e-staffing」の普及、業界標準化を目指し、テンプスタッフ(株)、(株)リクルートスタッフィングと共同出資して合弁事業を開始、(株)イー・スタッフィングを関連会社化関西地域の主要企業との共同出資により、(株)関西雇用創出機構を設立し、関連会社化住友金属工業グループ傘下の派遣会社であった(株)コン・ビ(現(株)パソナスパークル)の株式を取得し、子会社化物流の請負、アウトソーシングを行う(株)パソナロジコムを子会社として設立会社分割により新たに設立した完全子会社、(株)パソナハートフルに社内総務業務に関わる部門の一部を承継試験運営業務のアウトソーシングを行う(株)全国試験運営センターを設立し、関連会社化(株)関東雇用創出機構を設立し、関連会社化北米、英国、アジアなど海外で人材関連事業を営む会社の株式を取得し、11社を子会社化、1社を関連会社化人材紹介事業部門を(株)パソナキャレントに営業譲渡東京証券取引所市場第一部に上場(株)パソナテックが同社株式を日本証券業協会(ジャスダック)に店頭登録新卒・第二新卒の派遣・紹介事業を行う、(株)パソナオン(現(株)パソナユース)を子会社として設立(株)ベネフィット・ワンが同社株式を日本証券業協会(ジャスダック)に店頭登録国際間の人材紹介、人事コンサルティング事業を行う、(株)パソナグローバルを子会社として設立
技術者派遣を行う、(株)パソナエンジニアリングを子会社として設立若年層向け求人サイト運営を行う(株)パソナアイ(現(株)パソナユース)を子会社として設立保険販売員の派遣を行う(株)パソナインシュアランスを子会社として設立東京都千代田区大手町に就農支援施設、「PASONA O2(パソナオーツー)」を開設競技生活を続けるスポーツ選手の就労支援事業を行う、(株)パソナスポーツメイトを子会社として設立グループ営業を推進する、(株)パソナレップパワーを子会社として設立団塊・シニア世代を対象に生活支援サービス、雇用創出事業を行う、(株)NARPを子会社として設立ビジネス・スペシャリストを企業に紹介する、(株)パソナフォーチュンを子会社として設立大手企業の人材派遣子会社と共同で、求人サイト運営と間接業務のシェアード化を行う(株)HRパートナーズを子会社として設立人材管理及び会社経営管理コンサルティングを行う、Pasona Management Consultancy (Shenzhen)を子会社として設立英国の関連会社Cannon-Persona Recruitment Limited.の株式を追加取得し子会社化、同年12月に商号をPasona Europe Limitedに変更日本初となる紹介予定派遣の専門会社(株)パソナテンプトゥパームを子会社として設立静岡県を地盤とする人材派遣会社の(株)ソシオの株式を取得し、子会社化中国で日系企業を中心に人材サービスを行うPasona Human Resources (Shanghai) Co., Ltd.を子会社として設立(株)ベネフィット・ワンが同社株式を東京証券取引所第二部に上場(株)エディオンとの共同出資で、エディオングループの家電量販店への派遣業務を中心に行う、(株)パソナeプロフェッショナルを子会社として設立(株)ソシオの事業の一部を会社分割し、(株)パソナが継承(株)ソシオを簡易合併の手続きにより、(株)パソナに吸収合併(株)ホーム・コンピューティング・ネットワークの株式を譲渡し、非子会社化(株)パソナアイの営業全部を(株)パソナオンに譲渡し、若年層に特化したフルラインの人材サービスを行う、(株)パソナユースに商号を変更米国法人Pasona N A, Inc.と米国三菱商事による合弁新会社、PASONA MIC, Inc.を子会社として設立(株)パソナキャリアアセットを存続会社とし(株)パソナキャレントを吸収合併、(株)パソナキャリアに商号を変更東京都渋谷区神宮前に派遣スタッフ向け福利厚生施設「倶楽部PASONA-表参道-」を開設東京都千代田区新丸の内ビルディングにパソナグループのヘッドクォ-ターを開設純粋持株会社 (株)パソナグループを設立(株)パソナ・エーディーピー・ペイロールの株式を譲渡し、非関連会社化Pelham Search Pacific Limited および Pelham International Limited の株式を譲渡し、非子会社化(株)ファイナンシャルサンの株式を追加取得し、完全子会社化(株)パソナインシュアランスの株式を追加取得し、完全子会社化
2004
2005
2006
2007
2008
10
11
11
2
3
3
4
6
7
9
10
11
1
3
3
4
4
5
6
7
12
1
4
9
12
1
3
3
4
年 月 年 月
*旧株式会社パソナは、1976年2月に人材派遣事業を主目的に設立されております。
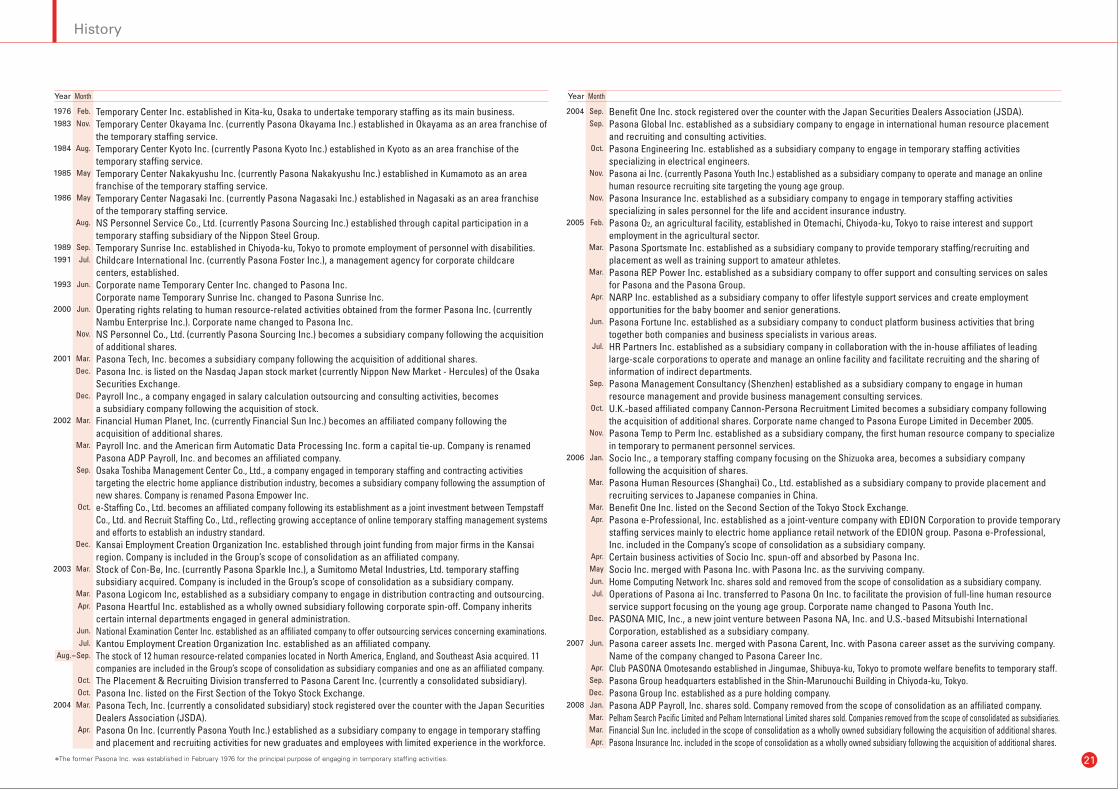
21
History
1976
1983
1984
1985
1986
1989
1991
1993
2000
2001
2002
2003
2004
Feb.Nov.
Aug.
May
May
Aug.
Sep.Jul.
Jun.
Jun.
Nov.
Mar.Dec.
Dec.
Mar.
Mar.
Sep.
Oct.
Dec.
Mar.
Mar.Apr.
Jun.Jul.
Aug.--Sep.
Oct.Oct.Mar.
Apr.
Temporary Center Inc. established in Kita-ku, Osaka to undertake temporary staffing as its main business.Temporary Center Okayama Inc. (currently Pasona Okayama Inc.) established in Okayama as an area franchise of the temporary staffing service.Temporary Center Kyoto Inc. (currently Pasona Kyoto Inc.) established in Kyoto as an area franchise of the temporary staffing service.Temporary Center Nakakyushu Inc. (currently Pasona Nakakyushu Inc.) established in Kumamoto as an area franchise of the temporary staffing service.Temporary Center Nagasaki Inc. (currently Pasona Nagasaki Inc.) established in Nagasaki as an area franchise of the temporary staffing service.NS Personnel Service Co., Ltd. (currently Pasona Sourcing Inc.) established through capital participation in a temporary staffing subsidiary of the Nippon Steel Group.Temporary Sunrise Inc. established in Chiyoda-ku, Tokyo to promote employment of personnel with disabilities.Childcare International Inc. (currently Pasona Foster Inc.), a management agency for corporate childcare centers, established.Corporate name Temporary Center Inc. changed to Pasona Inc.Corporate name Temporary Sunrise Inc. changed to Pasona Sunrise Inc.Operating rights relating to human resource-related activities obtained from the former Pasona Inc. (currently Nambu Enterprise Inc.). Corporate name changed to Pasona Inc.NS Personnel Co., Ltd. (currently Pasona Sourcing Inc.) becomes a subsidiary company following the acquisition of additional shares.Pasona Tech, Inc. becomes a subsidiary company following the acquisition of additional shares.Pasona Inc. is listed on the Nasdaq Japan stock market (currently Nippon New Market - Hercules) of the Osaka Securities Exchange.Payroll Inc., a company engaged in salary calculation outsourcing and consulting activities, becomes a subsidiary company following the acquisition of stock.Financial Human Planet, Inc. (currently Financial Sun Inc.) becomes an affiliated company following the acquisition of additional shares.Payroll Inc. and the American firm Automatic Data Processing Inc. form a capital tie-up. Company is renamed Pasona ADP Payroll, Inc. and becomes an affiliated company.Osaka Toshiba Management Center Co., Ltd., a company engaged in temporary staffing and contracting activities targeting the electric home appliance distribution industry, becomes a subsidiary company following the assumption of new shares. Company is renamed Pasona Empower Inc.e-Staffing Co., Ltd. becomes an affiliated company following its establishment as a joint investment between Tempstaff Co., Ltd. and Recruit Staffing Co., Ltd., reflecting growing acceptance of online temporary staffing management systems and efforts to establish an industry standard.Kansai Employment Creation Organization Inc. established through joint funding from major firms in the Kansai region. Company is included in the Group’s scope of consolidation as an affiliated company.Stock of Con-Be, Inc. (currently Pasona Sparkle Inc.), a Sumitomo Metal Industries, Ltd. temporary staffing subsidiary acquired. Company is included in the Group’s scope of consolidation as a subsidiary company.Pasona Logicom Inc, established as a subsidiary company to engage in distribution contracting and outsourcing.Pasona Heartful Inc. established as a wholly owned subsidiary following corporate spin-off. Company inherits certain internal departments engaged in general administration.National Examination Center Inc. established as an affiliated company to offer outsourcing services concerning examinations.Kantou Employment Creation Organization Inc. established as an affiliated company.The stock of 12 human resource-related companies located in North America, England, and Southeast Asia acquired. 11 companies are included in the Group’s scope of consolidation as subsidiary companies and one as an affiliated company.The Placement & Recruiting Division transferred to Pasona Carent Inc. (currently a consolidated subsidiary).Pasona Inc. listed on the First Section of the Tokyo Stock Exchange.Pasona Tech, Inc. (currently a consolidated subsidiary) stock registered over the counter with the Japan Securities Dealers Association (JSDA).Pasona On Inc. (currently Pasona Youth Inc.) established as a subsidiary company to engage in temporary staffing and placement and recruiting activities for new graduates and employees with limited experience in the workforce.
Benefit One Inc. stock registered over the counter with the Japan Securities Dealers Association (JSDA).Pasona Global Inc. established as a subsidiary company to engage in international human resource placement and recruiting and consulting activities.Pasona Engineering Inc. established as a subsidiary company to engage in temporary staffing activities specializing in electrical engineers.Pasona ai Inc. (currently Pasona Youth Inc.) established as a subsidiary company to operate and manage an online human resource recruiting site targeting the young age group.Pasona Insurance Inc. established as a subsidiary company to engage in temporary staffing activities specializing in sales personnel for the life and accident insurance industry.Pasona O2, an agricultural facility, established in Otemachi, Chiyoda-ku, Tokyo to raise interest and support employment in the agricultural sector.Pasona Sportsmate Inc. established as a subsidiary company to provide temporary staffing/recruiting and placement as well as training support to amateur athletes.Pasona REP Power Inc. established as a subsidiary company to offer support and consulting services on sales for Pasona and the Pasona Group.NARP Inc. established as a subsidiary company to offer lifestyle support services and create employment opportunities for the baby boomer and senior generations.Pasona Fortune Inc. established as a subsidiary company to conduct platform business activities that bring together both companies and business specialists in various areas.HR Partners Inc. established as a subsidiary company in collaboration with the in-house affiliates of leading large-scale corporations to operate and manage an online facility and facilitate recruiting and the sharing of information of indirect departments.Pasona Management Consultancy (Shenzhen) established as a subsidiary company to engage in human resource management and provide business management consulting services.U.K.-based affiliated company Cannon-Persona Recruitment Limited becomes a subsidiary company following the acquisition of additional shares. Corporate name changed to Pasona Europe Limited in December 2005.Pasona Temp to Perm Inc. established as a subsidiary company, the first human resource company to specialize in temporary to permanent personnel services.Socio Inc., a temporary staffing company focusing on the Shizuoka area, becomes a subsidiary company following the acquisition of shares.Pasona Human Resources (Shanghai) Co., Ltd. established as a subsidiary company to provide placement and recruiting services to Japanese companies in China.Benefit One Inc. listed on the Second Section of the Tokyo Stock Exchange.Pasona e-Professional, Inc. established as a joint-venture company with EDION Corporation to provide temporary staffing services mainly to electric home appliance retail network of the EDION group. Pasona e-Professional, Inc. included in the Company’s scope of consolidation as a subsidiary company.Certain business activities of Socio Inc. spun-off and absorbed by Pasona Inc.Socio Inc. merged with Pasona Inc. with Pasona Inc. as the surviving company.Home Computing Network Inc. shares sold and removed from the scope of consolidation as a subsidiary company.Operations of Pasona ai Inc. transferred to Pasona On Inc. to facilitate the provision of full-line human resource service support focusing on the young age group. Corporate name changed to Pasona Youth Inc.PASONA MIC, Inc., a new joint venture between Pasona NA, Inc. and U.S.-based Mitsubishi International Corporation, established as a subsidiary company.Pasona career assets Inc. merged with Pasona Carent, Inc. with Pasona career asset as the surviving company. Name of the company changed to Pasona Career Inc.Club PASONA Omotesando established in Jingumae, Shibuya-ku, Tokyo to promote welfare benefits to temporary staff.Pasona Group headquarters established in the Shin-Marunouchi Building in Chiyoda-ku, Tokyo.Pasona Group Inc. established as a pure holding company.Pasona ADP Payroll, Inc. shares sold. Company removed from the scope of consolidation as an affiliated company.Pelham Search Pacific Limited and Pelham International Limited shares sold. Companies removed from the scope of consolidated as subsidiaries.Financial Sun Inc. included in the scope of consolidation as a wholly owned subsidiary following the acquisition of additional shares.Pasona Insurance Inc. included in the scope of consolidation as a wholly owned subsidiary following the acquisition of additional shares.
2004
2005
2006
2007
2008
Sep.Sep.
Oct.
Nov.
Nov.
Feb.
Mar.
Mar.
Apr.
Jun.
Jul.
Sep.
Oct.
Nov.
Jan.
Mar.
Mar.Apr.
Apr.MayJun.Jul.
Dec.
Jun.
Apr.Sep.Dec.Jan.Mar.Mar.Apr.
Year Month Year Month
*The former Pasona Inc. was established in February 1976 for the principal purpose of engaging in temporary staffing activities.
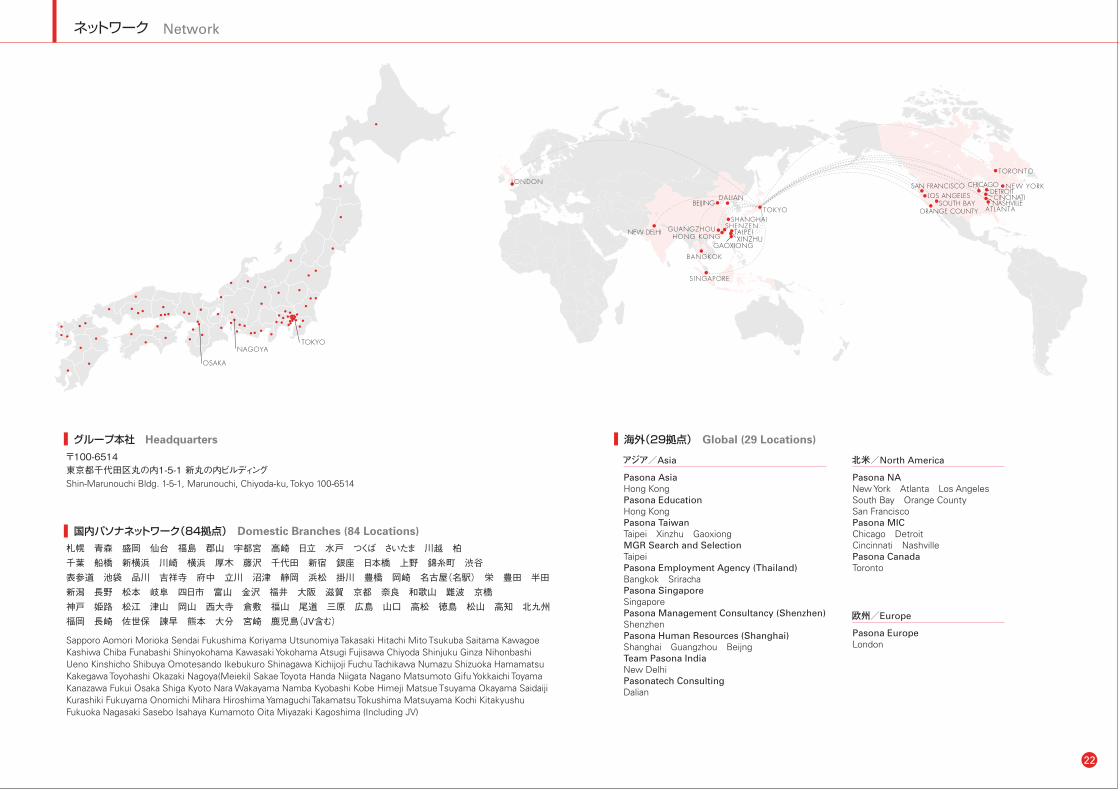
22
ネットワーク Network
海外(29拠点) Global (29 Locations)グループ本社 Headquarters
国内パソナネットワーク(84拠点) Domestic Branches (84 Locations)
札幌 青森 盛岡 仙台 福島 郡山 宇都宮 高崎 日立 水戸 つくば さいたま 川越 柏 千葉 船橋 新横浜 川崎 横浜 厚木 藤沢 千代田 新宿 銀座 日本橋 上野 錦糸町 渋谷 表参道 池袋 品川 吉祥寺 府中 立川 沼津 静岡 浜松 掛川 豊橋 岡崎 名古屋(名駅) 栄 豊田 半田 新潟 長野 松本 岐阜 四日市 富山 金沢 福井 大阪 滋賀 京都 奈良 和歌山 難波 京橋 神戸 姫路 松江 津山 岡山 西大寺 倉敷 福山 尾道 三原 広島 山口 高松 徳島 松山 高知 北九州 福岡 長崎 佐世保 諫早 熊本 大分 宮崎 鹿児島(JV含む)
Sapporo Aomori Morioka Sendai Fukushima Koriyama Utsunomiya Takasaki Hitachi Mito Tsukuba Saitama Kawagoe Kashiwa Chiba Funabashi Shinyokohama Kawasaki Yokohama Atsugi Fujisawa Chiyoda Shinjuku Ginza Nihonbashi Ueno Kinshicho Shibuya Omotesando Ikebukuro Shinagawa Kichijoji Fuchu Tachikawa Numazu Shizuoka Hamamatsu Kakegawa Toyohashi Okazaki Nagoya(Meieki) Sakae Toyota Handa Niigata Nagano Matsumoto Gifu Yokkaichi Toyama Kanazawa Fukui Osaka Shiga Kyoto Nara Wakayama Namba Kyobashi Kobe Himeji Matsue Tsuyama Okayama Saidaiji Kurashiki Fukuyama Onomichi Mihara Hiroshima Yamaguchi Takamatsu Tokushima Matsuyama Kochi Kitakyushu Fukuoka Nagasaki Sasebo Isahaya Kumamoto Oita Miyazaki Kagoshima (Including JV)
〒100-6514東京都千代田区丸の内1-5-1 新丸の内ビルディングShin-Marunouchi Bldg. 1-5-1, Marunouchi, Chiyoda-ku, Tokyo 100-6514
アジア/Asia
Pasona AsiaHong KongPasona EducationHong KongPasona TaiwanTaipei Xinzhu GaoxiongMGR Search and SelectionTaipeiPasona Employment Agency (Thailand)Bangkok SrirachaPasona SingaporeSingaporePasona Management Consultancy (Shenzhen)ShenzhenPasona Human Resources (Shanghai)Shanghai Guangzhou BeijngTeam Pasona IndiaNew DelhiPasonatech ConsultingDalian
北米/North America
Pasona NANew York Atlanta Los AngelesSouth Bay Orange CountySan FranciscoPasona MICChicago DetroitCincinnati NashvillePasona CanadaToronto
欧州/Europe
Pasona EuropeLondon
TOKYO
XINZHUGAOXIONG
NAGOYA
OSAKA

23
主なグループ会社
議決権の社名 資本金(百万円) 所有割合(%) 事業内容 本社 URL人材派遣・請負、人材紹介、再就職支援 ●株式会社パソナ 3,000 100.00 人材派遣/請負、人材紹介 東京 www.pasona.co.jp●株式会社パソナテック 551 60.87 IT分野に特化した人材派遣・請負、人材紹介事業 東京 www.pasonatech.co.jp●株式会社パソナキャリア 399 83.62 人材紹介事業、再就職支援事業 東京 www.pasonacareer.co.jp●株式会社パソナエンジニアリング 100 100.00 機械・電気・電子系設計技術者の特定派遣事業 東京 www.pasona-eng.co.jp●株式会社パソナインシュアランス 75 100.00 生命保険・損害保険関連の人材派遣・請負、人材紹介事業 東京 www.pasona-ins.co.jp●株式会社パソナ京都 72 51.00 地域に密着した人材派遣・請負、人材紹介事業 京都 www.pasona-kyoto.co.jp●株式会社パソナユース 65 100.00 若手人材に特化した人材派遣、人材紹介、求人webサイト運営 東京 www.pasona-youth.co.jp●株式会社パソナテンプトゥパーム 60 100.00 キャリア層および新卒・第二新卒の紹介予定派遣 東京 www.pasona-ttp.co.jp●株式会社パソナエンパワー 55 57.14 家電流通関連の人材派遣・請負、人材紹介 東京 www.pasona-emp.co.jp●株式会社パソナグローバル 50 100.00 グローバル人材の人材派遣、人材紹介および採用コンサルティング 東京 www.pasona-global.com●株式会社パソナフォーチュン 50 98.00 人材紹介、ビジネススペシャリストの支援 東京 www.pasona-fortune.co.jp●株式会社パソナeプロフェッショナル 50 51.00 家電量販店に特化した販売員の人材派遣・請負 大阪 www.pasona-epro.co.jp●株式会社パソナスポーツメイト 40 100.00 アマチュアスポーツ選手の人材派遣・人材紹介、就労支援 東京 www.pasona-sportsmate.co.jp●株式会社パソナ岡山 30 70.00 地域に密着した人材派遣・請負、人材紹介 岡山 www.pasona-okayama.co.jp●株式会社パソナスパークル 30 90.00 製造・介護分野への人材派遣・請負、人材紹介 大阪 www.pasona-spkl.co.jp●株式会社パソナソーシング 20 100.00 長期就労を中心とした人材派遣・請負、人材紹介 東京 www.pasona-src.co.jp●株式会社パソナロジコム 10 100.00 運送機能を含む物流請負 神戸 www.pasona-logi.com●株式会社ファイナンシャルサン 150 100.00 金融・証券関連の人材派遣・請負、人材紹介 東京 www.f-sun.co.jp○株式会社パソナ中九州 100 49.00 地域に密着した人材派遣・請負、人材紹介 熊本 www.pasona-kyusyu.co.jp○株式会社パソナ長崎 70 46.43 地域に密着した人材派遣・請負、人材紹介 長崎 www.pasona-nagasaki.com●Pasona NA, Inc. 654千米ドル 100.00 人材派遣、人材紹介、アウトソーシング ニューヨーク www.pasona.com●Pasona MIC, Inc. 700千米ドル 60.00 人材派遣、人材紹介、アウトソーシング シカゴ —
●PASONA CANADA, INC. 300千カナダドル 100.00 人材派遣、人材紹介 トロント www.pasona.com●PASONA ASIA CO., LIMITED 320千香港ドル 100.00 人材派遣、人材紹介 香港 www.pasona.com.hk●PASONA EUROPE LIMITED 40千英ポンド 100.00 人材派遣、人材紹介、ヘッドハンティング ロンドン www.pasona-eu.com●Pasona Taiwan Co., Ltd. 12,000千新台湾ドル 100.00 人材派遣、人材紹介 台北 www.pasona.com.tw●MGR Search and Selection Co., Ltd. 7,000千新台湾ドル 67.00 人材紹介 台北 www.mgr.com.tw●Pasona Employment Agency (Thailand) CO., LTD. 12,010千タイバーツ 49.04 人材派遣、人材紹介 バンコク www.pasona.co.th●Pasona Singapore Pte. Ltd. 500千シンガポールドル 100.00 人材派遣、人材紹介 シンガポール www.pasona.com.sg●Pasona Human Resource (Shanghai )Co., Ltd. 125千米ドル 70.00 人材紹介、コンサルティング 上海 www.pasona-global.com●TEAM PASONA INDIA COMPANY LIMITED 33,780千インドルピー 51.00 人材派遣、人材紹介、アウトソーシング ニューデリー www.teampasona.com
アウトソーシング ●株式会社ベネフィット・ワン 1,427 52.71 福利厚生のアウトソーシング 東京 www.benefit-one.co.jp●株式会社ベネフィット・ワン・パートナーズ 50 100.00 福利厚生アウトソーシングサービスを活用したカスタマーロイヤリティープログラム事業 東京 www.benefitone-partners.co.jp○株式会社全国試験運営センター 75 20.00 各種試験運営全般の請負事業 東京 www.nexa.co.jp その他の事業 ●株式会社HRパートナーズ 165 74.55 大手企業の派遣子会社向けシェアードサービス 東京 www.hrpartners.co.jp●株式会社NARP 160 70.63 シニア向け福利厚生会員事業 東京 www.narp.jp●株式会社パソナレップパワー 25 100.00 パソナグループの販売支援および営業・販売コンサルティング 東京 www.pasona-rep.co.jp●株式会社パソナフォスター 10 100.00 ベビーシッターの養成と保育施設の運営 東京 www.pasonafoster.co.jp●株式会社パソナハートフル 10 100.00 総務業務の受託、障害者雇用に関するコンサルティング 東京 www.pasona.co.jp/heartful●株式会社関東雇用創出機構 100 85.22 人材ブリッジバンク事業 東京 www.kantou-kikou.co.jp●株式会社関西雇用創出機構 120 85.00 人材ブリッジバンク事業 大阪 www.kansai-kikou.co.jp○株式会社イー・スタッフィング 330 33.33 Web人材派遣一括管理システム「e-staffing」を提供 東京 www.e-staffing.co.jp●Pasona Management Consultancy(Shenzhen) Co., Limited 100千香港ドル 100.00 人事管理及び会社経営管理コンサルティング 深 www.pasona.com.hk●Pasona Education Co., Limited 1,500千香港ドル 100.00 語学教育 香港 www.pasona.edu.hk
*1.議決権の所有割合は、Pasona NA, Inc.が所有する議決権の割合です。 *2.議決権の所有割合は、Pasona Taiwan Co., Ltd.が所有する議決権の割合です。 *3.議決権の所有割合は、Pasona Asia Co., Ltd.が所有する議決権の割合です。 *4.議決権の所有割合は、株式会社ベネフィット・ワンが所有する議決権の割合です。 ●連結子会社○持分法適用関連会社
*2
*3
*1
*4
*3
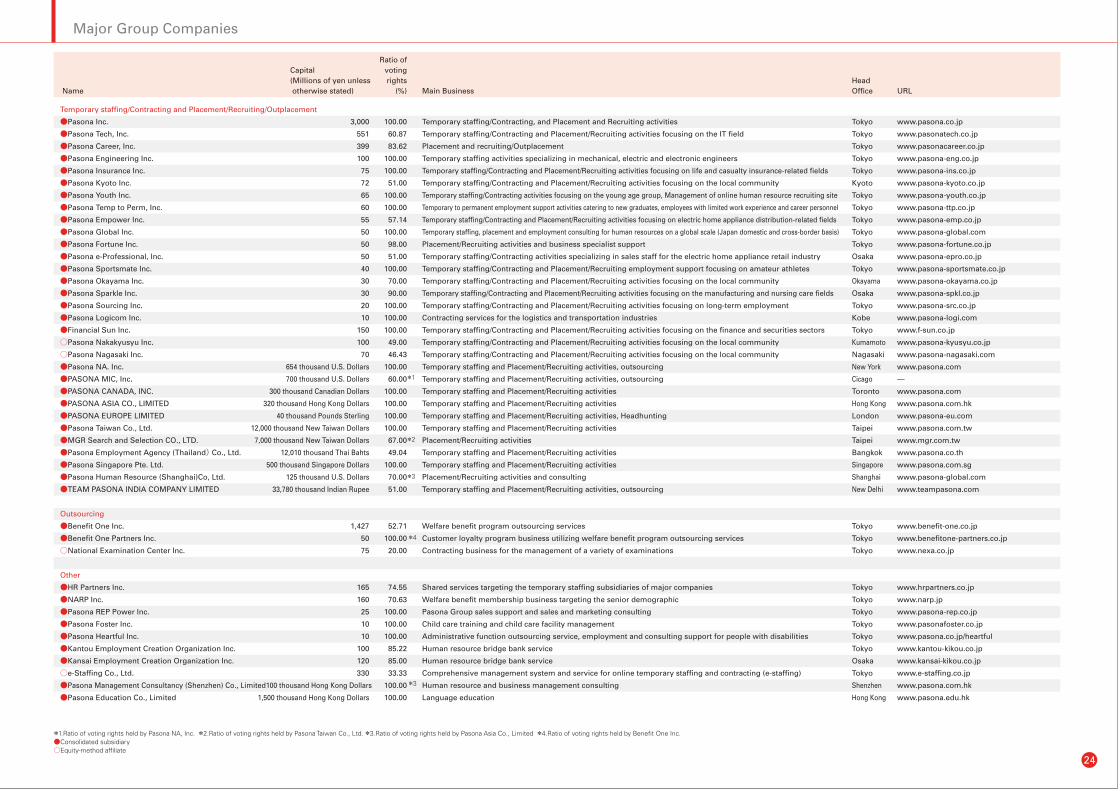
24
Major Group Companies
Temporary staffing/Contracting and Placement/Recruiting/Outplacement
●Pasona Inc. 3,000 100.00 Temporary staffing/Contracting, and Placement and Recruiting activities Tokyo www.pasona.co.jp
●Pasona Tech, Inc. 551 60.87 Temporary staffing/Contracting and Placement/Recruiting activities focusing on the IT field Tokyo www.pasonatech.co.jp
●Pasona Career, Inc. 399 83.62 Placement and recruiting/Outplacement Tokyo www.pasonacareer.co.jp
●Pasona Engineering Inc. 100 100.00 Temporary staffing activities specializing in mechanical, electric and electronic engineers Tokyo www.pasona-eng.co.jp
●Pasona Insurance Inc. 75 100.00 Temporary staffing/Contracting and Placement/Recruiting activities focusing on life and casualty insurance-related fields Tokyo www.pasona-ins.co.jp
●Pasona Kyoto Inc. 72 51.00 Temporary staffing/Contracting and Placement/Recruiting activities focusing on the local community Kyoto www.pasona-kyoto.co.jp
●Pasona Youth Inc. 65 100.00 Temporary staffing/Contracting activities focusing on the young age group, Management of online human resource recruiting site Tokyo www.pasona-youth.co.jp
●Pasona Temp to Perm, Inc. 60 100.00 Temporary to permanent employment support activities catering to new graduates, employees with limited work experience and career personnel Tokyo www.pasona-ttp.co.jp
●Pasona Empower Inc. 55 57.14 Temporary staffing/Contracting and Placement/Recruiting activities focusing on electric home appliance distribution-related fields Tokyo www.pasona-emp.co.jp
●Pasona Global Inc. 50 100.00 Temporary staffing, placement and employment consulting for human resources on a global scale (Japan domestic and cross-border basis) Tokyo www.pasona-global.com
●Pasona Fortune Inc. 50 98.00 Placement/Recruiting activities and business specialist support Tokyo www.pasona-fortune.co.jp
●Pasona e-Professional, Inc. 50 51.00 Temporary staffing/Contracting activities specializing in sales staff for the electric home appliance retail industry Osaka www.pasona-epro.co.jp
●Pasona Sportsmate Inc. 40 100.00 Temporary staffing/Contracting and Placement/Recruiting employment support focusing on amateur athletes Tokyo www.pasona-sportsmate.co.jp
●Pasona Okayama Inc. 30 70.00 Temporary staffing/Contracting and Placement/Recruiting activities focusing on the local community Okayama www.pasona-okayama.co.jp
●Pasona Sparkle Inc. 30 90.00 Temporary staffing/Contracting and Placement/Recruiting activities focusing on the manufacturing and nursing care fields Osaka www.pasona-spkl.co.jp
●Pasona Sourcing Inc. 20 100.00 Temporary staffing/Contracting and Placement/Recruiting activities focusing on long-term employment Tokyo www.pasona-src.co.jp
●Pasona Logicom Inc. 10 100.00 Contracting services for the logistics and transportation industries Kobe www.pasona-logi.com
●Financial Sun Inc. 150 100.00 Temporary staffing/Contracting and Placement/Recruiting activities focusing on the finance and securities sectors Tokyo www.f-sun.co.jp
○Pasona Nakakyusyu Inc. 100 49.00 Temporary staffing/Contracting and Placement/Recruiting activities focusing on the local community Kumamoto www.pasona-kyusyu.co.jp
○Pasona Nagasaki Inc. 70 46.43 Temporary staffing/Contracting and Placement/Recruiting activities focusing on the local community Nagasaki www.pasona-nagasaki.com
●Pasona NA. Inc. 654 thousand U.S. Dollars 100.00 Temporary staffing and Placement/Recruiting activities, outsourcing New York www.pasona.com
●PASONA MIC, Inc. 700 thousand U.S. Dollars 60.00 Temporary staffing and Placement/Recruiting activities, outsourcing Cicago —
●PASONA CANADA, INC. 300 thousand Canadian Dollars 100.00 Temporary staffing and Placement/Recruiting activities Toronto www.pasona.com
●PASONA ASIA CO., LIMITED 320 thousand Hong Kong Dollars 100.00 Temporary staffing and Placement/Recruiting activities Hong Kong www.pasona.com.hk
●PASONA EUROPE LIMITED 40 thousand Pounds Sterling 100.00 Temporary staffing and Placement/Recruiting activities, Headhunting London www.pasona-eu.com
●Pasona Taiwan Co., Ltd. 12,000 thousand New Taiwan Dollars 100.00 Temporary staffing and Placement/Recruiting activities Taipei www.pasona.com.tw
●MGR Search and Selection CO., LTD. 7,000 thousand New Taiwan Dollars 67.00 Placement/Recruiting activities Taipei www.mgr.com.tw
●Pasona Employment Agency (Thailand) Co., Ltd. 12,010 thousand Thai Bahts 49.04 Temporary staffing and Placement/Recruiting activities Bangkok www.pasona.co.th
●Pasona Singapore Pte. Ltd. 500 thousand Singapore Dollars 100.00 Temporary staffing and Placement/Recruiting activities Singapore www.pasona.com.sg
●Pasona Human Resource (Shanghai)Co, Ltd. 125 thousand U.S. Dollars 70.00 Placement/Recruiting activities and consulting Shanghai www.pasona-global.com
●TEAM PASONA INDIA COMPANY LIMITED 33,780 thousand Indian Rupee 51.00 Temporary staffing and Placement/Recruiting activities, outsourcing New Delhi www.teampasona.com
Outsourcing
●Benefit One Inc. 1,427 52.71 Welfare benefit program outsourcing services Tokyo www.benefit-one.co.jp
●Benefit One Partners Inc. 50 100.00 Customer loyalty program business utilizing welfare benefit program outsourcing services Tokyo www.benefitone-partners.co.jp
○National Examination Center Inc. 75 20.00 Contracting business for the management of a variety of examinations Tokyo www.nexa.co.jp
Other
●HR Partners Inc. 165 74.55 Shared services targeting the temporary staffing subsidiaries of major companies Tokyo www.hrpartners.co.jp
●NARP Inc. 160 70.63 Welfare benefit membership business targeting the senior demographic Tokyo www.narp.jp
●Pasona REP Power Inc. 25 100.00 Pasona Group sales support and sales and marketing consulting Tokyo www.pasona-rep.co.jp
●Pasona Foster Inc. 10 100.00 Child care training and child care facility management Tokyo www.pasonafoster.co.jp
●Pasona Heartful Inc. 10 100.00 Administrative function outsourcing service, employment and consulting support for people with disabilities Tokyo www.pasona.co.jp/heartful
●Kantou Employment Creation Organization Inc. 100 85.22 Human resource bridge bank service Tokyo www.kantou-kikou.co.jp
●Kansai Employment Creation Organization Inc. 120 85.00 Human resource bridge bank service Osaka www.kansai-kikou.co.jp
○e-Staffing Co., Ltd. 330 33.33 Comprehensive management system and service for online temporary staffing and contracting (e-staffing) Tokyo www.e-staffing.co.jp
●Pasona Management Consultancy (Shenzhen) Co., Limited 100 thousand Hong Kong Dollars 100.00 Human resource and business management consulting Shenzhen www.pasona.com.hk
●Pasona Education Co., Limited 1,500 thousand Hong Kong Dollars 100.00 Language education Hong Kong www.pasona.edu.hk
Ratio of Capital voting (Millions of yen unless rights Head Name otherwise stated) (%) Main Business Office URL
*1.Ratio of voting rights held by Pasona NA, Inc. *2.Ratio of voting rights held by Pasona Taiwan Co., Ltd. *3.Ratio of voting rights held by Pasona Asia Co., Limited *4.Ratio of voting rights held by Benefit One Inc.●Consolidated subsidiary ○Equity-method affiliate
*2
*3
*1
*4
*3
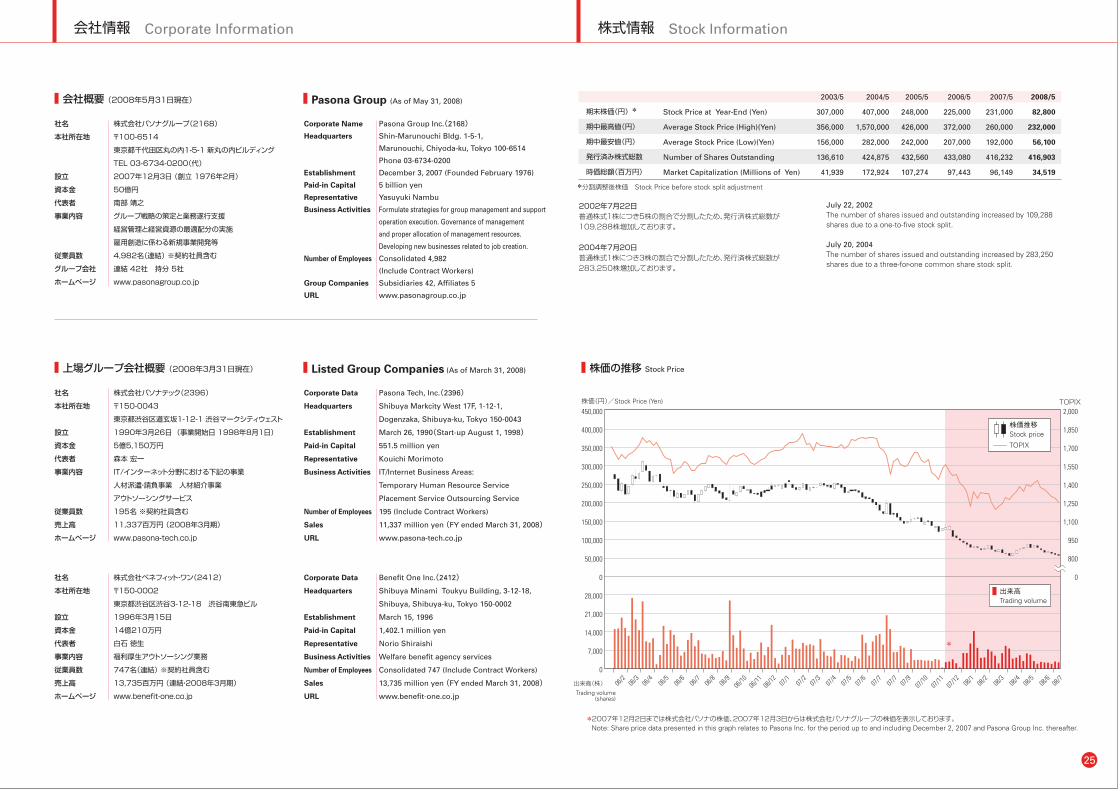
25
株式情報 Stock Information会社情報 Corporate Information
期末株価(円)*
期中最高値(円)
期中最安値(円)
発行済み株式総数
時価総額(百万円)
2008/5
82,800
232,000
56,100
416,903
34,519
上場グループ会社概要 (2008年3月31日現在) 株価の推移 Stock PriceListed Group Companies (As of March 31, 2008)
社名
本社所在地
設立
資本金
代表者
事業内容
従業員数
売上高
ホームページ
社名
本社所在地
設立
資本金
代表者
事業内容
従業員数
売上高
ホームページ
株式会社パソナテック(2396)
〒150-0043
東京都渋谷区道玄坂1-12-1 渋谷マークシティウェスト
1990年3月26日 (事業開始日 1998年8月1日)
5億5,150万円
森本 宏一
IT/インターネット分野における下記の事業
人材派遣・請負事業 人材紹介事業
アウトソーシングサービス
195名 ※契約社員含む
11,337百万円 (2008年3月期)
www.pasona-tech.co.jp
株式会社ベネフィット・ワン(2412)
〒150-0002
東京都渋谷区渋谷3-12-18 渋谷南東急ビル
1996年3月15日
14億210万円
白石 徳生
福利厚生アウトソーシング業務
747名(連結) ※契約社員含む
13,735百万円 (連結・2008年3月期)
www.benefit-one.co.jp
会社概要 (2008年5月31日現在) Pasona Group (As of May 31, 2008)
社名
本社所在地
設立
資本金
代表者
事業内容
従業員数
グループ会社
ホームページ
株式会社パソナグループ(2168)
〒100-6514
東京都千代田区丸の内1-5-1 新丸の内ビルディング
TEL 03-6734-0200(代)
2007年12月3日 (創立 1976年2月)
50億円
南部 靖之
グループ戦略の策定と業務遂行支援
経営管理と経営資源の最適配分の実施
雇用創造に係わる新規事業開発等
4,982名(連結) ※契約社員含む
連結 42社 持分 5社
www.pasonagroup.co.jp
Corporate Data
Headquarters
Establishment
Paid-in Capital
Representative
Business Activities
Number of Employees
Sales
URL
Corporate Data
Headquarters
Establishment
Paid-in Capital
Representative
Business Activities
Number of Employees
Sales
URL
Pasona Tech, Inc.(2396)Shibuya Markcity West 17F, 1-12-1,
Dogenzaka, Shibuya-ku, Tokyo 150-0043
March 26, 1990(Start-up August 1, 1998)551.5 million yen
Kouichi Morimoto
IT/Internet Business Areas:
Temporary Human Resource Service
Placement Service Outsourcing Service
195 (Include Contract Workers)
11,337 million yen (FY ended March 31, 2008)www.pasona-tech.co.jp
Benefit One Inc.(2412)Shibuya Minami Toukyu Building, 3-12-18,
Shibuya, Shibuya-ku, Tokyo 150-0002
March 15, 1996
1,402.1 million yen
Norio Shiraishi
Welfare benefit agency services
Consolidated 747 (Include Contract Workers)
13,735 million yen (FY ended March 31, 2008)www.benefit-one.co.jp
Corporate Name
Headquarters
Establishment
Paid-in Capital
Representative
Business Activities
Number of Employees
Group Companies
URL
Pasona Group Inc.(2168)Shin-Marunouchi Bldg. 1-5-1,
Marunouchi, Chiyoda-ku, Tokyo 100-6514
Phone 03-6734-0200
December 3, 2007 (Founded February 1976)
5 billion yen
Yasuyuki Nambu
Formulate strategies for group management and support
operation execution. Governance of management
and proper allocation of management resources.
Developing new businesses related to job creation.
Consolidated 4,982
(Include Contract Workers)
Subsidiaries 42, Affiliates 5
www.pasonagroup.co.jp
Stock Price at Year-End (Yen)
Average Stock Price (High)(Yen)
Average Stock Price (Low)(Yen)
Number of Shares Outstanding
Market Capitalization (Millions of Yen)
July 22, 2002 The number of shares issued and outstanding increased by 109,288 shares due to a one-to-five stock split.
July 20, 2004 The number of shares issued and outstanding increased by 283,250 shares due to a three-for-one common share stock split.
*分割調整後株価 Stock Price before stock split adjustment
2006/5
225,000
372,000
207,000
433,080
97,443
2007/5
231,000
260,000
192,000
416,232
96,149
2005/5
248,000
426,000
242,000
432,560
107,274
2004/5
407,000
1,570,000
282,000
424,875
172,924
2003/5
307,000
356,000
156,000
136,610
41,939
2002年7月22日普通株式1株につき5株の割合で分割したため、発行済株式総数が109,288株増加しております。
2004年7月20日普通株式1株につき3株の割合で分割したため、発行済株式総数が283,250株増加しております。
0
0
50,000
100,000
150,000
200,000
250,000
300,000
350,000
400,000
450,000
7,000
14,000
21,000
28,000
株価(円)/Stock Price (Yen)
2,000
1,850
1,700
1,550
1,400
1,250
1,100
950
800
0
TOPIX
出来高Trading volume
出来高(株)Trading volume
(shares)
06/2
06/3
06/4
06/5
06/6
06/7
06/8
06/9
06/10
06/11
06/12 07/1
07/2
07/3
07/4
07/5
07/6
07/7
07/7
07/9
07/10
07/11
07/12 08/1
08/2
08/3
08/4
08/5
08/6
08/7
*2007年12月2日までは株式会社パソナの株価、2007年12月3日からは株式会社パソナグループの株価を表示しております。 Note: Share price data presented in this graph relates to Pasona Inc. for the period up to and including December 2, 2007 and Pasona Group Inc. thereafter.
*
株価推移Stock price
TOPIX

26
株式情報 Stock Information
所有者別株主数Breakdown of Shareholders by Type
所有者別株式数Breakdown of Shareholdersby Number of Shareholders Held
合計:Total
11,247名
合計:Total
434,403株
証券会社:19 0.17%Securities companies金融機関:34 0.31%
Financial companies
自己株式:1 0.01%Treasury stock
その他国内法人:111 0.99%Other corporations
外国法人等:81 0.71%Foreign corporations andother foreign investors
自己株式:17,500 4.03%Treasury stock
外国法人等:65,593 15.10%Foreign corporations andother foreign investors
個人・その他:235,757 54.27%Individuals and others
個人・その他:11,001 97.81% Individuals and others
*証券保管振替機構名義の株式については、「その他国内法人」に含んで記載しています。 Shares held by Japan Securities Depository Center. Inc. are included in “other corporations.”
Stock Information(As of May 31, 2008)
Fiscal Year Ended May 31
Stock Transaction Unit The Company’s stock is traded in units of one share
Stock Listings Tokyo Stock Exchange, First Section (Securities code: 2168)
Osaka Securities Exchange
Number of Shareholders 11,247
Principal Stockholders
Yasuyuki Nambu 147,632 shares (33.99%)
State Street Bank and Trust Company 42,462 shares (9.77%)
Nambu Enterprise Inc. 35,688 shares (8.22%)
Nikko Cordial Corporation 33,330 shares (7.67%)
Yamato Life Insurance Co. 9,918 shares (2.28%)
Eizaburo Nambu 9,000 shares (2.07%)
Mellon Bank, NA, as Agent For Its Client Mellon Omnibus US Pension 7,072 shares (1.63%)
Japan Trustee Services Bank, Ltd. (Trust Account) 5,125 shares (1.18%)
The Master Trust Bank of Japan, Ltd. (Trust Account) 4,484 shares (1.03%)
Pasona Group Employees’ Shareholding Association 3,721 shares (0.86%)In addition to the aforementioned, the Company holds 17,500 shares of treasury stock, representing 4.03% of Pasona’s total shares issued and outstanding. In accordance with Article 308.2 of the Corporations Law, there are no voting rights attached to treasury stock.
所有者別株主数Breakdown of Shareholders by Type
所有者別株式数Breakdown of Shareholdersby Number of Shareholders Held
株式情報 (2008年5月31日現在) 決算期 毎年5月31日株式売買の単位 1株上場証券取引所 東京証券取引所 市場第一部 (証券コード:2168) 大阪証券取引所 ヘラクレス 株主数 11,247名
大株主南部靖之 147,632株 (33.99%)ステートストリートバンクアンドトラストカンパニー 42,462株 (9.77%)株式会社南部エンタープライズ 35,688株 (8.22%)株式会社日興コーディアルグループ 33,330株 (7.67%)大和生命保険株式会社 9,918株 (2.28%)南部栄三郎 9,000株 (2.07%)メロンバンクエヌエーアズエージェントフォーイッツクライアントメロンオムニバスユーエスペンション 7,072株 (1.63%)日本トラスティ・サービス信託銀行株式会社(信託口) 5,125株 (1.18%)日本マスタートラスト信託銀行株式会社(信託口) 4,484株 (1.03%)パソナグループ従業員持株会 3,721株 (0.86%)※上記のほか、自己株式17,500株(発行済株式数に対する所有割合4.03%)がありますが、会社法第308条第2項の規定により議決権を有しておりません。
地域別株主数分布状況 Breakdown of Shareholders by Region
2008/5
北海道
東北
関東
中部
近畿
中国
四国
九州
外国
保管振替機構名義株式
自己株式
(1.24%)
(2.13%)
(44.35%)
(15.13%)
(24.77%)
(4.39%)
(2.65%)
(4.65%)
(0.68%)
(0.00%)
(0.01%)
139
239
4,988
1,702
2,787
494
298
523
76
0
1
2007/5
(1.33%)
(2.03%)
(44.55%)
(15.80%)
(24.07%)
(4.48%)
(2.33%)
(4.52%)
(0.87%)
(0.01%)
(0.01%)
149
227
4,975
1,762
2,689
500
261
504
97
1
1
Hokkaido
Tohoku
Kanto
Chubu
Kinki
Chugoku
Shikoku
Kyusyu
Overseas
Japan Securities Depository Center, Inc.
Treasury Stock
所有者別株式数 Breakdown of Shareholders by Number of Shareholders Held
(注)2002年7月22日付で株式1株につき5株、2004年7月20日付で株式1株につき3株の株式分割をそれぞれ実施 The Company conducted five-for-one and three-for-one stock splits on July 22, 2002 and July 20, 2004, respectively.
金融機関
証券会社
その他国内法人
外国法人等
個人・その他
自己株式
合計
株主数
2008/5
(8.18%)
(0.36%)
(18.06%)
(15.10%)
(54.27%)
(4.03%)
(100%)
35,573
1,543
78,437
65,593
235,757
17,500
434,403
11,247
Financial companies
Securities companies
Other corporations
Foreign corporations and other foreign investors
Individuals and others
Treasury stock
Total
Number of Shareholders
2006/5
(9.07%)
(0.59%)
(26.39%)
(11.85%)
(52.10%)
(—%)
(100%)
39,252
2,559
114,298
51,339
225,632
—
433,080
11,132
2007/5
(8.72%)
(2.24%)
(18.20%)
(15.29%)
(51.52%)
(4.03%)
(100%)
37,774
9,726
78,916
66,324
223,492
17,500
433,732
11,166
2005/5
(15.74%)
(1.36%)
(26.56%)
(2.48%)
(53.86%)
(—%)
(100%)
68,091
5,894
114,878
10,738
232,959
—
432,560
11,503
2004/5
(14.78%)
(1.12%)
(25.74%)
(3.26%)
(55.10%)
(—%)
(100%)
20,927
1,588
36,452
4,625
78,033
—
141,625
6,846
2003/5
(6.78%)
(0.07%)
(28.11%)
(7.48%)
(57.56%)
(—%)
(100%)
9,250
96
38,407
10,222
78,635
—
136,610
1,393
2002/5
(3.80%)
(0.30%)
(20.08%)
(6.30%)
(69.52%)
(—%)
(100%)
1,038
82
5,487
1,722
18,993
—
27,322
1,304
証券会社:1,543 0.36% Securities companies
金融機関:35,573 8.18% Financial companies
その他国内法人:78,437 18.06%Other corporations
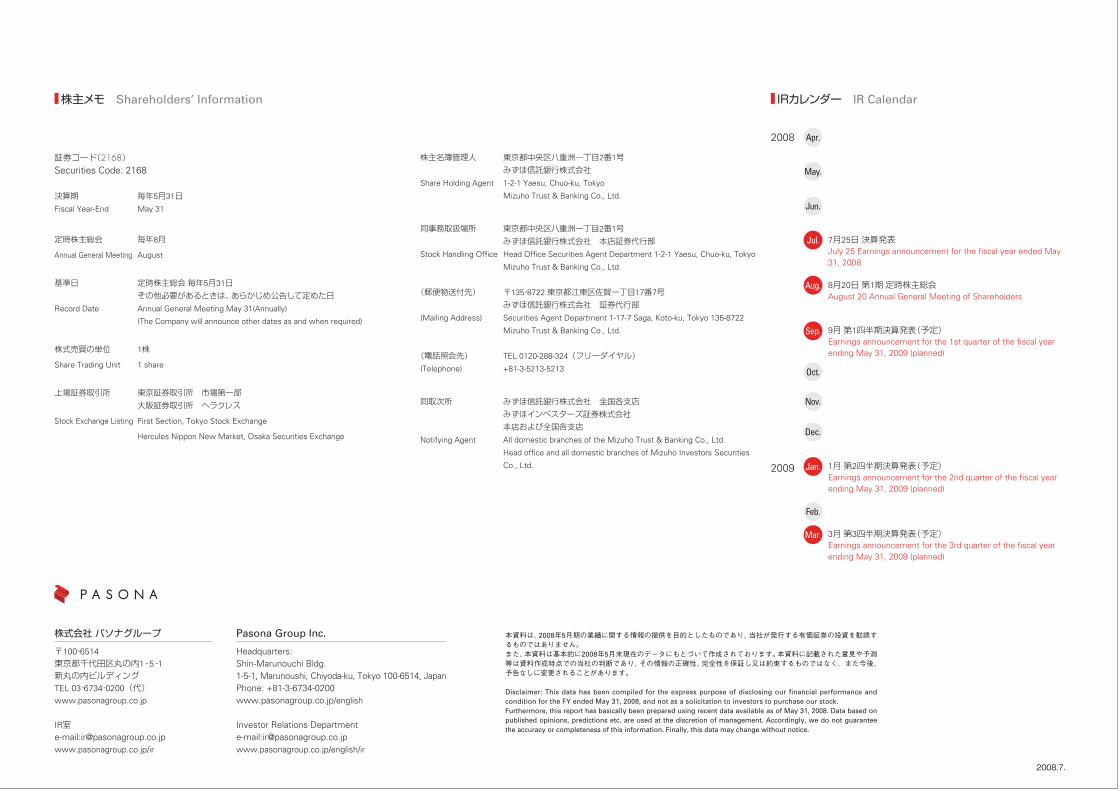
株主メモ Shareholders’ Information IRカレンダー IR Calendar
株式会社 パソナグループ
〒100‐6514東京都千代田区丸の内1‐5‐1新丸の内ビルディングTEL 03‐6734‐0200(代)www.pasonagroup.co.jp
IR室e-mail:[email protected]/ir
Pasona Group Inc.
Headquarters:Shin-Marunouchi Bldg.1-5-1, Marunoushi, Chiyoda-ku, Tokyo 100-6514, JapanPhone: +81-3-6734-0200www.pasonagroup.co.jp/english
Investor Relations Departmente-mail:[email protected]/english/ir
証券コード(2168)Securities Code: 2168
決算期 毎年5月31日Fiscal Year-End May 31
定時株主総会 毎年8月
Annual General Meeting August
基準日 定時株主総会毎年5月31日その他必要があるときは、あらかじめ公告して定めた日
Record Date Annual General Meeting May 31(Annually)
(The Company will announce other dates as and when required)
株式売買の単位 1株
Share Trading Unit 1 share
上場証券取引所 東京証券取引所 市場第一部大阪証券取引所 ヘラクレス
Stock Exchange Listing First Section, Tokyo Stock Exchange
Hercules Nippon New Market, Osaka Securities Exchange
株主名簿管理人 東京都中央区八重洲一丁目2番1号みずほ信託銀行株式会社
Share Holding Agent 1-2-1 Yaesu, Chuo-ku, Tokyo
Mizuho Trust & Banking Co., Ltd.
同事務取扱場所 東京都中央区八重洲一丁目2番1号みずほ信託銀行株式会社 本店証券代行部
Stock Handling Office Head Office Securities Agent Department 1-2-1 Yaesu, Chuo-ku, Tokyo
Mizuho Trust & Banking Co., Ltd.
(郵便物送付先) 〒135‐8722 東京都江東区佐賀一丁目17番7号みずほ信託銀行株式会社 証券代行部
(Mailing Address) Securities Agent Department 1-17-7 Saga, Koto-ku, Tokyo 135-8722
Mizuho Trust & Banking Co., Ltd.
(電話照会先) TEL 0120-288-324(フリーダイヤル)(Telephone) +81-3-5213-5213
同取次所 みずほ信託銀行株式会社 全国各支店みずほインベスターズ証券株式会社本店および全国各支店
Notifying Agent All domestic branches of the Mizuho Trust & Banking Co., Ltd.
Head office and all domestic branches of Mizuho Investors Securities
Co., Ltd.
7月25日決算発表July 25 Earnings announcement for the fiscal year ended May31, 2008
8月20日第1期定時株主総会August 20 Annual General Meeting of Shareholders
9月第1四半期決算発表(予定)Earnings announcement for the 1st quarter of the fiscal yearending May 31, 2009 (planned)
1月第2四半期決算発表(予定)Earnings announcement for the 2nd quarter of the fiscal yearending May 31, 2009 (planned)
3月第3四半期決算発表(予定)Earnings announcement for the 3rd quarter of the fiscal yearending May 31, 2009 (planned)
2008
2009
Apr.
May.
Jun.
Jul.
Aug.
Sep.
Oct.
Nov.
Dec.
Jan.
Feb.
Mar.
本資料は、2008年5月期の業績に関する情報の提供を目的としたものであり、当社が発行する有価証券の投資を勧誘するものではありません。また、本資料は基本的に2008年5月末現在のデータにもとづいて作成されております。本資料に記載された意見や予測等は資料作成時点での当社の判断であり、その情報の正確性、完全性を保証し又は約束するものではなく、また今後、予告なしに変更されることがあります。
Disclaimer: This data has been compiled for the express purpose of disclosing our financial performance andcondition for the FY ended May 31, 2008, and not as a solicitation to investors to purchase our stock. Furthermore, this report has basically been prepared using recent data available as of May 31, 2008. Data based onpublished opinions, predictions etc. are used at the discretion of management. Accordingly, we do not guaranteethe accuracy or completeness of this information. Finally, this data may change without notice.
2008.7.


![C 200 TS-14, C 210 TS-12, C 220 TS-10, C 230 TS-9 - RUBAG...C 200 TS-14, C 210 TS-12, C 220 TS-10, C 230 TS-9 DLT 27025179 [mm] 1960 3730 2568 5403 1080 430 DLT 2702-1FR 08/16 MT](https://img.pdfslide.net/doc/110x75/60ae0e3c7f8c9879a34f6d52/c-200-ts-14-c-210-ts-12-c-220-ts-10-c-230-ts-9-rubag-c-200-ts-14-c-210.jpg)