Embed Size (px)
Citation preview
April 2010 | Financial Stability Report | 10
1.1 Introduction
This section describes the impact of the main events in the international scene over the national fi nancial market, as well as the Brazilian economy reply to internal recovery factors.
Regardless the improved results shown by major European and American corporate institutions in 2009 vis-à-vis 2008, regulatory changes proposed and fears over the effects that might arise from the withdrawal of exceptional liquidity programs added new uncertainty within the banking system, which, along with the increase in sovereign risk, caused a raise in Credit Default Swaps (CDS) premiums of banks, and pressure on price of their shares.
The main monetary policy initiatives by the BCB, the behavior of long and short term interest rates, country risk, main infl ation indexes, as well as of foreign exchange are presented. Lastly, the text depicts the recent evolution of Gross Domestic Product (GDP), fi scal policy results as well as that of fi nancial markets, including private securities, derivatives and domestic public securities.
1.2 International financial markets
Although macroeconomic indicators showed improvement in the semester ending on February 2010, sovereign risk deterioration in European economies became the focal factor conditioning fi nancial markets behavior, precipitating, as of mid December, a rise in risk aversion, which resulted in an increase in the US dollar exchange rate, a decline in stock markets and increased uncertainties over a sustainable economic recovery within the Euro Area.
1Financial market evolution
April 2010 | Financial Stability Report | 11
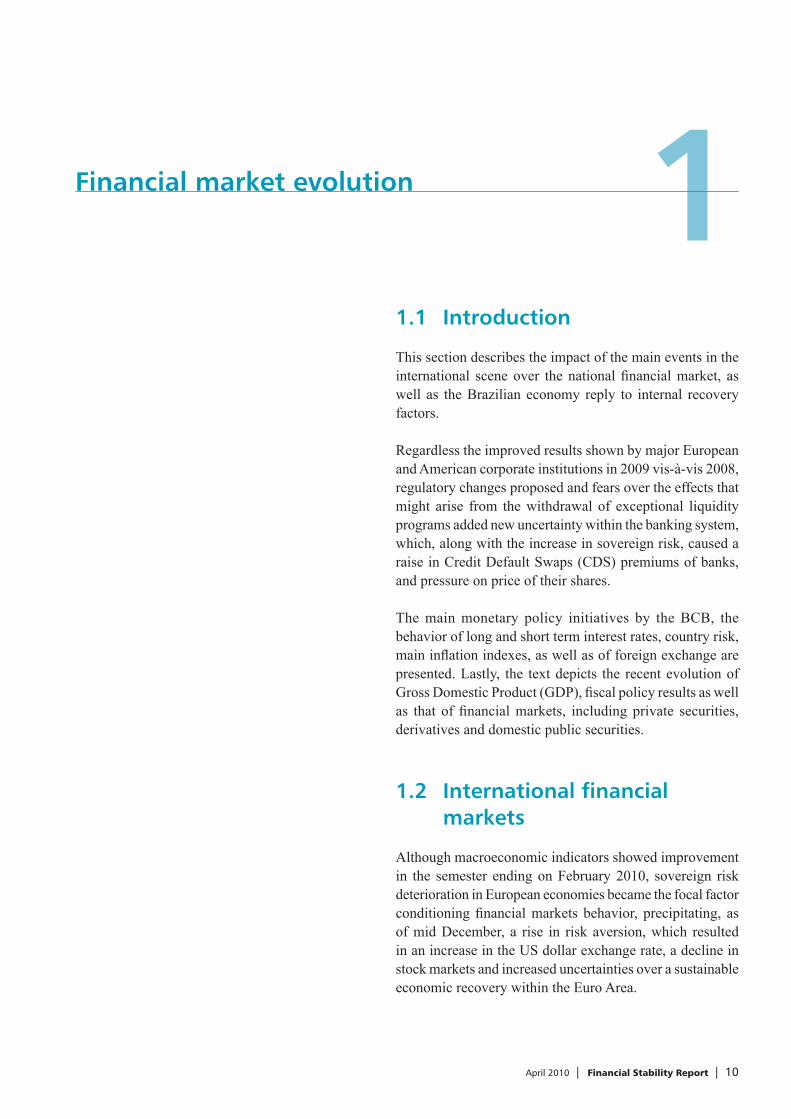
Additionally, doubts on the effects of the withdrawal of extraordinary monetary easing measures and the increasing uncertainty over fi nancial sector regulation3 in Europe and in the United States (US) had a negative impact on fi nancial institutions stock prices and put pressure on premiums of CDS banking sector.
It is worth noticing that the expansionary monetary policies kept feeding the fi nancial system with liquidity, as shown by the spread between the Libor and the Overnight Indexed Swap (OIS) in the US, Euro Area and UK.
Deterioration of fiscal solvency indexes of relevant economies is largely a consequence of fi scal stimulus and bank support measures, which were taken as of the collapse of Lehman Brothers, in September 2008. With the economic activity still slowly recovering, especially within the Euro Area, the increase in public sector fi nancing demand caused a raise in risk premium of countries such as Portugal, Ireland, Italy, Spain, and especially Greece, whose sovereign CDS spread grew 240, to 364 b.p., between September 2009 and February 2010.
Increase in Greek sovereign risk also refl ected in increased returns demanded to fi nance the country’s debt. At the end of January, ten-year bond yields – Hellenic Republic Government Bonds (HRGB) – reached 7.0%, representing a record spread of 398 basis point (b.p.) over German bonds with the same characteristics. By the end of February, owing to the announcement of measures to contain the Greek fi scal defi cit, it went back to 314 b.p.
In more mature economies, yields on ten-year bonds remained relatively stable along the period, with a slight turn in the UK case, whose spread over German bonds of similar maturity increased from 31 b.p., at the end of August 2009, to 93 b.p. at the end of February 2010. This wider spread showed increasing fear over fi scal sustainability of the British economy and greater uncertainties with respect to the economic growth recovery in important countries within the Euro Area. At the end of February, the government bond yields of these economies rose after the announcement of an increase in the Federal Reserve’s discount rates, which had an impact on expectations about the end of the extraordinary support measures still in place.
3/ On December 17, 2009, the Basle Committee on Banking Supervision announced a series of propositions aiming at rendering banks more resistant to future fi nancial crisis, which will require banks to operate with lower leverage and higher share of capital, which tend to decrease credit risk of such institutions, but, on the other hand, can erode their profi tability.
0
60
120
180
240
300
9.142007
1.42008
4.25 8.15 12.5 2.272009
7.17 11.6 2.262010
b.p.
United Kingdom: Libor - Sonia swapEuro Area: Euribor - Eonia swap
Chart 1.1 – Spread interbank rate (3m) vs OIS (3m)United Kingdom and Euro Area
Source: Bloomberg1/ OIS (Overnight Indexed Swap ) is an interest rate swap transaction, where one party agrees to receive/pay a fixed rate to another party, against paying/receiving a floating rate. In the case of UK, the floating rate is SONIA (Sterling Overnight Index Average); in the case of Euro Area, the floating rate is EONIA (Euro Overnight ndex Average).
0
75
150
225
300
375
9.142007
1.42008
4.25 8.15 12.5 3.272009
7.17 11.6 2.262010
b.p.
Chart 1.2 – Spread interbank rate (3m) vs OIS1 (3m)United States of America
Source: Bloomberg1/ OIS (Overnight Indexed Swap ) is an interest rate swap transaction, where one party agrees to receive/pay a fixed rate to another party, against paying/receiving a floating rate.
0
90
180
270
360
450
8.82008
10.10 12.12 2.132009
4.17 6.19 8.21 10.23 12.25 2.262010
b.p.
Ireland Spain Greece
United Kingdon Portugal
Source: Thomson
Chart 1.3 – Sovereign 5-year CDS
April 2010 | Financial Stability Report | 12
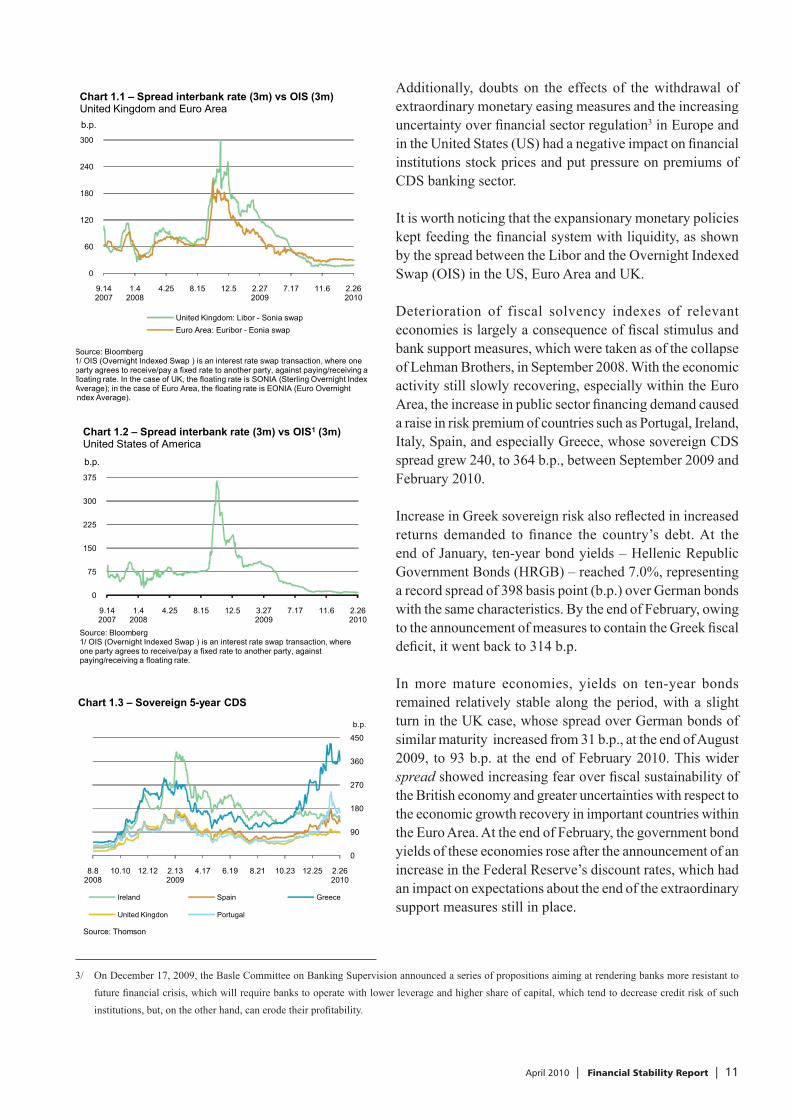
Sovereign risk premiums of main emerging markets, showing improved fiscal fundamentals and more solid growth expectations, were only marginally impacted by the turbulences occurred in some economies within the Euro Area, since the Emerging Markets Bond Index (EMBI+) demonstrated relative stability during this period.
Regarding the currency market, the euro exchange rate revealed a confi dence crisis in the Euro Area members and the expectations created over the dynamism of the European economy recovery after the release of the information on the GDP decrease in the last quarter of 2009. In this context, between October 2009 and February 2010, the euro suffered some 8.0% depreciation against the US dollar. The demand for US dollars resulted in its appreciation relative to the British pound, as well as to the main emerging markets currencies, as of December 2009.
Until January, capital markets kept improving, both in mature and emerging economies, as shown in the last Financial Stability Report (FSR) published by the BCB, but increasing fear of a Greek sovereign default added volatility to such markets, which then started to record losses. In January, markets were also affected by fears of tighter monetary policy in China, upon announcement made by Chinese authorities regarding increases in reserve requirements for the largest fi nancial institutions. In this context, the Financial Times Securities Exchange Index (FTSE 100); Standard and Poor’s 500 (S&P 500); Deutscher Aktienindex (DAX) and Nikkei, showed accumulated losses around 1.1%, 1.0%, 6.0% and 4% in 2009, as well as Shanghai Composite; São Paulo Stock Exchange Index (Ibovespa); Sensex; and Kospi, fell, respectively, 7.0%, 3.0%, 6.0% and 5.2% in the same period.
In this scenario, pressure over CDS premiums and stock prices of the banking sector institutions within the Euro Area became the greatest risk for the fi nancial stability of the region. In the third quarter of 2009, according to the Bank for International Settlements (BIS), French and German banks only, showed a US$1.6 trillion joint exposure in Greek, Spanish, Portuguese, Italian, and Irish markets. Furthermore, the announcement that the sixth largest Austrian bank would be nationalized caused additional pressure over the European banks CDS in December. Thus, the average CDS premium of fi ve relevant European banks, after maintaining relative stability along the four latest months of 2009, went up to 98 b.p. in the fi rst two months of 2010.
0,0
1,2
2,4
3,6
4,8
6,0
6.72007
10.11 1.16 2008
4.22 7.28 10.31 2.5 2009
5.13 8.18 11.23 2.26 2010
% p.y.
Chart 1.4 – Yields on treasury bondsNominal yields on 10-year treasury bonds
USA Germany UK Japan
Source: Bloomberg
0
200
400
600
800
1.000
7.32007
9.28 12.26 3.242008
6.19 9.16 12.12 3.112009
6.8 9.3 12.1 2.262010
b.p.
Chart 1.5 – Embi Global
EmbiG Russia Turkey Mexico
Source: Bloomberg
70
80
90
100
110
120
17.8 2007
11.9 1.2 2008
4.25 7.18 10.10 2.1 2009
3.27 6.19 9.11 12.4 26.2 2010
Source: Bloomberg
Chart 1.6 – Developed countries currenciesDollar exchange rates
Sterling pound/Dollar Yen/Dollar Euro/Dollar
9.19.2003 = 100
April 2010 | Financial Stability Report | 13
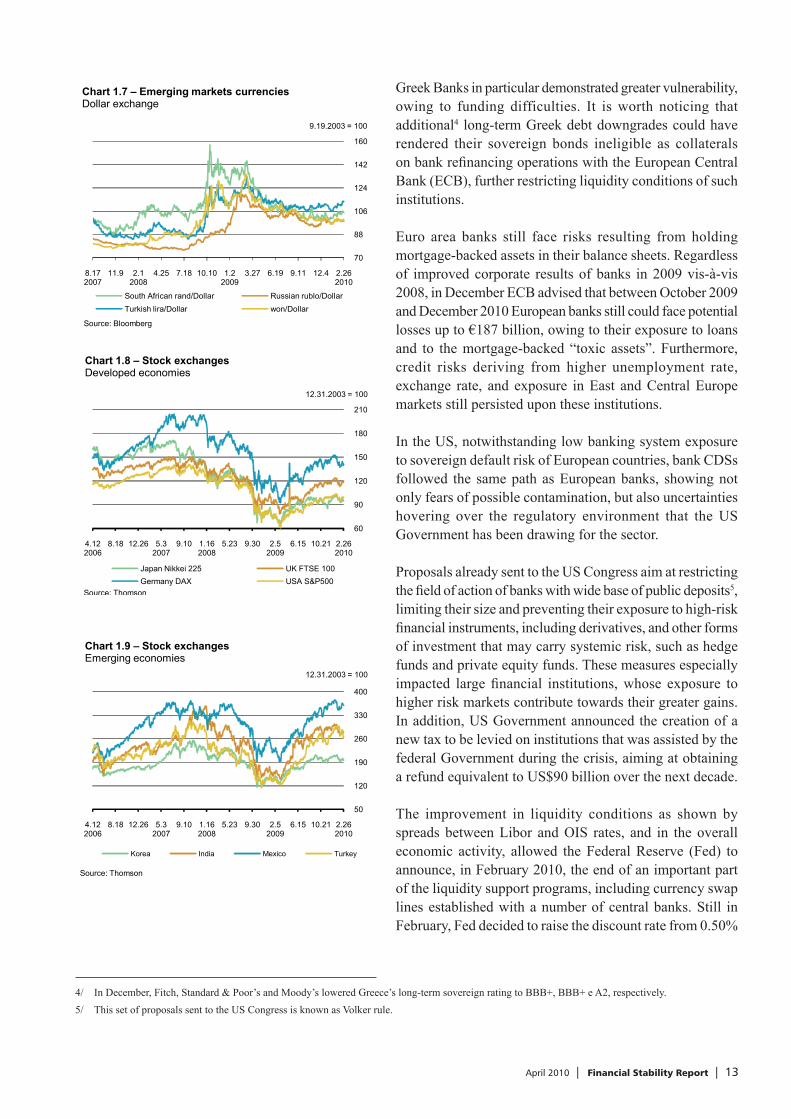
Greek Banks in particular demonstrated greater vulnerability, owing to funding difficulties. It is worth noticing that additional4 long-term Greek debt downgrades could have rendered their sovereign bonds ineligible as collaterals on bank refi nancing operations with the European Central Bank (ECB), further restricting liquidity conditions of such institutions.
Euro area banks still face risks resulting from holding mortgage-backed assets in their balance sheets. Regardless of improved corporate results of banks in 2009 vis-à-vis 2008, in December ECB advised that between October 2009 and December 2010 European banks still could face potential losses up to €187 billion, owing to their exposure to loans and to the mortgage-backed “toxic assets”. Furthermore, credit risks deriving from higher unemployment rate, exchange rate, and exposure in East and Central Europe markets still persisted upon these institutions.
In the US, notwithstanding low banking system exposure to sovereign default risk of European countries, bank CDSs followed the same path as European banks, showing not only fears of possible contamination, but also uncertainties hovering over the regulatory environment that the US Government has been drawing for the sector.
Proposals already sent to the US Congress aim at restricting the fi eld of action of banks with wide base of public deposits5, limiting their size and preventing their exposure to high-risk fi nancial instruments, including derivatives, and other forms of investment that may carry systemic risk, such as hedge funds and private equity funds. These measures especially impacted large fi nancial institutions, whose exposure to higher risk markets contribute towards their greater gains. In addition, US Government announced the creation of a new tax to be levied on institutions that was assisted by the federal Government during the crisis, aiming at obtaining a refund equivalent to US$90 billion over the next decade.
The improvement in liquidity conditions as shown by spreads between Libor and OIS rates, and in the overall economic activity, allowed the Federal Reserve (Fed) to announce, in February 2010, the end of an important part of the liquidity support programs, including currency swap lines established with a number of central banks. Still in February, Fed decided to raise the discount rate from 0.50%
4/ In December, Fitch, Standard & Poor’s and Moody’s lowered Greece’s long-term sovereign rating to BBB+, BBB+ e A2, respectively.5/ This set of proposals sent to the US Congress is known as Volker rule.
70
88
106
124
142
160
8.17 2007
11.9 2.12008
4.25 7.18 10.10 1.22009
3.27 6.19 9.11 12.4 2.262010
Chart 1.7 – Emerging markets currenciesDollar exchange
South African rand/Dollar Russian rublo/DollarTurkish lira/Dollar won/Dollar
Source: Bloomberg
9.19.2003 = 100
60
90
120
150
180
210
4.12 2006
8.18 12.26 5.3 2007
9.10 1.16 2008
5.23 9.30 2.5 2009
6.15 10.21 2.26 2010
12.31.2003 = 100
Chart 1.8 – Stock exchangesDeveloped economies
Japan Nikkei 225 UK FTSE 100Germany DAX USA S&P500
Source: Thomson
50
120
190
260
330
400
4.12 2006
8.18 12.26 5.3 2007
9.10 1.16 2008
5.23 9.30 2.5 2009
6.15 10.21 2.26 2010
12.31.2003 = 100
Chart 1.9 – Stock exchangesEmerging economies
Korea India Mexico Turkey
Source: Thomson
April 2010 | Financial Stability Report | 14
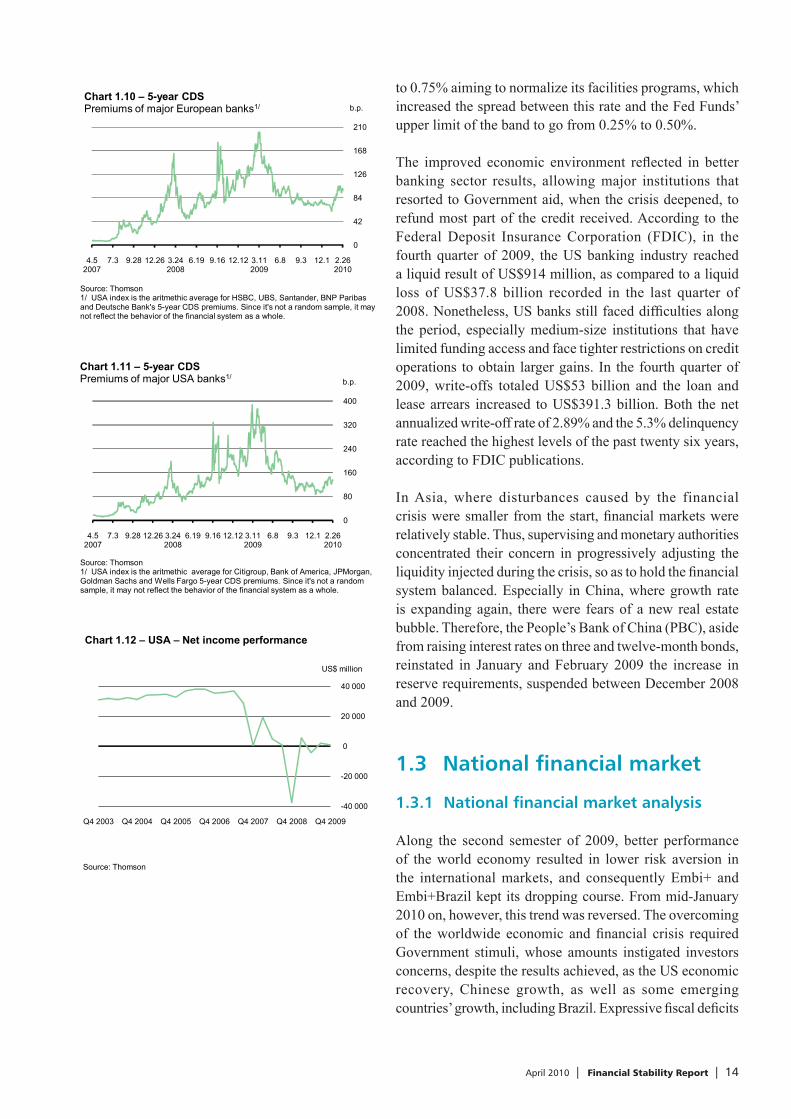
to 0.75% aiming to normalize its facilities programs, which increased the spread between this rate and the Fed Funds’ upper limit of the band to go from 0.25% to 0.50%.
The improved economic environment refl ected in better banking sector results, allowing major institutions that resorted to Government aid, when the crisis deepened, to refund most part of the credit received. According to the Federal Deposit Insurance Corporation (FDIC), in the fourth quarter of 2009, the US banking industry reached a liquid result of US$914 million, as compared to a liquid loss of US$37.8 billion recorded in the last quarter of 2008. Nonetheless, US banks still faced diffi culties along the period, especially medium-size institutions that have limited funding access and face tighter restrictions on credit operations to obtain larger gains. In the fourth quarter of 2009, write-offs totaled US$53 billion and the loan and lease arrears increased to US$391.3 billion. Both the net annualized write-off rate of 2.89% and the 5.3% delinquency rate reached the highest levels of the past twenty six years, according to FDIC publications.
In Asia, where disturbances caused by the financial crisis were smaller from the start, fi nancial markets were relatively stable. Thus, supervising and monetary authorities concentrated their concern in progressively adjusting the liquidity injected during the crisis, so as to hold the fi nancial system balanced. Especially in China, where growth rate is expanding again, there were fears of a new real estate bubble. Therefore, the People’s Bank of China (PBC), aside from raising interest rates on three and twelve-month bonds, reinstated in January and February 2009 the increase in reserve requirements, suspended between December 2008 and 2009.
1.3 National financial market
1.3.1 National financial market analysis
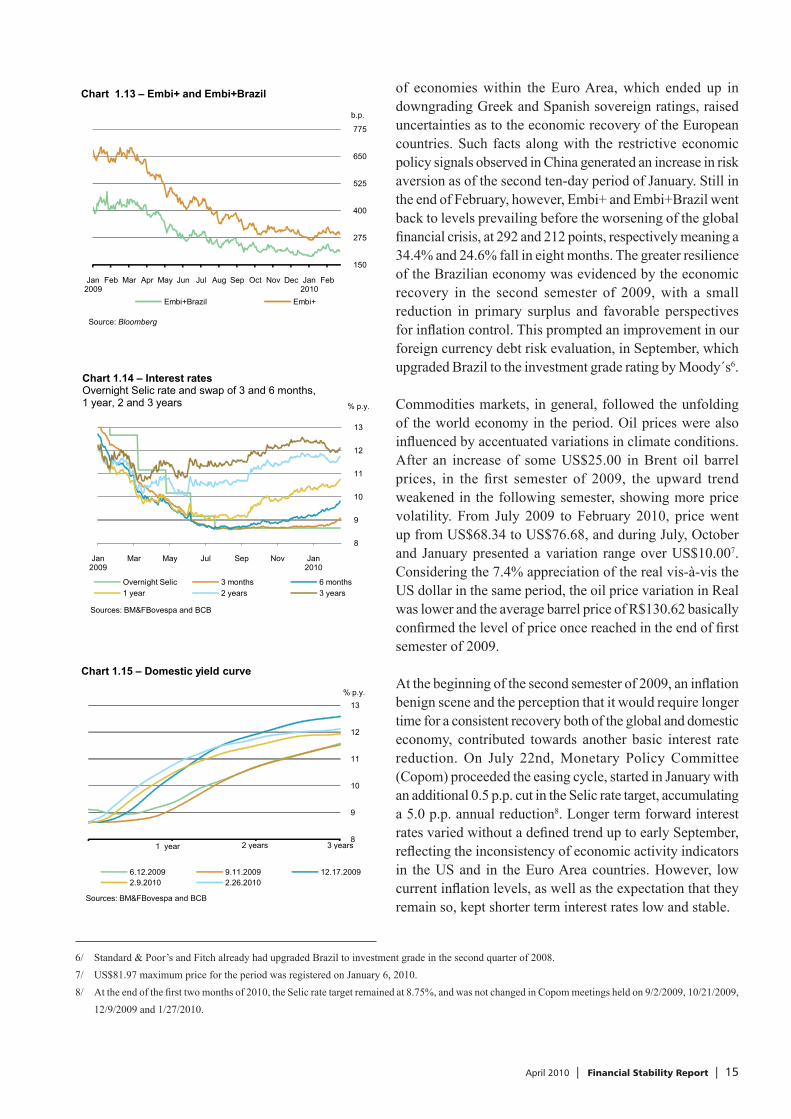
Along the second semester of 2009, better performance of the world economy resulted in lower risk aversion in the international markets, and consequently Embi+ and Embi+Brazil kept its dropping course. From mid-January 2010 on, however, this trend was reversed. The overcoming of the worldwide economic and fi nancial crisis required Government stimuli, whose amounts instigated investors concerns, despite the results achieved, as the US economic recovery, Chinese growth, as well as some emerging countries’ growth, including Brazil. Expressive fi scal defi cits
0
42
84
126
168
210
4.52007
7.3 9.28 12.26 3.242008
6.19 9.16 12.12 3.112009
6.8 9.3 12.1 2.262010
b.p.Chart 1.10 – 5-year CDSPremiums of major European banks1/
Source: Thomson 1/ USA index is the aritmethic average for HSBC, UBS, Santander, BNP Paribas and Deutsche Bank's 5-year CDS premiums. Since it's not a random sample, it may not reflect the behavior of the financial system as a whole.
0
80
160
240
320
400
4.52007
7.3 9.28 12.26 3.242008
6.19 9.16 12.12 3.112009
6.8 9.3 12.1 2.262010
b.p.
Chart 1.11 – 5-year CDS Premiums of major USA banks1/
Source: Thomson 1/ USA index is the aritmethic average for Citigroup, Bank of America, JPMorgan, Goldman Sachs and Wells Fargo 5-year CDS premiums. Since it's not a random sample, it may not reflect the behavior of the financial system as a whole.
-40 000
-20 000
0
20 000
40 000
Q4 2003 Q4 2004 Q4 2005 Q4 2006 Q4 2007 Q4 2008 Q4 2009
US$ million
Source: Thomson
Chart 1.12 – USA – Net income performance
April 2010 | Financial Stability Report | 15
of economies within the Euro Area, which ended up in downgrading Greek and Spanish sovereign ratings, raised uncertainties as to the economic recovery of the European countries. Such facts along with the restrictive economic policy signals observed in China generated an increase in risk aversion as of the second ten-day period of January. Still in the end of February, however, Embi+ and Embi+Brazil went back to levels prevailing before the worsening of the global fi nancial crisis, at 292 and 212 points, respectively meaning a 34.4% and 24.6% fall in eight months. The greater resilience of the Brazilian economy was evidenced by the economic recovery in the second semester of 2009, with a small reduction in primary surplus and favorable perspectives for infl ation control. This prompted an improvement in our foreign currency debt risk evaluation, in September, which upgraded Brazil to the investment grade rating by Moody´s6.
Commodities markets, in general, followed the unfolding of the world economy in the period. Oil prices were also infl uenced by accentuated variations in climate conditions. After an increase of some US$25.00 in Brent oil barrel prices, in the fi rst semester of 2009, the upward trend weakened in the following semester, showing more price volatility. From July 2009 to February 2010, price went up from US$68.34 to US$76.68, and during July, October and January presented a variation range over US$10.007. Considering the 7.4% appreciation of the real vis-à-vis the US dollar in the same period, the oil price variation in Real was lower and the average barrel price of R$130.62 basically confi rmed the level of price once reached in the end of fi rst semester of 2009.
At the beginning of the second semester of 2009, an infl ation benign scene and the perception that it would require longer time for a consistent recovery both of the global and domestic economy, contributed towards another basic interest rate reduction. On July 22nd, Monetary Policy Committee (Copom) proceeded the easing cycle, started in January with an additional 0.5 p.p. cut in the Selic rate target, accumulating a 5.0 p.p. annual reduction8. Longer term forward interest rates varied without a defi ned trend up to early September, refl ecting the inconsistency of economic activity indicators in the US and in the Euro Area countries. However, low current infl ation levels, as well as the expectation that they remain so, kept shorter term interest rates low and stable.
6/ Standard & Poor’s and Fitch already had upgraded Brazil to investment grade in the second quarter of 2008.7/ US$81.97 maximum price for the period was registered on January 6, 2010.8/ At the end of the fi rst two months of 2010, the Selic rate target remained at 8.75%, and was not changed in Copom meetings held on 9/2/2009, 10/21/2009,
12/9/2009 and 1/27/2010.
150
275
400
525
650
775
Jan 2009
Feb Mar Apr May Jun Jul Aug Sep Oct Nov Dec Jan 2010
Feb
b.p.
Chart 1.13 – Embi+ and Embi+Brazil
Embi+Brazil Embi+
Source: Bloomberg
8
9
10
11
12
13
1 252 503 754
% p.y.
Chart 1.15 – Domestic yield curve
6.12.2009 9.11.2009 12.17.20092.9.2010 2.26.2010
1 year 2 years 3 years
Sources: BM&FBovespa and BCB
8
9
10
11
12
13
Jan2009
Mar May Jul Sep Nov Jan2010
% p.y.
Overnight Selic 3 months 6 months1 year 2 years 3 years
Chart 1.14 – Interest ratesOvernight Selic rate and swap of 3 and 6 months, 1 year, 2 and 3 years
Sources: BM&FBovespa and BCB
April 2010 | Financial Stability Report | 16
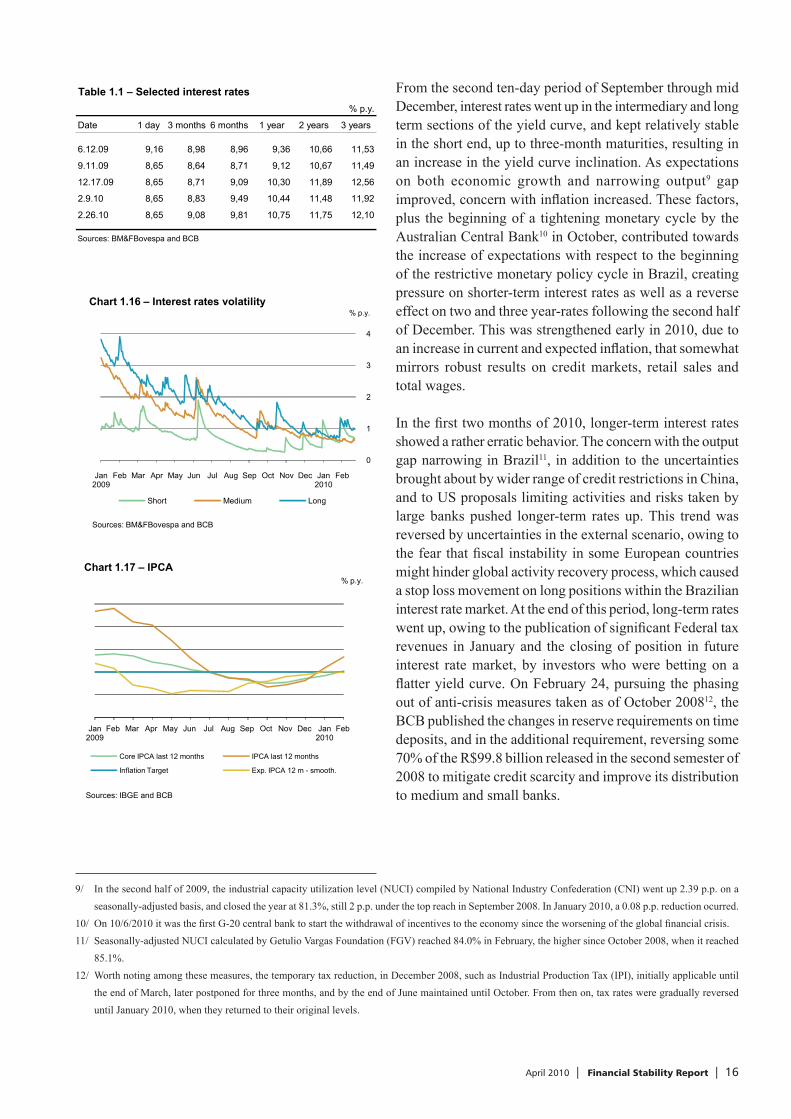
From the second ten-day period of September through mid December, interest rates went up in the intermediary and long term sections of the yield curve, and kept relatively stable in the short end, up to three-month maturities, resulting in an increase in the yield curve inclination. As expectations on both economic growth and narrowing output9 gap improved, concern with infl ation increased. These factors, plus the beginning of a tightening monetary cycle by the Australian Central Bank10 in October, contributed towards the increase of expectations with respect to the beginning of the restrictive monetary policy cycle in Brazil, creating pressure on shorter-term interest rates as well as a reverse effect on two and three year-rates following the second half of December. This was strengthened early in 2010, due to an increase in current and expected infl ation, that somewhat mirrors robust results on credit markets, retail sales and total wages.
In the fi rst two months of 2010, longer-term interest rates showed a rather erratic behavior. The concern with the output gap narrowing in Brazil11, in addition to the uncertainties brought about by wider range of credit restrictions in China, and to US proposals limiting activities and risks taken by large banks pushed longer-term rates up. This trend was reversed by uncertainties in the external scenario, owing to the fear that fi scal instability in some European countries might hinder global activity recovery process, which caused a stop loss movement on long positions within the Brazilian interest rate market. At the end of this period, long-term rates went up, owing to the publication of signifi cant Federal tax revenues in January and the closing of position in future interest rate market, by investors who were betting on a fl atter yield curve. On February 24, pursuing the phasing out of anti-crisis measures taken as of October 200812, the BCB published the changes in reserve requirements on time deposits, and in the additional requirement, reversing some 70% of the R$99.8 billion released in the second semester of 2008 to mitigate credit scarcity and improve its distribution to medium and small banks.
9/ In the second half of 2009, the industrial capacity utilization level (NUCI) compiled by National Industry Confederation (CNI) went up 2.39 p.p. on a seasonally-adjusted basis, and closed the year at 81.3%, still 2 p.p. under the top reach in September 2008. In January 2010, a 0.08 p.p. reduction ocurred.
10/ On 10/6/2010 it was the fi rst G-20 central bank to start the withdrawal of incentives to the economy since the worsening of the global fi nancial crisis. 11/ Seasonally-adjusted NUCI calculated by Getulio Vargas Foundation (FGV) reached 84.0% in February, the higher since October 2008, when it reached
85.1%.12/ Worth noting among these measures, the temporary tax reduction, in December 2008, such as Industrial Production Tax (IPI), initially applicable until
the end of March, later postponed for three months, and by the end of June maintained until October. From then on, tax rates were gradually reversed until January 2010, when they returned to their original levels.
0
1
2
3
4
Jan 2009
Feb Mar Apr May Jun Jul Aug Sep Oct Nov Dec Jan 2010
Feb
Chart 1.16 – Interest rates volatility
Short Medium Long
Sources: BM&FBovespa and BCB
% p.y.
Table 1.1 – Selected interest rates% p.y.
Date 1 day 3 months 6 months 1 year 2 years 3 years
6.12.09 9,16 8,98 8,96 9,36 10,66 11,53
9.11.09 8,65 8,64 8,71 9,12 10,67 11,49
12.17.09 8,65 8,71 9,09 10,30 11,89 12,56
2.9.10 8,65 8,83 9,49 10,44 11,48 11,92
2.26.10 8,65 9,08 9,81 10,75 11,75 12,10
Sources: BM&FBovespa and BCB
3,5
4,0
4,5
5,0
5,5
6,0
Jan 2009
Feb Mar Apr May Jun Jul Aug Sep Oct Nov Dec Jan 2010
Feb
% p.y.Chart 1.17 – IPCA
Core IPCA last 12 months IPCA last 12 months
Inflation Target Exp. IPCA 12 m - smooth.
Sources: IBGE and BCB
April 2010 | Financial Stability Report | 17
During the second semester of 2009, interest rate volatility maintained downward trend begun in November 2008. There were sharp raises on medium-term rates, in September, and for long-term rates, in October. The rapid increase in one-year rates to 10%, promptly enhanced volatility in September, while the increase in October was the result of investors’ reaction, since they were expecting a reduction in the inclination of the yield curve, and reduced their position in view of the Tax on Financial Operations (IOF) levied on the entry of foreign investors’ funds13. In the subsequent three months, as the smooth and consistent interest rate increase took place, the volatility of longer-term rates reduced and only went up again in February, as a result of the increase in risk aversion and the subsequent increase in the respective rates. Even in such a context, volatility in the long-term section of the yield curve was below the one recorded in months prior to the crisis. Volatility of short-term rates, up to three months, however, increased as of November, as the beginning of a tightening monetary cycle conducted by the BCB approached, rendering shorter-term interest rates more vulnerable.
General Price Index – Domestic Supply (IGP-DI) shifted between monthly defl ations and small price increases along the second half of 2009, but showed strong recovery in the fi rst two months of 2010, infl uenced by wholesale price acceleration refl ected in Wholesale Price Index – Domestic Supply (IPA-DI) evolution. While in the second semester IPA-DI recorded a 0.33% defl ation, in the fi rst two months of 2010 alone, it increased 2.35%. Concerning the Broad National Consumer Price Index (IPCA), prices rose 3.26% from July 2009 to February 2010 and 4.31% in 2009, below the 4.5%14 infl ation target. The worsening of the international fi nancial crisis and of its impacts on the real sector of the Brazilian economy was evidenced in lower infl ation expectations up to May 2009. Afterwards, they stabilized around 4.07% up to August. As of September expectations increased again, converging towards the target in January, where it remained. Price acceleration recorded in consumer price indexes as of the last quarter of 2009 refl ected the trend towards the economic activity recovery15.
13/ IOF tax on foreign investors’ foreign exchange operations related to capital infl ows driven to fi nancial and capital markets. On 10/20/2009, these operations were taxed at a 2% rate, 0.5 p.p. higher than the one that was applicable between March and October 2008 and. Such tax was restricted to foreign investments in private fi xed income securities and government bonds.
14/ National Monetary Council Resolutions n. 3,463 of 6/26/2007, n. 3,584 of 7/1/2008 and n. 3,748 of 6/30/2009 respectively set forth infl ation target for 2009, 2010 and 2011 at 4.5%, measured by IPCA, and tolerance intervals at 2.0 p.p. below or above the target.
15/ More recently, the descending path of core infl ation measures and diffusion indexes observed in 2009 were reversed and, in early in 2010, there was seasonal pressure over prices.
0,62
0,66
0,70
0,74
0,78
0,82
1,55
1,75
1,95
2,15
2,35
2,55
Jan 2009
Mar May Jul Sep Nov Jan 2010
EUR/US$R$/US$
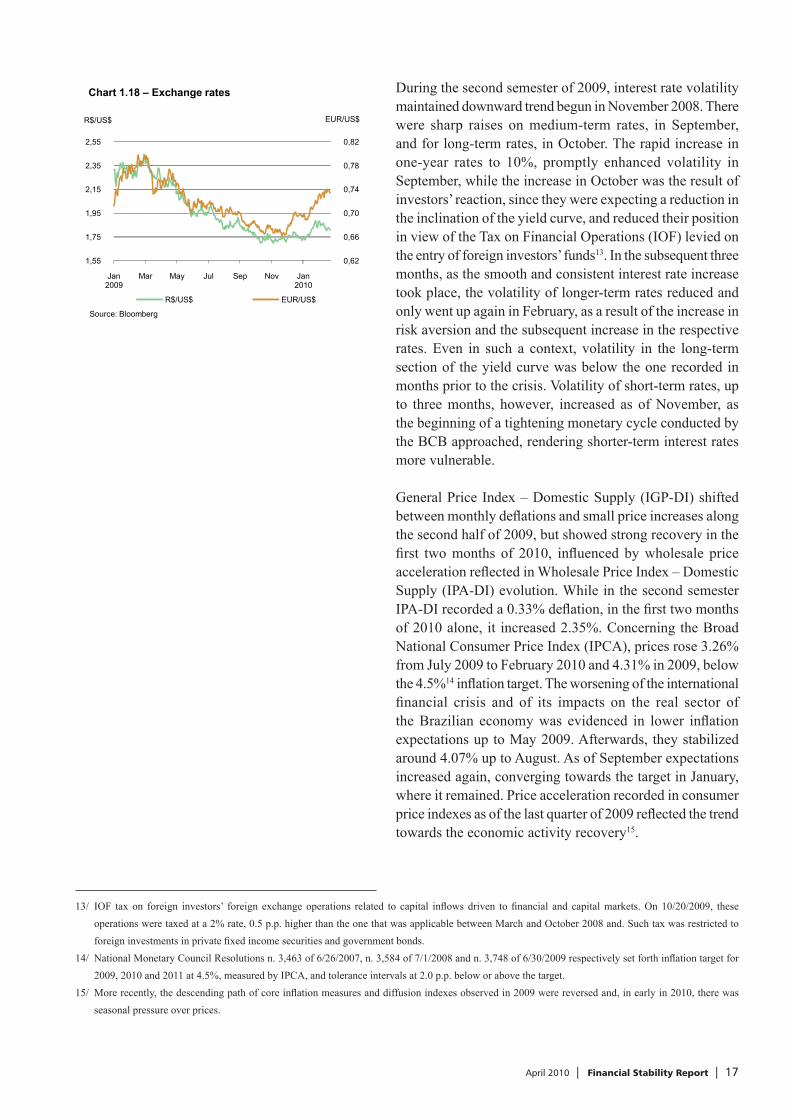
Chart 1.18 – Exchange rates
R$/US$ EUR/US$
Source: Bloomberg
April 2010 | Financial Stability Report | 18
In the second half of 2009, exchange rate fell until October, when it reached 1.70R$/US$, and kept relatively stable around 1.73R$/US$ up to early December. The speedy Brazilian economic recovery intensifi ed the capital fl ows, which remained positive as of May, and increased foreign exchange fl ow to US$14.6 billion in October, out of which the fi nancial sector was responsible for US$13.1 billion. Such capital infl ows, as well as decreased risk aversion in international markets, and certain concerns among investors with respect to the fi scal situation in US, allowed for an emerging economies’ currency recovery vis-à-vis the US dollar. Aiming at regulating capital fl ow, at the end of October, the Brazilian Government levied a 2% Tax on Financial Operations (IOF) on foreign capital infl ows driven to portfolio investments, comprising both equity and fi xed income, exempting direct investments. In November, fi nancial fl ow dropped 81.4% to US$2.4 billion. As of December, the US dollar strengthened against the Euro, as a result of regulatory uncertainties and fi scal deterioration in some mature economies. The Real exchange rate against the US dollar, however, remained relatively stable, resulting in a 6.5% Real appreciation against the Euro16 in three months.
In the eight months ending in February 2010, Brazilian exports fell 16.1% in relation to the same period in the previous year, while imports rose 9.9%, a U$27.1 billion worsening in our balance of trade. Nonetheless, the balance of foreign exchange operations went from a negative US$15.6 billion to a positive US$26.7 billion, as a result of the reversion in fi nancial operations. From July 2009 to January 2010, net foreign direct investment (FDI) fell 53.5% as compared to the same period in the previous year. BCB maintained its policy towards recovery of international reserves that totaled US$241 billion in February 2010, according to the international liquidity concept, signifying a 15.8% increase in eight months.
1.3.2 Assets market
As of the second quarter of 2009, the Brazilian economy began to grow, more vigorously in the second half of the year17. Nonetheless, a 0.2% GDP contraction occurred in 2009. Decrease in tax revenues, and tax reduction policy within the set of anti-cycle measures implemented by the
16/ From December 2009 to February 2010, there was a 2.9% devaluation of the real vis-à-vis the dollar. In January alone, there was a 8.1% depreciation which was partially recovered in February.
17/ In the third and fourth quarters, GDP growth relative to previous quarters reached 1.7% and 2% respectively.
April 2010 | Financial Stability Report | 19
Government, worsened the fi scal result along the year18. Consolidated public sector primary surplus totaled R$64.5 billion, equivalent to 2.06% of the GDP19, a 1.48 p.p. reduction in relation to 2008 surplus, while nominal defi cit grew 1.43 p.p., to 3.34% of the GDP20. Despite global economic disturbances, Government policies conduced to an economic recovery and an expressive capital market performance. Furthermore, cautious management of the internal federal public debt (DPMFi) enabled achievement of the goals set in the 2009 Annual Borrowing Plan (PAF), reducing the public debt cost as well as lengthening debt maturity.
On futures interest rate market, traded within BM&FBovespa, as international crisis effects subsided, the contracts’ maturities rose. In the eight months ending in February 2010, contracts with maturities between six months and two years went up to 57.2% of the average daily turnover, while those under six months fell to 29.1%. As compared to the same period in the previous year, it represents a 6.6 p.p. increase and a 5.3 p.p. reduction, respectively21. In dollar futures market, average daily trading volume showed consistent recovery as of December 2008. In February, it had almost doubled, as 361 thousand deals were closed. As global economy gradually improved, non-resident investors (NRI) began to shift from long to short positions and, in July and August 2009 they were, in average, short. However, as of September they became long again, whose balance reached US$3.5 billion in February 2010.
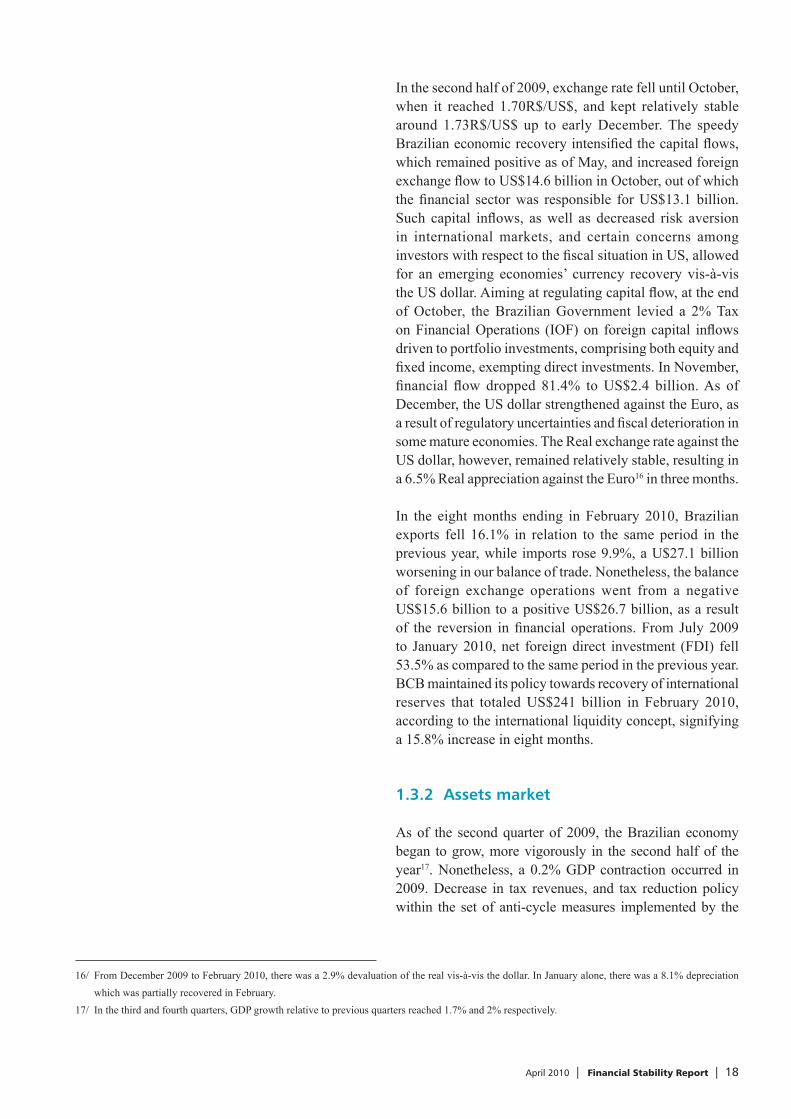
Ibovespa, the main Brazilian stock index, kept its recovery path in the second half of 2009, mainly up to November. Various factors contributed to this evolution, especially: successive upper revisions for world growth; Brazil’s credit rating raised to investment grade by Moody’s, with a positive perspective for the sovereign debt; Central Bank’s easing monetary policy; and fi scal incentives which contributed to improve economic agents’ mood, as well as that of national consumers and investors. Nonetheless, infl uenced by IOF tax22 changes, October and November volatility was high. As of December, Ibovespa hasn’t showed a clear trend, strongly oscillating around 67.500 points due to the risk aversion that
18/ In April, 2009 public sector primary surplus target went down from 3.8% to 2.5% of GDP and 2010 target was set at 3.3% of GDP.19/ Such results met the primary surplus target adjusted for the year at 1.93% of GDP, discounting investments under the Growth Acceleration Program (PAC)
allowing reduction (0.57% of GDP).20/ In January 2010, the accumulated 12-months primary surplus reached R$73.3 billion (2.32% of GDP), while nominal defi cit reached R$94.9 billion (3%
of GDP). January’s R$2.2 billion nominal surplus refl ects the fi scal recovery already under way.21/ Futures contract maturing in January 2011 was the most traded and took up 38.9% of the average daily turnover.22/ Aside from charging 2% IOF in October, a 1.5% charge on depositary receipts was levied in November so as to strengthen the capital market.
34
42
50
58
66
74
Jan 2009
Feb Mar Apr May Jun Jul Aug Sep Oct Nov Dec Jan 2010
Feb
Points (thousands)
Chart 1.19 – Bovespa index
Source: BM&FBovespa
April 2010 | Financial Stability Report | 20
prevailed in the market. All months in the second half of 2009 showed positive net foreign investment fl ow, totaling R$10.5 billion. In January and February 2010, however, there was a R$3.4 billion outfl ow. In the past eight months ending in February, Ibovespa rose 29.2% in nominal terms and 39.6% in dollar, while the Morgan Stanley Capital International Emerging Markets Index (MSCI EM)23 grew 22.9%.
The international fi nancial crisis had an impact in Brazil’s public bonds market and in DPMFi, mainly along the fi rst quarter of 2009, when maturities of new issues shortened and the portion of fi xed rate bonds has decreased. Slowly, as the internal economic growth took up, and the international economic scenario looked less gloomy, it went back to normal. In the past eight months ending in February 2010, the share of infl ation-linked bonds increased 2 p.p., offsetting the fall in the share of fi xed rate bonds. Overall these two categories24 made up 60% of DPMFi, equally distributed among them. The share of fl oating-rate bonds greatly varied along the second semester25, but in February 2010 went back to the same level as in June 2009 (38%). DPMFi increased 5,7% in these eight months and at the end it totaled R$1,4 trillion.
In the eight-month period ending in February 2010, there was a reduction in the share of short-term maturing debt as well as a maturity lengthening of new issues. This lengthening was particularly signifi cant as of January and in February it reached a 61.3 months26 record. After keeping relatively stable around 29% in the third quarter of 2009, the twelve-month maturing portion of the DPMFi suffered a setback in the fourth quarter, and at the end of February 2010 it was at the same level (25%) as before the global fi nancial crisis deepened. In addition, the progressive confi dence recovery, as of the second quarter of 2009, facilitated the 17.4 p.p. reduction in the portion of fi xed rate bonds maturing in next twelve-months to 40.2% at the end of February27. Treasury bond substitution transactions were an important DPMFi management instrument during the period. Between June 2009 and February 2010, early redemption of bonds
23/ MSCI EM index represents the behavior of emerging countries stock exchange as measured by Morgan Stanley.24/ However, while increased share of such bonds was gradual, that of fi xed rate bonds was more erratic: they increased 4 p.p. from July to December 2009
to 34%, but in January it went back to a 30% relative share.25/ Differently from the previous period, this calculation was not affected by BCBs foreign exchange swap exposure, which was neutral since the end of the
fi rst semester.26/ Representing an increase of 24.3 months in one year.27/ 23.5 p.p. reduction from March to December 2009 and 6.0 p.p. increase in the fi rst two months of 2010.

April 2010 | Financial Stability Report | 21
with maturities of less than a year totaled R$24.8 billion, while new issues with maturities over one year, linked to substitution transactions, totaled R$36.6 billion28.
In managing banking liquidity, the Central Bank performed daily intraday and overnight repos as well as weekly six-month maturity repos29. In the eight-month interval ending in February 2010, the fi nancial volume of long-term repos totaled R$110.7 billion, a 83.1% increase over the same period in the previous year30. At the end of February, 19.2% of the balance of repos was comprised of six-month transactions. After reaching a R$509 billion record in January, the balance of repos performed by BCB closed at R$472 billion31 in February, a 22.4% growth since June 2009.
1.4 Conclusion
Along the second half of 2009, the improvement in world economy allowed for a decrease in risk aversion in international markets, which favored capital infl ows into Brazil, and contributed to the Real appreciation and to the good performance of capital markets, and in the eight months ending in February 2010, Ibovespa accumulated a 40% dollar-appreciation. However, along with the reviews of growth expectations in major economies and the high fi scal defi cits stemming from anti-crisis measures, uncertainties as to the conditions to fulfi ll such expectations grew, refl ecting in Brazil’s interest market. Although a consistent recovery in the level of domestic activity and a slightly ascending trend in longer-term interest rates were in place, especially after the second half of September, corresponding volatilities remained low, with brief peaks refl ecting such uncertainties. In face of the increase in the capacity utilization and in infl ation expectations, shorter-term rates gradually increased as of November, in anticipation of a preventive and prompt attitude on the part of the BCB. Stimuli measures created by the Government to face the crisis were gradually reversed as internal demand expanded
28/ Bond issues of over one year maturities, attached to substitution transactions, were distributed as follows: R$11.1 billion National Treasury Bills (LTN), R$5.2 billion Treasury Financial Bills (LFT), R$19.3 billion National Treasury Notes – B Series (NTN-B) and R$1.0 billion National Treasury Notes – F Series (NTN-F).
29/ As of April 24, 2009, these repo auctions became accessible to all fi nancial institutions as opposed to dealers only, while fi ve and seven months transactions were replaced by a six months maturity. Balance of fi ve and seven months deals were zeroed on 9/14/2009 and 11/16/2009 respectively.
30/ Compared to the eight previous months (November 2008 to June 2009) the increase is smaller, just 59.2%.31/ Regarding changes in reserve requirements announced by February end, there should be a R$37 billion rise on reserve balance as of March 24 and an
additional R$34 billion as of April 9.

April 2010 | Financial Stability Report | 22
and economic performance improved in the second half. In 2009, infl ation remained 0.19 p.p. below the 4.5% target. There was a small (0.2%) GDP contraction, and a primary surplus of 2.06% of the GDP. Moreover, once the crisis was overcome, it was possible to lengthen the maturity of DPMFi issues and decrease the short-term maturing portion, recovering pre-crisis level.