Embed Size (px)
Citation preview

SEE APPENDIX I FOR IMPORTANT DISCLOSURES AND ANALYST CERTIFICATIONS
17 October 2011
PP16832/01/2012 (029059)
Sector Update 12 July 2013
PP16832/01/2013 (031128)
Page 1 of 2
Malaysia
Banking Dissecting Household Debt
Maintain Overweight. This report seeks to provide investors with a
more comprehensive view of household (HH) debt in the country, its
sources and its growth drivers. We believe that HH debt is not a
systemic risk at this stage, but growth has to be reined in. At 83% of
GDP (end-Mar 2013) which is among the highest in the region,
Malaysia’s HH debt has expanded at a rate of 11.5% p.a. over the past
five years, outpacing nominal GDP growth of 7.5% p.a.. Of the various
HH debt components, the risk still lies with mortgages, in our view,
where loan growth remains firm at 12-13% amid rising house prices
(+6% YoY in 1Q13), so, further property cooling measures cannot be
ruled out. Our forecasts already assume moderating HH loan growth.
Our BUYs are AMMB, BIMB, RHB Cap and HLFG.
In our attempt at dissecting HH debt, some observations include the
following: a) the Treasury Housing Loan Division contributes to 12% of
HH housing loans, b) NBFIs contribute to 58% of total personal loans,
c) loans to individuals for the purchase of non-residential property
(NRP) make up about 43% of total banking system NRP loans, and d)
Amanah Saham Nasional Bhd (ASB) financing currently accounts for
about 71% of loans for the purchase of securities, by our estimates.
The three main components of HH debt are mortgages (45% of total
HH debt at end-Mar 2013), transport vehicles (18%) and personal
financing (PF; 17%). We deem PF to be of “medium” risk for it accounts
for just 5% of total banking system loans and while NBFIs have been
aggressive lenders, the default risk from this segment is largely offset
by relatively secure payments under salary deduction schemes, while
Bank Negara (BNM)’s recent move to cap PF tenures at 10 years
should have the desired effect of curtailing demand. Auto loans are also
medium risk; there are indications that demand is moderating, though
how much of this is a General Election effect remains to be seen.
Servicing is not an issue. HH NPLs have fallen dramatically from
7.5% in 2006 to just 1.4% presently. Retail deposits and EPF
contributions make up a comfortable 108% of household debt, by our
estimates. BNM statistics paint a better picture, with a liquid financial
assets to HH debt ratio of 145% at end-Mar 2013, and a total HH
financial assets to HH debt coverage of 221%. Household debt service
ratios averaged a decent 43.9% as at end-Dec 2012.
Factored in moderating HH loan growth. Our projected industry loan
growth of 10.7% this year assumes HH loan growth of 10.5% and non-
HH loan growth of 11%. We forecast industry loan growth of 10.2% in
2014, incorporating a moderation in HH loan growth to 9.9% and non-
HH loan growth of 10.6%. At this stage, while we are comfortable with
HH loan growth momentum, corporate loan growth is proving to be
more subdued than expected despite much infrastructure and oil & gas
projects in the pipeline. Downside risks to our forecasts, if any, are
therefore likely to emanate from this front.
Overweight (unchanged)
Desmond Ch’ng, ACA [email protected] (603) 2297 8680
Table of Content
Page
A look at the statistics on household debt 2
Who are the lenders to households? 3
What does household debt comprise? 5
How does Malaysia’s HH debt ratio compare
globally?
7
What is driving the growth in HH debt? 7
Where are the risks and what is being done? 8
Is household debt a concern? 15
Banking coverage
Company Rec Price TP Upside
Maybank NR 10.44 NR -
CIMB Hold 8.28 8.70 5.1
Public Bank Hold 17.02 17.60 3.4
Hong Leong Bank Hold 14.14 15.60 10.3
HLFG Buy 14.38 16.40 14.0
RHB Capital Buy 8.54 9.80 14.8
AMMB Buy 7.63 8.30 8.8
BIMB Buy 4.00 4.60 15.0
Source: Maybank KE
NR = Not Rated
12 July 2013 Page 2 of 21
Banking 17 October 2011
Page 1 of 2
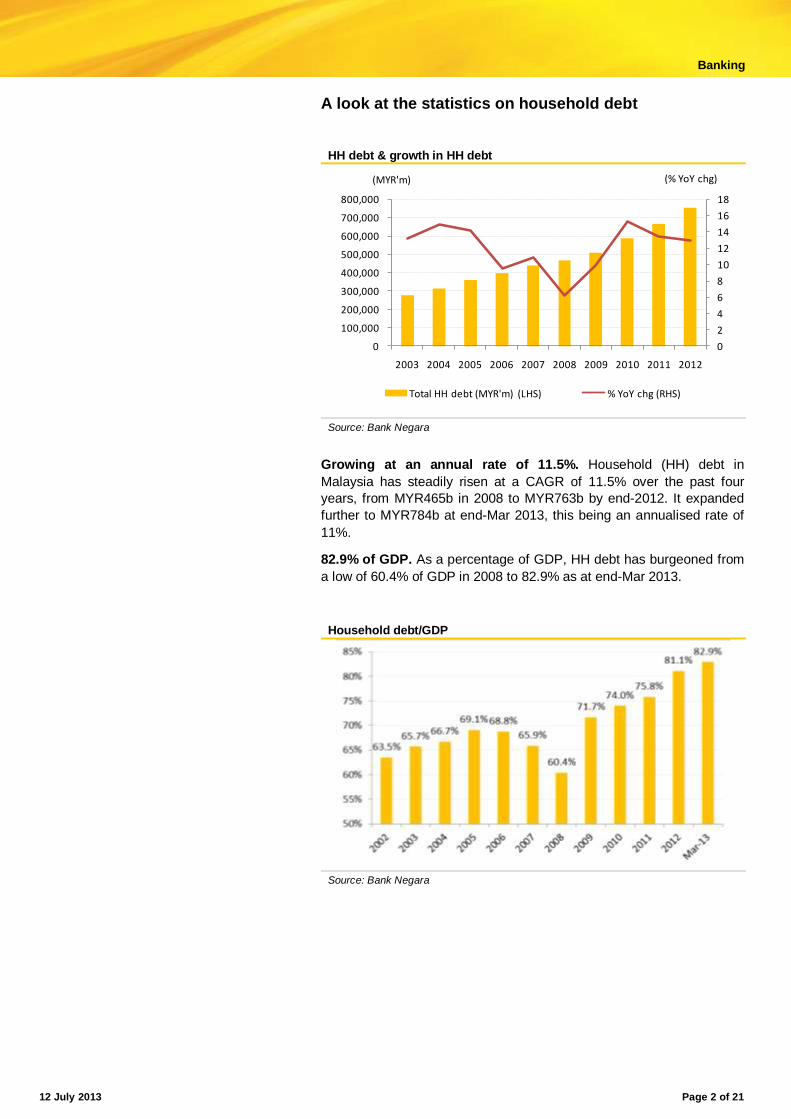
A look at the statistics on household debt
HH debt & growth in HH debt
0
2
4
6
8
10
12
14
16
18
0
100,000
200,000
300,000
400,000
500,000
600,000
700,000
800,000
2003 2004 2005 2006 2007 2008 2009 2010 2011 2012
(% YoY chg)(MYR'm)
Total HH debt (MYR'm) (LHS) % YoY chg (RHS)
Source: Bank Negara
Growing at an annual rate of 11.5%. Household (HH) debt in
Malaysia has steadily risen at a CAGR of 11.5% over the past four
years, from MYR465b in 2008 to MYR763b by end-2012. It expanded
further to MYR784b at end-Mar 2013, this being an annualised rate of
11%.
82.9% of GDP. As a percentage of GDP, HH debt has burgeoned from
a low of 60.4% of GDP in 2008 to 82.9% as at end-Mar 2013.
Household debt/GDP
Source: Bank Negara

12 July 2013 Page 3 of 21
Banking 17 October 2011
Page 1 of 2
Who are the lenders to households?
Household debt by lender (Mar 2013)
Source: Bank Negara
Household debt by lender (MYR’m)
2012 Composition
(%) Mar 2013
Composition
(%)
Banking system 616,499 80.8 632,714 80.7
Development financial institutions (DFIs)
64,373 8.4 66,062 8.4
Treasury Housing Loan Division and others
41,094 5.4 42,460 5.4
Non-bank financial institutions
29,682 3.9 31,220 4.0
Insurance sector 11,743 1.5 11,940 1.5
Total 763,390 100 784,395 100
Source: Bank Negara
Note:
1) Banking system: Commercial banks, Islamic banking institutions and investment banks 2) DFIs – Bank Kerjasama Rakyat Malaysia Berhad (Bank Rakyat) and Bank Simpanan Nasional (BSN)
3) Non-bank Financial Institutions – building society, credit/ leasing companies, payment instrument issuers
Lenders to households include:
a) The banking system, which accounts for 81% of total HH debt,
by virtue of housing and auto loans being the largest components
of an individual’s debt. The banking system here refers to
commercial banks, Islamic banks and investment banks.
b) Development financial institutions (DFIs), with an 8% share of
HH debt as at end-Mar 2013. The table overleaf lists out all the
DFIs in Malaysia, but not all provide financing to households.

12 July 2013 Page 4 of 21
Banking 17 October 2011
Page 1 of 2
DFIs in Malaysia
DFIs prescribed under the Development Financial Institutions Act 2002
Bank Pembangunan Malaysia Berhad
Bank Perusahaan Kecil & Sederhana Malaysia Berhad (SME Bank)
Export-Import Bank of Malaysia Berhad (EXIM Bank)
Bank Kerjasama Rakyat Malaysia Berhad
Bank Simpanan Nasional
Bank Pertanian Malaysia Berhad (Agrobank)
DFI's not prescribed under the DFI Act 2002
Malaysian Industrial Development Finance
Credit Guarantee Corporation
Lembaga Tabung Haji
Sabah Development Bank
Sabah Credit Corporation
Borneo Development Corp. (Sabah)
Borneo Development Corp. (Sarawak)
Source: Bank Negara
Bank Rakyat and BSN are largest DFI lenders to households.
From the list above, the two largest DFIs which are providers of
HH financing are Bank Kerjasama Rakyat Malaysia (Bank
Rakyat) and Bank Simpanan Nasional (BSN). We estimate Bank
Rakyat to be the largest provider of HH debt with an estimated
74% share of DFI HH debt as at end-Dec 2012. We estimate
BSN’s market share of DFI HH debt to be 21%.
c) The Treasury Housing Loan Division (THLD), which is the
provider of housing loans to the Government civil service, and
others with a 5% share of total HH debt.
d) Non-bank financial institutions (NBFIs). These include MBSB
and credit/leasing companies, which would also include the likes
of AEON Credit. MBSB’s total consumer loan portfolio amounted
to MYR25.6b at end-Mar 2013, making up 82% of total
outstanding NBFI financing.
e) Insurance companies, in view of the premiums paid. Insurance
companies, however, account for just 2% of total HH debt.
About the Treasury Housing Loan Division
a) Provides housing loans to civil servants. The THLD falls
under the purview of the Ministry of Finance and is tasked with
providing affordable housing loans to civil servants. According to
its website, this would also include Supreme/High Court judges,
the Royal Malaysian Police and members of the Armed forces.
b) Terms and conditions. The margin of financing is up to 100%,
with a maximum loan tenure of 30 years for first-time borrowers
and 25 years for second-time borrowers. Loan amounts are
capped at MYR450k.
c) Interest rates are currently a flat 4% while in government service
and 7% upon leaving the service. Mortgage insurance is
required; the panel of insurers currently comprises Sun Life,
Etiqa, Axa-Affin, Prudential BSN, Takaful Ikhlas and Takaful
Malaysia.

12 July 2013 Page 5 of 21
Banking 17 October 2011
Page 1 of 2
What does household debt comprise?
Household debt by category (Mar 2013)
Source: Bank Negara
Three main components. The three main components that make up
79% of total HH debt are mortgages (45% of total HH debt at end-Mar
2013), transport vehicles (18%) and personal financing (17%).
Other components include a) loans for the purchase of commercial
properties e.g. shophouses (7% of total HH debt at end-Mar 2013), b)
loans for the purchase of securities, including financing of the Amanah
Saham (ASB) scheme (6%), and c) credit cards (4%).
Breaking it down further. Now that we know who the lenders to
households are and the composition of household debt, the table
overleaf is our attempt at deconstructing the numbers for a more
detailed breakdown of household debt and the lenders. Two key
takeaways are that:
a) The banking system and THLD are the largest sources of housing
loans in the country, accounting for 85% and 12% of total housing
loans respectively.
b) The DFIs and NBFIs now contribute to a larger chunk of personal
loans than the banking system itself, at 58% of such loans.

12 July 2013 Page 6 of 21
Banking 17 October 2011
Page 1 of 2
Estimated Household debt by segment and lender (Dec 2012)
(MYR'm) (MYR'm) Share
Purchase of residential properties
339,992
Banking system 288,522
85%
DFIs 6,257
2%
MBSB 5,409
2%
THLD 41,094
12%
Others (1,289)
0%
Purchase of transport vehicles
135,068
Banking system 128,848
95%
DFIs 1,257
1%
MBSB 128
0%
Others 4,834
4%
Personal use
128,790 Banking system 55,030
42%
DFIs 55,619
44%
MBSB 17,794
14%
Others 347
0%
Purchase of non-residential props
56,861 Banking system 56,718
100%
DFIs 254
0%
Others (111)
0%
Purchase of securities
44,616
Banking system 42,538
95%
DFIs 110
0%
Others 1,968
4%
Credit card
34,031 Banking system 33,261
98%
DFIs 580
2%
Others 190
1%
Others
24,033 Banking system 11,582
48%
DFIs 296
1%
Insurance 11,743
49%
Others 412
2%
Total 763,390 763,390
Source: Bank Negara, Maybank KE

12 July 2013 Page 7 of 21
Banking 17 October 2011
Page 1 of 2
How does Malaysia’s HH debt ratio compare globally?
Global HH debt/GDP ratios end-Dec 2012
610
60
7881
31
60
74
91 91
113
59
8692
99
0
20
40
60
80
100
120
(%)
Source: CEIC, Bank Negara, Maybank KE
Relatively high. Of the countries sampled based on CEIC data,
Malaysia’s HH debt/GDP ratio of 81% was one of the highest in Asia as
at the end of 2012, second only to South Korea at 91%. The ratio was
nevertheless lower than that of the other developed economies, which
averaged about 90%.
What is driving the growth in HH debt?
Household debt by purpose – end-Dec 2012 (MYR’m)
2012
Composition
(%)
Growth
(%)
Contribution to annual
growth (%pt)
Residential properties 339,992 44.5 12.7 5.7
Transport vehicles 135,068 17.7 7.3 1.4
Personal use 128,790 16.9 20.5 3.2
Non-residential props 56,861 7.4 15.3 1.1
Purchase of securities 44,616 5.8 21.7 1.2
Credit card 34,031 4.5 1.7 0.1
Others 24,033 3.2 11.8 0.4
Total 763,390 100 13.1 -
Source: Bank Negara
Household debt by purpose – end-Mar 2013 (MYR’m)
Mar 2013 Composition
(%)
Growth
(%)
Contribution to annual
growth (%pt)
Residential properties 350,157 44.6 12.4 5.6
Transport vehicles 138,249 17.6 9.2 1.7
Personal use 131,913 16.8 19.7 3.1
Non-residential props 58,706 7.5 16.0 1.2
Purchase of securities 47,818 6.1 26.8 1.5
Credit card 32,955 4.2 1.3 0.1
Others 24,596 3.1 8.4 0.3
Total 784,395 100.0 13.4 -
Source: Bank Negara
12 July 2013 Page 8 of 21
Banking 17 October 2011
Page 1 of 2
Residential and personal loans contribute to HH debt growth. The
above tables show that HH debt has been expanding at a double-digit
pace and the primary contributors to growth have been the residential
property and personal loans segments, which contributed 5.6ppts and
3.1ppts of the 13.4% YoY expansion in HH debt as at end-Mar 2013.
There is also strong growth in loans for the purchase of non-residential
properties and securities, which expanded 16% YoY and 27% YoY
respectively in Mar 2013. These two segments, however, currently
contribute to just about 14% of total HH debt.
Where are the risks and what is being done?
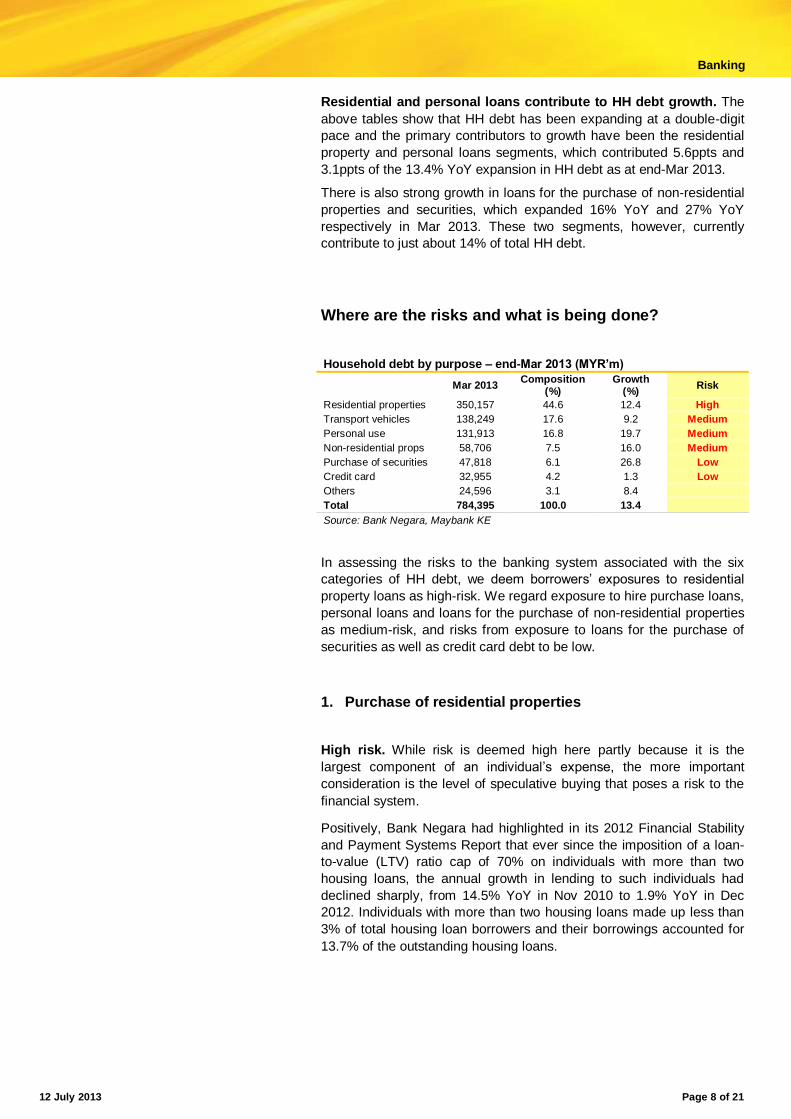
Household debt by purpose – end-Mar 2013 (MYR’m)
Mar 2013 Composition
(%) Growth
(%) Risk
Residential properties 350,157 44.6 12.4 High
Transport vehicles 138,249 17.6 9.2 Medium
Personal use 131,913 16.8 19.7 Medium
Non-residential props 58,706 7.5 16.0 Medium
Purchase of securities 47,818 6.1 26.8 Low
Credit card 32,955 4.2 1.3 Low
Others 24,596 3.1 8.4
Total 784,395 100.0 13.4
Source: Bank Negara, Maybank KE
In assessing the risks to the banking system associated with the six
categories of HH debt, we deem borrowers’ exposures to residential
property loans as high-risk. We regard exposure to hire purchase loans,
personal loans and loans for the purchase of non-residential properties
as medium-risk, and risks from exposure to loans for the purchase of
securities as well as credit card debt to be low.
1. Purchase of residential properties
High risk. While risk is deemed high here partly because it is the
largest component of an individual’s expense, the more important
consideration is the level of speculative buying that poses a risk to the
financial system.
Positively, Bank Negara had highlighted in its 2012 Financial Stability
and Payment Systems Report that ever since the imposition of a loan-
to-value (LTV) ratio cap of 70% on individuals with more than two
housing loans, the annual growth in lending to such individuals had
declined sharply, from 14.5% YoY in Nov 2010 to 1.9% YoY in Dec
2012. Individuals with more than two housing loans made up less than
3% of total housing loan borrowers and their borrowings accounted for
13.7% of the outstanding housing loans.

12 July 2013 Page 9 of 21
Banking 17 October 2011
Page 1 of 2
However, monthly mortgage loan growth has averaged 12-14% since
July 2010 and continues to hold up very well at 12-13% YoY up to May
2013, with little sign of abating despite cooling measures implemented
to date. Moreover, house prices have continued to rise and the National
Property Information Centre (NAPIC)’s all-house price index rose
another 6% YoY in 1Q13 which is fueling the strong demand
momentum.
Measures introduced by Bank Negara include:
Nov 2010: Loan-to-value ratio capped at 70% for third housing
loan onwards, 60% for housing loans by non-individuals.
May 2011: Raised capital charges on housing loans where the
loan-to-value ratio exceeds 90%
Nov 2011: Guidelines issued on responsible lending and the
computation of debt service ratios (DSR) based on a borrower’s
net income.
Jan 2013: A higher Real Property Gains Tax (RPGT) of 15%
(from 10%) for properties disposed within 2 years and 10% (from
5%) for properties disposed within 3-5 years.
Jul 2013: Capping the tenure for residential property loans at 35
years.
Government measures to promote affordable housing include:
My First Home Scheme (MFHS). Borrowers up to 35 years of age
and whose incomes are MYR5,000/mth or less (MYR10,000
combined for husband and wife) can still turn to the MFHS for
mortgage financing of up to 40 years or 65 years or age, for
properties valued at MYR100k-MYR400k.
Perumahan Rakyat 1Malaysia (PR1MA). Aims to provide
affordable housing to middle-income households (combined
household income of MYR2,500-MYR7,500/mth) with homes
ranging from MYR100k-400k. Open to those who own no more
than one property. A 10-year moratorium will be imposed on the
property.
Mortgage loan growth (Apr 2007 – May 2013) All-house price index (1Q99-1Q13)
0%
2%
4%
6%
8%
10%
12%
14%
16%
(% YoY chg)
80
100
120
140
160
180
200
1Q99 1Q01 1Q03 1Q05 1Q07 1Q09 1Q11 1Q13
Source: Bank Negara Source: NAPIC

12 July 2013 Page 10 of 21
Banking 17 October 2011
Page 1 of 2
2. Loans for personal use
Medium risk. Risks in this segment arise not because of the exposure
of the banking system – growth in personal loans has in fact fallen from
over 20% YoY to just 8% YoY, and these loans account for just 5% of
banking system loans. The risk, however, lies with the rising exposure
of the NBFIs (including DFIs) to this segment. As the table below
indicates, accelerated growth in personal loans by the NBFIs (+31%
YoY in 2012 vs just 9% for the banking system) has resulted in NBFIs
having overtaken the banking system as the largest providers of
personal financing (PF), with a 58% market share.
Of the NBFIs, the three largest PF providers are Bank Kerjasama
Rakyat (Bank Rakyat), with an estimated 59% share of the NBFI PF
market, followed by MBSB with 26% and Bank Simpanan Nasional
(BSN; 13%).
Personal financing (MYR’m)
2012 % of total
Growth (%)
Mar 2013
% of total
Ann gwth (%)
Banking system 55,030 42.7 9.1 55,385 42 9.1
Non-banks (including DFIs)
73,760 57.3 30.6 76,529 58 28.8
Total 128,790 100.0 20.5 131,913 100 19.7
Source: Bank Negara
The risk also lies with the fact that the bulk of the loans are to borrowers
earning <MYR3,000/month. For instance, MBSB’s minimum salary
requirement is MYR700/month, while Bank Rakyat’s is
MYR1,000/month.
Mitigating the risks somewhat, however, is the fact that these loans are
principally extended to almost exclusively to Government civil service
and Government-linked company (GLC) employees under an automatic
salary deduction scheme administered by Biro Perkhidmatan Angkasa.
As such, repayment is secured so long as the borrower remains
employed with the government/GLC. Moreover, the scheme prescribes
a maximum DSR of 60% of net income.
The key issue is ensuring compliance, for NBFIs previously did not fall
under the purview of Bank Negara. The enactment of the Financial
Services Act, however, has paved the way for Bank Negara to exercise
authority over the NBFIs.
Measures introduced: A cap on PF tenures at 10 years and the
prohibition of pre-approved PF products for applications made after 5
Jul 2013. Government measures include the SARA 1Malaysia scheme
targeted at households earning <MYR3,000/month, and financial
assistance under Bantuan Rakyat 1Malaysia (BRIM) e.g. RM500 cash
assistance to households with monthly income of less
<MYR3,000/month and RM250 to individuals aged between 21 – 30
earning below MYR2,000/month.

12 July 2013 Page 11 of 21
Banking 17 October 2011
Page 1 of 2
Banking system personal loan growth (Apr 2007 – May 2013)
0%
5%
10%
15%
20%
25%
(% YoY chg)
Source: Bank Negara, Maybank KE
3. Purchase of transport vehicles
Medium risk. Motor vehicles make up the second-largest component
(18%) of HH debt. This, coupled with the pick-up in loan growth, places
this segment in the medium risk category, in our view.
The need to standardise loan processing documents resulted in a
slowdown in loan disbursements during the early part of 2012, but
momentum gradually picked up pace and hit a peak of 9% YoY in April
2013, this being one of the fastest rates since 2007, before softening to
8.4% YoY in May 2013.
The consolation at this stage is that passenger vehicle sales declined
MoM in April and May 2013 and passenger car loan applications have
moderated. This, however, could be attributed to consumers holding
back on their purchases in anticipation of lower car prices after the 13th
General Election held on 5 May amid the populist pledge by both sides
of the political divide to lower car prices. As such, whether this trend
continues will have to be monitored. A fact to note is that 70% of loans
are for the financing of new cars.
Measures introduced: The tenure for vehicle financing was capped at
9 years effective Nov 2011.
Bank Negara also takes the view that the development of a public
transportation system, particularly in the Klang Valley (Mass Rapid
Transit, Light Rail Transit, and bus deployments) plus the restructuring
of fuel subsidies will reduce passenger vehicle loan demand. We
concur with this view since ownership of a car/motorcycle is currently a
necessity rather than a luxury.

12 July 2013 Page 12 of 21
Banking 17 October 2011
Page 1 of 2
Auto loan growth (Apr 2007 – May 2013) 3M moving avg passenger car sales
0%
1%
2%
3%
4%
5%
6%
7%
8%
9%
10%
(% YoY chg)
-20%
-10%
0%
10%
20%
30%
40%
Mar-07 Mar-08 Mar-09 Mar-10 Mar-11 Mar-12 Mar-13
3M MA - passenger vehicle sales
Source: Bank Negara, Maybank KE Source: Bank Negara, Maybank KE
4. Purchase of non-residential properties
Medium risk. This segment is hard to analyse, for the “purchase of
non-residential properties” (NRP) category in Bank Negara’s statistics
comprises lending to both individuals and non-individuals. Loan growth
to this segment has been rapid at >20% YoY from late 2010 to Sep
2012 and has only started moderating of late, to 16.7% YoY in May
2013.
Cumulatively, loans for the purchase of non-residential properties make
up 12% of total banking system loans of which loans to individuals for
this purpose totalled MYR58.7b as at end-Mar 2013, or 43% of total
NRP loans. NRP loans to individuals make up just 7.5% of total HH
debt at this stage and are thus less of a concern. Moreover, the NPL
ratios here are very low at just 0.8% end-Mar 2013.
Households and retail investors have primarily focused on the purchase
of shop lots, and according to Bank Negara, they accounted for about
two-thirds of bank lending for this purpose in end-2012. Prices of shop
lots rose at a CAGR of 7.2% between 2006 and 2012.
Measures introduced: Maximum loan tenure of 35 years for non-
residential properties (Jul 2013).

12 July 2013 Page 13 of 21
Banking 17 October 2011
Page 1 of 2
Non-residential prop loan growth (Apr 2007 – May 2013) Banks’ exposure to the property market
0%
5%
10%
15%
20%
25%
(% YoY chg)
65.9%
10.8%
4.3%
12.3%
2.9%1.7%
1.6%0.6%
End-financing-res prop
End-financing-shops
End financing-office
End-financing-others
Working cap
Bridging finance
PDS held by Fis
Investment in props
Source: Bank Negara, Maybank KE Source: Bank Negara, Maybank KE
5. Purchase of securities
Low risk. Accounting for 6.1% of total HH debt at end-Mar 2013,
banks’ exposure to securities loans is not significant at this stage.
Nevertheless, there are reasons to keep a watchful eye on this
segment, for growth momentum has been picking up and was 30% YoY
in May 2013.
We deem the default risk of loans to this segment to be low for now,
because we estimate Amanah Saham Nasional Bhd (ASB) financing
currently accounts for about 71% of loans for the purchase of securities
and there is less risk to such financing given that an investor’s capital is
guaranteed. This would partly account for the very low default rate of
just 0.2% for this segment.
Currently, only three banks are allowed to provide ASB financing –
Maybank, CIMB and RHB Capital. Stripping these out, loans for the
purchase of securities would account for just 1.8% of total HH debt as
at end-Mar 2013.
Measures introduced: Nil
Growth in loans for the purchase of securities Market share of ASB financing
0%
5%
10%
15%
20%
25%
30%
35%
(% YoY chg)
CIMB, 23%
RHB Cap, 25%
Maybank, 52%
Source: Bank Negara, Maybank KE Source: Companies

12 July 2013 Page 14 of 21
Banking 17 October 2011
Page 1 of 2
6. Credit card exposure
Low risk. Ever since Bank Negara introduced credit card restrictions in
2011, the number of credit cards in circulation has fallen from a peak of
10.8m cards (principal and supplementary) in 2008 to 8.2m cards as at
end-May 2013. Credit card loan growth has also declined significantly
to just +0.8% YoY in May 2013, with credit card balances making up
just 4.2% of HH debt today. Credit card NPLs make up just 1.9% of
total banking system NPLs.
Measures introduced. In Mar 2011, BNM:
Set the minimum income eligibility for new credit card holders at
MYR24k p.a.;
Restricted the number of credit cards to a maximum of two
issuers and set the maximum credit limit to no more than 2x their
monthly salary, for cardholders earning MYR36k p.a. or less.
No. of credit cards in circulation (principal & supplementary)
Growth in credit card loans (Jan 10 –May 13)
0.0
2.0
4.0
6.0
8.0
10.0
12.0
1999 2002 2005 2008 2011
(m)
0%
2%
4%
6%
8%
10%
12%
14%
16%
(% YoY chg)
Source: Bank Negara, Maybank KE Source: Bank Negara, Maybank KE

12 July 2013 Page 15 of 21
Banking 17 October 2011
Page 1 of 2
Is household debt a concern?
In a nutshell, HH debt is an issue to be wary of because growth here is
outpacing GDP expansion. Is it a systemic risk? Not at this stage, for
asset quality remains impeccable, financial asset coverage is high, and
debt servicing capabilities remain decent amid stable job market
conditions and steady income growth. Concerns would arise if
unemployment or inflation/higher interest rates becomes an issue.
As it stands, we are expecting inflation to rise from an average of 1.8%
this year to 2.0%-2.5% in 2014 with the re-commencement of the
gradual subsidy reduction programme that would result in higher
electricity and fuel prices. There is also the risk from the eventual
introduction of the Goods and Services Tax (GST), though very unlikely
to be in 2014. The GST impact could be mitigated by the lowering of
personal income tax rates and the provision of financial or cash aid for
the non-income tax paying lower income groups.
Interest rates, however, are likely to remain stable, for economic growth
is likely to take precedence. At worst, we expect the overnight policy
rate to be raised by another 25bps to 3.25% in 2014.
The pace of increase is a concern… The issue right now is that HH
debt is running at a faster pace than GDP growth and as a result, the
HH debt to GDP ratio is likely to continue rising unless curtailed.
Assuming nominal GDP continues to grows at an average pace of 7.5%
p.a. while HH debt rises 11% YoY, the HH debt/GDP ratio would
theoretically hit 97% in five years’ time i.e. by 2018.
Household debt to GDP
81
84
87
89
92
95 97
70
75
80
85
90
95
100
0
200
400
600
800
1,000
1,200
1,400
1,600
2012 2013E 2014E 2015E 2016E 2017E 2018E
(%)(MYR'b)
Nominal GDP (MYR'b) HH debt (MYR'b) HH debt/GDP (%)
Source: Bank Negara, Maybank KE
…but less so the quality. At this stage, there is little evidence of stress
in HH debt. In fact, household NPL ratios have fallen dramatically over
the past few years from 7.5% in 2006 to just 1.4% presently.

12 July 2013 Page 16 of 21
Banking 17 October 2011
Page 1 of 2
Household NPL ratio (Apr 2006 – May 2013)
Source: Bank Negara
Looking at the breakdown of NPL ratios by segment, it would be the
case that NPL ratios, while still low, are higher for the residential
property and personal loans segments.
Banking system NPL ratio by segment
2012 Mar 2013
Purchase of residential properties 1.9 1.8
Purchase of transport vehicles 1.1 1.1
Personal use 1.8 1.8
Non-residential properties 0.8 0.7
Purchase of securities 0.2 0.2
Credit card 1.3 1.3
Total 1.5 1.4
Source: Bank Negara
Deposits and EPF contributions are equivalent to 108% of
household debt. The two main forms of savings for the average
person are bank deposits and contributions to the EPF. Based on our
estimates, individual deposits in the banking system, Bank Rakyat and
MBSB totalled MYR519b as at end-Dec 2012, equal to 69% of
household debt. EPF contributions totalled MYR296b at end-Oct 2012,
equivalent to a further 39% of total HH debt. Cumulatively, deposits and
EPF contributions correspond to 108% of HH debt, which is a
comfortable position, in our view.
Deposits & EPF contribution as % of HH debt
133%125%
116%112%
108%
80%75%
70% 70% 69%
53% 50%46% 42% 39%
0%
20%
40%
60%
80%
100%
120%
140%
2008 2009 2010 2011 2012
Deposits & EPF as % of HH debt Deposits as % of HH debt EPF contr as % of HH debt
Source: Bank Negara, Maybank KE

12 July 2013 Page 17 of 21
Banking 17 October 2011
Page 1 of 2
Seeking alternative investments. Should we be worried about the
downtrend in the chart in the preceding page, whereby the deposits/
EPF cover, which was 133% in 2008, has since fallen to 108%? While
this is partly due to the rise in HH debt, a factor to bear in mind is that
investors have been seeking alternative investments in the current low
interest rate environment and have thus diverted funds into the property
sector and stock market, for instance.
The data below paint a better picture, for according to statistics from
Bank Negara, financial asset coverage is very comfortable, with a liquid
financial assets to HH debt ratio of 145% and a total HH financial
assets to HH debt coverage of 221% at end-Mar 2013, taking into
account real assets such as property and land.
HH financial assets to HH debt ratios
142153 152 145 144 145
230240 235
224 221 221
0
50
100
150
200
250
300
2008 2009 2010 2011 2012 Mar 2013
(%)
HH liquid fin assets to HH debt ratio HH financial assets to HH debt ratio
Source: Bank Negara
Comfortable debt service ratio. The debt service ratio for households
averaged 43.9% as at end-Dec 2012, which is comfortable, in our view.
HH financial assets to HH debt ratios
39.7
43.1
44.1
45.2
43.9
36
38
40
42
44
46
2008 2009 2010 2011 2012
(%)
Debt repayment ratio
Source: Bank Negara

12 July 2013 Page 18 of 21
Banking 17 October 2011
Page 1 of 2
RESEARCH OFFICES REGIONAL
P K BASU Regional Head, Research & Economics
(65) 6432 1821 [email protected]
WONG Chew Hann, CA Acting Regional Head of Institutional Research (603) 2297 8686 [email protected]
ONG Seng Yeow Regional Products & Planning
(65) 6432 1453 [email protected]
ECONOMICS Suhaimi ILIAS Chief Economist
Singapore | Malaysia (603) 2297 8682 [email protected]
Luz LORENZO Philippines (63) 2 849 8836 [email protected]
Tim LEELAHAPHAN
Thailand (662) 658 1420 [email protected]
JUNIMAN Chief Economist, BII
Indonesia (62) 21 29228888 ext 29682 [email protected]
Josua PARDEDE Economist / Industry Analyst, BII
Indonesia (62) 21 29228888 ext 29695 [email protected]
MALAYSIA WONG Chew Hann, CA Head of Research
(603) 2297 8686 [email protected] Strategy Construction & Infrastructure
Desmond CH’NG, ACA (603) 2297 8680 [email protected] Banking - Regional
LIAW Thong Jung (603) 2297 8688 [email protected]
Oil & Gas Automotive Shipping
ONG Chee Ting, CA (603) 2297 8678 [email protected] Plantations- Regional
Mohshin AZIZ (603) 2297 8692 [email protected] Aviation
Petrochem YIN Shao Yang, CPA (603) 2297 8916 [email protected] Gaming – Regional
Media
TAN CHI WEI, CFA (603) 2297 8690 [email protected] Power
Telcos WONG Wei Sum, CFA (603) 2297 8679 [email protected]
Property & REITs LEE Yen Ling (603) 2297 8691 [email protected]
Building Materials Manufacturing Technology
LEE Cheng Hooi Head of Retail
[email protected] Technicals
HONG KONG / CHINA Ivan CHEUNG, CFA
(852) 2268 0634 [email protected] HK Property Industrial
Jacqueline KO, CFA (852) 2268 0633 [email protected] Consumer
Andy POON (852) 2268 0645 [email protected]
Telecom & equipment Alex YEUNG (852) 2268 0636 [email protected]
Industrial Karen KWAN (852) 2268 0640 [email protected]
China Property Jeremy TAN (852) 2268 0635 [email protected]
Gaming Warren LAU (852) 2268 0644 [email protected] Technology – Regional
INDIA Jigar SHAH Head of Research
(91) 22 6623 2601 [email protected]
Oil & Gas Automobile Cement
Anubhav GUPTA (91) 22 6623 2605 [email protected] Metal & Mining
Capital goods Property
Urmil SHAH (91) 22 6623 2606 [email protected] Technology
Media Varun VARMA (91) 226623 2611 [email protected]
Banking
SINGAPORE Gregory YAP Head of Research
(65) 6432 1450 [email protected] Technology & Manufacturing Telcos - Regional
Wilson LIEW (65) 6432 1454 [email protected]
Property & REITs James KOH (65) 6432 1431 [email protected]
Logistics Resources Consumer
Small & Mid Caps YEAK Chee Keong, CFA (65) 6432 1460 [email protected]
Offshore & Marine Alison FOK (65) 6432 1447 [email protected]
Services S-chips ONG Kian Lin
(65) 6432 1470 [email protected] REITs / Property
Wei Bin (65) 6432 1455 [email protected] S-chips
Small & Mid Caps
INDONESIA Lucky ARIESANDI, CFA (62) 21 2557 1127 [email protected]
Base metals Mining Oil & Gas
Wholesale Rahmi MARINA (62) 21 2557 1128 [email protected]
Banking Multifinance Pandu ANUGRAH
(62) 21 2557 1137 [email protected] Automotive Heavy equipment
Plantation Toll road Adi N. WICAKSONO
(62) 21 2557 1128 [email protected] Generalist
Anthony YUNUS (62) 21 2557 1139 [email protected] Cement
Infrastructure Property
PHILIPPINES Luz LORENZO Head of Research
(63) 2 849 8836 [email protected]
Strategy Laura DY-LIACCO
(63) 2 849 8840 [email protected] Utilities Conglomerates
Telcos Lovell SARREAL (63) 2 849 8841 [email protected]
Consumer Media Cement
Luz LORENZO / Mark RACE (63) 2 849 8844 [email protected] Conglomerates
Property Ports/ Logistics Gaming
Katherine TAN (63) 2 849 8843 [email protected]
Banks Construction Ramon ADVIENTO
(63) 2 849 8845 [email protected] Mining
THAILAND Sukit UDOMSIRIKUL Head of Research
(66) 2658 6300 ext 5090
Maria LAPIZ Head of Institutional Research
Dir (66) 2257 0250 | (66) 2658 6300 ext 1399 [email protected]
Consumer/ Big Caps
Andrew STOTZ Strategist
(66) 2658 6300 ext 5091 [email protected]
Mayuree CHOWVIKRAN (66) 2658 6300 ext 1440 [email protected] Strategy
Padon Vannarat (66) 2658 6300 ext 1450 [email protected] Strategy
Surachai PRAMUALCHAROENKIT (66) 2658 6300 ext 1470 [email protected] Auto
Conmat Contractor Steel
Suttatip PEERASUB (66) 2658 6300 ext 1430 [email protected] Media
Commerce Sutthichai KUMWORACHAI (66) 2658 6300 ext 1400 [email protected]
Energy Petrochem
Termporn TANTIVIVAT (66) 2658 6300 ext 1520 [email protected] Property
Woraphon WIROONSRI (66) 2658 6300 ext 1560 [email protected] Banking & Finance
Jaroonpan WATTANAWONG (66) 2658 6300 ext 1404 [email protected] Transportation
Small cap. Chatchai JINDARAT (66) 2658 6300 ext 1401 [email protected]
Electronics Pongrat RATANATAVANANANDA (66) 2658 6300 ext 1398 [email protected]
Services/ Small Caps
VIETNAM Michael KOKALARI, CFA Head of Research
(84) 838 38 66 47 [email protected] Strategy
Nguyen Thi Ngan Tuyen (84) 844 55 58 88 x 8081 [email protected] Food and Beverage
Oil and Gas Ngo Bich Van (84) 844 55 58 88 x 8084 [email protected]
Banking Trinh Thi Ngoc Diep
(84) 844 55 58 88 x 8242 [email protected] Technology Utilities
Construction Dang Thi Kim Thoa (84) 844 55 58 88 x 8083 [email protected]
Consumer Nguyen Trung Hoa +84 844 55 58 88 x 8088 [email protected]
Steel Sugar Resources

12 July 2013 Page 19 of 21
Banking 17 October 2011
Page 1 of 2
APPENDIX I: TERMS FOR PROVISION OF REPORT, DISCLAIMERS AND DISCLOSURES
DISCLAIMERS
This research report is prepared for general circulation and for information purposes only and under no circumstances should it be considered or intended as an offer to sell or a solicitation of an offer to buy the securities referred to herein. Investors should note that values of such securities, if any, may fluctuate and that each security’s price or value may rise or fall. Opinions or recommendations contained herein are in form of technical ratings and fundamental ratings. Technical ratings may differ from fundamental ratings as technical valuations apply different methodologies and are purely based on price and volume-related information extracted from the relevant jurisdiction’s stock exchange in the equity analysis. Accordingly, investors’ returns may be less than the original sum invested. Past performance is not necessarily a guide to future performance. This report is not intended to provide personal investment advice and does not take into account the specific investment objectives, the financial situation and the particular needs of persons who may receive or read this report. Investors should therefore seek financial, legal and other advice regarding the appropriateness of investing in any securities or the investment strategies discussed or recommended in this report.
The information contained herein has been obtained from sources believed to be reliable but such sources have not been independently verified by Maybank Investment Bank Berhad, its subsidiary and affiliates (collectively, “MKE”) and consequently no representation is made as to the accuracy or completeness of this report by MKE and it should not be relied upon as such. Accordingly, MKE and its officers, directors, associates, connec ted parties and/or employees (collectively, “Representatives”) shall not be liable for any direct, indirect or consequential losses or damages that may arise from the use or reliance of this report. Any information, opinions or recommendations contained herein are subject to change at any time, without prior notice.
This report may contain forward looking statements which are often but not always identified by the use of words such as “ant icipate”, “believe”, “estimate”, “intend”, “plan”, “expect”, “forecast”, “predict” and “project” and statements that an event or result “may”, “will”, “can”, “should”, “could” or “might” occur or be achieved and other similar expressions. Such forward looking statements are based on assumptions made and information current ly available to us and are subject to certain risks and uncertainties that could cause the actual results to differ materially from those expressed in any forward looking statements. Readers are cautioned not to place undue relevance on these forward-looking statements. MKE expressly disclaims any obligation to update or revise any such forward looking statements to reflect new information, events or circumstances after the date of this publication or to reflect the occurrence of unanticipated events.
MKE and its officers, directors and employees, including persons involved in the preparation or issuance of this report, may, to the extent permitted by law, from time to time participate or invest in financing transactions with the issuer(s) of the securities mentioned in this report, perform services for or solicit business from such issuers, and/or have a position or holding, or other material interest, or effect transactions, in such securities or options thereon, or other investments related thereto. In addition, it may make markets in the securities mentioned in the material presented in this report. MKE may, to the extent permitted by law, act upon or use the information presented herein, or the research or analysis on which they are based, before the material is published. One or more directors, officers and/or employees of MKE may be a director of the issuers of the securities mentioned in this report.
This report is prepared for the use of MKE’s clients and may not be reproduced, altered in any way, transmitted to, copied or distributed to any other party in whole or in part in any form or manner without the prior express written consent of MKE and MKE and its Representatives accepts no liability whatsoever for the actions of third parties in this respect.
This report is not directed to or intended for distribution to or use by any person or entity who is a citizen or resident of or located in any locality, state, country or other jurisdiction where such distribution, publication, availability or use would be contrary to law or regulation. This report is for distribution only under such circumstances as may be permitted by applicable law. The securities described herein may not be eligible for sale in all juri sdictions or to certain categories of investors. Without prejudice to the foregoing, the reader is to note that additional disclaimers, warnings or qualifications may apply based on geographical location of the person or entity receiving this report.
Malaysia
Opinions or recommendations contained herein are in the form of technical ratings and fundamental ratings. Technical ratings may differ from fundamental ratings as technical valuations apply different methodologies and are purely based on price and volume-related information extracted from Bursa Malaysia Securities Berhad in the equity analysis.
Singapore
This report has been produced as of the date hereof and the information herein may be subject to change. Maybank Kim Eng Research Pte. Ltd. (“Maybank KERPL”) in Singapore has no obligation to update such information for any recipient. For distribution in Singapore, recipients of this report are to contact Maybank KERPL in Singapore in respect of any matters arising from, or in connection with, this report. If the recipient of th is report is not an accredited investor, expert investor or institutional investor (as defined under Section 4A of the Singapore Securities and Futures Act), Maybank KERPL shall be legal ly liable for the contents of this report, with such liability being limited to the extent (if any) as permitted by law.
Thailand
The disclosure of the survey result of the Thai Institute of Directors Association (“IOD”) regarding corporate governance is made pursuant to the policy of the Office of the Securities and Exchange Commission. The survey of the IOD is based on the information of a company listed on the Stock Exchange of Thailand and the market for Alternative Investment disclosed to the public and able to be accessed by a general public investor. The result, therefore, is from the perspective of a third party. It is not an evaluation of operation and is not based on inside information.The survey result is as of the date appearing in the Corporate Governance Report of Thai Listed Companies. As a result, the survey may be changed after that date. Maybank Kim Eng Securities (Thailand) Public Company Limited (“MBKET”) does not confirm nor certify the accuracy of such survey result.
Except as specifically permitted, no part of this presentation may be reproduced or distributed in any manner without the pri or written permission of MBKET. MBKET accepts no liability whatsoever for the actions of third parties in this respect.
US
This research report prepared by MKE is distributed in the United States (“US”) to Major US Institutional Investors (as defined in Rule 15a-6 under the Securities Exchange Act of 1934, as amended) only by Maybank Kim Eng Securities USA Inc (“Maybank KESUSA”), a broker -dealer registered in the US (registered under Section 15 of the Securities Exchange Act of 1934, as amended). All responsibility for the distribution of this report by Maybank KESUSA in the US shall be borne by Maybank KESUSA. All resulting transactions by a US person or entity should be effected through a registered broker-dealer in the US. This report is not directed at you if MKE is prohibited or restricted by any legislation or regulation in any jurisdiction from making it available to you. You should satisfy yourself before reading it that Maybank KESUSA is permitted to provide research material concerning investment s to you under relevant legislation and regulations.
UK
This document is being distributed by Maybank Kim Eng Securities (London) Ltd (“Maybank KESL”) which is authorized and regulated, by the Financial Services Authority and is for Informational Purposes only. This document is not intended for distribution to anyone defined as a Retail Client under the Financial Services and Markets Act 2000 within the UK. Any inclusion of a third party link is for the recipients convenience only, and that the firm does not take any responsibility for its comments or accuracy, and that access to such links is at the individuals own risk. Nothing in this report should be considered as constituting legal, accounting or tax advice, and that for accurate guidance recipients should consult with their own independent tax advisers.

12 July 2013 Page 20 of 21
Banking 17 October 2011
Page 1 of 2
DISCLOSURES
Legal Entities Disclosures
Malaysia: This report is issued and distributed in Malaysia by Maybank Investment Bank Berhad (15938-H) which is a Participating Organization of Bursa Malaysia Berhad and a holder of Capital Markets and Services License issued by the Securities Commission in Malaysia. Singapore: This material is issued and distributed in Singapore by Maybank KERPL (Co. Reg No 197201256N) which is regulated by the Monetary Authority of Singapore. Indonesia: PT Kim Eng Securities (“PTKES”) (Reg. No. KEP-251/PM/1992) is a member of the Indonesia Stock Exchange and is regulated by the BAPEPAM LK. Thailand: MBKET (Reg. No.0107545000314) is a member of the Stock Exchange of Thailand and is regulated by the Ministry of Finance and the Securities and Exchange Commission. Philippines: Maybank ATRKES (Reg. No.01-2004-00019) is a member of the Philippines Stock Exchange and is regulated by the Securities and Exchange Commission. Vietnam: Maybank Kim Eng Securities JSC (License Number: 71/UBCK-GP) is licensed under the State Securities Commission of Vietnam.Hong Kong: KESHK (Central Entity No AAD284) is regulated by the Securities and Futures Commission. India: Kim Eng Securities India Private Limited (“KESI”) is a participant of the National Stock Exchange of India Limited (Reg No: INF/INB 231452435) and the Bombay Stock Exchange (Reg. No. INF/INB 011452431) and is regulated by Securities and Exchange Board of India. KESI is also registered with SEBI as Category 1 Merchant Banker (Reg. No. INM 000011708) US: Maybank KESUSA is a member of/ and is authorized and regulated by the FINRA – Broker ID 27861. UK: Maybank KESL (Reg No 2377538) is authorized and regulated by the Financial Services Authority.
Disclosure of Interest
Malaysia: MKE and its Representatives may from time to time have positions or be materially interested in the securities referred to herein and may further act as market maker or may have assumed an underwriting commitment or deal with such securities and may also perform or seek to perform investment banking services, advisory and other services for or relating to those companies.
Singapore: As of 12 July 2013, Maybank KERPL and the covering analyst do not have any interest in any companies recommended in this research report.
Thailand: MBKET may have a business relationship with or may possibly be an issuer of derivative warrants on the securities /companies mentioned in the research report. Therefore, Investors should exercise their own judgment before making any investment decisions. MBKET, its associates, directors, connected parties and/or employees may from time to time have interests and/or underwriting commitments in the securities mentioned in this report.
Hong Kong: KESHK may have financial interests in relation to an issuer or a new listing applicant referred to as defined by the requirements under Paragraph 16.5(a) of the Hong Kong Code of Conduct for Persons Licensed by or Registered with the Securit ies and Futures Commission.
As of 12 July 2013, KESHK and the authoring analyst do not have any interest in any companies recommended in this research report.
MKE may have, within the last three years, served as manager or co-manager of a public offering of securities for, or currently may make a primary market in issues of, any or all of the entities mentioned in this report or may be providing, or have provided within the previous 12 months, significant advice or investment services in relation to the investment concerned or a related investment and may receive compensation for the services provided from the companies covered in this report.
OTHERS
Analyst Certification of Independence
The views expressed in this research report accurately reflect the analyst’s personal views about any and all of the subject securities or issuers; and no part of the research analyst’s compensation was, is or will be, directly or indirectly, related to the specific recommendations or views expressed in the report.
Reminder
Structured securities are complex instruments, typically involve a high degree of risk and are intended for sale only to sophisticated investors who are capable of understanding and assuming the risks involved. The market value of any structured security may be affected by changes in economic, financial and political factors (including, but not limited to, spot and forward interest and exchange rates), time to maturity, market conditions and volatility and the credit quality of any issuer or reference issuer. Any investor interested in purchasing a structured product should conduct its own analysis of the product and consult with its own professional advisers as to the risks involved in making such a purchase.
No part of this material may be copied, photocopied or duplicated in any form by any means or redistributed without the prior consent of MKE.
Definition of Ratings
Maybank Kim Eng Research uses the following rating system:
BUY Return is expected to be above 10% in the next 12 months (excluding dividends)
HOLD Return is expected to be between - 10% to +10% in the next 12 months (excluding dividends)
SELL Return is expected to be below -10% in the next 12 months (excluding dividends)
Applicability of Ratings
The respective analyst maintains a coverage universe of stocks, the list of which may be adjusted according to needs. Investm ent ratings are only
applicable to the stocks which form part of the coverage universe. Reports on companies which are not part of the coverage do not carry investment ratings
as we do not actively follow developments in these companies.
Some common terms abbreviated in this report (where they appear):
Adex = Advertising Expenditure FCF = Free Cashflow PE = Price Earnings
BV = Book Value FV = Fair Value PEG = PE Ratio To Growth
CAGR = Compounded Annual Growth Rate FY = Financial Year PER = PE Ratio
Capex = Capital Expenditure FYE = Financial Year End QoQ = Quarter-On-Quarter
CY = Calendar Year MoM = Month-On-Month ROA = Return On Asset
DCF = Discounted Cashflow NAV = Net Asset Value ROE = Return On Equity
DPS = Dividend Per Share
NTA = Net Tangible Asset ROSF = Return On Shareholders’ Funds
EBIT = Earnings Before Interest And Tax P = Price WACC = Weighted Average Cost Of Capital
EBITDA = EBIT, Depreciation And Amortisation P.A. = Per Annum YoY = Year-On-Year
EPS = Earnings Per Share PAT = Profit After Tax YTD = Year-To-Date
EV = Enterprise Value PBT = Profit Before Tax

12 July 2013 Page 21 of 21
Banking 17 October 2011
Page 1 of 2
Malaysia
Maybank Investment Bank Berhad (A Participating Organisation of Bursa Malaysia Securities Berhad) 33rd Floor, Menara Maybank,
100 Jalan Tun Perak, 50050 Kuala Lumpur Tel: (603) 2059 1888; Fax: (603) 2078 4194
Singapore
Maybank Kim Eng Securities Pte Ltd Maybank Kim Eng Research Pte Ltd 9 Temasek Boulevard #39-00 Suntec Tower 2
Singapore 038989 Tel: (65) 6336 9090 Fax: (65) 6339 6003
London
Maybank Kim Eng Securities (London) Ltd 6/F, 20 St. Dunstan’s Hill London EC3R 8HY, UK
Tel: (44) 20 7621 9298 Dealers’ Tel: (44) 20 7626 2828 Fax: (44) 20 7283 6674
New York
Maybank Kim Eng Securities USA Inc 777 Third Avenue, 21st Floor New York, NY 10017, U.S.A.
Tel: (212) 688 8886 Fax: (212) 688 3500
Stockbroking Business: Level 8, Tower C, Dataran Maybank,
No.1, Jalan Maarof 59000 Kuala Lumpur Tel: (603) 2297 8888 Fax: (603) 2282 5136
Hong Kong
Kim Eng Securities (HK) Ltd
Level 30, Three Pacific Place, 1 Queen’s Road East, Hong Kong
Tel: (852) 2268 0800 Fax: (852) 2877 0104
Indonesia
PT Kim Eng Securities
Plaza Bapindo Citibank Tower 17th Floor Jl Jend. Sudirman Kav. 54-55 Jakarta 12190, Indonesia
Tel: (62) 21 2557 1188 Fax: (62) 21 2557 1189
India
Kim Eng Securities India Pvt Ltd
2nd Floor, The International 16, Maharishi Karve Road, Churchgate Station, Mumbai City - 400 020, India
Tel: (91).22.6623.2600 Fax: (91).22.6623.2604
Philippines
Maybank ATR Kim Eng Securities Inc. 17/F, Tower One & Exchange Plaza
Ayala Triangle, Ayala Avenue Makati City, Philippines 1200 Tel: (63) 2 849 8888
Fax: (63) 2 848 5738
Thailand
Maybank Kim Eng Securities (Thailand) Public Company Limited
999/9 The Offices at Central World, 20th - 21st Floor, Rama 1 Road Pathumwan, Bangkok 10330, Thailand
Tel: (66) 2 658 6817 (sales) Tel: (66) 2 658 6801 (research)
Vietnam
In association with
Maybank Kim Eng Securities JSC 1st Floor, 255 Tran Hung Dao St. District 1 Ho Chi Minh City, Vietnam
Tel : (84) 844 555 888 Fax : (84) 838 38 66 39
Saudi Arabia
In association with
Anfaal Capital Villa 47, Tujjar Jeddah Prince Mohammed bin Abdulaziz Street P.O. Box 126575
Jeddah 21352 Tel: (966) 2 6068686 Fax: (966) 26068787
South Asia Sales Trading
Kevin FOY [email protected]
Tel: (65) 6336-5157 US Toll Free: 1-866-406-7447
North Asia Sales Trading
Eddie LAU [email protected]
Tel: (852) 2268 0800 US Toll Free: 1 866 598 2267
www.maybank-ke.com | www.maybank-keresearch.com