Embed Size (px)
Citation preview
0
120
100
80
60
40
20
0
10%
20%
30%
40%
50%
60%
70%
80%
90%
100%
Public Sector Trends 2011
1
State of the Public Service Series
November 2011
Research Paper Nº6
Richard Boyle
Public SectorTrends 2011
Public Sector Trends 2011
3
Foreword 5
Main findings 6
1. Introduction 9
2. The size and cost of the public sector 11
3. The quality of public administration 24
4. Public service efficiency and performance 35
5. Trust and confidence in public administration 46
6. Conclusion 49
Appendix 1 · Indicators used to make up the Public Administration Quality indicator 51
Dr. Richard Boyle is Head of Research, Publishing and Corporate Relations with the Institute
of Public Administration. He has written extensively on public service reform and on the
evaluation of public services.
Deirdre Mooney, Administrative Assistant at the Institute of Public Administration, provided
much of the administrative support and back up in the production of many of the charts
used in the report.
Contents
Public Sector Trends 2011
5
In the State of the Public Service research series, we seek to provide evidence-informed research and commentary
on key aspects of contemporary Irish public administration. The authors of these reports bring their considerable
expertise and practical knowledge to the topics selected so as to provide evidence, insights and recommendations to
support future development. Our aim is that these reports will not only inform, but also challenge current thinking
about how the Irish public service performs. It is intended that these short research reports will be of relevance and
use not only to public servants, but also to policy makers and the wider public.
This report examines trends in public sector development. It builds on the first Public Sector Trends report produced
by the Institute last year. The debate on Ireland’s public sector and public administration, and its role in Irish society,
is one that generates much passion. But there is often a dearth of evidence brought to bear on the debate. On the
one side are those who feel we have a ‘bloated’ public sector and who emphasise the need to cut back and ‘rein
in’ public services. On the other side are those who extol the virtues of the services provided to the public and the
benefits that many people receive from public services on a day-to-day basis.
Here we try to bring some evidence to bear on the important debate on the future shape of the public sector.
Using data gathered from a number of sources, information on the size and cost of the public sector, the quality of
public administration, efficiency and performance, and levels of trust and confidence is presented in a simple but
rigorous manner.
Foreword
Brian CawleyDirector General Institute of Public Administration
Public Sector Trends 2011
6
In terms of overall performance, the data presented in this
paper would tend to suggest that the quality of Ireland’s
public administration remains close to the average for the
European Union. It can be argued that this is a reasonably
creditable and credible position for a small state such as
Ireland, especially as the economic downturn since 2008
has impacted significantly on the figures displayed here
and sets the context for the interpretation of the data
presented.
The size and cost of the public sector
• Ireland’s government expenditure as a percentage of GDP
used to be low compared to most European countries,
but increased to around average for the EU27 countries
in 2009. In 2010 expenditure as a percentage of GDP
rose to one of the highest in Europe, due in large part
to the government’s support for the banks affecting the
figures in that year.
• Public expenditure per head of population is growing
significantly faster than the EU average.
• There has been a significant drop in the numbers
employed in both the public sector and public service
from 2008, with a drop of just under 6 per cent in
each case. Numbers employed in the public sector and
public service in 2011 are back just below 2006 levels
of employment.
• Two out of every three people employed in the public
service work in either health or education. In 2011,
there were approximately 105,000 people employed in
the health sector and 93,000 people employed in the
education sector.
• An OECD (2011) study showed that in 2008 in Ireland
employment in general government as a percentage of
the labour force (14.8 per cent) was around the OECD
average. By contrast, in Denmark employment in general
government was 28.7 per cent of the labour force.
• Another OECD (2010) study comparing 8 countries
(Denmark, Sweden, Finland, the UK, Canada, Ireland,
the Netherlands and New Zealand) showed that Ireland
had the third lowest general government employment
per 000 population (67) in 2006, and significantly behind
Denmark (137), Sweden (125) and Finland (99).
• The Exchequer pay and pensions bill more than doubled
from €8.632bn in 2000 to €18.753bn in 2008. But
from 2008 to 2011, as the cutbacks in numbers and
pay introduced by the government have taken effect,
the Exchequer pay and pensions bill has decreased in
all sectors. It was €17.127bn in 2011.
• The health and education sectors account for the vast
majority of the Exchequer pay bill. In 2011, the health
pay bill (€6.216bn) was 42.2 per cent of the total and
the education pay bill (€4.902bn) accounted for 33.3 per
cent of the total. The health sector share has declined
in the last couple of years.
• The compensation of top and middle managers in central
government is towards the higher end of European
norms, based on OECD data from 2009. By contrast,
the compensation of administrative staff (secretaries) is
towards the lower end of European norms.
• On average, top managers compensation in the UK and
Ireland in 2009 was 7.7 times that of administrative
staff (secretaries) whereas for the Nordic countries top
managers compensation was 3.5 times that of secretaries.
Similarly middle managers compensation was 4.2 times
that of secretaries in the UK and Ireland whereas it was
2.2 times greater in the Nordic countries. The Nordic
countries have a much flatter compensation structure
(particularly Finland and Sweden), whereas the UK and
Ireland have opted for higher compensation at the higher
levels.
The quality of public administration
• Surveys of business executives show that the quality of
Ireland’s public administration is seen as slightly above
the European average. The upholding of traditional
public service values such as independence from political
interference, freedom from bribery and corruption,
and reliability and administrative fairness is seen to be
around the EU15 average. Ireland’s public administration
is seen as relatively good in encouraging competition
Main Findings
Public Sector Trends 2011
7
and providing a supportive regulatory environment.
• The World Bank produces an annual composite indicator
of government effectiveness. Ireland’s government
effectiveness score was slightly above the EU15 average
from 2005 to 2008, but was declining over that time
period, and in 2009 fell below the EU15 average. Against
the World Bank regulatory quality indicator, however,
Ireland’s score remained well above the European average
in 2009.
• An index of management capacity developed by the
Bertelsmann Stiftung (foundation) suggests that the
management capacity of the Irish government is slightly
below the EU15 average.
• The Bertelsmann Stiftung indicators suggest that Ireland is
doing reasonably well in relation to the communication and
coordination of policy and strategy. Policy implementation,
however, is identified as a particularly challenge, with
coordination and control of line ministries and monitoring
of agencies identified as particular weaknesses. With
regard to accountability, parliamentary oversight is also
seen as relatively weak, despite a strengthening of the
role of parliamentary committees.
Public service efficiency and performance
• Surveys of business executives show that Ireland is seen
as relatively un-bureaucratic when it comes to dealing
with businesses. But the same surveys show that there is a
growing perception that the composition of government
spending is wasteful. And that the implementation of
government decisions is seen to be worsening relative
to other European countries.
• Overall, Ireland continues to do relatively well amongst
EU countries against World Bank indicators that assess
the impact of public administration on the ability of
companies to do business. The efficiency of the tax
regime comes out particularly strongly.
• In terms of high-level sectoral outcomes, Ireland’s scores
have worsened between 2006 and 2009 in terms
of educational attainment, particularly in maths. But
the competitive advantage of our education system
is perceived to have improved in 2011. In health, life
expectancy and infant mortality are around the European
average. Similarly against a ‘basket’ of outcomes assessed
by the Euro Health Consumer Index Ireland appears
around the EU15 average.
Trust and confidence in public administration
• Trust in government hit an all time low in 2010 of 10
per cent, the lowest trust rating in all of the EU27.
However, trust levels had recovered to 42 per cent by
spring 2011, above the EU27 average and close to the
EU15 average.
• Trust in parliament displays a similar pattern to trust in
government, dropping to an all time low of 12 per cent
in 2010 and recovering to 39 per cent in 2011, above
the EU27 average but still some way below the EU15
average. The Nordic countries of Sweden, Denmark
and Finland display the highest levels of trust in their
national parliaments.
Conclusions
• The growth in public spending is an issue that needs
particular attention. While there are particular factors
associated with support for the banks that affect the 2010
figures, the need for action is clear. The government’s
comprehensive review of expenditure will have an
important role in setting out sustainable levels of public
spending for the coming years.
• However, numbers employed in the public sector, as a
percentage of total employment, are not excessive by
European standards. As numbers are reduced further
to meet fiscal and economic targets, there is a need to
closely examine and plan for the impact on retaining vital
skills, knowledge and capacity in the public service.
• The Exchequer pay and pensions bill has reduced from
its high in 2008. This fiscal discipline will need to be
maintained. Compensation of public servants is an
important element in overall expenditure decisions.
Public Sector Trends 2011
8
It is interesting to note that compensation rates vary
significantly from top levels to bottom levels in central
government, with a much bigger gap than the Nordic
countries.
• Perceptions of the quality of Irish public administration
suggest particular strengths and limitations compared
to our European partners. Strengths include services to
business, and the provision overall of sound policies and
regulations. Weaknesses include strategic consultation with
interest groups (with the collapse of social partnership),
policy implementation and political oversight. Denmark
and Sweden are particularly strong in these areas.
• Trust in government and parliament has recovered
after falling to an all time low. The active engagement
of citizens in the design, delivery and monitoring of
services can further build trust in government and public
services.
Early in 2011 the Institute of Public Administration produced
a major research paper on public service reform entitled Fit for
Purpose? (Boyle and MacCarthaigh, 2011) which identified
a number of key challenges and possible solutions for the
public service. The information provided in this trends report
supports the main findings of Fit for Purpose? In particular,
the need for initiatives to focus on productivity improvements,
capacity development amongst public servants, and for a
renewed focus on policy implementation, all issues raised
in Fit for Purpose?, are highlighted as challenges for the
public service reform programme.
Public Sector Trends 2011
9
• The size and cost of the public sector.
While size and cost alone are not the sole or even
main determinants of good public administration,
nevertheless in terms of value for money in the delivery
of public services, keeping check on the size and cost
of the public sector and public service is an important
consideration.
• The quality of public administration.
Public administration includes policy making, policy
legislation and management of the public sector. Such
dimensions of public administration can only be measured
by subjective indicators of quality which give a sense of
how good the public administration is.
• Public service efficiency and performance.
There is an onus on public administration, all the more
so in times of financial stringency, to show that services
are being provided efficiently and that performance
is of the highest standard. The delivery of social and
economic outcomes in an efficient manner is central
to an effective public administration.
• Trust and confidence in public administration.
The general public ultimately must have trust and
confidence in the public administration of a country if
it is to be effective.
In this study we examine indicators for each of these four
elements of public administration. Where possible and
appropriate, data is included for other European countries,
to enable comparisons to be made. Also, where data are
available, we have provided trend data going back over
the last decade. The intention is to provide a snapshot of
trends in public administration performance in Ireland, to
highlight where we are doing well and what challenges are
presented and where improvements need to be made.
In its style and content, the report draws on a number of
efforts to benchmark and compare public sector efficiency
and performance. These include a European Central Bank
(ECB) international comparison of public sector efficiency1,
a study by the Netherlands Social and Cultural Planning
Office (SCP) of comparative public sector performance2,
the World Bank governance indicators project3, the OECD
Government at a Glance projec4, and an IPA study comparing
public administrations5.
A word of caution about data limitations
The data presented here needs to be interpreted with great
care. First, there is the issue of whether the indicators used
to represent public administration provision and quality really
captures what public service is about. Indicators, by their
nature, only give a partial picture. Second, much of the
international comparative data in this report is qualitative
data derived from opinion surveys. This survey data comprises
small-scale samples of opinion from academics, managers
and experts in the business community. The survey data
is thus limited both in terms of its overall reliability and
the fact that it represents the views of limited sections of
the community. Third, the point scores arrived at on some
indicators (on a scale from 1–10 for the IMD and WEF data
1. Introduction
1 Afonso et al (2003)2 Social and Cultural Planning Office (2004) 3 See http://info.worldbank.org/governance/wgi/index.asp 4 See http://www.oecd.org/gov/indicators/govataglance5 Boyle (2007)
There are no clear or agreed definitions for comparative ranking of public administrations. But most people would agree
that a number of elements need to be included in any assessment:

Public Sector Trends 2011
10
and between –2.5 and +2.5 for the World Bank governance
indicators) should not be interpreted too strictly, as there
are margins of error associated with these estimates.
Fourth, changes over time should be viewed cautiously.
Many of the indicators assessed represent ‘snapshots’ at
one particular point in time. Small shifts in annual ranking
are not particularly meaningful.
In all, when interpreting the findings set out in this paper,
these limitations should be borne in mind. In particular, small
variations in scores should be interpreted cautiously. These
may be no more than random variations to be expected
given the data being used. What is of interest is to identify
broad patterns emerging from the data.
Public Sector Trends 2011
11
There are a range of indicators that show the size and cost of the public sector and
public service6. Government expenditure as a share of GDP/GNI7, level of public
expenditure per head of population and public sector employment trends all give a
sense of size. The cost of the public sector is shown by data on the Exchequer pay
and pensions bill. Data on the compensation of central government employees is
provided by the OECD.
2. The size and cost of the public sector
6 In this study, the public service is defined as the public sector minus the commercial state-sponsored bodies.7 Gross National Income (GNI) is equal to Gross National Product (GNP) plus EU subsidies less EU taxes. The relationship between GDP and GNI in Ireland is unusual among EU countries, with Luxembourg the only other country where the difference between the two measures is more than 10% of GDP. The gap reflects the magnitude of repatriated profits from Ireland that inflates the GDP figure.
Public Sector Trends 2011
12
• A commonly used indicator of public spending in the
economy is expenditure as a percentage of GDP (gross
domestic product). Historically, using this indicator,
Ireland is shown as having a very small share of public
spending compared to most EU countries.
• However, from 2008, as GDP shrank as a result of the
recession in Ireland, Ireland’s government expenditure as
a percentage of GDP has increased rapidly. Government
expenditure reached 67 per cent of GDP in Ireland in
2010, whereas it was among the countries with the
lowest levels until 2008. The particularly large jump
from 2009 to 2010 is largely explained by the impact
on government expenditure of specific government
support to banks during the financial crisis, in the form
of capital injections.
• An alternative indicator to assess the comparative size
of Ireland’s public spending is to use GNI (gross national
income) rather than GDP, as GNI does not include
repatriated profits from Ireland which inflate the GDP
figure8. Using this GNI indicator, the size of the public
sector was still below the EU average up to 2007, but
has been above the EU average since then. In 2010,
government expenditure as a percentage of GNI was
at 80 per cent, making Ireland highest in the EU on this
indicator.
Government expenditure as a share of the economy in Ireland has grown rapidly in recent years both absolutely and when compared to the rest of Europe
30
40
50
60
70
80
2000 2001 2002 2003 2004 2005 2006 2007 2008 2009 2010
Perc
enta
ge
Figure 1 General government expenditure as share of GDP/GNI
Ireland GDP Ireland GNI EU15 EU27
Source: CSO; Eurostat
Figure 1 General government expenditure as share of GDP/GNI
8 See for example Foley (2009), pp.75-76.
Public Sector Trends 2011
13
• An alternative way of looking at the relative size of
public spending is to examine government expenditure
per head of population.
• Up to 2006, Ireland’s public expenditure per person was
below the EU15 average (but above the EU27 average).
The effect of government support for the banks is
clearly visible on the impact on the figures for 2010,
when government expenditure per person in Ireland
was the third highest in Europe, behind Luxembourg
and Denmark.
0
5000
10000
15000
20000
25000
2000 2001 2002 2003 2004 2005 2006 2007 2008 2009 2010
Euro
Figure 2 General government expenditure per head of population
Ireland EU15 EU27
Source: Eurostat
Figure 2 General government expenditure per head of population
Government expenditure per head of population is growing significantly faster than the EU average
Public Sector Trends 2011
14
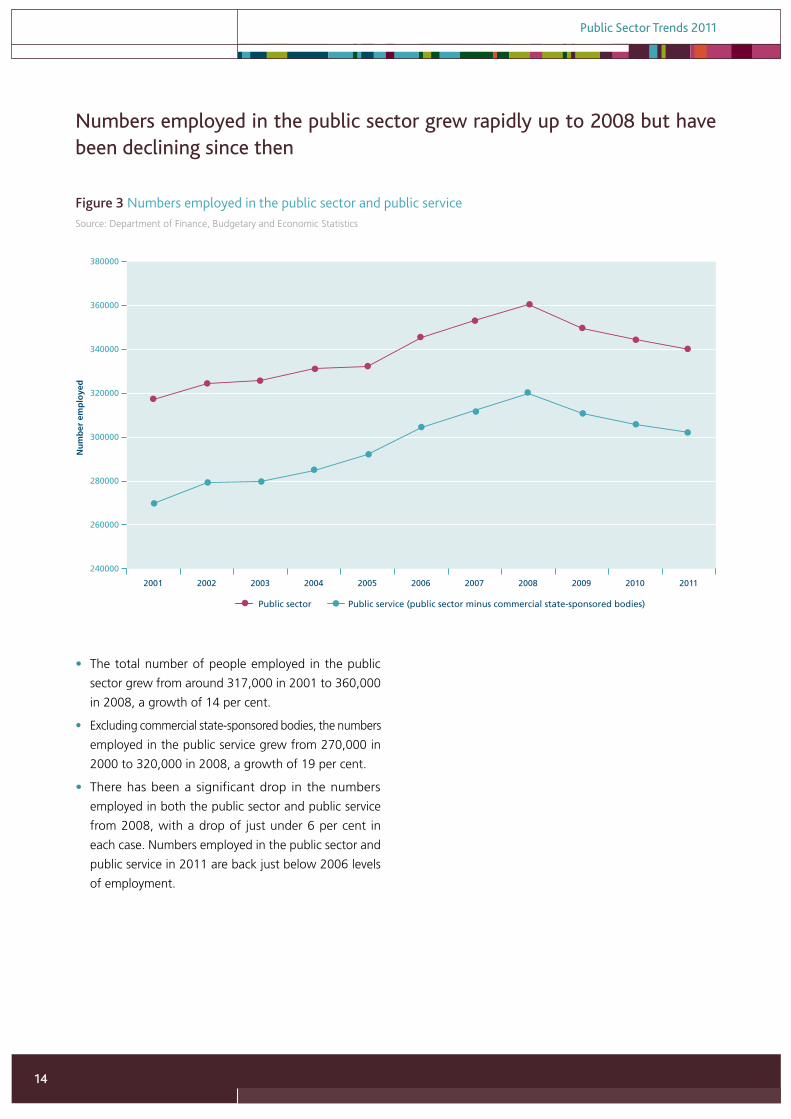
• The total number of people employed in the public
sector grew from around 317,000 in 2001 to 360,000
in 2008, a growth of 14 per cent.
• Excluding commercial state-sponsored bodies, the numbers
employed in the public service grew from 270,000 in
2000 to 320,000 in 2008, a growth of 19 per cent.
• There has been a significant drop in the numbers
employed in both the public sector and public service
from 2008, with a drop of just under 6 per cent in
each case. Numbers employed in the public sector and
public service in 2011 are back just below 2006 levels
of employment.
240000
260000
280000
300000
320000
340000
360000
380000
2001 2002 2003 2004 2005 2006 2007 2008 2009 2010 2011
Nu
mb
er e
mp
loye
d
Figure 3 Numbers employed in the public sector and public service
Public sector Public service (public sector minus commercial state-sponsored bodies)
Source: Department of Finance, Budgetary and Economic Statistics
Figure 3 Numbers employed in the public sector and public service
Numbers employed in the public sector grew rapidly up to 2008 but have been declining since then
Public Sector Trends 2011
15
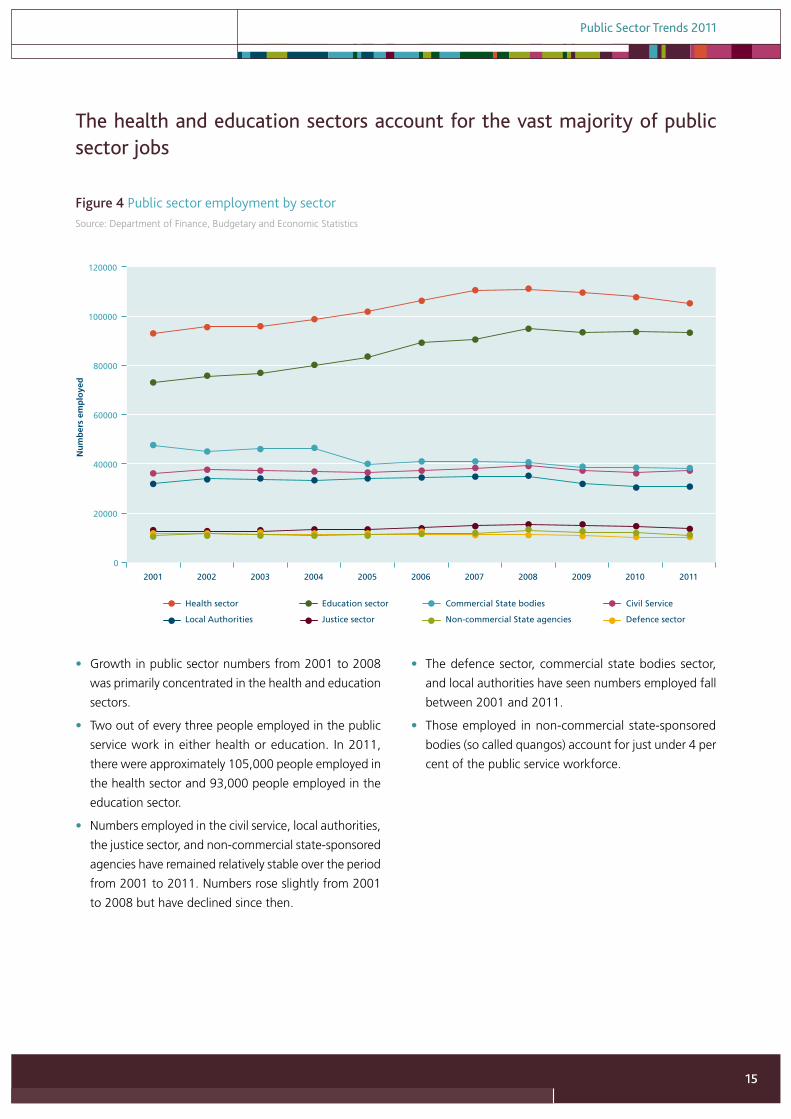
• Growth in public sector numbers from 2001 to 2008
was primarily concentrated in the health and education
sectors.
• Two out of every three people employed in the public
service work in either health or education. In 2011,
there were approximately 105,000 people employed in
the health sector and 93,000 people employed in the
education sector.
• Numbers employed in the civil service, local authorities,
the justice sector, and non-commercial state-sponsored
agencies have remained relatively stable over the period
from 2001 to 2011. Numbers rose slightly from 2001
to 2008 but have declined since then.
• The defence sector, commercial state bodies sector,
and local authorities have seen numbers employed fall
between 2001 and 2011.
• Those employed in non-commercial state-sponsored
bodies (so called quangos) account for just under 4 per
cent of the public service workforce.
0
20000
40000
60000
80000
100000
120000
2001 2002 2003 2004 2005 2006 2007 2008 2009 2010 2011
Nu
mb
ers
emp
loye
d
Figure 4 Public sector employment by sector
Health sector Education sector Civil Service
Local Authorities Justice sector Non-commercial State agencies Defence sector
Commercial State bodies
Source: Department of Finance, Budgetary and Economic Statistics
Figure 4 Public sector employment by sector
The health and education sectors account for the vast majority of public sector jobs
Public Sector Trends 2011
16
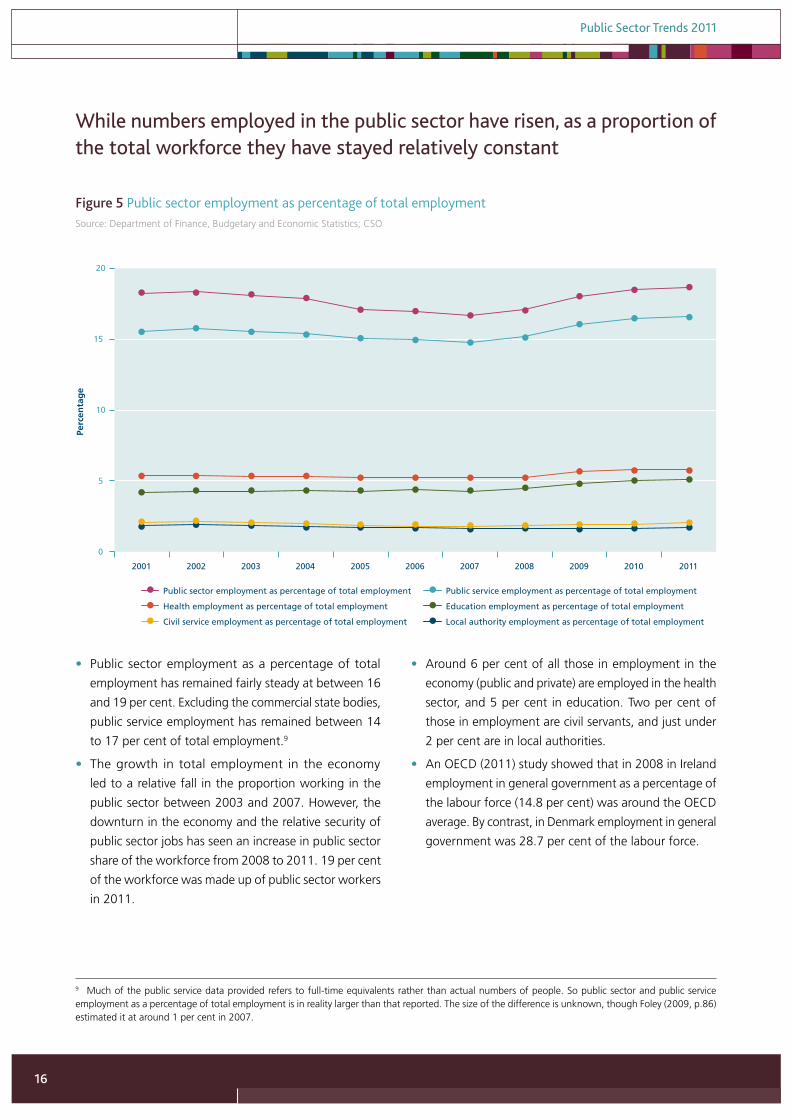
• Public sector employment as a percentage of total
employment has remained fairly steady at between 16
and 19 per cent. Excluding the commercial state bodies,
public service employment has remained between 14
to 17 per cent of total employment.9
• The growth in total employment in the economy
led to a relative fall in the proportion working in the
public sector between 2003 and 2007. However, the
downturn in the economy and the relative security of
public sector jobs has seen an increase in public sector
share of the workforce from 2008 to 2011. 19 per cent
of the workforce was made up of public sector workers
in 2011.
• Around 6 per cent of all those in employment in the
economy (public and private) are employed in the health
sector, and 5 per cent in education. Two per cent of
those in employment are civil servants, and just under
2 per cent are in local authorities.
• An OECD (2011) study showed that in 2008 in Ireland
employment in general government as a percentage of
the labour force (14.8 per cent) was around the OECD
average. By contrast, in Denmark employment in general
government was 28.7 per cent of the labour force.
0
5
10
15
20
2001 2002 2003 2004 2005 2006 2007 2008 2009 2010 2011
Perc
enta
ge
Figure 5 Public sector employment as percentage of total employment
Public sector employment as percentage of total employment Public service employment as percentage of total employment
Health employment as percentage of total employment Education employment as percentage of total employment
Civil service employment as percentage of total employment Local authority employment as percentage of total employment
Source: Department of Finance, Budgetary and Economic Statistics; CSO
Figure 5 Public sector employment as percentage of total employment
While numbers employed in the public sector have risen, as a proportion of the total workforce they have stayed relatively constant
9 Much of the public service data provided refers to full-time equivalents rather than actual numbers of people. So public sector and public service employment as a percentage of total employment is in reality larger than that reported. The size of the difference is unknown, though Foley (2009, p.86) estimated it at around 1 per cent in 2007.
Public Sector Trends 2011
17
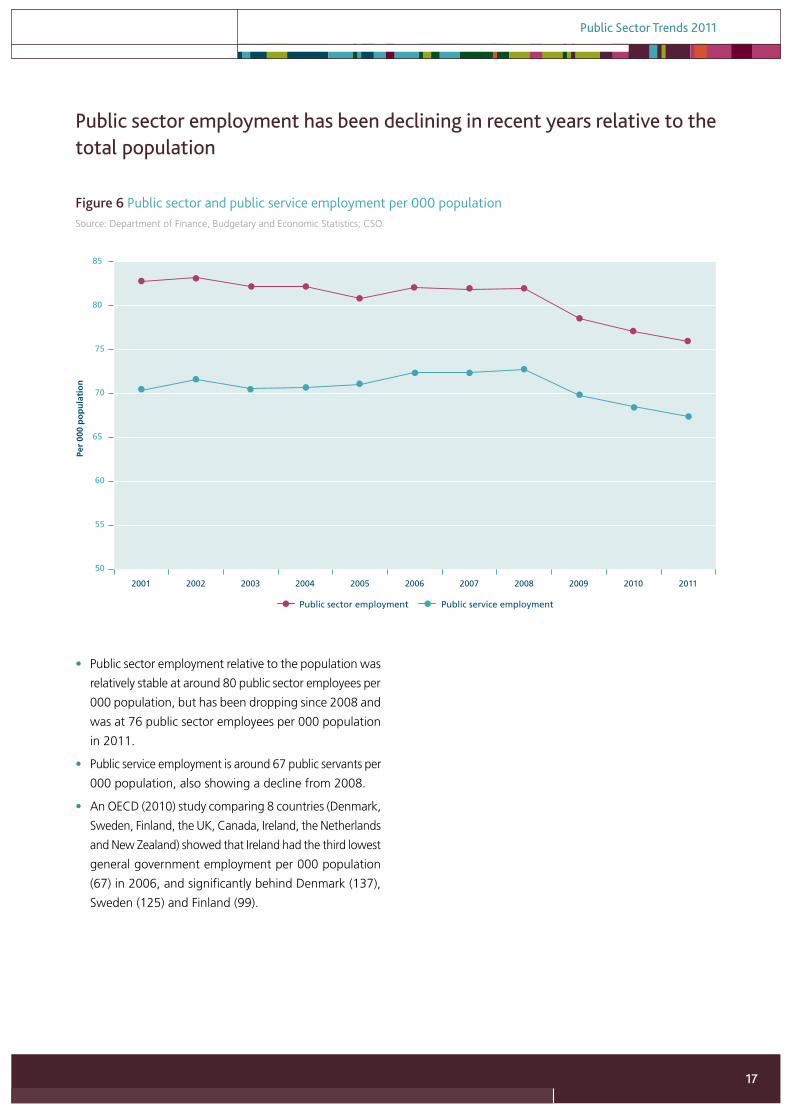
• Public sector employment relative to the population was
relatively stable at around 80 public sector employees per
000 population, but has been dropping since 2008 and
was at 76 public sector employees per 000 population
in 2011.
• Public service employment is around 67 public servants per
000 population, also showing a decline from 2008.
• An OECD (2010) study comparing 8 countries (Denmark,
Sweden, Finland, the UK, Canada, Ireland, the Netherlands
and New Zealand) showed that Ireland had the third lowest
general government employment per 000 population
(67) in 2006, and significantly behind Denmark (137),
Sweden (125) and Finland (99).
50
55
60
65
70
75
80
85
2001 2002 2003 2004 2005 2006 2007 2008 2009 2010 2011
Per
000
po
pu
lati
on
Figure 6 Public sector and public service employment per 000 population
Public sector employment Public service employment
Source: Department of Finance, Budgetary and Economic Statistics; CSO
Figure 6 Public sector and public service employment per 000 population
Public sector employment has been declining in recent years relative to the total population
Public Sector Trends 2011
18
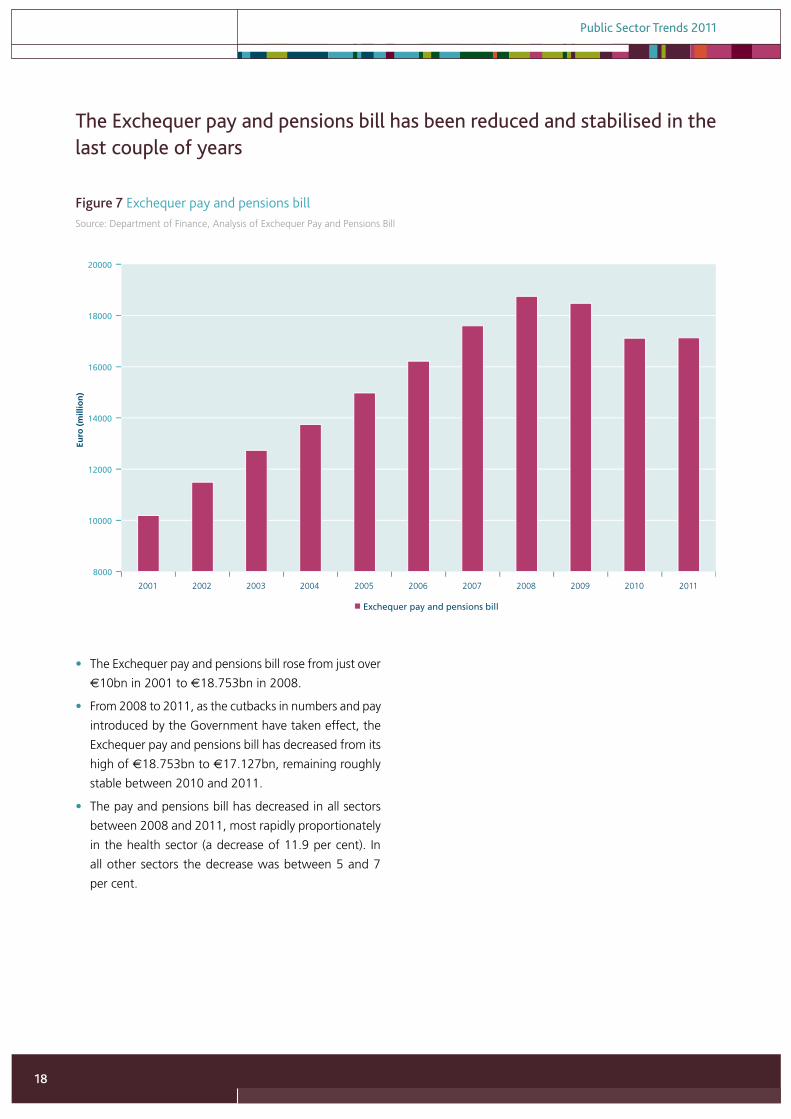
• The Exchequer pay and pensions bill rose from just over
€10bn in 2001 to €18.753bn in 2008.
• From 2008 to 2011, as the cutbacks in numbers and pay
introduced by the Government have taken effect, the
Exchequer pay and pensions bill has decreased from its
high of €18.753bn to €17.127bn, remaining roughly
stable between 2010 and 2011.
• The pay and pensions bill has decreased in all sectors
between 2008 and 2011, most rapidly proportionately
in the health sector (a decrease of 11.9 per cent). In
all other sectors the decrease was between 5 and 7
per cent.
8000
10000
12000
14000
16000
18000
20000
2001 2002 2003 2004 2005 2006 2007 2008 2009 2010 2011
Euro
(m
illio
n)
Figure 7 Exchequer pay and pensions bill
Exchequer pay and pensions bill
Source: Department of Finance, Analysis of Exchequer Pay and Pensions Bill
Figure 7 Exchequer pay and pensions bill
The Exchequer pay and pensions bill has been reduced and stabilised in the last couple of years
Public Sector Trends 2011
19
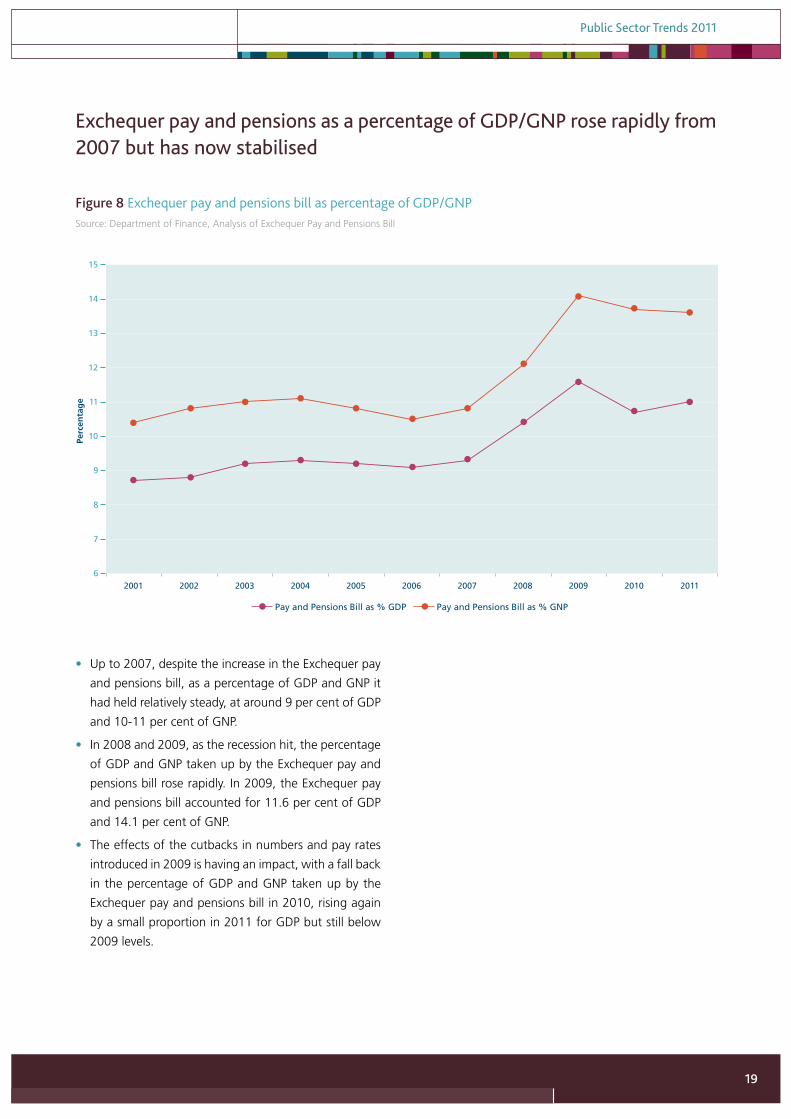
• Up to 2007, despite the increase in the Exchequer pay
and pensions bill, as a percentage of GDP and GNP it
had held relatively steady, at around 9 per cent of GDP
and 10-11 per cent of GNP.
• In 2008 and 2009, as the recession hit, the percentage
of GDP and GNP taken up by the Exchequer pay and
pensions bill rose rapidly. In 2009, the Exchequer pay
and pensions bill accounted for 11.6 per cent of GDP
and 14.1 per cent of GNP.
• The effects of the cutbacks in numbers and pay rates
introduced in 2009 is having an impact, with a fall back
in the percentage of GDP and GNP taken up by the
Exchequer pay and pensions bill in 2010, rising again
by a small proportion in 2011 for GDP but still below
2009 levels.
Figure 8 Exchequer pay and pensions bill as percentage of GDP/GNP
6
7
8
9
10
11
12
13
14
15
2001 2002 2003 2004 2005 2006 2007 2008 2009 2010 2011
Perc
enta
ge
Pay and Pensions Bill as % GDP Pay and Pensions Bill as % GNP
Source: Department of Finance, Analysis of Exchequer Pay and Pensions Bill
Figure 8 Exchequer pay and pensions bill as percentage of GDP/GNP
Exchequer pay and pensions as a percentage of GDP/GNP rose rapidly from 2007 but has now stabilised
Public Sector Trends 2011
20
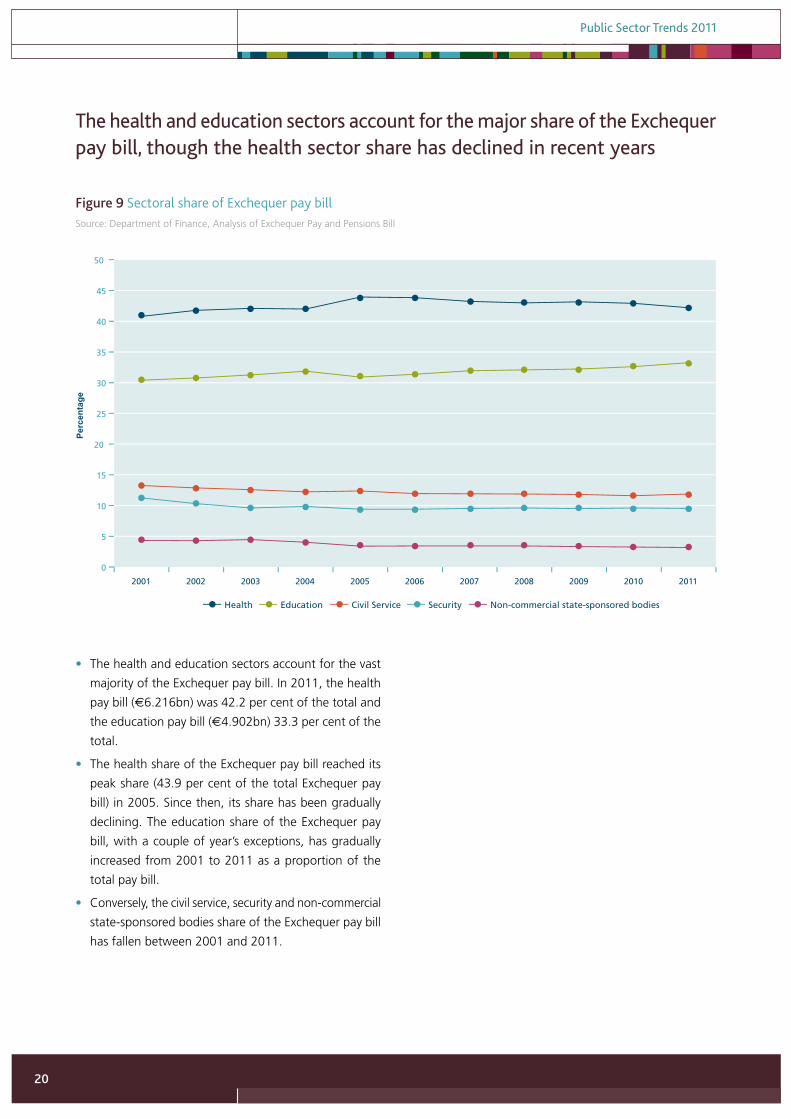
• The health and education sectors account for the vast
majority of the Exchequer pay bill. In 2011, the health
pay bill (€6.216bn) was 42.2 per cent of the total and
the education pay bill (€4.902bn) 33.3 per cent of the
total.
• The health share of the Exchequer pay bill reached its
peak share (43.9 per cent of the total Exchequer pay
bill) in 2005. Since then, its share has been gradually
declining. The education share of the Exchequer pay
bill, with a couple of year’s exceptions, has gradually
increased from 2001 to 2011 as a proportion of the
total pay bill.
• Conversely, the civil service, security and non-commercial
state-sponsored bodies share of the Exchequer pay bill
has fallen between 2001 and 2011.
0
5
10
15
20
25
30
35
40
45
50
2001 2002 2003 2004 2005 2006 2007 2008 2009 2010 2011
Perc
enta
ge
Figure 9 Sectoral share of Exchequer pay bill
Health Education Civil Service Security Non-commercial state-sponsored bodies
Source: Department of Finance, Analysis of Exchequer Pay and Pensions Bill
Figure 9 Sectoral share of Exchequer pay bill
The health and education sectors account for the major share of the Exchequer pay bill, though the health sector share has declined in recent years
Public Sector Trends 2011
21
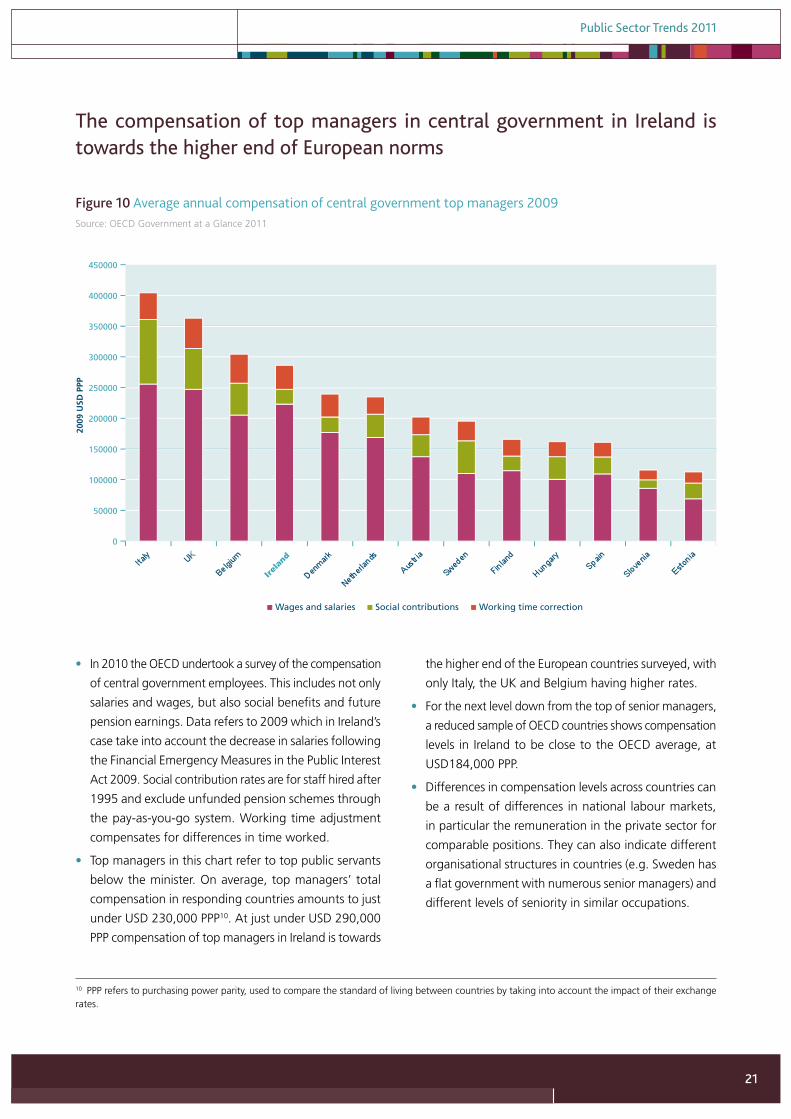
• In 2010 the OECD undertook a survey of the compensation
of central government employees. This includes not only
salaries and wages, but also social benefits and future
pension earnings. Data refers to 2009 which in Ireland’s
case take into account the decrease in salaries following
the Financial Emergency Measures in the Public Interest
Act 2009. Social contribution rates are for staff hired after
1995 and exclude unfunded pension schemes through
the pay-as-you-go system. Working time adjustment
compensates for differences in time worked.
• Top managers in this chart refer to top public servants
below the minister. On average, top managers’ total
compensation in responding countries amounts to just
under USD 230,000 PPP10. At just under USD 290,000
PPP compensation of top managers in Ireland is towards
the higher end of the European countries surveyed, with
only Italy, the UK and Belgium having higher rates.
• For the next level down from the top of senior managers,
a reduced sample of OECD countries shows compensation
levels in Ireland to be close to the OECD average, at
USD184,000 PPP.
• Differences in compensation levels across countries can
be a result of differences in national labour markets,
in particular the remuneration in the private sector for
comparable positions. They can also indicate different
organisational structures in countries (e.g. Sweden has
a flat government with numerous senior managers) and
different levels of seniority in similar occupations.
0
50000
100000
150000
200000
250000
300000
350000
400000
450000
2009
USD
PPP
Figure 10 Average annual compensation of central government top managers 2009
Wages and salaries Social contributions Working time correction
Ireland
Source: OECD Government at a Glance 2011
Figure 10 Average annual compensation of central government top managers 2009
The compensation of top managers in central government in Ireland is towards the higher end of European norms
10 PPP refers to purchasing power parity, used to compare the standard of living between countries by taking into account the impact of their exchange rates.
Public Sector Trends 2011
22
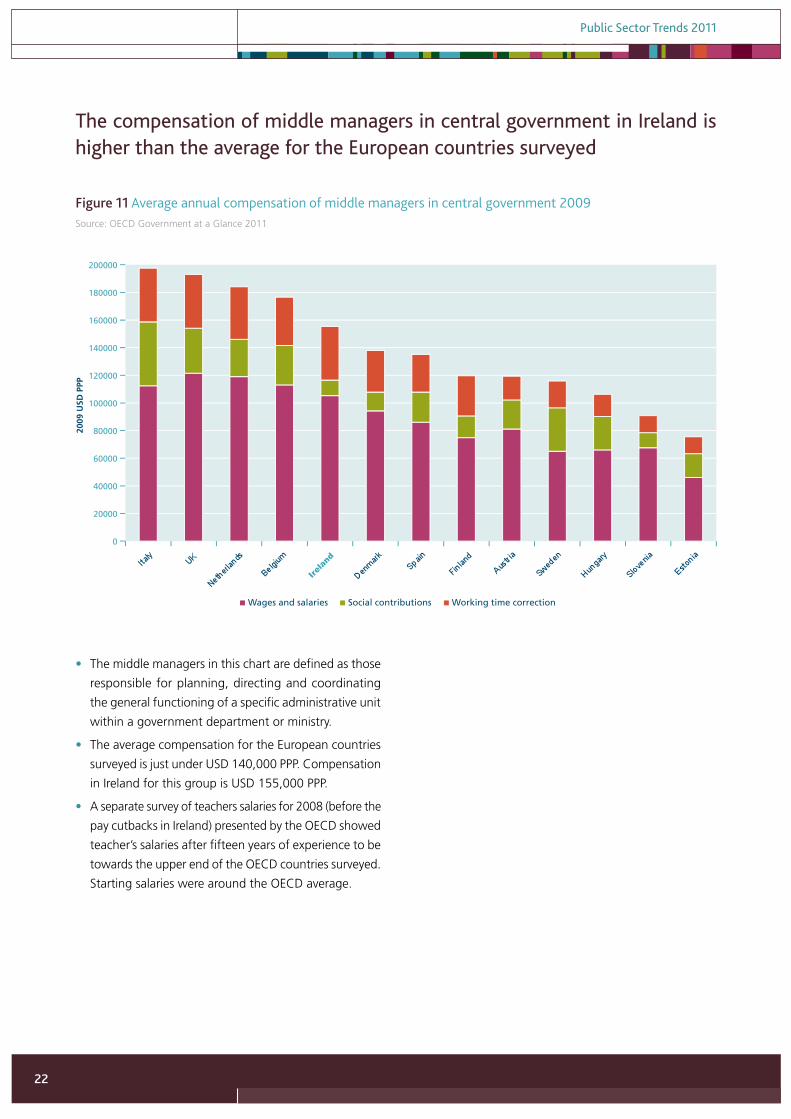
• The middle managers in this chart are defined as those
responsible for planning, directing and coordinating
the general functioning of a specific administrative unit
within a government department or ministry.
• The average compensation for the European countries
surveyed is just under USD 140,000 PPP. Compensation
in Ireland for this group is USD 155,000 PPP.
• A separate survey of teachers salaries for 2008 (before the
pay cutbacks in Ireland) presented by the OECD showed
teacher’s salaries after fifteen years of experience to be
towards the upper end of the OECD countries surveyed.
Starting salaries were around the OECD average.
0
20000
40000
60000
80000
100000
120000
140000
160000
180000
200000
2009
USD
PPP
Figure 11 Average annual compensation of middle managers in central government 2009
Wages and salaries Social contributions Working time correction
Ireland
Source: OECD Government at a Glance 2011
Figure 11 Average annual compensation of middle managers in central government 2009
The compensation of middle managers in central government in Ireland is higher than the average for the European countries surveyed
Public Sector Trends 2011
23
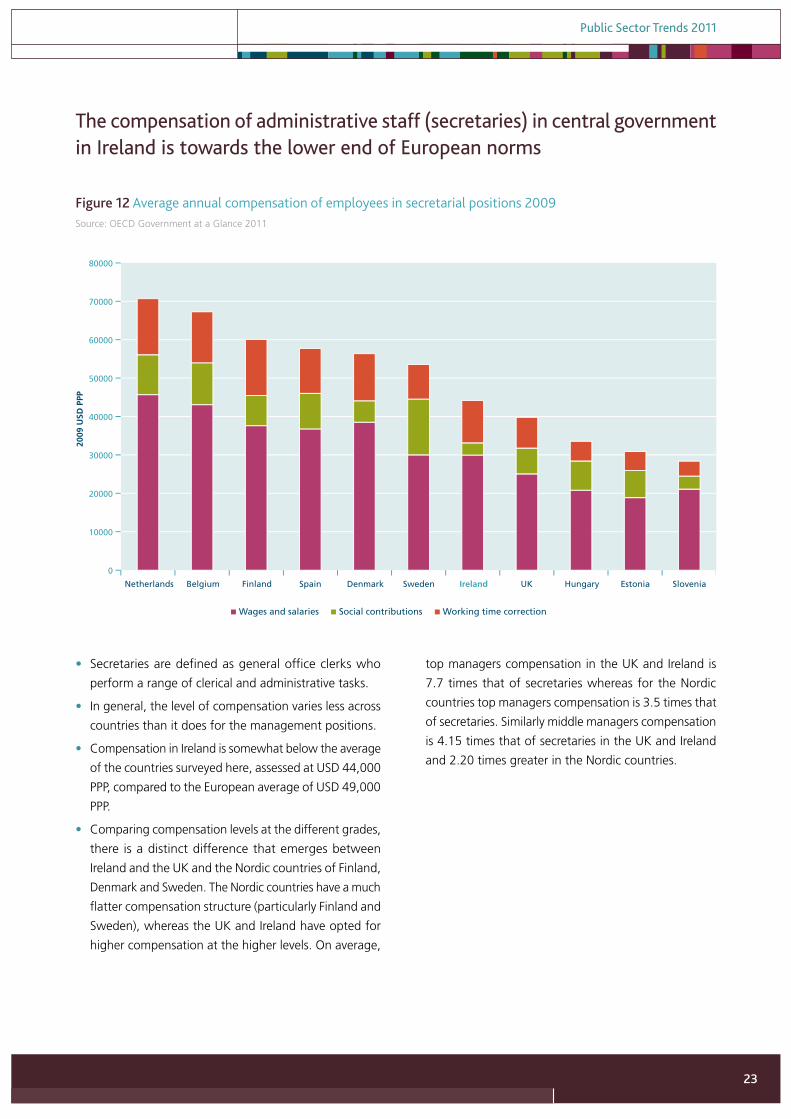
• Secretaries are defined as general office clerks who
perform a range of clerical and administrative tasks.
• In general, the level of compensation varies less across
countries than it does for the management positions.
• Compensation in Ireland is somewhat below the average
of the countries surveyed here, assessed at USD 44,000
PPP, compared to the European average of USD 49,000
PPP.
• Comparing compensation levels at the different grades,
there is a distinct difference that emerges between
Ireland and the UK and the Nordic countries of Finland,
Denmark and Sweden. The Nordic countries have a much
flatter compensation structure (particularly Finland and
Sweden), whereas the UK and Ireland have opted for
higher compensation at the higher levels. On average,
top managers compensation in the UK and Ireland is
7.7 times that of secretaries whereas for the Nordic
countries top managers compensation is 3.5 times that
of secretaries. Similarly middle managers compensation
is 4.15 times that of secretaries in the UK and Ireland
and 2.20 times greater in the Nordic countries.
0
10000
20000
30000
40000
50000
60000
70000
80000
Netherlands Belgium Finland Spain Denmark Sweden Ireland UK Hungary Estonia Slovenia
2009
USD
PPP
Figure 12 Average annual compensation of employees in secretarial positions 2009
Wages and salaries Social contributions Working time correction
Source: OECD Government at a Glance 2011
Figure 12 Average annual compensation of employees in secretarial positions 2009
The compensation of administrative staff (secretaries) in central government in Ireland is towards the lower end of European norms
Public Sector Trends 2011
24
An indicator of the quality of public administration, based on work undertaken by the
Social and Cultural Planning Office (2004) in the Netherlands and taken further by
Boyle (2007) is used to assess the quality of public administration. Sixteen indicators
derived from both IMD and WEF executive opinion surveys are combined to make up
an aggregate public administration quality indicator (see Appendix 1 for details)11. It is
complemented by two subsets of this indicator, one of which shows trends in perception
about the application of traditional public service values in public administration, the
other showing perceptions of the type of competitive and regulatory regime fostered
by public administration.
These indicators are supplemented by World Bank indicators of government effectiveness
and regulatory quality, developed as part of the World Bank’s brief to promote good
governance. A management index developed by Bertelsmann Stiftung provides further
evidence regarding public management capacity.
3. The quality of public administration
11 This quality of public administration indicator was developed by the IPA and has been used internationally, notably in work for the Hong Kong administration in work benchmarking their public service.
Public Sector Trends 2011
25
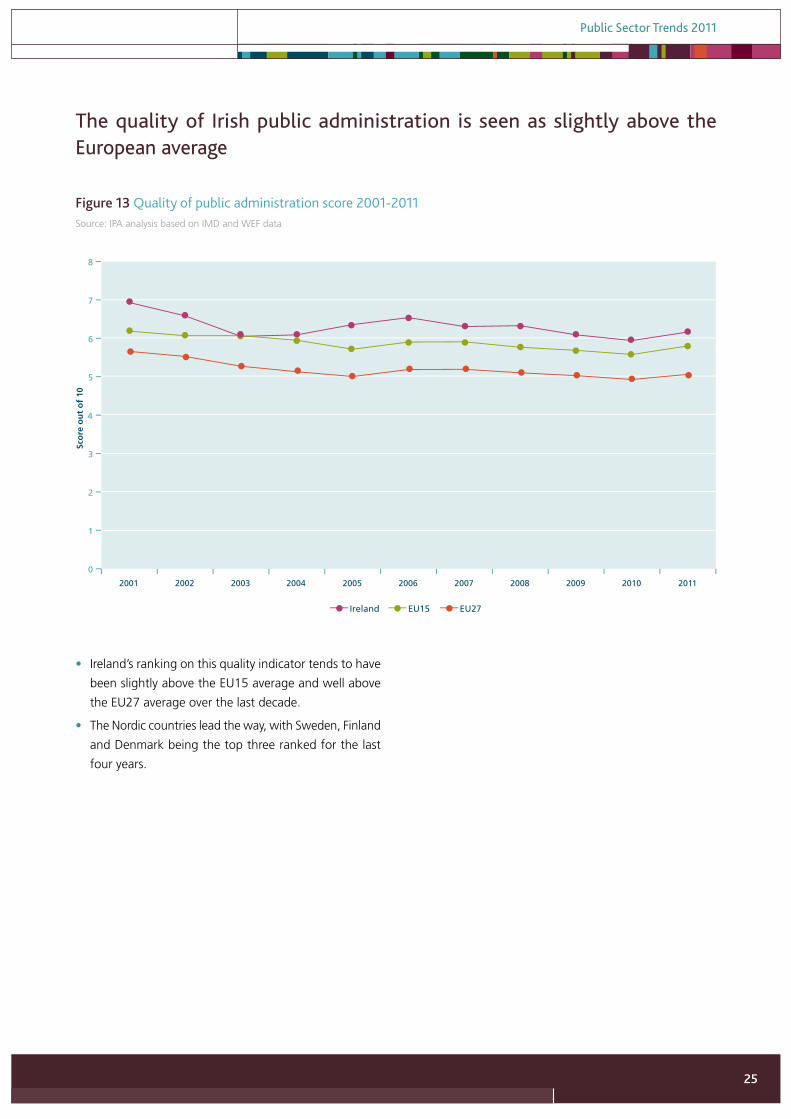
• Ireland’s ranking on this quality indicator tends to have
been slightly above the EU15 average and well above
the EU27 average over the last decade.
• The Nordic countries lead the way, with Sweden, Finland
and Denmark being the top three ranked for the last
four years.
0
1
2
3
4
5
6
7
8
2001 2002 2003 2004 2005 2006 2007 2008 2009 2010 2011
Sco
re o
ut
of
10
Figure 13 Quality of public administration score 2001-2011
Ireland EU15 EU27
Source: IPA analysis based on IMD and WEF data
Figure 13 Quality of public administration score 2001-2011
The quality of Irish public administration is seen as slightly above the European average
Public Sector Trends 2011
26
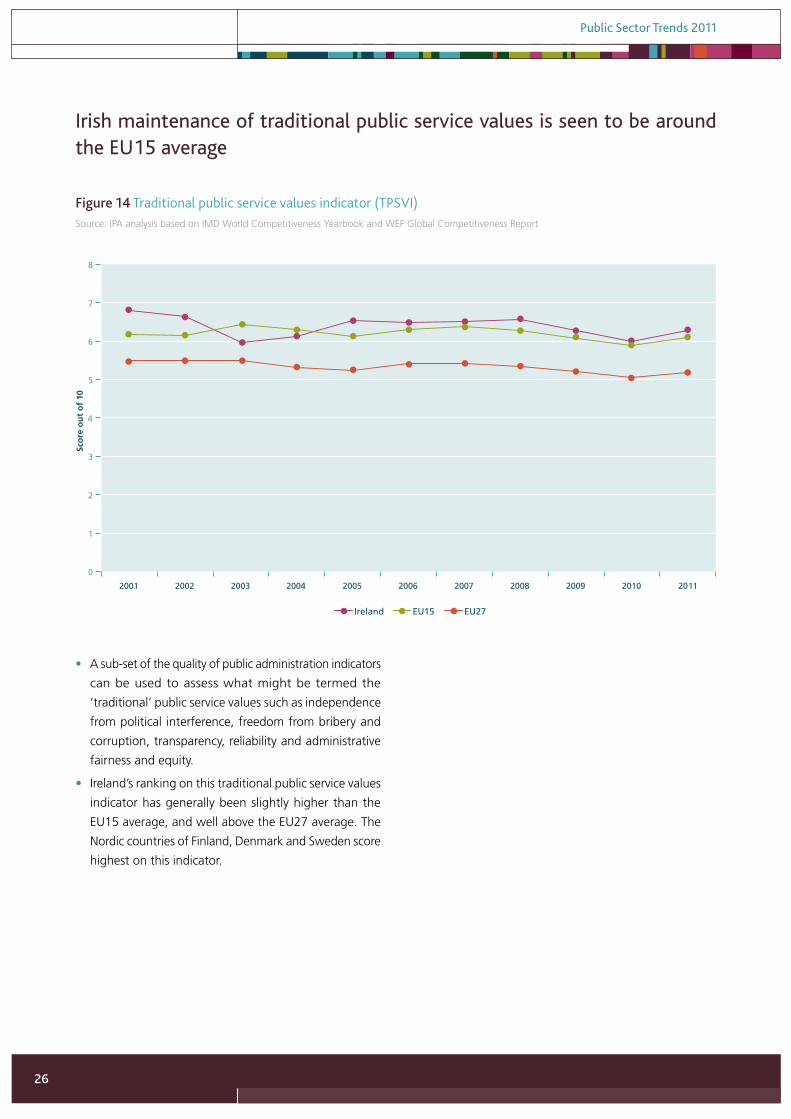
• A sub-set of the quality of public administration indicators
can be used to assess what might be termed the
‘traditional’ public service values such as independence
from political interference, freedom from bribery and
corruption, transparency, reliability and administrative
fairness and equity.
• Ireland’s ranking on this traditional public service values
indicator has generally been slightly higher than the
EU15 average, and well above the EU27 average. The
Nordic countries of Finland, Denmark and Sweden score
highest on this indicator.
0
1
2
3
4
5
6
7
8
2001 2002 2003 2004 2005 2006 2007 2008 2009 2010 2011
Sco
re o
ut
of
10
Figure 14 Traditional public service values indicator (TPSVI)
Ireland EU15 EU27
Source: IPA analysis based on IMD World Competitiveness Yearbook and WEF Global Competitiveness Report
Figure 14 Traditional public service values indicator (TPSVI)
Irish maintenance of traditional public service values is seen to be around the EU15 average
Public Sector Trends 2011
27
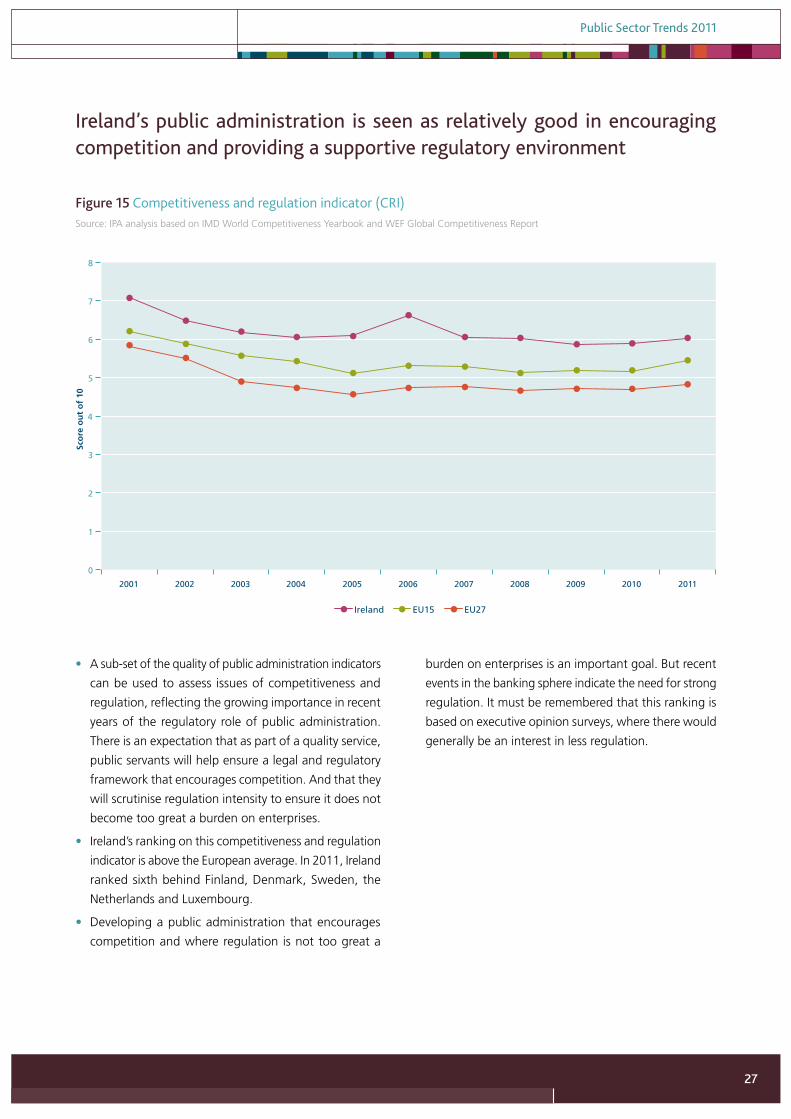
• A sub-set of the quality of public administration indicators
can be used to assess issues of competitiveness and
regulation, reflecting the growing importance in recent
years of the regulatory role of public administration.
There is an expectation that as part of a quality service,
public servants will help ensure a legal and regulatory
framework that encourages competition. And that they
will scrutinise regulation intensity to ensure it does not
become too great a burden on enterprises.
• Ireland’s ranking on this competitiveness and regulation
indicator is above the European average. In 2011, Ireland
ranked sixth behind Finland, Denmark, Sweden, the
Netherlands and Luxembourg.
• Developing a public administration that encourages
competition and where regulation is not too great a
burden on enterprises is an important goal. But recent
events in the banking sphere indicate the need for strong
regulation. It must be remembered that this ranking is
based on executive opinion surveys, where there would
generally be an interest in less regulation.
0
1
2
3
4
5
6
7
8
2001 2002 2003 2004 2005 2006 2007 2008 2009 2010 2011
Sco
re o
ut
of
10
Figure 15 Competitiveness and regulation indicator (CRI)
Ireland EU15 EU27
Source: IPA analysis based on IMD World Competitiveness Yearbook and WEF Global Competitiveness Report
Figure 15 Competitiveness and regulation indicator (CRI)
Ireland’s public administration is seen as relatively good in encouraging competition and providing a supportive regulatory environment
Public Sector Trends 2011
28
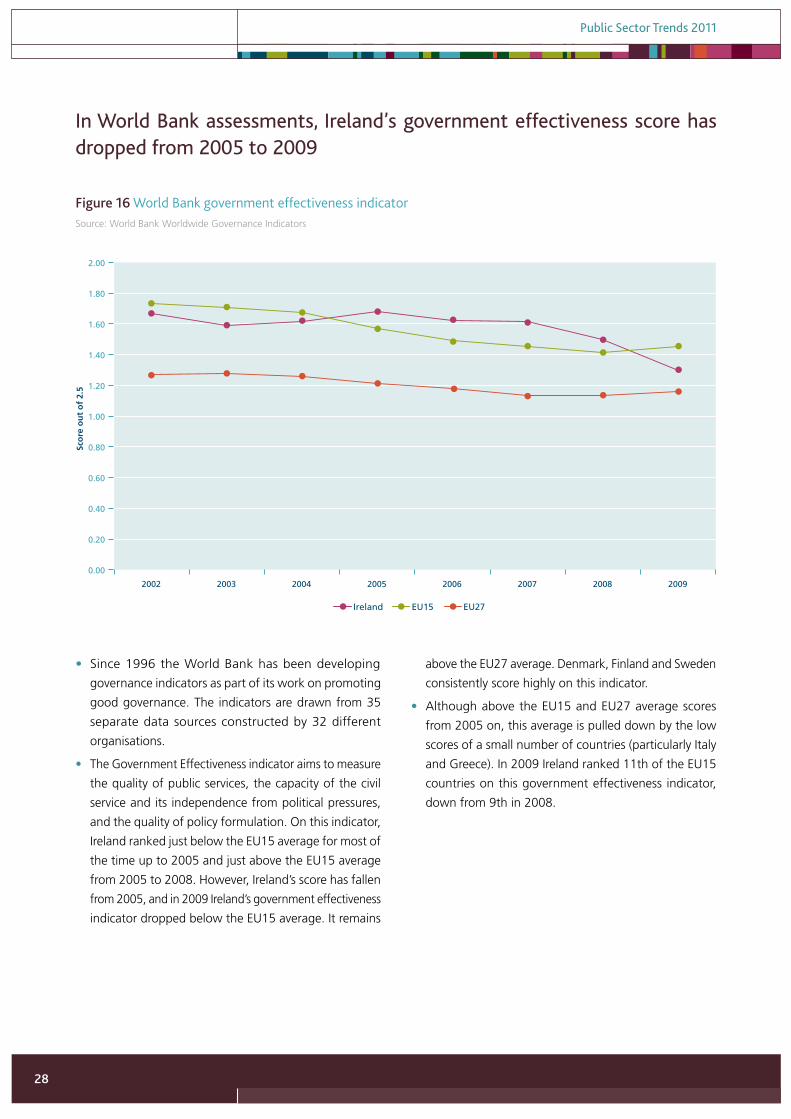
• Since 1996 the World Bank has been developing
governance indicators as part of its work on promoting
good governance. The indicators are drawn from 35
separate data sources constructed by 32 different
organisations.
• The Government Effectiveness indicator aims to measure
the quality of public services, the capacity of the civil
service and its independence from political pressures,
and the quality of policy formulation. On this indicator,
Ireland ranked just below the EU15 average for most of
the time up to 2005 and just above the EU15 average
from 2005 to 2008. However, Ireland’s score has fallen
from 2005, and in 2009 Ireland’s government effectiveness
indicator dropped below the EU15 average. It remains
above the EU27 average. Denmark, Finland and Sweden
consistently score highly on this indicator.
• Although above the EU15 and EU27 average scores
from 2005 on, this average is pulled down by the low
scores of a small number of countries (particularly Italy
and Greece). In 2009 Ireland ranked 11th of the EU15
countries on this government effectiveness indicator,
down from 9th in 2008.
0.00
0.20
0.40
0.60
0.80
1.00
1.20
1.40
1.60
1.80
2.00
2002 2003 2004 2005 2006 2007 2008 2009
Sco
re o
ut
of
2.5
Figure 16 World Bank government effectiveness indicator
Ireland EU15 EU27
Source: World Bank Worldwide Governance Indicators
Figure 16 World Bank government effectiveness indicator
In World Bank assessments, Ireland’s government effectiveness score has dropped from 2005 to 2009
Public Sector Trends 2011
29
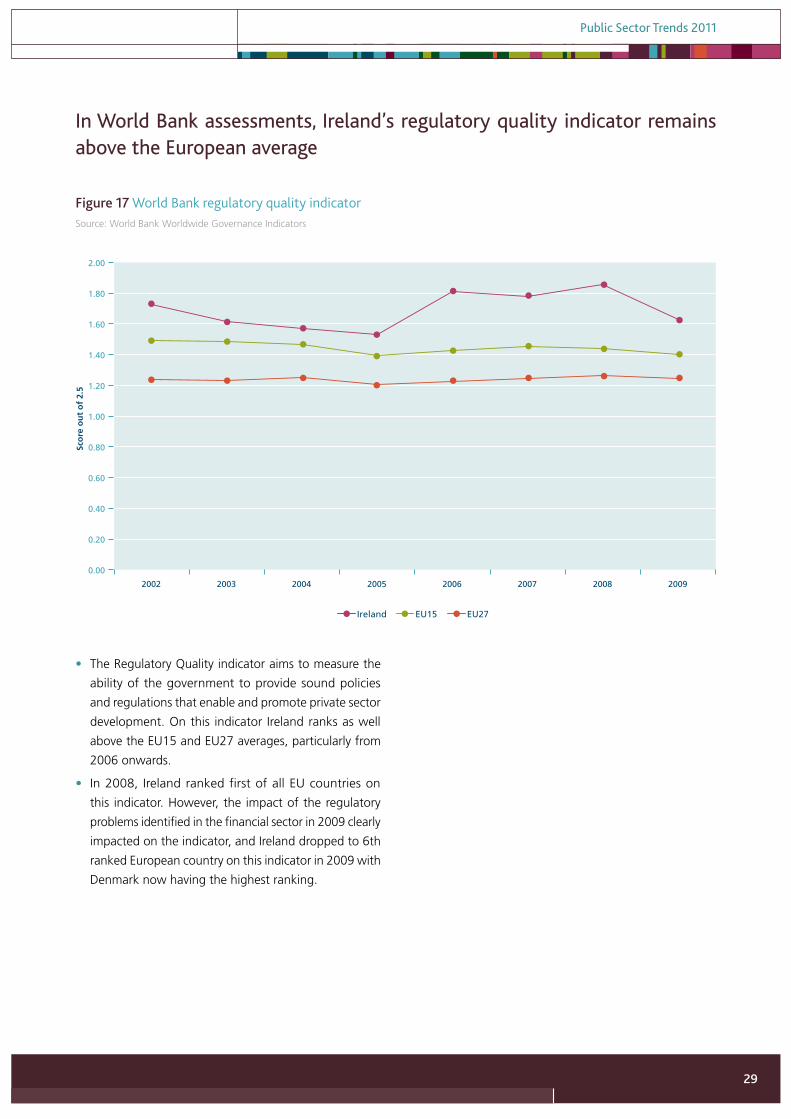
• The Regulatory Quality indicator aims to measure the
ability of the government to provide sound policies
and regulations that enable and promote private sector
development. On this indicator Ireland ranks as well
above the EU15 and EU27 averages, particularly from
2006 onwards.
• In 2008, Ireland ranked first of all EU countries on
this indicator. However, the impact of the regulatory
problems identified in the financial sector in 2009 clearly
impacted on the indicator, and Ireland dropped to 6th
ranked European country on this indicator in 2009 with
Denmark now having the highest ranking.
0.00
0.20
0.40
0.60
0.80
1.00
1.20
1.40
1.60
1.80
2.00
2002 2003 2004 2005 2006 2007 2008 2009
Sco
re o
ut
of
2.5
Figure 17 World Bank regulatory quality indicator
Ireland EU15 EU27
Source: World Bank Worldwide Governance Indicators
Figure 17 World Bank regulatory quality indicator
In World Bank assessments, Ireland’s regulatory quality indicator remains above the European average
Public Sector Trends 2011
30
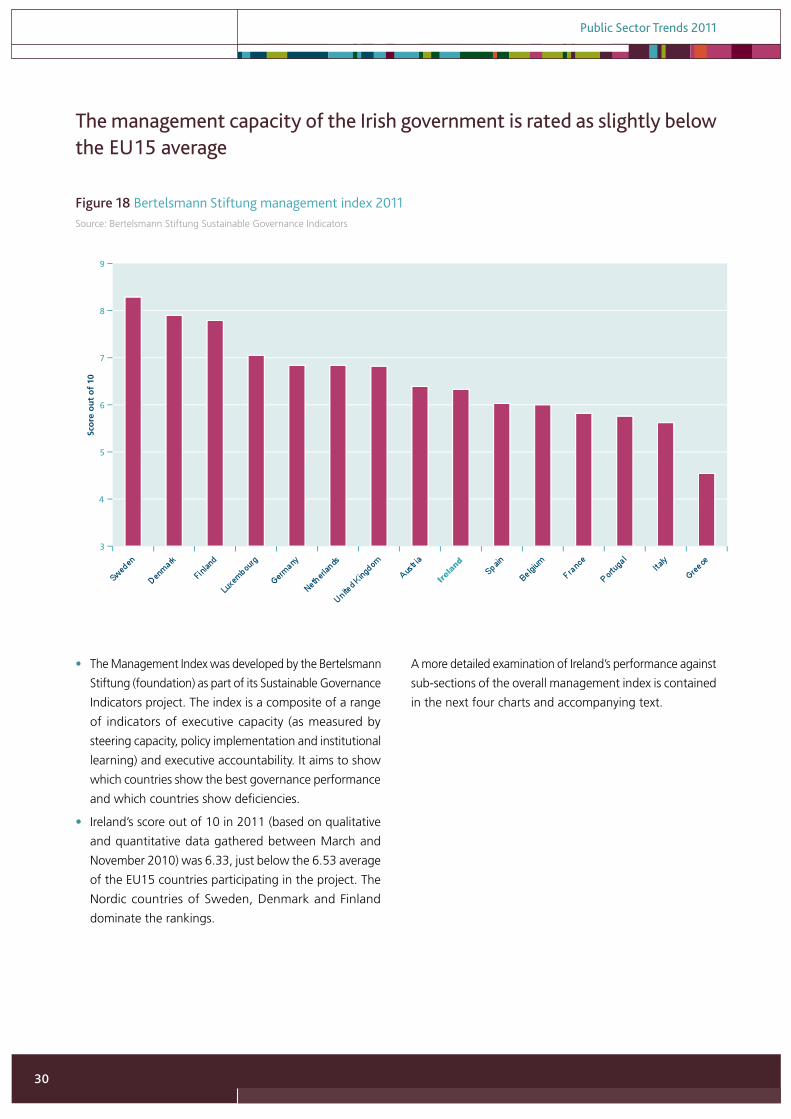
• The Management Index was developed by the Bertelsmann
Stiftung (foundation) as part of its Sustainable Governance
Indicators project. The index is a composite of a range
of indicators of executive capacity (as measured by
steering capacity, policy implementation and institutional
learning) and executive accountability. It aims to show
which countries show the best governance performance
and which countries show deficiencies.
• Ireland’s score out of 10 in 2011 (based on qualitative
and quantitative data gathered between March and
November 2010) was 6.33, just below the 6.53 average
of the EU15 countries participating in the project. The
Nordic countries of Sweden, Denmark and Finland
dominate the rankings.
A more detailed examination of Ireland’s performance against
sub-sections of the overall management index is contained
in the next four charts and accompanying text.
3
4
5
6
7
8
9
Sco
re o
ut
of
10
Figure 18 Bertelsmann Stiftung management index 2011
Ireland
Source: Bertelsmann Stiftung Sustainable Governance Indicators
Figure 18 Bertelsmann Stiftung management index 2011
The management capacity of the Irish government is rated as slightly below the EU15 average
Public Sector Trends 2011
31
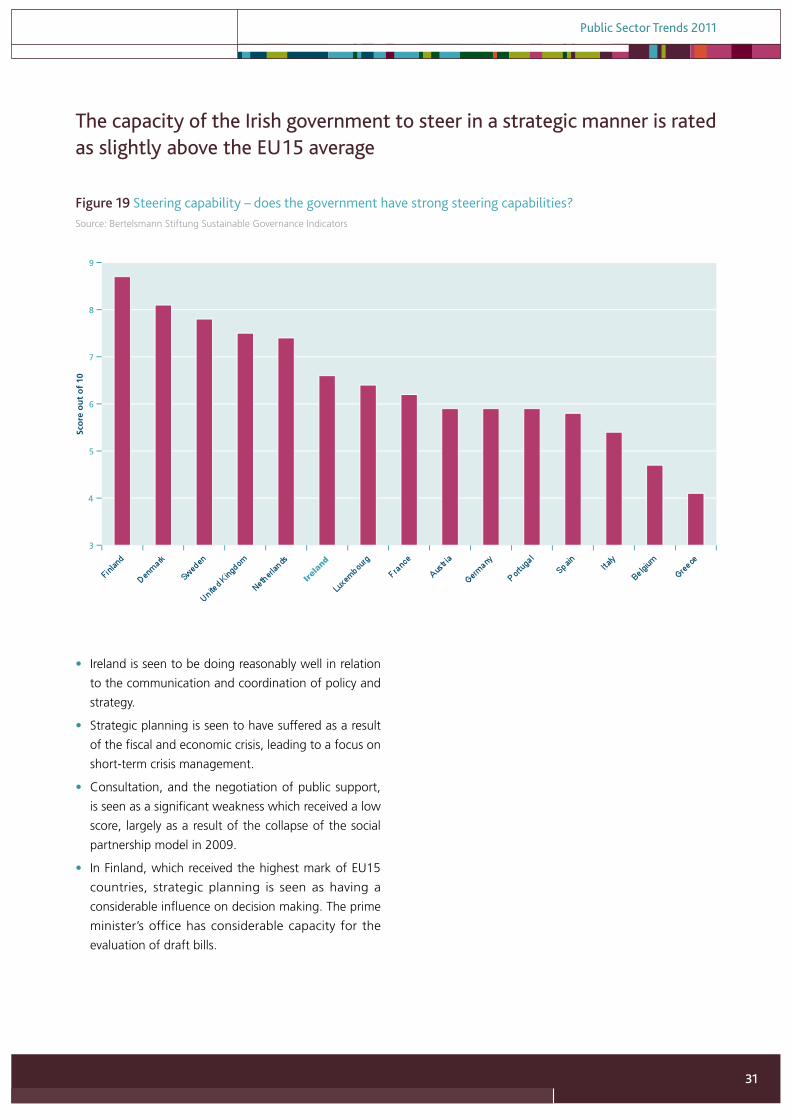
• Ireland is seen to be doing reasonably well in relation
to the communication and coordination of policy and
strategy.
• Strategic planning is seen to have suffered as a result
of the fiscal and economic crisis, leading to a focus on
short-term crisis management.
• Consultation, and the negotiation of public support,
is seen as a significant weakness which received a low
score, largely as a result of the collapse of the social
partnership model in 2009.
• In Finland, which received the highest mark of EU15
countries, strategic planning is seen as having a
considerable influence on decision making. The prime
minister’s office has considerable capacity for the
evaluation of draft bills.
3
4
5
6
7
8
9
Sco
re o
ut
of
10
Figure 19 Steering capability - does the government have strong steering capabilities?
Ireland
Source: Bertelsmann Stiftung Sustainable Governance Indicators
Figure 19 Steering capability – does the government have strong steering capabilities?
The capacity of the Irish government to steer in a strategic manner is rated as slightly above the EU15 average
Public Sector Trends 2011
32
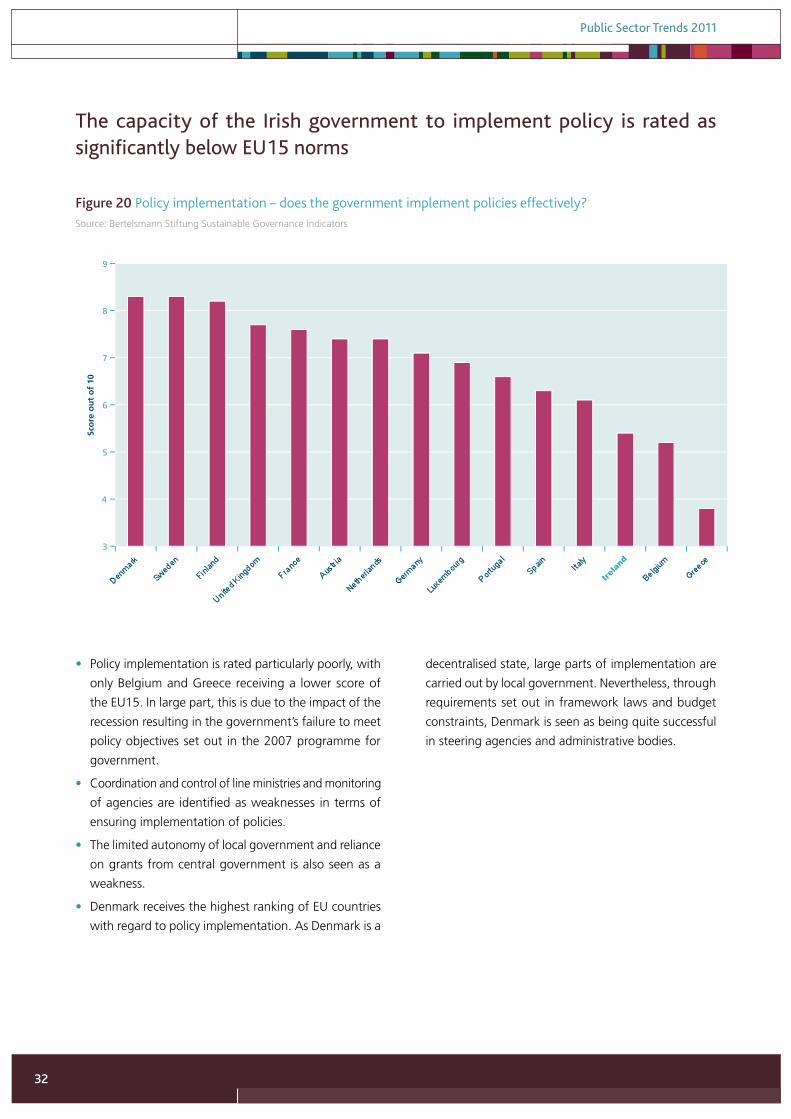
• Policy implementation is rated particularly poorly, with
only Belgium and Greece receiving a lower score of
the EU15. In large part, this is due to the impact of the
recession resulting in the government’s failure to meet
policy objectives set out in the 2007 programme for
government.
• Coordination and control of line ministries and monitoring
of agencies are identified as weaknesses in terms of
ensuring implementation of policies.
• The limited autonomy of local government and reliance
on grants from central government is also seen as a
weakness.
• Denmark receives the highest ranking of EU countries
with regard to policy implementation. As Denmark is a
decentralised state, large parts of implementation are
carried out by local government. Nevertheless, through
requirements set out in framework laws and budget
constraints, Denmark is seen as being quite successful
in steering agencies and administrative bodies.
3
4
5
6
7
8
9
Sco
re o
ut
of
10
Figure 20 Policy implementation - does the government implement policies effectively?
Ireland
Figure 20 Policy implementation – does the government implement policies effectively?
The capacity of the Irish government to implement policy is rated as significantly below EU15 norms
Source: Bertelsmann Stiftung Sustainable Governance Indicators
Public Sector Trends 2011
33
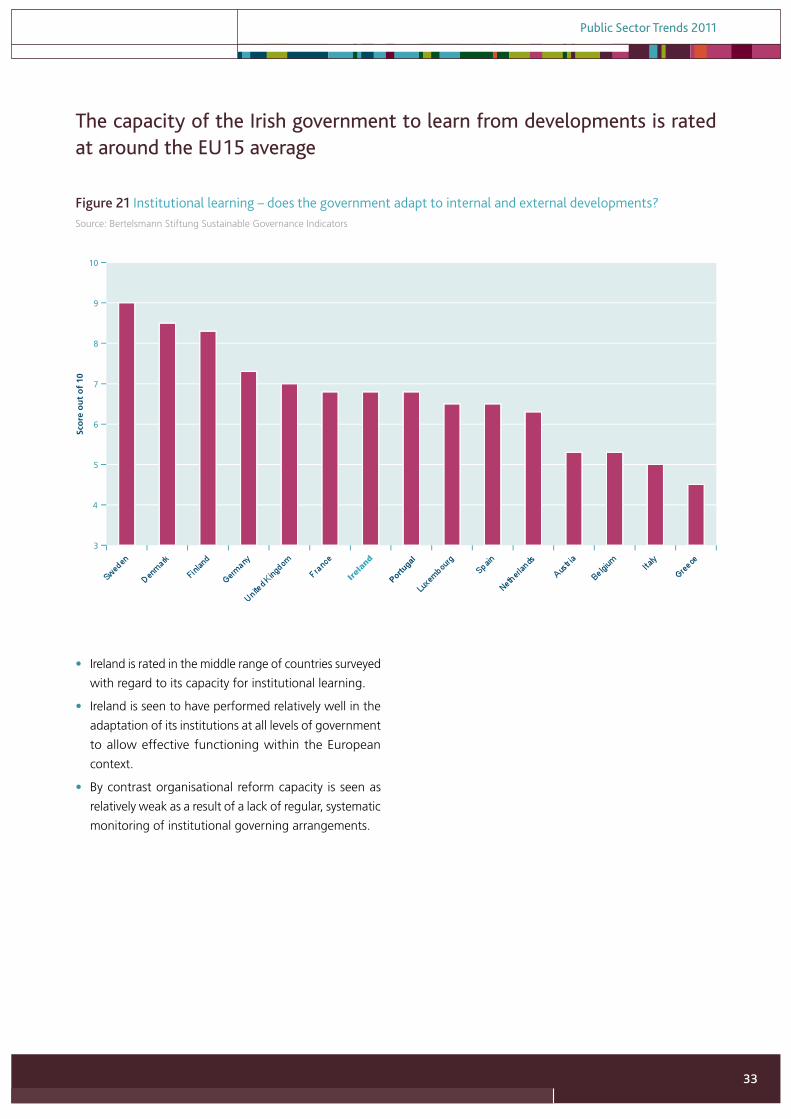
• Ireland is rated in the middle range of countries surveyed
with regard to its capacity for institutional learning.
• Ireland is seen to have performed relatively well in the
adaptation of its institutions at all levels of government
to allow effective functioning within the European
context.
• By contrast organisational reform capacity is seen as
relatively weak as a result of a lack of regular, systematic
monitoring of institutional governing arrangements.
Ireland
3
4
5
6
7
8
9
10
Sco
re o
ut
of
10
Figure 21 Institutional learning - does the government adapt to internal and external developments?
Portugal
Figure 21 Institutional learning – does the government adapt to internal and external developments?
The capacity of the Irish government to learn from developments is rated at around the EU15 average
Source: Bertelsmann Stiftung Sustainable Governance Indicators
Public Sector Trends 2011
34
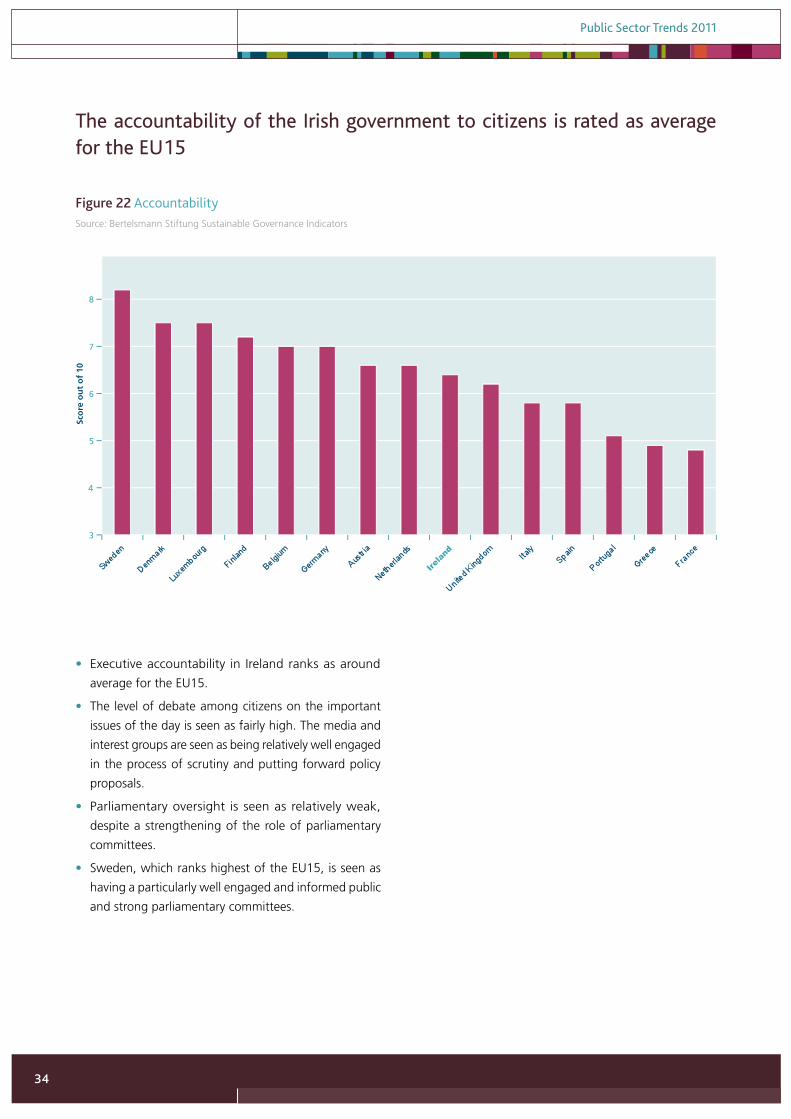
• Executive accountability in Ireland ranks as around
average for the EU15.
• The level of debate among citizens on the important
issues of the day is seen as fairly high. The media and
interest groups are seen as being relatively well engaged
in the process of scrutiny and putting forward policy
proposals.
• Parliamentary oversight is seen as relatively weak,
despite a strengthening of the role of parliamentary
committees.
• Sweden, which ranks highest of the EU15, is seen as
having a particularly well engaged and informed public
and strong parliamentary committees.
Ireland
3
4
5
6
7
9
8
Sco
re o
ut
of
10
Figure 22 Accountability
Figure 22 Accountability
The accountability of the Irish government to citizens is rated as average for the EU15
Source: Bertelsmann Stiftung Sustainable Governance Indicators
Public Sector Trends 2011
35
Information from executive opinion surveys shows perceptions of business people
regarding the efficiency of public services. The World Bank Doing Business indicator
set provides some information on the efficiency of service provided to business by
public administration.
Ultimately, the provision of public administration is intended to achieve social outcomes
in sectors such as health, education, law and order and transport. As such it is important
that any review of public administration looks at sectoral outcomes. In this report, a
brief look is taken at some high-level education and health indicators, given that these
areas are the largest areas of public expenditure.
Attainment and enrolment are two important indicators of the education system,
enrolment focusing on process and attainment on outcome. The European Central
Bank (ECB, 2003) and Netherlands Social and Cultural Planning Office (SCP, 2004)
used secondary school enrolment and educational achievement indicators in their
international comparisons of public sector efficiency and performance. They are the
main indicators used in this report.
In the health sector, two commonly used indicators, again used in the ECB and SCP
studies, are life expectancy and infant mortality. They are used here to illustrate outcomes
in the health sector. They are supplemented by a composite health outcomes index
developed as part of the Euro Health Consumer Index.
4. Public service efficiency and performance
Public Sector Trends 2011
36
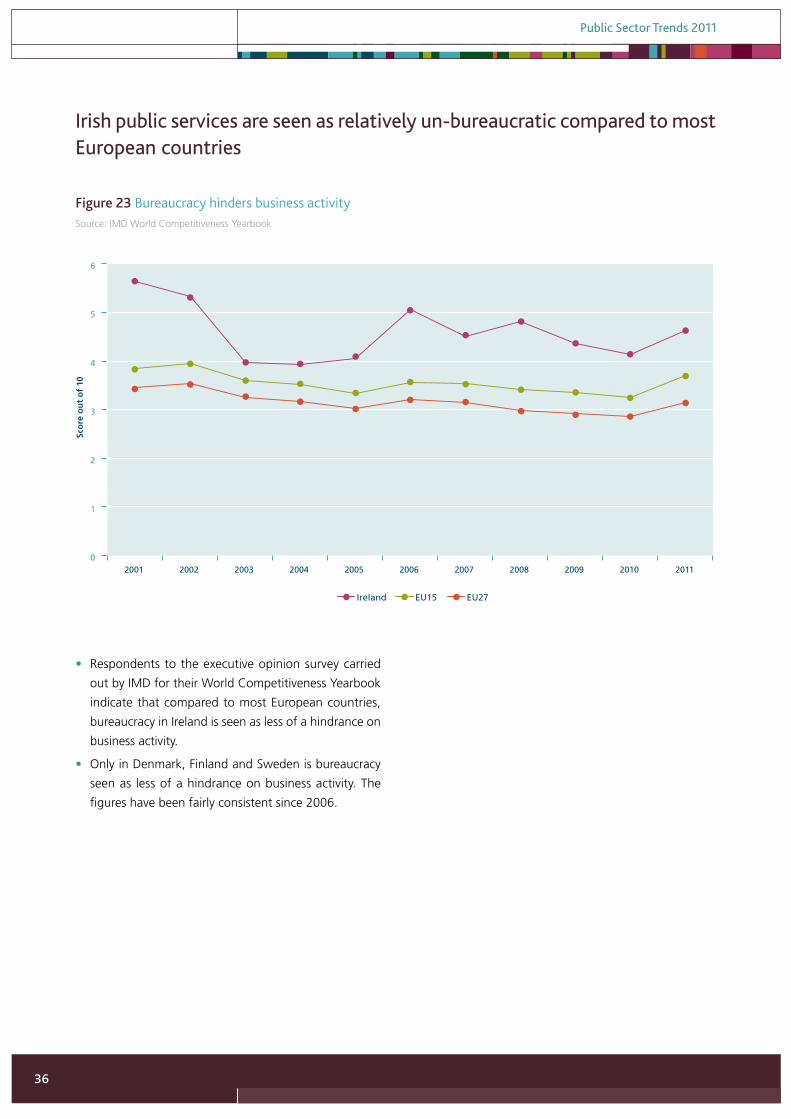
• Respondents to the executive opinion survey carried
out by IMD for their World Competitiveness Yearbook
indicate that compared to most European countries,
bureaucracy in Ireland is seen as less of a hindrance on
business activity.
• Only in Denmark, Finland and Sweden is bureaucracy
seen as less of a hindrance on business activity. The
figures have been fairly consistent since 2006.
0
1
2
3
4
5
6
2001 2002 2003 2004 2005 2006 2007 2008 2009 2010 2011
Sco
re o
ut
of
10
Figure 23 Bureaucracy hinders business activity
Ireland EU15 EU27
Figure 23 Bureaucracy hinders business activity
Irish public services are seen as relatively un-bureaucratic compared to most European countries
Source: IMD World Competitiveness Yearbook
Public Sector Trends 2011
37
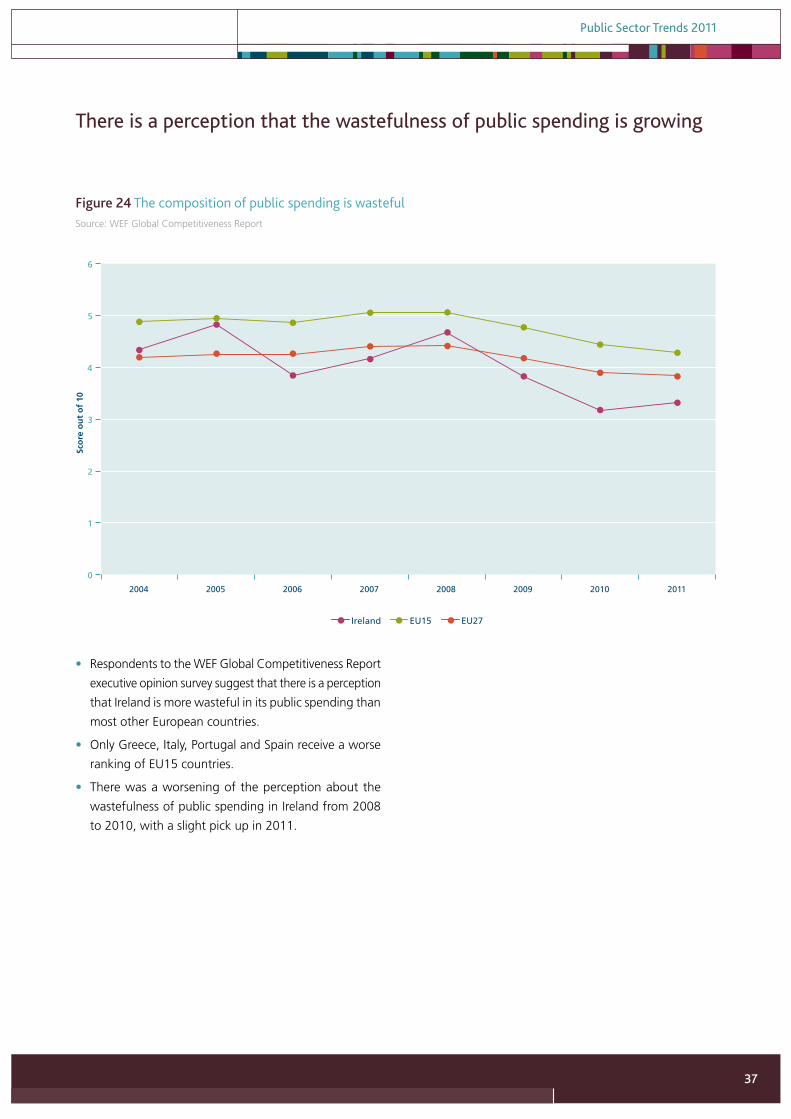
• Respondents to the WEF Global Competitiveness Report
executive opinion survey suggest that there is a perception
that Ireland is more wasteful in its public spending than
most other European countries.
• Only Greece, Italy, Portugal and Spain receive a worse
ranking of EU15 countries.
• There was a worsening of the perception about the
wastefulness of public spending in Ireland from 2008
to 2010, with a slight pick up in 2011.
0
1
2
3
4
5
6
2004 2005 2006 2007 2008 2009 2010 2011
Sco
re o
ut
of
10
Figure 24 The composition of public spending is wasteful
Ireland EU15 EU27
Figure 24 The composition of public spending is wasteful
There is a perception that the wastefulness of public spending is growing
Source: WEF Global Competitiveness Report
Public Sector Trends 2011
38
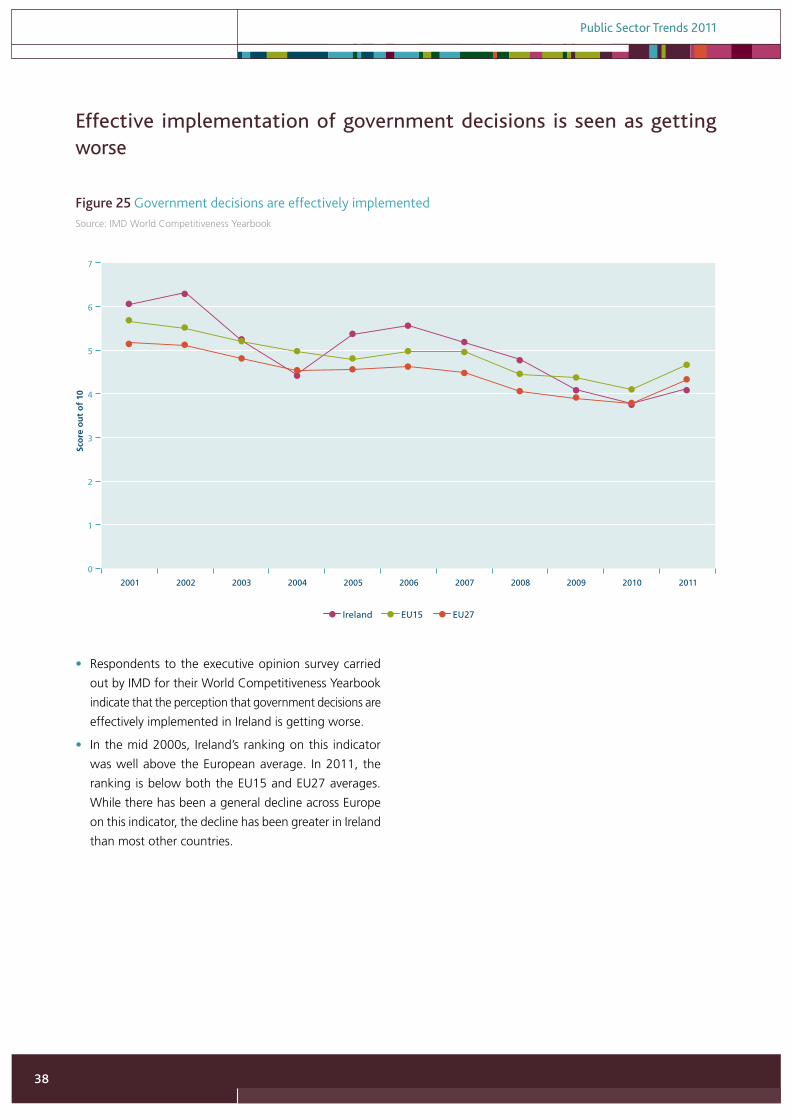
• Respondents to the executive opinion survey carried
out by IMD for their World Competitiveness Yearbook
indicate that the perception that government decisions are
effectively implemented in Ireland is getting worse.
• In the mid 2000s, Ireland’s ranking on this indicator
was well above the European average. In 2011, the
ranking is below both the EU15 and EU27 averages.
While there has been a general decline across Europe
on this indicator, the decline has been greater in Ireland
than most other countries.
0
1
2
3
4
5
6
7
2001 2002 2003 2004 2005 2006 2007 2008 2009 2010 2011
Sco
re o
ut
of
10
Figure 25 Government decisions are effectively implemented
Ireland EU15 EU27
Figure 25 Government decisions are effectively implemented
Effective implementation of government decisions is seen as getting worse
Source: IMD World Competitiveness Yearbook
Public Sector Trends 2011
39
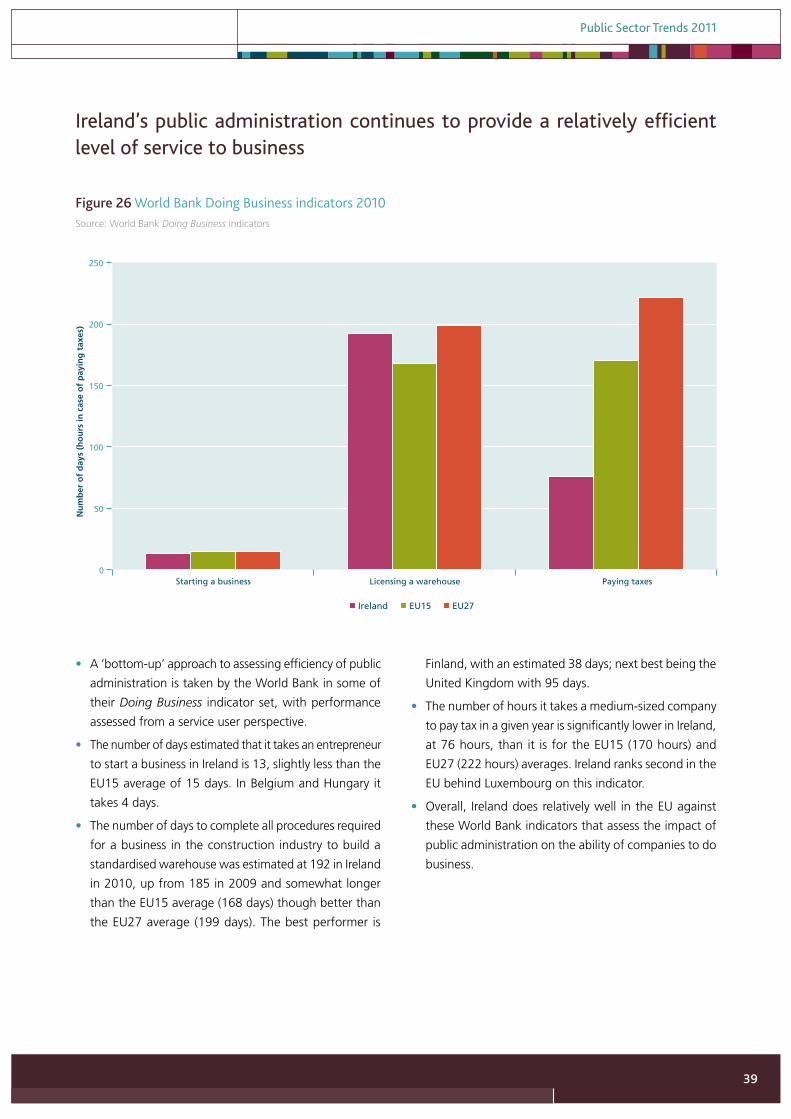
• A ‘bottom-up’ approach to assessing efficiency of public
administration is taken by the World Bank in some of
their Doing Business indicator set, with performance
assessed from a service user perspective.
• The number of days estimated that it takes an entrepreneur
to start a business in Ireland is 13, slightly less than the
EU15 average of 15 days. In Belgium and Hungary it
takes 4 days.
• The number of days to complete all procedures required
for a business in the construction industry to build a
standardised warehouse was estimated at 192 in Ireland
in 2010, up from 185 in 2009 and somewhat longer
than the EU15 average (168 days) though better than
the EU27 average (199 days). The best performer is
Finland, with an estimated 38 days; next best being the
United Kingdom with 95 days.
• The number of hours it takes a medium-sized company
to pay tax in a given year is significantly lower in Ireland,
at 76 hours, than it is for the EU15 (170 hours) and
EU27 (222 hours) averages. Ireland ranks second in the
EU behind Luxembourg on this indicator.
• Overall, Ireland does relatively well in the EU against
these World Bank indicators that assess the impact of
public administration on the ability of companies to do
business.
0
50
100
150
200
250
Starting a business Licensing a warehouse Paying taxes
Nu
mb
er o
f d
ays
(ho
urs
in c
ase
of
pay
ing
tax
es)
Figure 26 World Bank Doing Business indicators 2010
Ireland EU15 EU27
Figure 26 World Bank Doing Business indicators 2010
Ireland’s public administration continues to provide a relatively efficient level of service to business
Source: World Bank Doing Business indicators
Public Sector Trends 2011
40
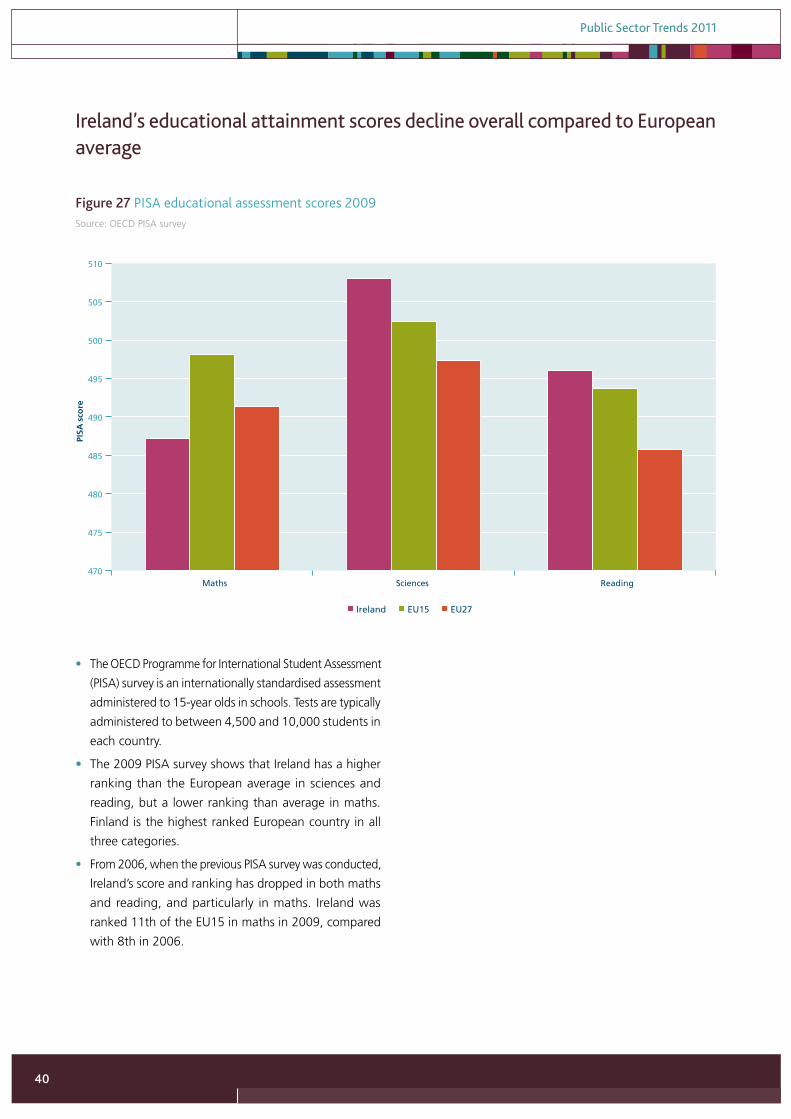
• The OECD Programme for International Student Assessment
(PISA) survey is an internationally standardised assessment
administered to 15-year olds in schools. Tests are typically
administered to between 4,500 and 10,000 students in
each country.
• The 2009 PISA survey shows that Ireland has a higher
ranking than the European average in sciences and
reading, but a lower ranking than average in maths.
Finland is the highest ranked European country in all
three categories.
• From 2006, when the previous PISA survey was conducted,
Ireland’s score and ranking has dropped in both maths
and reading, and particularly in maths. Ireland was
ranked 11th of the EU15 in maths in 2009, compared
with 8th in 2006.
470
475
480
485
490
495
500
505
510
Maths Sciences Reading
PISA
sco
re
Figure 27 PISA educational assessment scores 2009
Ireland EU15 EU27
Figure 27 PISA educational assessment scores 2009
Ireland’s educational attainment scores decline overall compared to European average
Source: OECD PISA survey
Public Sector Trends 2011
41
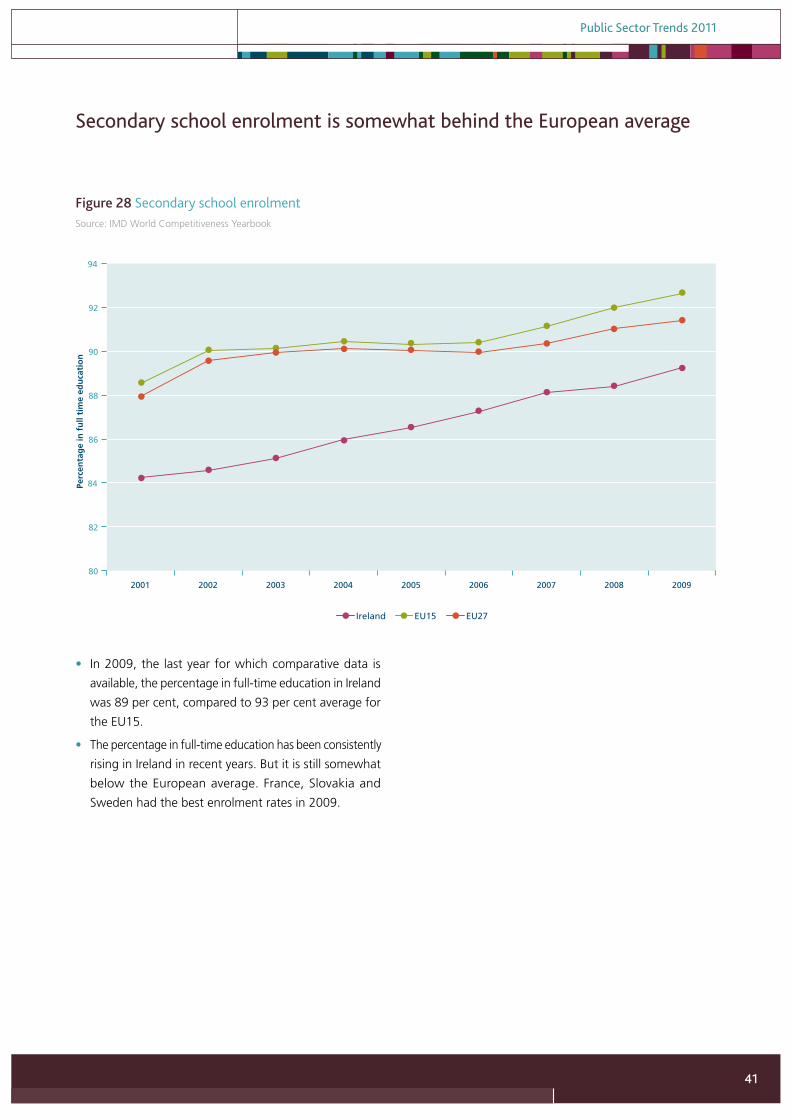
• In 2009, the last year for which comparative data is
available, the percentage in full-time education in Ireland
was 89 per cent, compared to 93 per cent average for
the EU15.
• The percentage in full-time education has been consistently
rising in Ireland in recent years. But it is still somewhat
below the European average. France, Slovakia and
Sweden had the best enrolment rates in 2009.
80
82
84
86
88
90
92
94
2001 2002 2003 2004 2005 2006 2007 2008 2009
Perc
enta
ge
in f
ull
tim
e ed
uca
tio
n
Figure 28 Secondary school enrolment
Ireland EU15 EU27
Figure 28 Secondary school enrolment
Secondary school enrolment is somewhat behind the European average
Source: IMD World Competitiveness Yearbook
Public Sector Trends 2011
42
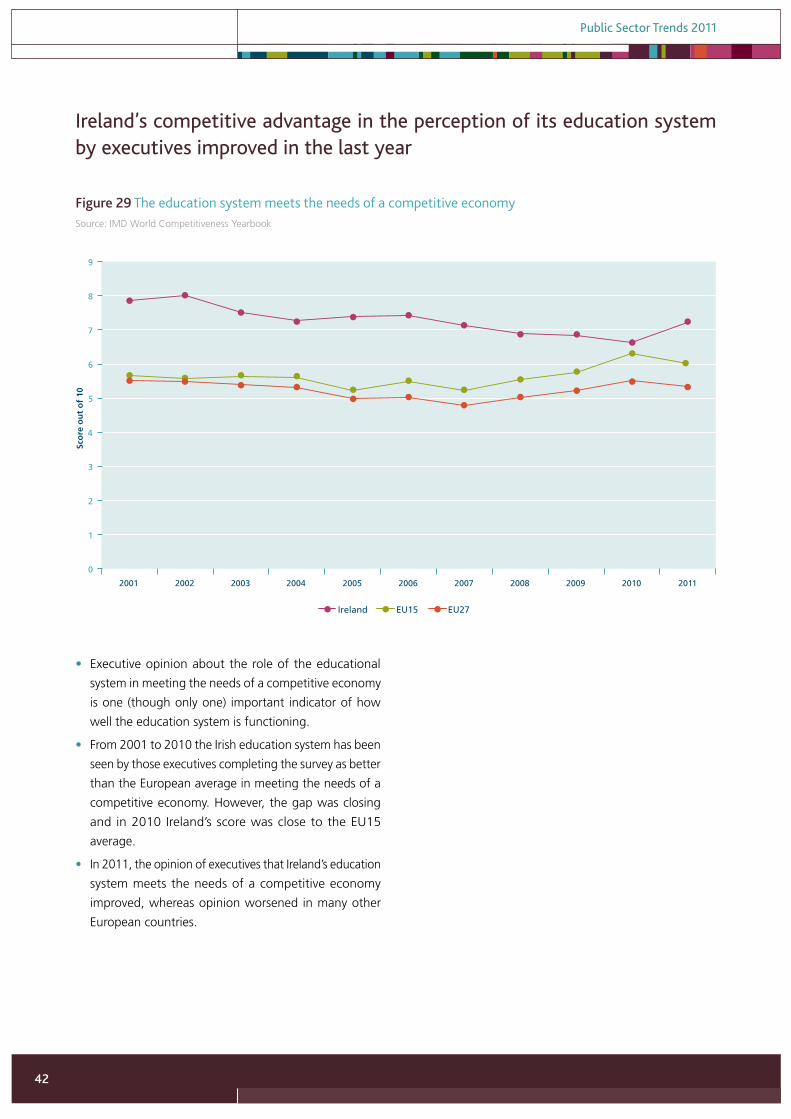
• Executive opinion about the role of the educational
system in meeting the needs of a competitive economy
is one (though only one) important indicator of how
well the education system is functioning.
• From 2001 to 2010 the Irish education system has been
seen by those executives completing the survey as better
than the European average in meeting the needs of a
competitive economy. However, the gap was closing
and in 2010 Ireland’s score was close to the EU15
average.
• In 2011, the opinion of executives that Ireland’s education
system meets the needs of a competitive economy
improved, whereas opinion worsened in many other
European countries.
0
1
2
3
4
5
6
7
8
9
2001 2002 2003 2004 2005 2006 2007 2008 2009 2010 2011
Sco
re o
ut
of
10
Figure 29 The education system meets the needs of a competitive economy
Ireland EU15 EU27
Figure 29 The education system meets the needs of a competitive economy
Ireland’s competitive advantage in the perception of its education system by executives improved in the last year
Source: IMD World Competitiveness Yearbook
Public Sector Trends 2011
43
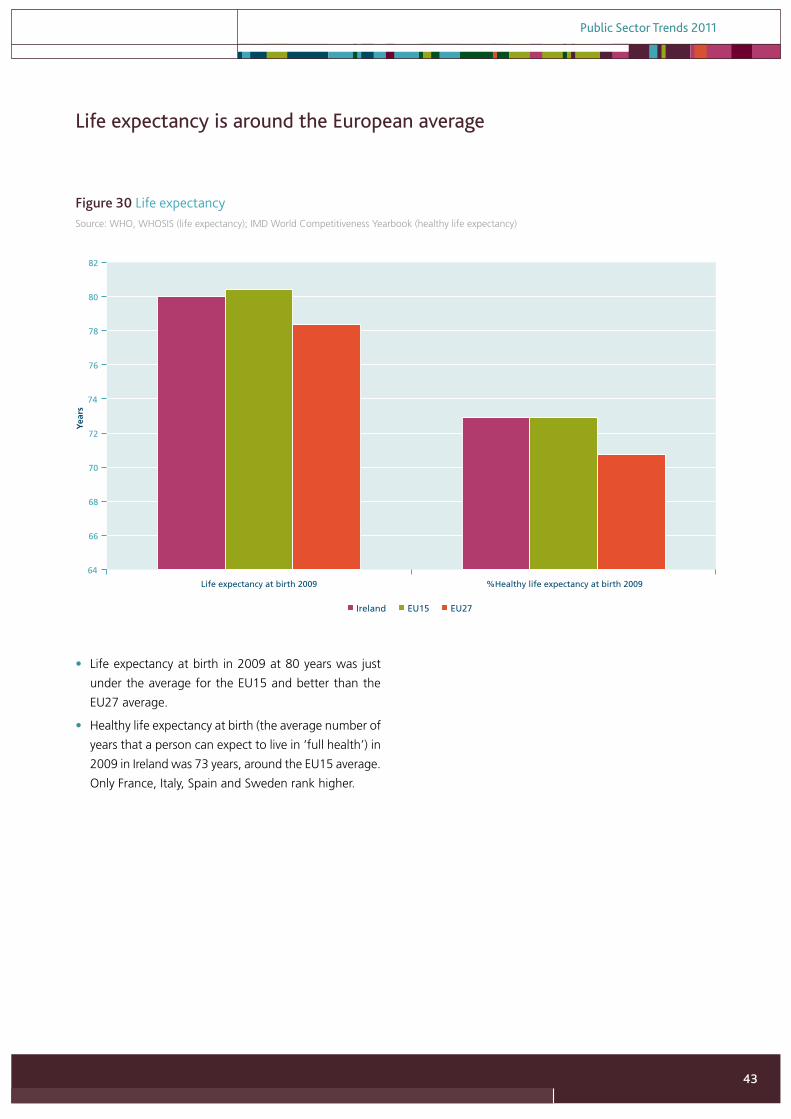
• Life expectancy at birth in 2009 at 80 years was just
under the average for the EU15 and better than the
EU27 average.
• Healthy life expectancy at birth (the average number of
years that a person can expect to live in ‘full health’) in
2009 in Ireland was 73 years, around the EU15 average.
Only France, Italy, Spain and Sweden rank higher.
64
66
68
70
72
74
76
78
80
82
Life expectancy at birth 2009 %Healthy life expectancy at birth 2009
Yea
rs
Figure 30 Life expectancy
Ireland EU15 EU27
Figure 30 Life expectancy
Life expectancy is around the European average
Source: WHO, WHOSIS (life expectancy); IMD World Competitiveness Yearbook (healthy life expectancy)
Public Sector Trends 2011
44
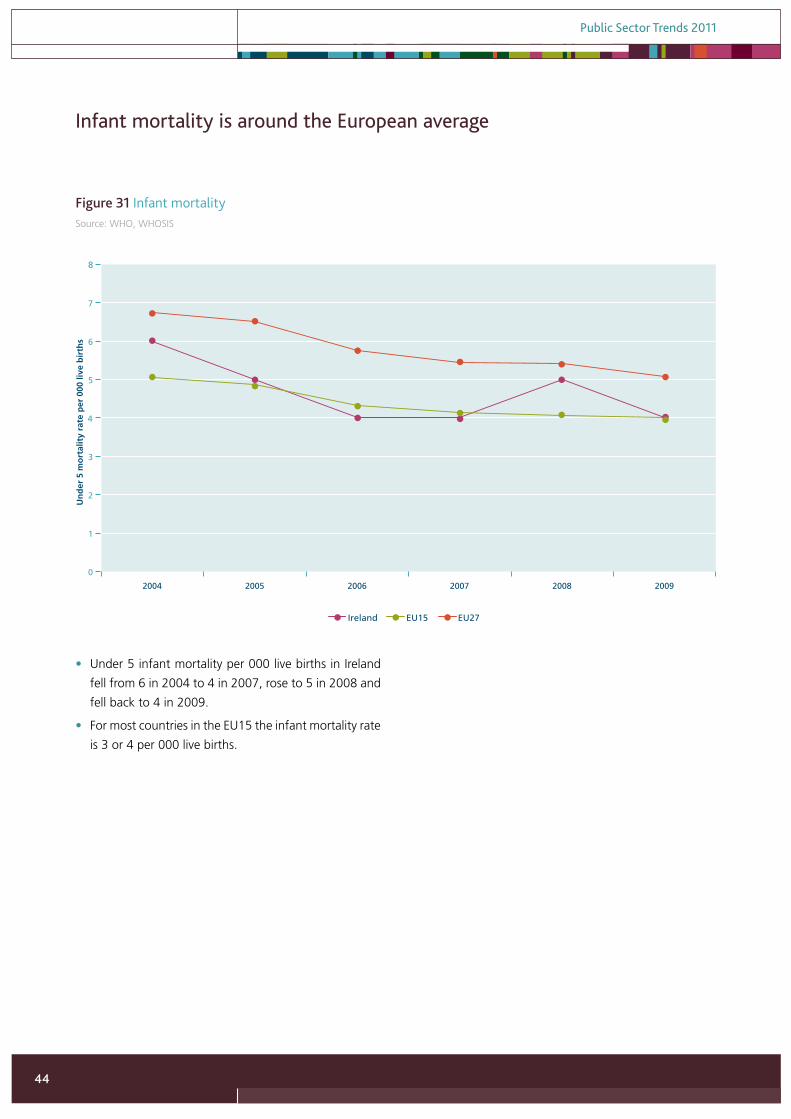
• Under 5 infant mortality per 000 live births in Ireland
fell from 6 in 2004 to 4 in 2007, rose to 5 in 2008 and
fell back to 4 in 2009.
• For most countries in the EU15 the infant mortality rate
is 3 or 4 per 000 live births.
0
1
2
3
4
5
6
7
8
2004 2005 2006 2007 2008 2009
Un
der
5 m
ort
alit
y ra
te p
er 0
00 li
ve b
irth
s
Figure 31 Infant mortality
Ireland EU15 EU27
Figure 31 Infant mortality
Infant mortality is around the European average
Source: WHO, WHOSIS
Public Sector Trends 2011
45
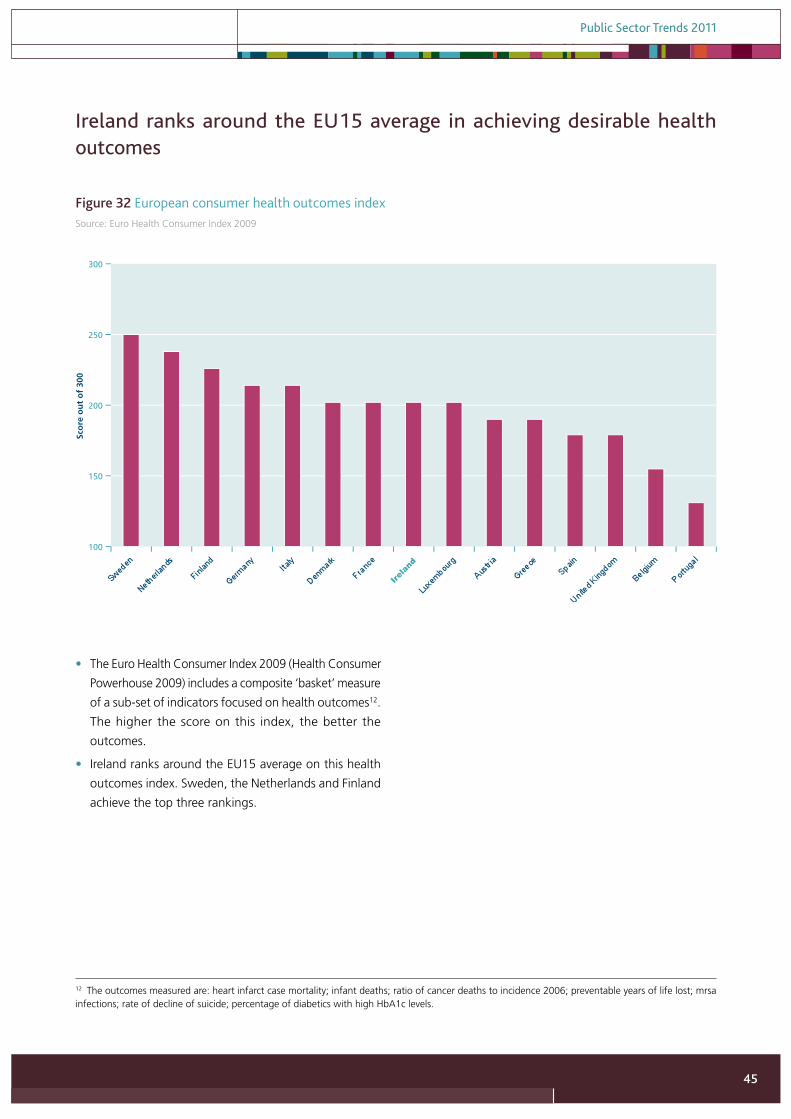
• The Euro Health Consumer Index 2009 (Health Consumer
Powerhouse 2009) includes a composite ‘basket’ measure
of a sub-set of indicators focused on health outcomes12.
The higher the score on this index, the better the
outcomes.
• Ireland ranks around the EU15 average on this health
outcomes index. Sweden, the Netherlands and Finland
achieve the top three rankings.
Ireland
100
150
200
250
300
Sco
re o
ut
of
300
Figure 32 European consumer health outcomes index
Figure 32 European consumer health outcomes index
Ireland ranks around the EU15 average in achieving desirable health outcomes
Source: Euro Health Consumer Index 2009
12 The outcomes measured are: heart infarct case mortality; infant deaths; ratio of cancer deaths to incidence 2006; preventable years of life lost; mrsa infections; rate of decline of suicide; percentage of diabetics with high HbA1c levels.
Public Sector Trends 2011
46
Twice a year Eurobarometer measures the level of public confidence in the national
government and the national parliament. National government is not defined, and the
extent to which it covers both political and administrative elements of government is
unclear. But it is likely to primarily reflect levels of trust in the political parties in power
at the time of the survey.
5. Trust and confidence in public administration
Public Sector Trends 2011
47
• The level of public trust in government in Ireland has
tended to be slightly below the EU15 average from 2001
to 2008, and at or around the EU27 average from 2004
to 2008.
• However, there was a dramatic fall in the level of trust
in government in Ireland from 2008 to 2010. Trust in
government in the rest of Europe also fell, but only
slightly. In autumn 2010, Ireland expressed the lowest
level of trust in government of any of the EU27 (10 per
cent).
• By spring 2011, the level of public trust had increased
significantly to 42 per cent expressing trust in the Irish
government, close to the EU15 average.
0%
10%
20%
30%
40%
50%
60%
Pro
po
rtio
n w
ho
ten
d t
o t
rust
th
e g
ove
rnm
ent
Figure 33 Level of trust in government
Ireland EU15 EU27
Figure 33 Level of trust in government
Trust in government has recovered from an all time low
Source: Eurobarometer
Public Sector Trends 2011
48
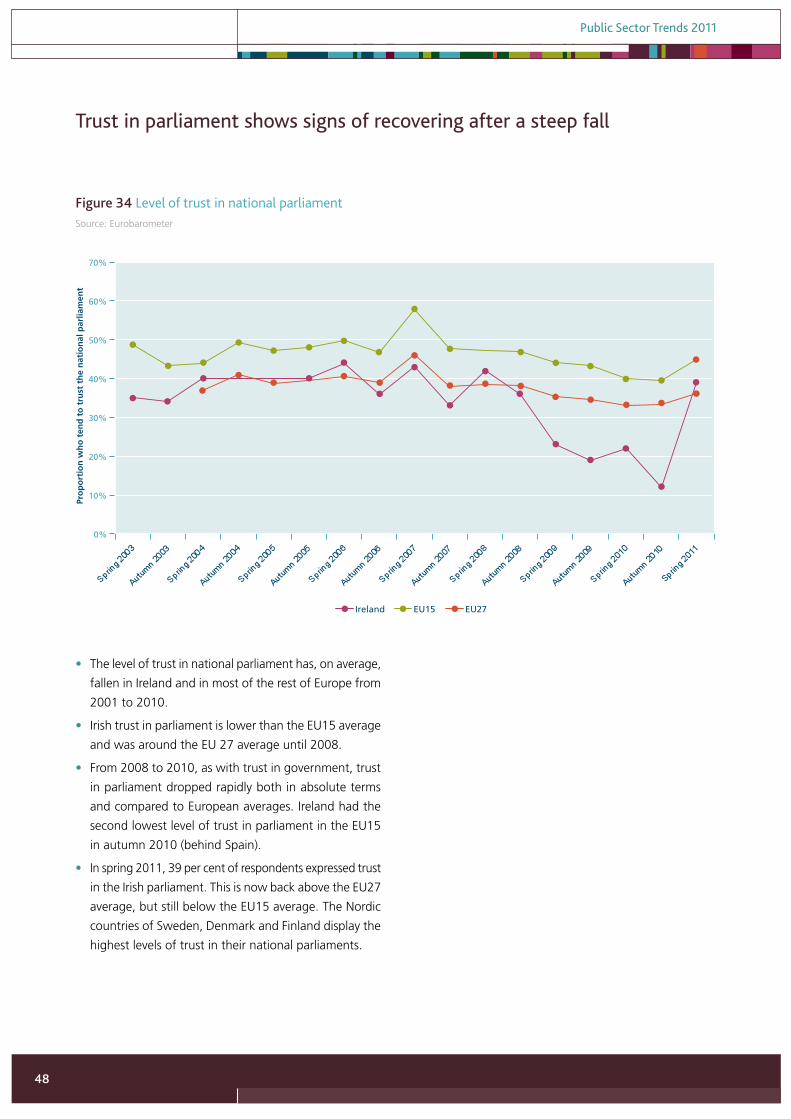
• The level of trust in national parliament has, on average,
fallen in Ireland and in most of the rest of Europe from
2001 to 2010.
• Irish trust in parliament is lower than the EU15 average
and was around the EU 27 average until 2008.
• From 2008 to 2010, as with trust in government, trust
in parliament dropped rapidly both in absolute terms
and compared to European averages. Ireland had the
second lowest level of trust in parliament in the EU15
in autumn 2010 (behind Spain).
• In spring 2011, 39 per cent of respondents expressed trust
in the Irish parliament. This is now back above the EU27
average, but still below the EU15 average. The Nordic
countries of Sweden, Denmark and Finland display the
highest levels of trust in their national parliaments.
0%
10%
20%
30%
40%
50%
60%
70%
Pro
po
rtio
n w
ho
ten
d t
o t
rust
th
e n
atio
nal
par
liam
ent
Figure 34 Level of trust in national parliament
Ireland EU15 EU27
Figure 34 Level of trust in national parliament
Trust in parliament shows signs of recovering after a steep fall
Source: Eurobarometer
Public Sector Trends 2011
49
In terms of overall performance, the data presented
here would tend to suggest that the quality of Ireland’s
public administration remains close to the average for the
European Union. It can be argued that this is a reasonably
creditable and credible position for a small state such as
Ireland, especially as the economic downturn since 2008
has impacted significantly on the figures displayed here
and sets the context for the interpretation of the data
presented.
Indicators based on people’s perceptions of the public
service are clearly influenced by general economic conditions
rather than necessarily any actual change in service. This is
likely to be a reason for a worsening of Ireland’s position
with regard to some of the indicators in the last couple of
years. Nevertheless, such indicators are important in that
perceptions influence how people see Ireland as a place
to live, do business and invest.
Knowing where we rank in Europe can point out areas
where we need to improve, and identify countries we might
learn from. Findings emerging in this light include:
• The growth in public spending is an issue that needs
particular attention. While there are specific factors
associated with support for the banks that affect the 2010
figures, the need for action is clear. The government’s
comprehensive review of expenditure will have an
important role in setting out sustainable levels of public
spending for the coming years.
• However, numbers employed in the public sector, as a
percentage of total employment, are not excessive by
European standards. As numbers are reduced further
to meet fiscal and economic targets, there is a need to
closely examine and plan for the impact on retaining vital
skills, knowledge and capacity in the public service.
• The Exchequer pay and pensions bill has reduced from
its high in 2008. This fiscal discipline will need to be
maintained. Compensation of public servants is an
important element in overall expenditure decisions.
It is interesting to note that compensation rates vary
significantly from top levels to bottom levels in central
government, with a much bigger gap than the Nordic
countries.
• Perceptions of the quality of Irish public administration
suggest particular strengths and limitations compared
to our European partners. Strengths include services to
business, and the provision overall of sound policies and
regulations. Weaknesses include strategic consultation with
interest groups (with the collapse of social partnership),
policy implementation and political oversight. Denmark
and Sweden are particularly strong in these areas.
• Trust in government and parliament has recovered
after falling to an all time low. The active engagement
of citizens in the design, delivery and monitoring of
services can further build trust in government and public
services.
6. Conclusion
Public Sector Trends 2011
50
Afonso, A., L. Schuknecht and V. Tanzi (2003), Public Sector Efficiency: An International Comparison, Working Paper No.
242, Frankfurt: European Central Bank
Bertelsmann Stiftung (2011), Sustainable Governance Indicators 2011, http://www.sgi-network.org/index.php (accessed
September 16 2011)
Boyle, R. (2007), Comparing Public Administrations, Committee for Public Management Research Report No. 7, Dublin:
Institute of Public Administration
Boyle, R. and M. MacCarthaigh (2011), Fit for Purpose? Challenges for Irish Public Administration and Priorities for Public
Service Reform, Dublin: Institute of Public Administration, http://www.ipa.ie/pdf/Fit_For_Purpose_New_Report.pdf (accessed
September 27 2011)
Foley, A. (2009), ‘The size, cost and efficiency of the public service’, Administration, Vol. 57, No. 1, pp69-101
Health Consumer Powerhouse (2009), Euro Health Consumer Index 2009, Health Consumer Powerhouse, http://www.
healthpowerhouse.com/files/Report-EHCI-2009-090925-final-with-cover.pdf (accessed September 20 2011)
OECD (2011), Government at a Glance 2011, Paris: OECD, http://www.oecd.org/gov/indicators/govataglance, (accessed
September 16 2011)
OECD (2010), Public Administration After New Public Management, OECD: Paris
Social and Cultural Planning Office (2004), Public Sector Performance: An International Comparison of Education, Health
Care, Law and Order and Public Administration, The Hague: Social and Cultural Planning Office
References
Public Sector Trends 2011
51
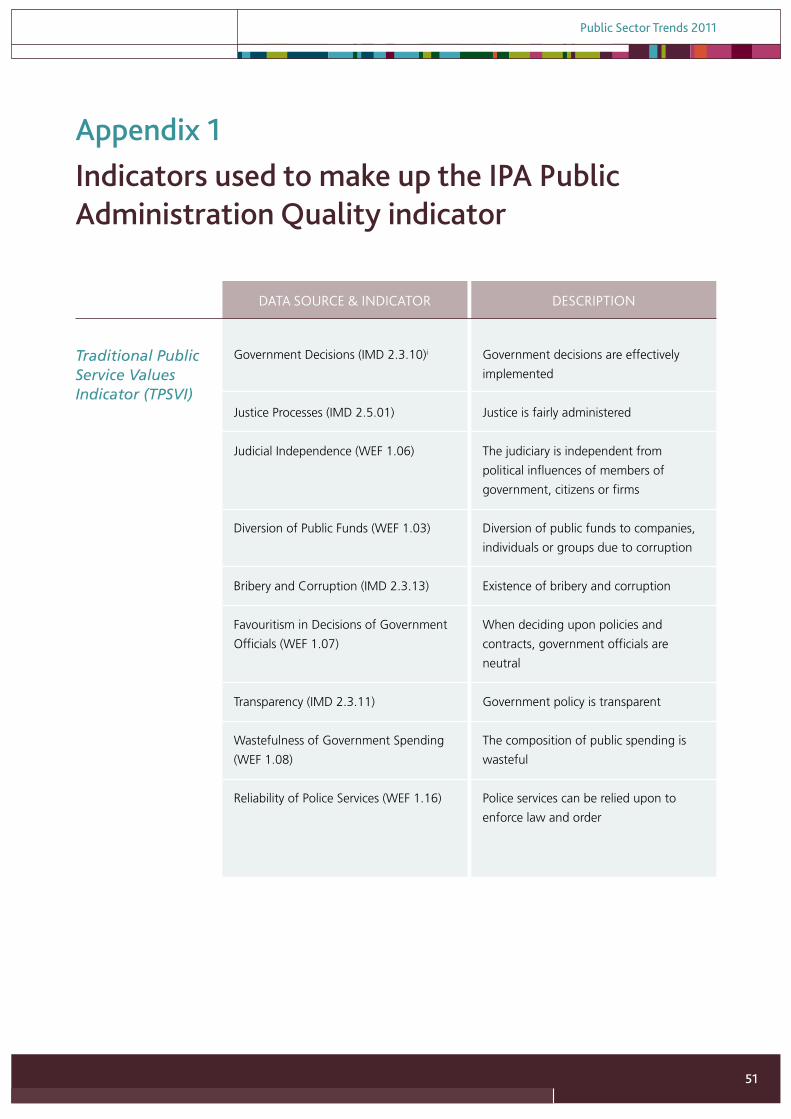
Appendix 1Indicators used to make up the IPA Public Administration Quality indicator
DATA SOURCE & INDICATOR DESCRIPTION
Government Decisions (IMD 2.3.10)i
Justice Processes (IMD 2.5.01)
Judicial Independence (WEF 1.06)
Diversion of Public Funds (WEF 1.03)
Bribery and Corruption (IMD 2.3.13)
Favouritism in Decisions of Government
Officials (WEF 1.07)
Transparency (IMD 2.3.11)
Wastefulness of Government Spending
(WEF 1.08)
Reliability of Police Services (WEF 1.16)
Traditional Public Service Values Indicator (TPSVI)
Government decisions are effectively
implemented
Justice is fairly administered
The judiciary is independent from
political influences of members of
government, citizens or firms
Diversion of public funds to companies,
individuals or groups due to corruption
Existence of bribery and corruption
When deciding upon policies and
contracts, government officials are
neutral
Government policy is transparent
The composition of public spending is
wasteful
Police services can be relied upon to
enforce law and order
Public Sector Trends 2011
52
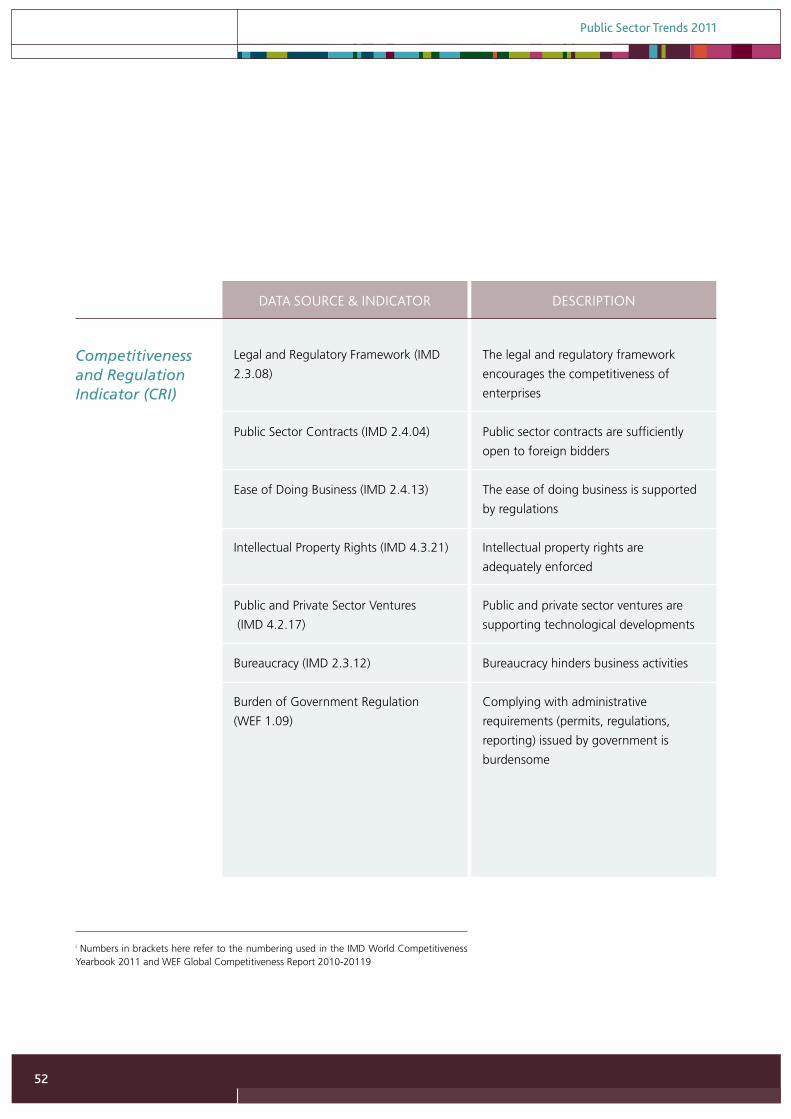
DATA SOURCE & INDICATOR DESCRIPTION
Legal and Regulatory Framework (IMD
2.3.08)
Public Sector Contracts (IMD 2.4.04)
Ease of Doing Business (IMD 2.4.13)
Intellectual Property Rights (IMD 4.3.21)
Public and Private Sector Ventures
(IMD 4.2.17)
Bureaucracy (IMD 2.3.12)
Burden of Government Regulation
(WEF 1.09)
Competitiveness and Regulation Indicator (CRI)
The legal and regulatory framework
encourages the competitiveness of
enterprises
Public sector contracts are sufficiently
open to foreign bidders
The ease of doing business is supported
by regulations
Intellectual property rights are
adequately enforced
Public and private sector ventures are
supporting technological developments
Bureaucracy hinders business activities
Complying with administrative
requirements (permits, regulations,
reporting) issued by government is
burdensome
i Numbers in brackets here refer to the numbering used in the IMD World Competitiveness Yearbook 2011 and WEF Global Competitiveness Report 2010-20119