Embed Size (px)
Citation preview
12
/i
Multimedia Presentation Effects for Immersion
Prof. dr. G.W.Matthias RauterbergIPO, Center for User-System Interaction
Technical University of Eindhoven, The Netherlands[[email protected]]
ing. Fabian HoneggerOnaras Inc., Switzerland[[email protected]]
12
/i
OBJECTIVETo investigate the contribution of different presentation media for getting people immersed into a scene.
=============================Presentation media investigated:* dynamic visual channel* dynamic audio channel* dynamic tactile channel
- vibration- air pressure
12
/i
Test scenario:“sitting and waiting on a station platform while on the next track (in ca 20 m distance) a train enters and passes the station from left to right”
Stimuli material [see E. Stahl (1997) PhD Thesis, ETH No. 12321]:recorded data for 10 seconds in totalvideo: 1024*768 pixel, 250 ANSI lumen, PAL S-VHSaudio: DAT records SONY PCM-2500, HPS-III, HEAD acousticsvibration: Vibrator type GWV46, Gearing & Watson Electronic Inc.
[5 - 2000 Hz, 1 m/s2 acceleration]draught: ordinary table fan, ca 100 cubic feet per minute (cfm)
12
/i
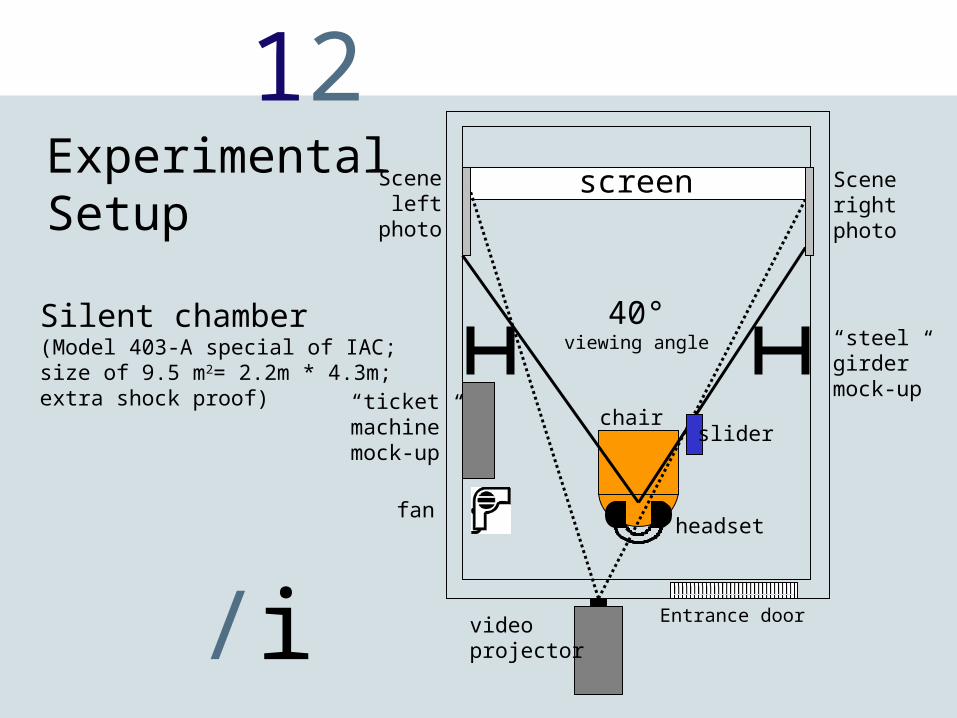
ExperimentalSetup
Silent chamber(Model 403-A special of IAC;size of 9.5 m2= 2.2m * 4.3m;extra shock proof)
screen
Entrance door
“ticketmachine”mock-up
fan
video projector
Sceneleft
photo
Scenerightphoto
chairslider
“steelgirder”mock-up
headset
40°viewing angle
12
/i
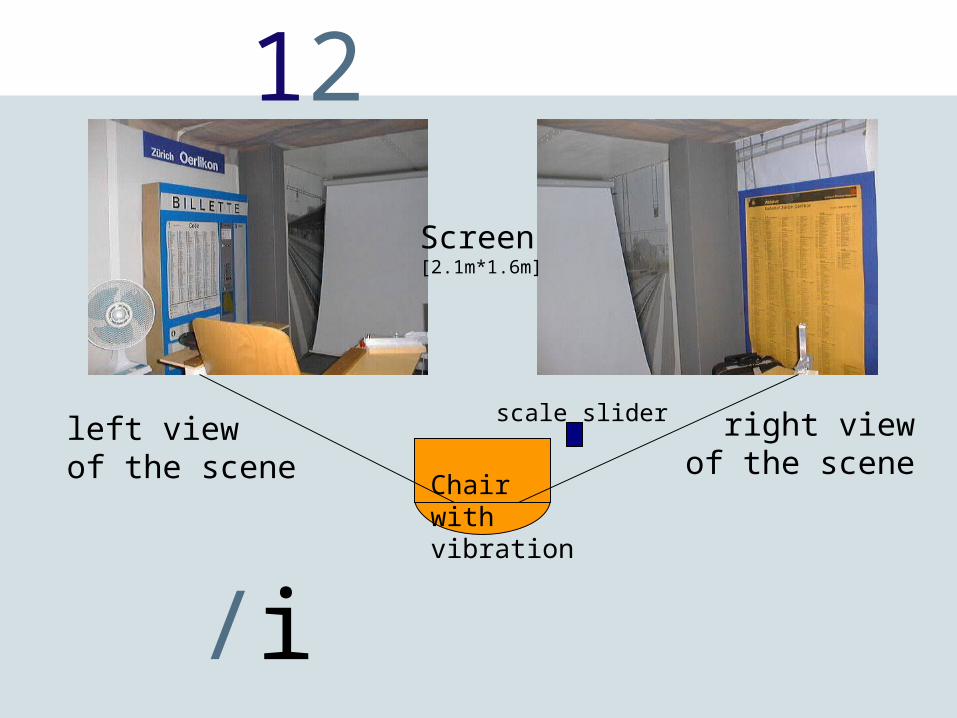
Chairwith vibration
left viewof the scene
right viewof the scene
scale slider
Screen[2.1m*1.6m]
12
/i
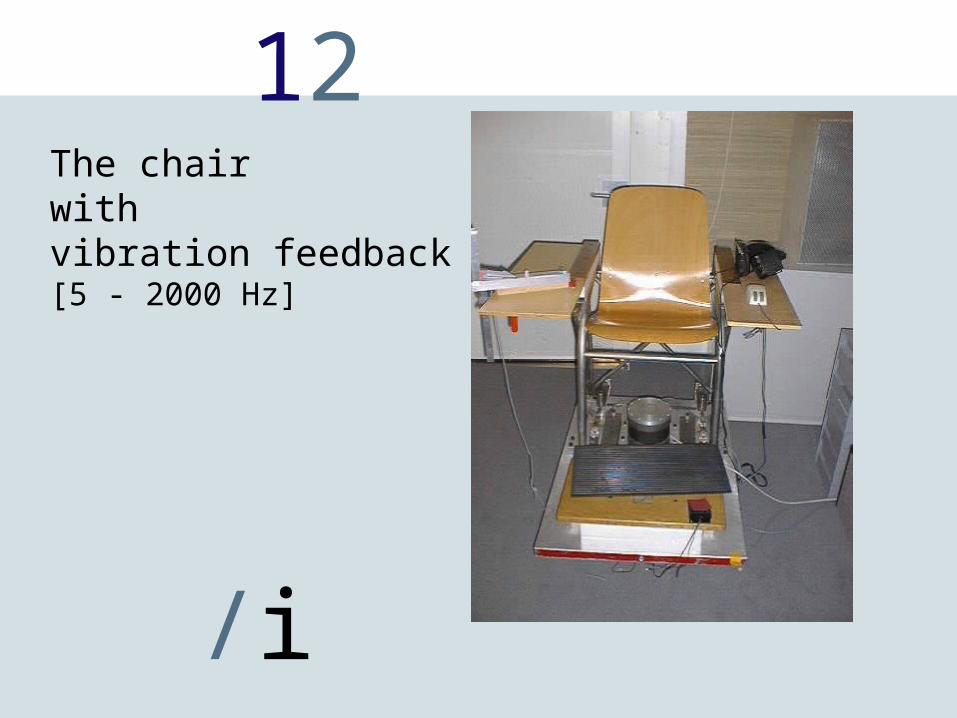
The chair with vibration feedback[5 - 2000 Hz]
12
/i
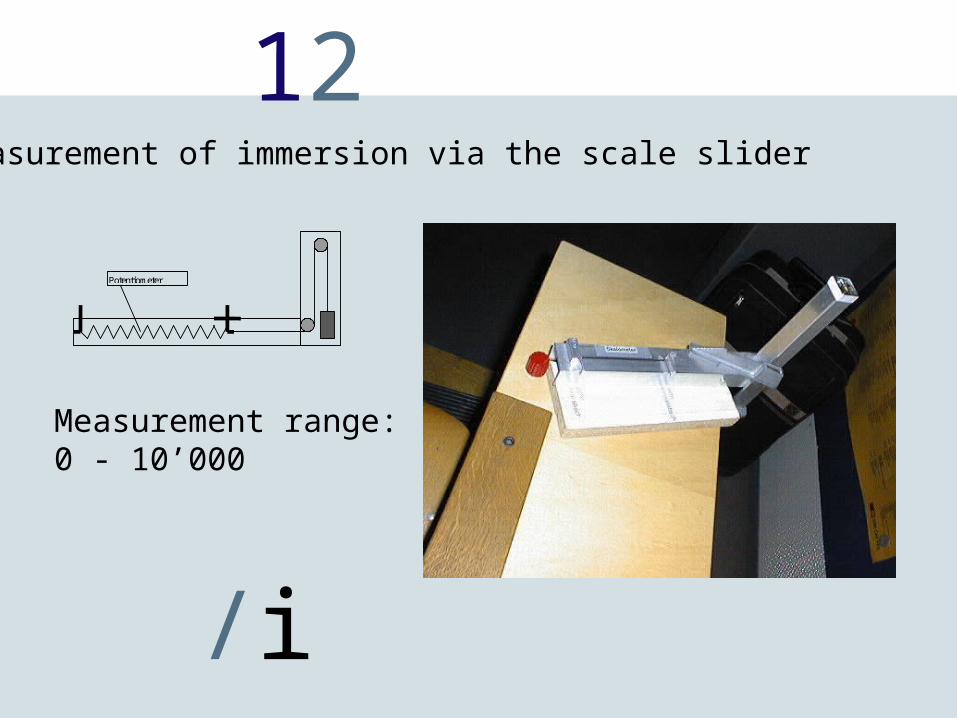
Potentiometer
Measurement of immersion via the scale slider
Measurement range:0 - 10’000
12
/i
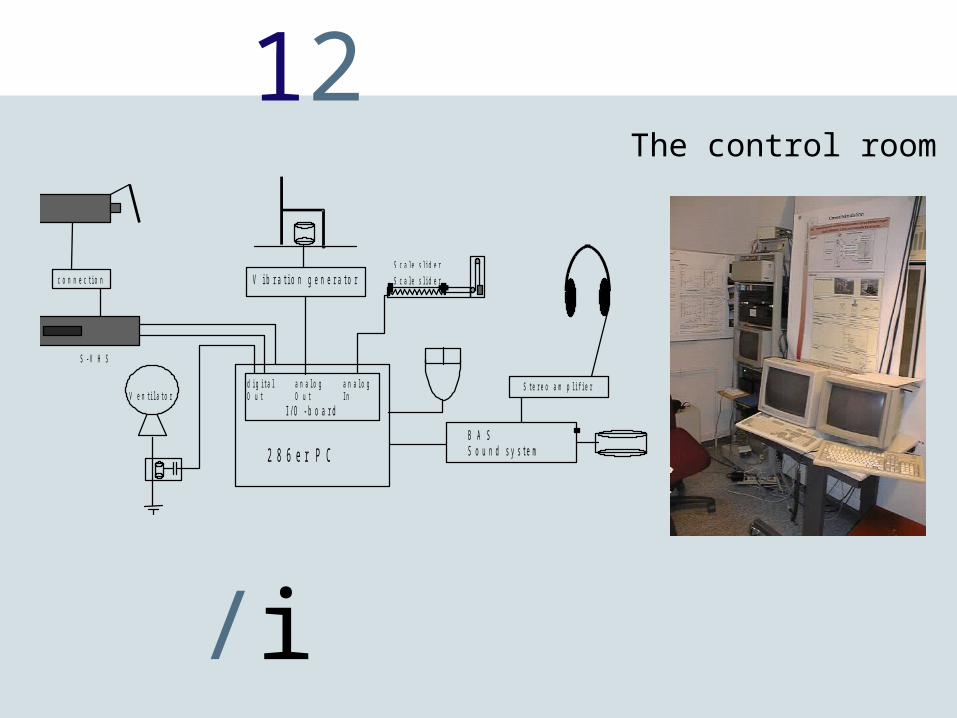
2 8 6 e r P C
d i g i t a l a n a l o g a n a l o gO u t O u t I n
I / O - b o a r d
c o n n e c t i o n
S - V H S
V e n t i l a t o r
V i b r a t i o n g e n e r a t o rS c a l e s l i d e r
S c a l e s l i d e r
B A SS o u n d s y s t e m
S t e r e o a m p l i f i e r
The control room
12
/i
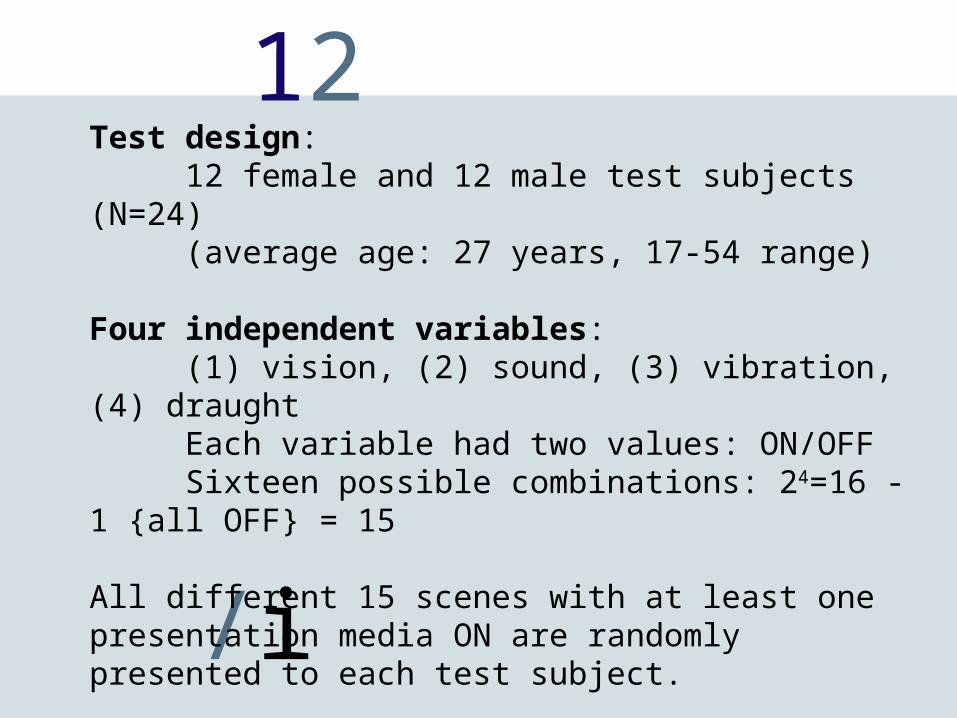
Test design:12 female and 12 male test subjects (N=24)(average age: 27 years, 17-54 range)
Four independent variables:(1) vision, (2) sound, (3) vibration, (4) draughtEach variable had two values: ON/OFFSixteen possible combinations: 24=16 - 1 {all OFF} = 15
All different 15 scenes with at least one presentation media ON are randomly presented to each test subject.
Total sample size: 24 * 15 = 360
12
/i
1 34687317.042 34687317.042 7.632 .0060
1 631251679.594 631251679.594 138.890 <.0001
1 468162.667 468162.667 .103 .7484
1 58174191.260 58174191.260 12.800 .0004
1 2591208.167 2591208.167 .570 .4507
1 1137743.760 1137743.760 .250 .6171
1 3456486.000 3456486.000 .761 .3837
1 14852266.667 14852266.667 3.268 .0715
1 3397913.760 3397913.760 .748 .3878
1 15125700.375 15125700.375 3.328 .0689
1 1272591.760 1272591.760 .280 .5970
1 1763668.167 1763668.167 .388 .5337
1 310878.844 310878.844 .068 .7938
1 4370773.500 4370773.500 .962 .3274
1 1484291.344 1484291.344 .327 .5680
368 1672548804.000 4544969.576
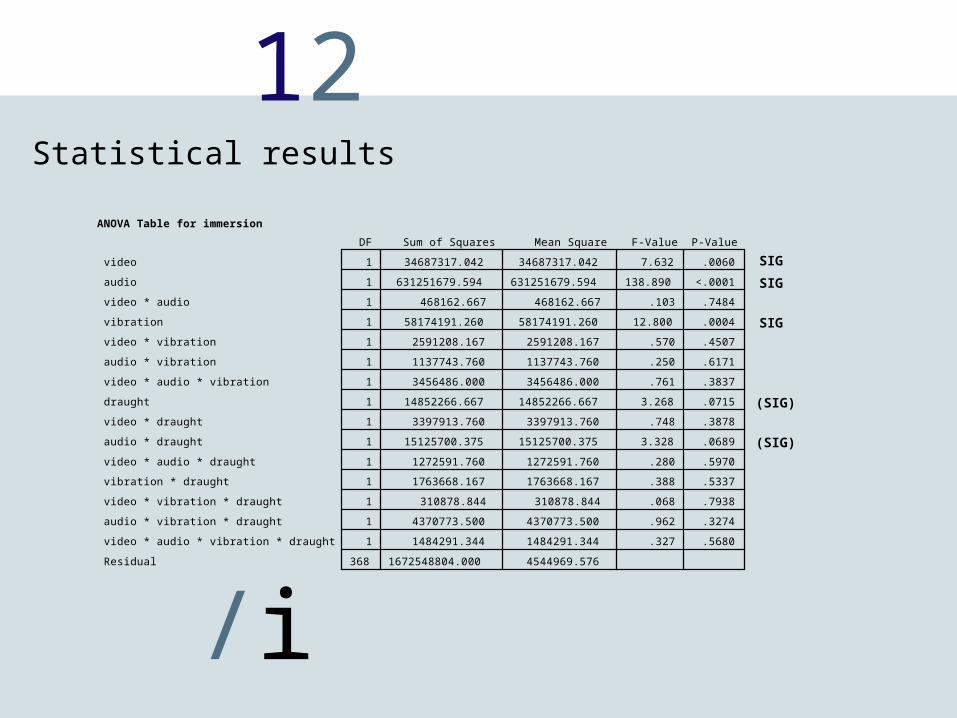
DF Sum of Squares Mean Square F-Value P-Value
video
audio
video * audio
vibration
video * vibration
audio * vibration
video * audio * vibration
draught
video * draught
audio * draught
video * audio * draught
vibration * draught
video * vibration * draught
audio * vibration * draught
video * audio * vibration * draught
Residual
ANOVA Table for immersion
SIG
SIG
SIG
(SIG)
(SIG)
Statistical results
12
/i
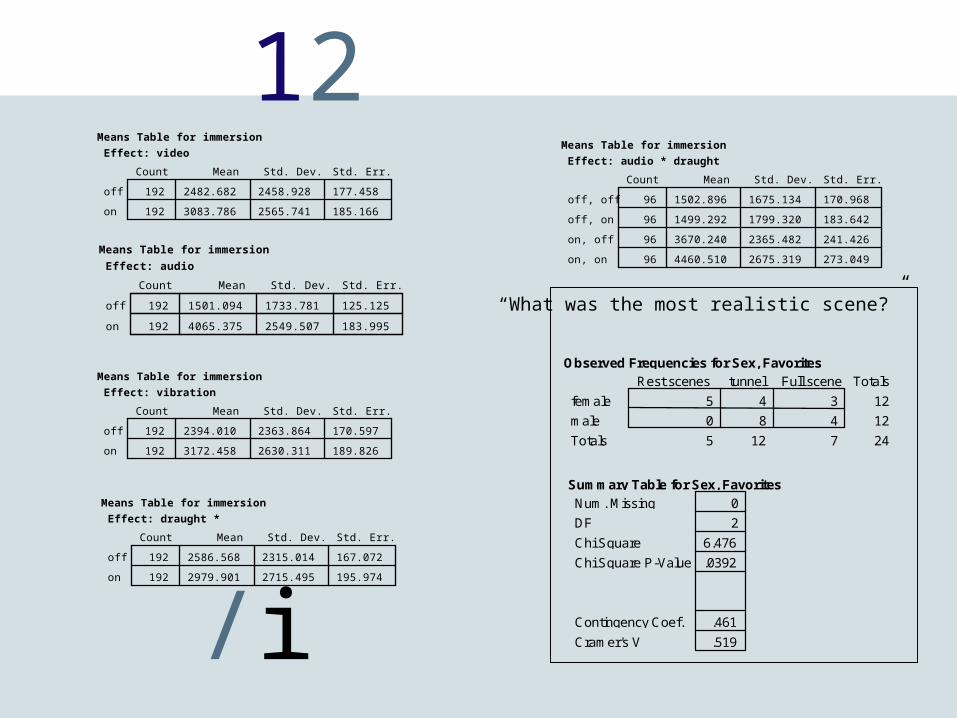
192 2482.682 2458.928 177.458
192 3083.786 2565.741 185.166
Count Mean Std. Dev. Std. Err.
off
on
Means Table for immersion Effect: video
192 1501.094 1733.781 125.125
192 4065.375 2549.507 183.995
Count Mean Std. Dev. Std. Err.
off
on
Means Table for immersion Effect: audio
192 2394.010 2363.864 170.597
192 3172.458 2630.311 189.826
Count Mean Std. Dev. Std. Err.
off
on
Means Table for immersion Effect: vibration
192 2586.568 2315.014 167.072
192 2979.901 2715.495 195.974
Count Mean Std. Dev. Std. Err.
off
on
Means Table for immersion Effect: draught *
96 1502.896 1675.134 170.968
96 1499.292 1799.320 183.642
96 3670.240 2365.482 241.426
96 4460.510 2675.319 273.049
Count Mean Std. Dev. Std. Err.
off, off
off, on
on, off
on, on
Means Table for immersion Effect: audio * draught
5 4 3 12
0 8 4 12
5 12 7 24
Rest scenes tunnel Full scene Totals
female
male
Totals
Observed Frequencies for Sex, Favorites
“What was the most realistic scene?”
0
2
6.476
.0392
.461
.519
Num. Missing
DF
Chi Square
Chi Square P-Value
Contingency Coef.
Cramer's V
Summary Table for Sex, Favorites
12
/i
Conclusions:
• the more media involved, the bigger immersion
• a mapping to a real situation is more important, than just adding different media (e.g. “tunnel”)
• women have different preferences than men
• high quality audio had the most important contribution