Embed Size (px)
Citation preview

1/22/04 © University of Wisconsin, CS559 Spring 2004
Last Time
• Course introduction
• Image basics

1/22/04 © University of Wisconsin, CS559 Spring 2004
Today
• More on digital images
• Introduction to color
• Homework 1
• Programming pre-project 1
1/22/04 © University of Wisconsin, CS559 Spring 2004
Ideal Images
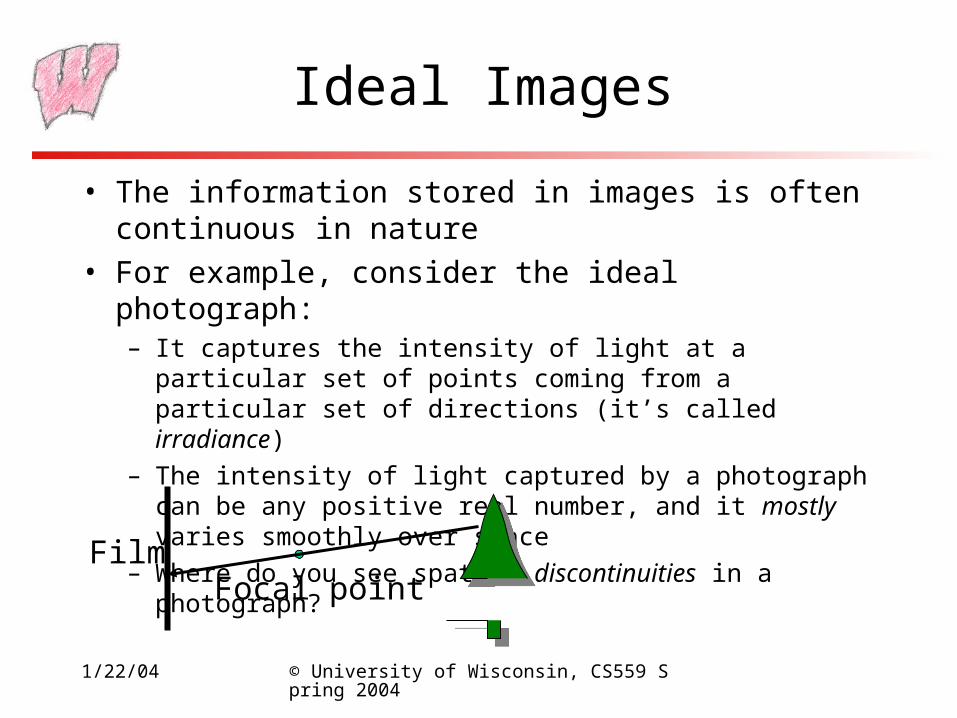
• The information stored in images is often continuous in nature
• For example, consider the ideal photograph:– It captures the intensity of light at a particular set of points coming
from a particular set of directions (it’s called irradiance)
– The intensity of light captured by a photograph can be any positive real number, and it mostly varies smoothly over space
– Where do you see spatial discontinuities in a photograph?
FilmFocal point

1/22/04 © University of Wisconsin, CS559 Spring 2004
Digital Images
• Computers work with discrete pieces of information• How do we digitize a continuous image?
– Break the continuous space into small areas, pixels– Use a single value for each pixel - the pixel value (no color, yet)– No longer continuous in space or intensity
• This process is fraught with danger, as we shall see
Continuous
Discrete
Pixels: Picture Elements

1/22/04 © University of Wisconsin, CS559 Spring 2004
Digital Cameras
• CCD stores a charge each time a photon hits it– “Bins” have discrete area, one per pixel
– Spatially discrete
• Camera “reads” the charges out of the bins at some frequency
• Convert charges to discrete value– Discrete in intensity
• Store values in memory - the image
Light in
Lens
CCD
1/22/04 © University of Wisconsin, CS559 Spring 2004
Photography
• Can you make an arbitrarily large print of a digital image?
• Hence, does it record continuous information accurately?– Resolution determines how much information is recorded
• Can you take a photograph of a really bright thing?
• Can you take a photograph of a really dark thing?
• Can you take a photograph with light and dark things at the same time?– The ratio of the brightest thing to the darkest thing you can capture
is called dynamic range

1/22/04 © University of Wisconsin, CS559 Spring 2004
Discretization Issues
• Can only store a finite number of pixels– Choose your target physical image size, choose your resolution (pixels per
inch, or dots per inch, dpi), determine width/height necessary
– Storage space goes up with square of resolution• 600dpi has 4× more pixels than 300dpi
• Can only store a finite range of intensity values– Typically referred to as depth - number of bits per pixel
• Directly related to the number of colors available and typically little choice
• Most common depth is 8, but can also get 16 for grey
– Also concerned with the minimum and maximum intensity – dynamic range
• The big question is: What is enough resolution and enough depth?

1/22/04 © University of Wisconsin, CS559 Spring 2004
Perceptual Issues
• Spatially, humans can discriminate about ½ a minute of arc– At fovea, so only in center of view, 20/20 vision
– At 1m, about 0.2mm (“Dot Pitch” of monitors)
– Sometimes limits the required number of pixels
• Humans can discriminate about 8 bits of intensity– “Just Noticeable Difference” experiments
– Limits the required depth for typical dynamic ranges
– Actually, it’s 9 bits, but 8 is far more convenient
• BUT, while perception can guide resolution requirements for display, when manipulating images much higher resolution may be required

1/22/04 © University of Wisconsin, CS559 Spring 2004
Intensity Perception
• Humans are actually tuned to the ratio of intensities, not their absolute difference– So going from a 50 to 100 Watt light bulb looks the same as going
from 100 to 200
– So, if we only have 4 intensities, between 0 and 1, we should choose to use 0, 0.25, 0.5 and 1
• Most computer graphics ignores this, giving poorer perceptible intensity resolution at low light levels, and better resolution at high light levels– It would use 0, 0.33, 0.66, and 1
1/22/04 © University of Wisconsin, CS559 Spring 2004
Dynamic Range
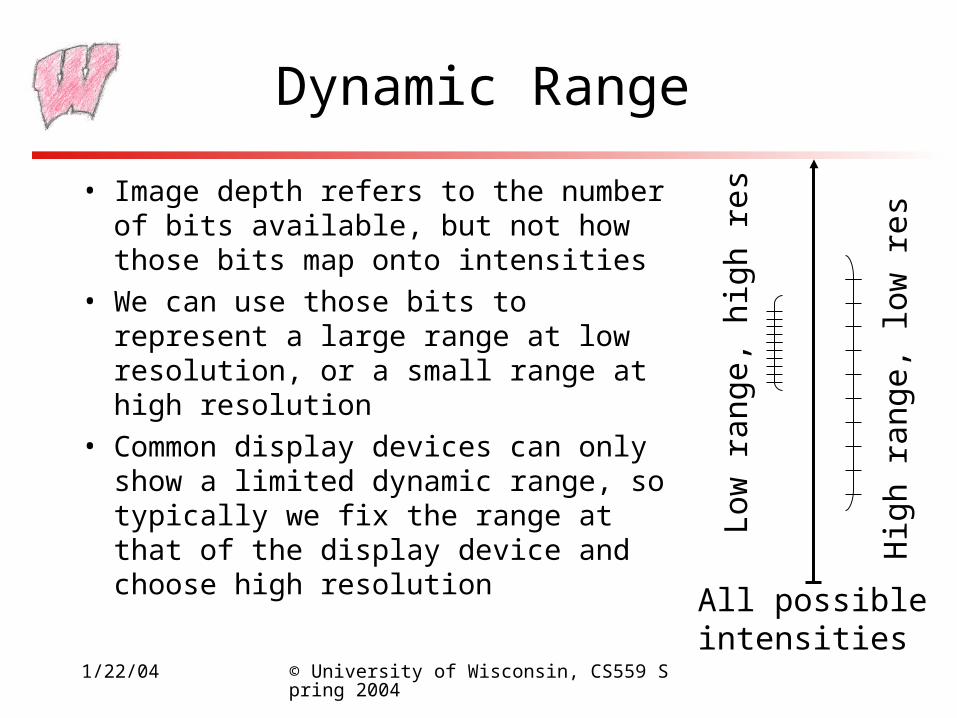
• Image depth refers to the number of bits available, but not how those bits map onto intensities
• We can use those bits to represent a large range at low resolution, or a small range at high resolution
• Common display devices can only show a limited dynamic range, so typically we fix the range at that of the display device and choose high resolution
All possibleintensities
Low
ran
ge, h
igh
res
Hig
h ra
nge,
low
res
1/22/04 © University of Wisconsin, CS559 Spring 2004
More Dynamic Range
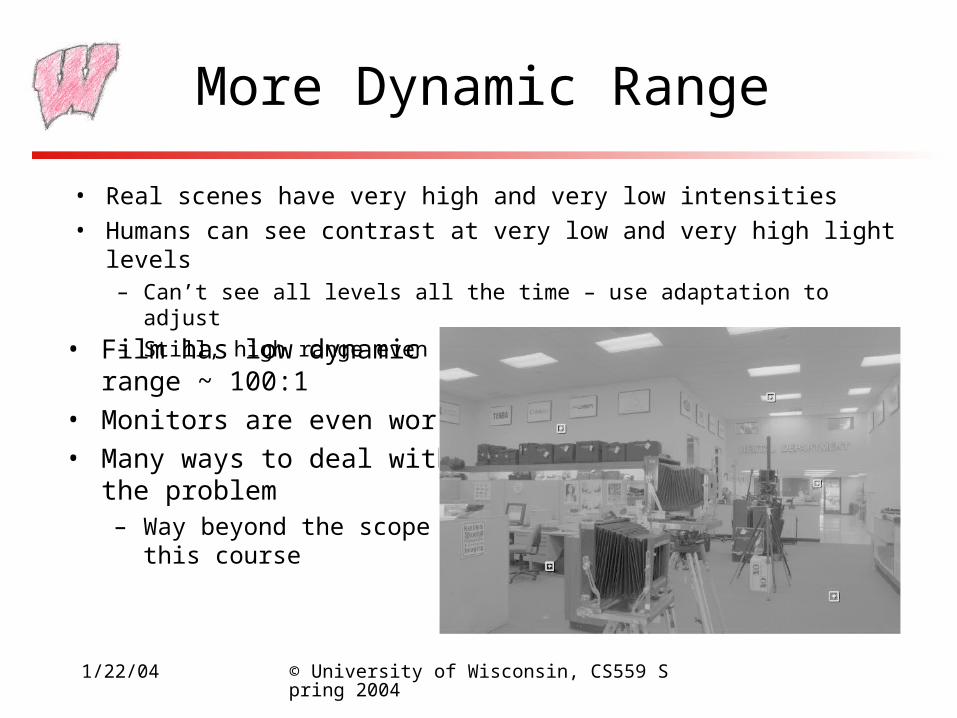
• Real scenes have very high and very low intensities
• Humans can see contrast at very low and very high light levels– Can’t see all levels all the time – use adaptation to adjust
– Still, high range even at one adaptation level
• Film has low dynamic range ~ 100:1
• Monitors are even worse
• Many ways to deal with the problem– Way beyond the scope of this
course
1/22/04 © University of Wisconsin, CS559 Spring 2004
Display on a Monitor
• When images are created, a linear mapping between pixels and intensity is assumed– For example, if you double the pixel value, the displayed intensity
should double
• Monitors, however, do not work that way– For analog monitors, the pixel value is converted to a voltage– The voltage is used to control the intensity of the monitor pixels– But the voltage to display intensity is not linear– Same problem with other monitors, different causes
• The outcome: A linear intensity scale in memory does not look linear on a monitor
• Even worse, different monitors do different things

1/22/04 © University of Wisconsin, CS559 Spring 2004
Gamma Control
• The mapping from voltage to display is usually an exponential function:
• To correct the problem, we pass the pixel values through a gamma function before converting them to the monitor
• This process is called gamma correction
• The parameter, , is controlled by the user– It should be matched to a particular monitor
– Typical values are between 2.2 and 2.5
• The mapping can be done in hardware or software
monitortodisplay II
1
imagemonitorto II
1/22/04 © University of Wisconsin, CS559 Spring 2004
Some Facts About Color
• So far we have only discussed intensities, so called achromatic light (black and white)
• Accurate color reproduction is commercially valuable - e.g. painting a house, producing artwork
• Of the order of 10 color names are widely recognized by English speakers - other languages have fewer/more, but not much more
• Online commerce has accentuated color reproduction issues, as has the creation of digital libraries
• Color consistency is also important in user interfaces, eg: what you see on the monitor should match the printed version

1/22/04 © University of Wisconsin, CS559 Spring 2004
Light and Color
• The frequency of light determines its “color”– Frequency, wavelength, energy all related
• Describe incoming light by a spectrum– Intensity of light at each frequency
– Just like a graph of intensity vs. frequency
• We care about wavelengths in the visible spectrum: between the infra-red (700nm) and the ultra-violet (400nm)
1/22/04 © University of Wisconsin, CS559 Spring 2004
White
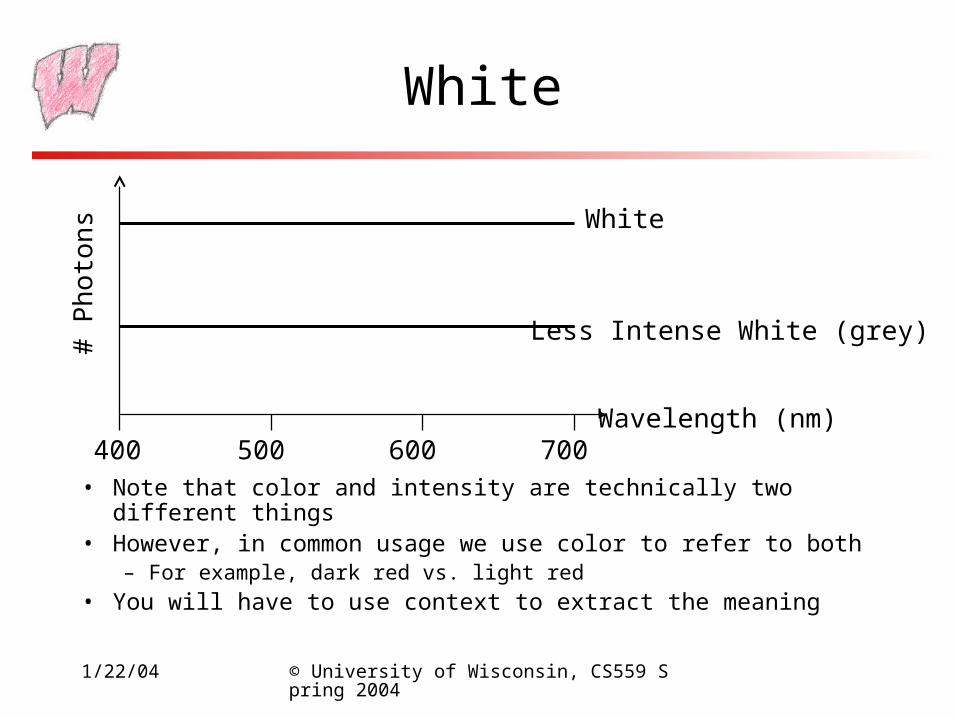
• Note that color and intensity are technically two different things• However, in common usage we use color to refer to both
– For example, dark red vs. light red
• You will have to use context to extract the meaning
# P
hoto
ns
Wavelength (nm)400 500 600 700
White
Less Intense White (grey)
1/22/04 © University of Wisconsin, CS559 Spring 2004
Helium Neon Laser
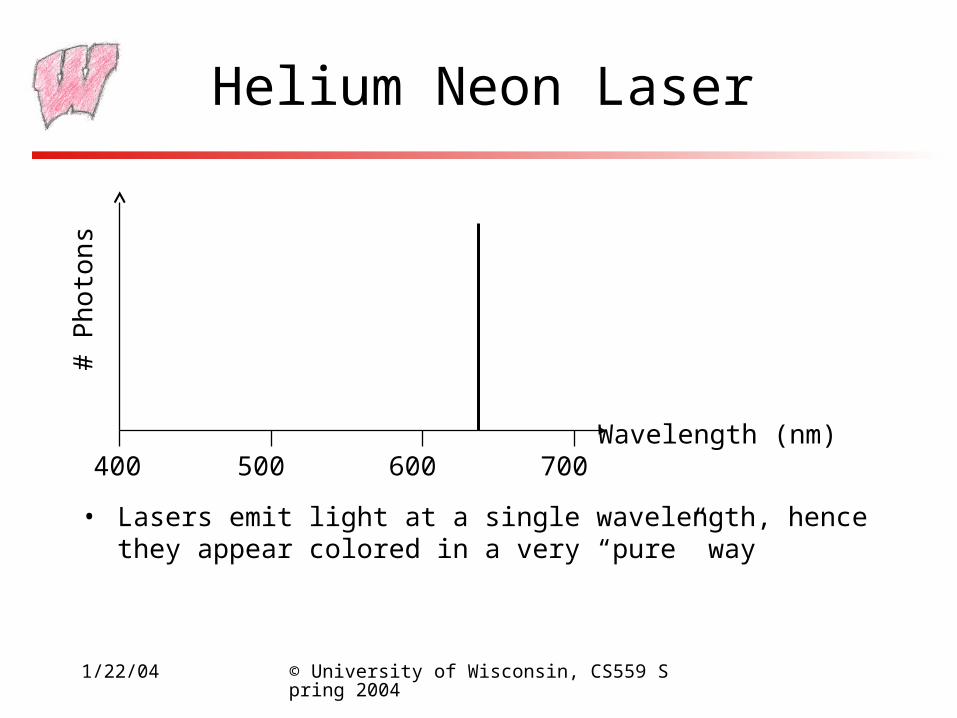
• Lasers emit light at a single wavelength, hence they appear colored in a very “pure” way
# P
hoto
ns
Wavelength (nm)400 500 600 700

1/22/04 © University of Wisconsin, CS559 Spring 2004
Normal Daylight#
Pho
tons
Wavelength (nm)400 500 600 700
• The sky is blue, so what should this look like?

1/22/04 © University of Wisconsin, CS559 Spring 2004
Tungsten Lightbulb
• Most light sources are not anywhere near white
• It is a major research effort to develop light sources with particular properties
# P
hoto
ns
Wavelength (nm)400 500 600 700

1/22/04 © University of Wisconsin, CS559 Spring 2004
Adsorption spectra: Red Paint
• Red paint absorbs green and blue wavelengths, and reflects red wavelengths, resulting in you seeing a red appearance
• Adsorption spectra talk about how light is absorbed by a surface and re-emitted
# P
hoto
ns
Wavelength (nm)400 500 600 700

1/22/04 © University of Wisconsin, CS559 Spring 2004
Key Concepts
• Images are discrete
• Dynamic range
• Gamma
• Spectra as the physical representation for color
• Sensors and frequency response