Embed Size (px)
Citation preview
Ind
ustr
ial M
iner
als
1
2002 saw the end of an era with mining in
its present form in the open pit coming to
an end at precisely 14:45 on Thursday,
25 April 2002. The detonator to ignite
64 000 kg of explosives to blast 166 000
tons of ore was activated at bench 60 in the
Palabora open pit. It signified the end of an
era and the transition from an open cast
mine to an underground operation.

2
Scenic view over Foskor-thickener with the Palabora shafts in the backgroundScenic view over Foskor-thickener with the Palabora shafts in the background
Group o perations in brief
PALABORA MIN ING COMPANY IS SOUTH AFR ICA’S LARGEST
PRODUCER OF REFINED COPPER.
PRODUCT
THE COMPANY PRODUCES COPPER AS A PR IMARY PRODUCT
TOGETHER WITH BY-PRODUCTS, WHICH INCLUDE MAGNETITE,
N ICKEL SULPHATE , ANODE SL IMES AND SULPHUR IC AC ID .
INDUSTRIAL MINERALS PRODUCTION COMPRISES VERMICULITE,
AND ZIRCONIUM BASIC SULPHATE (ZBS) .
OPERATIONS
THE COPPER D IV IS ION COMPRISES AN OPEN-P IT AND
UNDERGROUND MINING OPERATION, A CONCENTRATOR CAPABLE
OF MILLING 80000 TONS OF ORE PER DAY, A COPPER SMELTER
WITH ANODE CASTING FACIL IT IES AND AN ASSOCIATED ACID
PLANT, AN ELECTROLYT IC REF INERY TANK HOUSE , A ROD
CASTING PLANT AND BY-PRODUCT RECOVERY PLANTS.
THE INDUSTRIAL MINERALS DIVIS ION COMPRISES AN ADJACENT
OPEN-P IT VERMICUL ITE MIN ING OPERAT ION AND RECOVERY
PLANT, AND A NEW ZIRCONIUM BASIC SULPHATE PRODUCTION
PLANT, WHICH USES IMPORTED ZIRCON SAND AS A FEEDSTOCK.
OVERSEAS SUBSIDIARIES IN THE UNITED STATES OF AMERICA,
THE UNITED KINGDOM AND SINGAPORE ARE INVOLVED WITH THE
SELLING OF INDUSTRIAL MINERAL PRODUCTS.

3
Financial
and o perational
highligh ts
2002 2001
Share performance
Rand per share
Headline earnings 8,39 7,75
Dividends declared — 0,60
Cash available from operations 20,80 27,24
Interests of shareholders
(net asset value) 70,96 63,31
Market price
High 76,00 65,50
Low 58,50 34,00
Financial
R million
Revenue 2 121 1 985
Distributable earnings 257 220
Headline earnings 237 219
Shareholders’ equity 2 009 1 793
Capital expenditure 695 702
Production
000 metric tons
Material mined 9 976 12 002
Ore milled 9 933 14 522
Concentrate produced
(new copper content) 52 78
Cathode produced 81 87
Sales
000 metric tons
Cathode sold 83 96
Concentrate sold (copper content) 10 4
Employees 2 011 2 428
(tons are metric tons)
160
140
120
100
80
60
40
20
081
Tons
Actual Indicative
99 01
Copper produced (thousand tons)
Material mined (million tons)
2002
Production perspective 1981 - 2002
Palabora Mining Company LimitedRegistered in the Republic of South Africa
Reg No. 1956/002134/0647th Annual Report 2002
4
DIRECTORS
Chairman
Z W Ntuli (57) (Resigned 31 December 2002)
J H K Sachikonye (48) (Zimbabwean)
Appointed with effect from 1 January 2003
(Acting non-executive Chairman)
EXECUTIVE
Managing Director
D S Sadler (54) (Australian)
Appointed 21 August 2000
General Manager and Chief Financial Officer –
Finance Compliance and Administration
M D Humphries (48) Appointed 4 May 2000
General Manager – External Affairs
S Langa (49) Appointed 24 April 2002
NON-EXECUTIVE
D A Farnaby (38) Appointed 1 July 2000
O L Groeneveld (Australian) (49)
Appointed 20 April 1999
R M Maruma (43) Appointed 29 April 1999
G M Negota (51) Appointed 20 May 1998
J E Rickus (55) (British) Appointed 17 February 2000
R M Whyte (59) (British) Appointed 5 September 2000
J C M van Gaalen (46) (Dutch)
Appointed 24 January 2002
C N Zungu (47) Appointed 24 April 2002
ALTERNATE DIRECTORS
F B Weldon (55) Appointed 8 August 2002
B K Wood (52) Appointed 24 January 2002
W R J Ranson (37) Appointed 11 March 2003
MANAGEMENT
General Manager – Underground Mining Project
K P P Calder (until 31 December 2002)
K J McLeish (with effect 1 January 2003)
General Manager – Copper Operations
H J R Kenyon-Slaney
General Manager – Industrial Minerals
A S Siregar (until 31 December 2002)
L du Plessis (with effect 1 January 2003)
General Manager – Asset Management
K J McLeish (until 31 December 2002)
B Iqani (Acting) (with effect 1 January 2003)
General Manager – Safety, Health, Environment and
Quality
A Grundling
Company Secretary
E B R Hone
Directorate and management
PALABORA MINING COMPANY LIMITED

PALABORA MINING COMPANY LIMITED
5
Directorate
EXECUTIVE DIRECTORsDavid S Sadler (54) was appointed managingdirector in August 2000. A metallurgist with aMSc in Metallurgical Quality Control/Statistics and a BSc in Metallurgy, he has heldvarious managerial positions within the RioTinto Group in Australia and London since1984. He came to Palabora from Londonwhere he was safety adviser to the ChiefExecutive of Rio Tinto plc
Michael (Mike) D Humphries (48) is thegeneral manager for Finance and HumanResources. He joined Palabora in May 2000when he was appointed to the board. He hasheld previous managerial positions within theRio Tinto Group in Namibia and Portugal andelsewhere in the mining industry over aperiod of years. Mr Humphries has a BCommand MBA degrees from the University ofCape Town. He is a chartered accountant andis a member of the South African Institute ofChartered Accountants and AAPA (des).
Simeon Langa (49) is the general managerfor External Affairs. He joined Palabora inSeptember 1987 as a personnel officer. He was promoted within the Company untilhe was appointed general manager – HumanResources in 1999. In 2002 he moved fromhuman resources to external affairs and wasappointed as an executive director in April2002. Mr Langa has a BComm degree fromthe University of the North and an honoursdegree in Business Administration andManagement from the University ofStellenbosch, Business School.
NON-EXECUTIVE DIRECTORS Deborah (Debbie) A Farnaby (38) is anindependent non-executive director havingbeen appointed to the board in July 2000.Mrs Farnaby is the director: GroupInformation Technologies and Services forSappi Limited as well as a non-executivedirector on the Sappi Fine Paper Europeanboard. She is also a Trustee for the SappiProvident Fund. She has held variouspositions within Sappi since 1989. She has aBSc (Hons) Computer Science degree fromthe University of the Witwatersrand and aMSc Computer Science (Cum Laude) degreefrom the University of Stellenbosch as well asa GDE (Mechanical Engineering) qualification.
Oscar L Groeneveld (49) became a directorin April 1999. Mr Groeneveld has been adirector of Rio Tinto plc since 1998. A miningengineer with qualifications in engineering,science and management, he joined the Rio Tinto Group in 1975 and has since held aseries of management positions, includinghead of Technology, before being appointedchief executive of the Copper Group of Rio Tinto in 1999. He is also a director ofFreeport-McMoRan Copper & Gold INC.
Makgabo (Rufus) R Maruma (43) has beenan independent non-executive directorsince April 1999. Mr Maruma is a leadingenvironmental and waste managementexpert and has reviewed environmentalprogrammes for leading utilities andindustries in over forty six countries. He isthe chairman and a director of a number ofcompanies, including Enviroserv Holdings,Stewart Scott International, BohlwekiEnvironmental, Amafaun Faun, Pan AfricanShop Fitters, Group Five Limited, Geo Scottand Bakwena Concession Company. He waschairman of the task team that drew up anational environmental policy for SouthAfrica (CONNEP) and also serves on anumber of committees, including theConservation Advisory Committee of SouthAfrica. Mr Maruma holds a MSc degree inEnvironmental Science from the Universityof Aberdeen.
George M Negota ( 51) was appointed anindependent non- executive director in May1998. He is a practising attorney. Mr Negotastarted a legal firm, Negota IncorporatedAttorneys in June 1998. He has conducted anumber of commissions of enquiry on behalfof government. He has led a team thatrestructured Eskom and has also conducteda study on the rationalization of state assetsin Mpumalanga. He is currently involved inthe research study in preparation for theGauteng express train. He is chairman of theCross Border Transport Agency and of the Gauteng Operating Licence Board andKuthele Projects (Pty) Limited. He is adirector of the N3 Consortium, ORT StepSouth Africa, Read Education Trust, theNational Institute for Community Educationand BKS Group Holdings (Pty) Limited. Mr Negota is also a member of the IncomeTax Appeal Court. He has BA (Hons) and MCom degrees from Rand AfrikaansUniversity, a LLB and a BCom (Hons)degrees from Unisa. In addition Mr Negotahas a H Diploma in Tax Law and a H Diploma in Company Law fromWitwatersrand University and a certificate inTax Law from Unisa.
Directorate
6
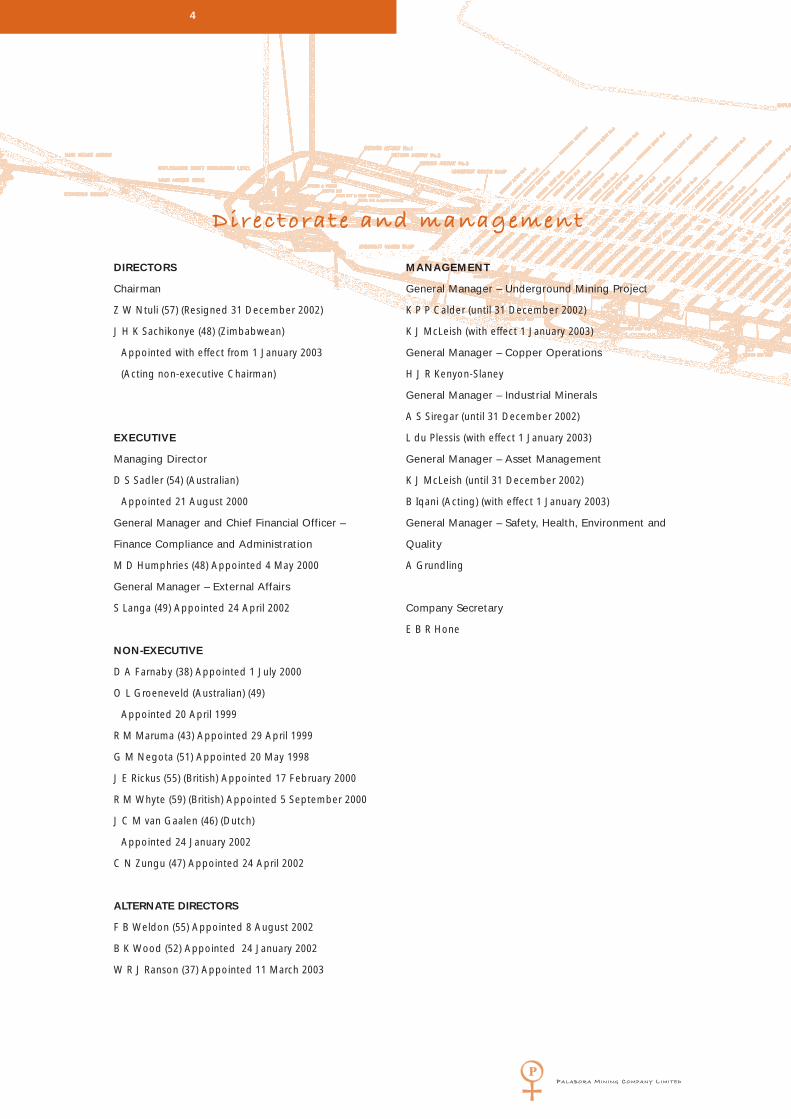
John E Rickus (55) is a geologist. He wasappointed a non-executive director inFebruary 2000. He has been employed by theRio Tinto group since 1984 and has workedworldwide as a geological consultant andlater as managing director of RTZ TechnicalServices Limited, the Company providingtechnical input to Rio Tinto projects. He currently is based in London and is amining executive for the Rio Tinto CopperGroup. He has a BSc Honours degree inGeology from Liverpool University. He is aChartered Engineer (CEng) and is a fellow ofthe Institution of Mining and Metallurgy anda Fellow of the Australasian Institute ofMining and Metallurgy.
Josephat (Josh) H K Sachikonye (48) hasbeen the acting non-executive chairman ofthe Company since 1 January 2003 upon theretirement of Mr Z W Ntuli. He wasappointed a director and deputy chairman inJanuary 2002. He is the executive directorOperations for the Rio Tinto Zimbabwegroup and sits on a number of boards ofZimbabwean companies. He has had 23 yearsservice with the Rio Tinto group. Mr Sachikonye is a past president of theInstitute of Chartered ManagementAccountants of Zimbabwe. He has a Bachelorof Accountancy Honours (Bacc Hons) degreefrom the University of Zimbabwe and aMasters of Business Leadership (MBL) degreefrom UNISA. He is also a charteredmanagement accountant and has a diplomafrom the Institute of Marketing in the UnitedKingdom.
Johannes (Jan Kees) C M van Gaalen (46)was appointed a non-executive director inJanuary 2002. He studied economics at theErasmus University in Rotterdam and has anMBA from the ISA at Jouy-en Josas in France.He held several financial positions withSchlumberger Limited during 1981 to 1989. In April 1994 he moved to London as groupfinance director of Carlton HomeEntertainment, a subsidiary of CarltonCommunications plc. In August 1996 hejoined Minorco as chief financial officer of theSalobo Metais project, based in Rio deJaneiro. In 1998 he moved to Minorco’sregional office in Sao Paulo focusing onmarketing, administration and finance. He iscurrently vice president – Base MetalsDivision for Anglo American plc based inJohannesburg. He is also a non-executivedirector of Anaconda Nickel Limited.
Rodney (Rod) M Whyte (59) has been a non-executive director since September2000. He is the deputy technical director(Metallurgy) for Anglo American plc. Mr Whyte has been with the Anglo AmericanGroup since 1978. He has a BSC (Hons)degree in Chemical Engineering from LeedsUniversity in the United Kingdom. He alsohas a MDP diploma from UNISA. He is aChartered Engineer (CEng), a member of theInstitute of Chemical Engineering, a memberof the Institute of Mining and Metallurgy inthe United Kingdom and a fellow of theSouth African Institute of Mining andMetallurgy.
Clifford N Zungu (47) was appointed a non-executive director in April 2002. His career todate has been in marketing and service–driven corporations. He has held variouspositions with BP Southern Africa, CG SmithSugar, Engen Petroleum and Avis Rent a Car.He is currently general manager – peoplemanagement for South African EagleInsurance in Johannesburg. Mr Zungu has aBComm degree from the University ofZululand and attended the GraduateAdvancement Programme (GAP) at WitsBusiness School in 1982, the IndustrialRelations Development Programme (RDP) atthe Stellenbosch School of BusinessLeadership in 1991 and the AdvancedExecutive Programme (AEP) at the UnisaSchool of Business Leadership in 1997.
ALTERNATE DIRECTORSWarrick RJ Ranson (37) was appointed as analternate director to John Rickus on 11 March2003. Mr Ranson joined Rio Tinto followingits acquisition of North Limited in 2000. He holds a degree in accounting and is aFellow of the Institute of CharteredAccountants in Australia. He has held anumber of senior financial and managementpositions, relocating to London in 2002 asFinance Executive for Rio Tinto’s copper andbase metal interests.
Francis (Frank) B Weldon (55) wasappointed alternate to Mr R M Whyte inAugust 2002. He is a mining engineer andhas a MSc Engineering degree from theWitwatersrand University. He has served withAnglo American for the past 23 years in theCoal and Base Metal divisions, in miningmanagement and group technical positions.He currently is a member of the managementcommittees of Black Mountain, NamakwaSands, Lisheen (Ireland), HBMS (Canada) andSkorpion (Namibia). Previous to AngloAmerican, Mr Weldon spent four years inWits type gold mining and twelve years withbase metal mining operations in Namibia.
PALABORA MINING COMPANY LIMITED

PALABORA MINING COMPANY LIMITED
7
Directorate and management
Brian K Wood (52) has been an alternatedirector since July 2001. He was firstlyalternate to Mr R M Whyte and then inJanuary 2002 he was appointed alternate toMr J C M van Gaalen. Mr Wood has had 27 years service with Anglo American plc inthe financial area, including financial andmanagement accounting in AngloCoal andAngloBase Divisions. He is currently vicepresident, finance and administration in theAngloBase Division in Johannesburg. He hasa CA (SA) qualification and is a member ofthe SA Institute of Chartered Accountants(SAICA).
MANAGEMENT The Company is managed by an executivecommittee comprising the managing director,Mr D S Sadler, the two executive directors,Mr M D Humphries who is the generalmanager – Finance, Mr S Langa, the generalmanager – External Affairs and five generalmanagers. The post of general manager –Asset Management is being filled by Mr B Iqani in an acting capacity since thebeginning of 2003 until a permanentappointment is made. The remaining fourcurrent members are:
Louis du Plessis (48) was appointed generalmanager – Industrial Minerals in January2003. He is accountable for the productionand marketing of vermiculite and zirconiumbasic sulphate (ZBS). Mr Du Plessis is ageologist and holds a BSc Hons. degree inGeology from Witwatersrand University and aMBL degree from the University of SouthAfrica. He has been with the Company since1981 and has had management roles intechnical support services and marketing. In 1999 he was seconded to the UnitedKingdom to head up the European sales andmarketing office in Guildford. Mr Du Plessisreturned to South Africa in 2001 to managethe Company’s SAP implementation project.
Andre Grundling (53) has held the positionof general manager – Safety, Health,Environment and Quality since 1999. Prior tothis he managed his own Company by thename of Grundling Environmental Servicesfrom 1997 to 1999. From 1993 to 1996 Mr Grundling was employed by Palabora inthe position of Environmental SciencesSuperintendent. For the period 1983 to 1993he was head of the Atmospheric SciencesDivision of the Atomic Energy Corporation.Mr Grundling has a BSc (Hons) degree inapplied mathematics and meteorology.
Harry J R Kenyon-Slaney (41) who is thegeneral manager – Copper Operations.Mr Kenyon-Slaney was appointed to thisposition in March 2001. He previously heldthe positions of general manager – IndustrialMinerals and marketing director at Palabora,having joined the Company in 1997. Prior tothis Mr Kenyon-Slaney held the positions ofcommercial director – Far East, RTZ MineralServices in London from 1993 to 1997 andManager – New Projects, RTZ MineralServices in London from 1990 to 1993.Between 1984 and 1990 he worked for AngloAmerican initially as a geologist and latterlyin the New Mining Business Division. He hasa BSc degree in Geology as well as aDiploma in Business Management.
Kevin J McLeish (42) was appointed to theposition of general manager – UndergroundMining Project in January 2003. With theintegration of the underground project withthe surface operations, the title of projectdirector has now fallen away and Mr McLeish’s new title is general manager -Underground Operations. He previously heldthe position of general manager – AssetManagement and was seconded to theCompany from Hamersley Iron Ore in 2000.Mr McLeish has been with Rio Tinto for 14 years. He has held various managerialpositions within the Rio Tinto Group inAustralia including manager Remelt -Comalco and manager Port Operations atHamersley Iron Ore. Mr McLeish holds a BSc degree in Metallurgical studies as well asa MSc degree in Business Administration.
During 2002, the following held the positionsindicated:Keith P P Calder held the position ofgeneral manager – Underground MiningProject for the whole year. He has beentransferred within the Rio Tinto Group toNorthparkes/Peak in Australia as managingdirector. Mr Calder was project director sinceFebruary 1999.
Arif S Siregar has returned to Indonesia totake up the position of vice president Rio Tinto Indonesia, a Company within theRio Tinto Group. Dr Siregar held the positionof general manager – Industrial Mineralssince August 2001 to December 2002.
COMPANY SECRETARYE B R (Brett) Hone (52) was appointedcompany secretary in September 1999,having previously filled this role at RossingUranium Limited from 1984 through 1992 andat Rio Tinto Zimbabwe from 1980 to 1984.He gained a LL.B (London) degree in 1972;a post-graduate LL.B (Rhodesia) degree in1979 and was admitted as an advocate inZimbabwe in 1980.

The delayed ramp-up of the underground mine resulted
in production of new copper in concentrate of 52 197 tons,
down 33% on the 78 381 tons achieved in 2001.
Reduced new copper in concentrate production was
supplemented by the processing of smelter secondaries
and low-grade concentrate stockpiles. These sources
provided an additional 12 170 tons of copper in
concentrate. Total production of copper in concentrate
was 64 367 tons (2001:82 243 tons). Imported concentrate
and stock-piled concentrates and scrap copper were also
processed as feed to the smelter. As a result of this,
refined copper production was 81 392 tons, 6% lower than
2001 production of 86 848 tons.
As regards the development of the mine, the ore
handling system, with a capacity of 30 000 tons per day, is
in place. More specifically, the undercut progressed well
and according to plan. The third crusher was
commissioned on schedule and construction of the fourth
and last crusher commenced according to plan. This was
commissioned in May 2003. 113 draw bells were
completed and handed over to operations by the end of
2002 against a target of 120 draw bells.
As a direct result of the delay in the ramp-up of the
underground mine and the strengthening of the Rand
against the US dollar, the Company requires additional
finance. Rio Tinto, Palabora’s largest single shareholder,
has made available a US$50 million short-term loan
facility. This will meet working capital and other
requirements until the process of raising additional
financial resources is complete. The Board of Directors
agreed during May 2003 to raise additional capital in
the form of a shareholder supported re-financing
package. It is anticipated that the re-financing will include
an offer to shareholders to participate and will be
underwritten by Palabora’s major shareholders.
The funds raised will be utilised to service existing
debt commitments as well as to allow completion of the
underground project and other fixed capital
commitments, including enhancements to various plants.
In these circumstances the board is of the opinion
that it is unlikely that dividend payments will
recommence within the next two years.
A number of factors will influence operating costs in
2003. Most significant of these are additional mining
costs associated with the delay in the ramp up of the
underground mine, while another results from the change
from defined benefit pension funds to a defined
contribution pension fund in late 2002. Palabora is in the
process of liquidating the existing defined benefit funds.
The new defined contribution fund was established with
effect from 1 September 2002 and the Company is now
contributing 12,5% of pensionable emoluments to this
Fund for its employees. This adds approximately
R31 million annually to Palabora’s cost base, although the
cost impact would have been twice this if the change in
schemes had not taken place.
The Total Operational Performance programme
(TOP) which was introduced at Palabora in 2000 to create
a culture of performance enhancement and improvement
for the business was concluded for Copper Operations,
Industrial Minerals, SHEQ, Finance, Compliance and
Administration, Asset Management as well as Human
Resources. All departments have up to two years to
implement their TOP ideas and to deliver savings in
operating costs, working capital and capital expenditure
through elimination of uncontrolled process variability
and waste, improved quality and reducing downtime.
A number of other business improvement initiatives
are underway at Palabora, namely:
• Reliability Centred Maintenance (RCM) in order to
ensure that equipment works the way it should, when it
is needed.
• Integrated Process Management System (IPMS)/6
Sigma in order to understand processes, eliminate
unnecessary work and set control plans; and
• 5S – a rigorous way in which an area can prepare itself
for improvement.
During 2002, good progress was made with these
programmes, including implementation of IPMS in
copper operations and development of the ZBS process
control plan. This has resulted in improvements in
productivity, reduced scrap generation and reduction in
equipment in a number of areas.
Key areas that will need to be managed during 2003
Chairman’s statement
8
PALABORA MINING COMPANY LIMITED

include:
• the ramp-up of the underground to full
production and demobilization of the
project team;
• the raising of additional finance;
• the importation of concentrate required to
supplement smelter feed;
• continuation of the business and process
improvement initiatives; and
• further improving the management/union relationship.
Regrettably, the safety performance at Palabora
deteriorated in 2002. The Safety Management Auditing
Techniques (SMAT) system will again be a key driver of
improved safety performance at Palabora in 2003. All
leaders within the business are required to participate in
the SMAT process. The quality of SMATs will be improved
by team leader review and engagement.
A contractor supervisor accreditation system will be
introduced during 2003. This will be used to educate
contractor supervisors in Palabora’s safety standards,
assess their level of understanding and competency and
monitor their performance.
Aside from the re-financing of the business, HIV/AIDS
has been identified as the highest risk facing the
Company within the medium/long term. The Company’s
HIV/AIDS management programme is spearheaded by
the HIV/AIDS steering committee, which is chaired by the
general manager – External Affairs. The programme
focuses on employees and, through the Palabora
Foundation and with other stakeholders, on the local
community from which the Company recruits most of its
employees. Discussions aimed at increased participation
by the National Employees Trade Union (NETU) and the
National Union of Mineworkers (NUM) in the programme
progressed well during the year and should be
concluded during 2003.
Work will continue in 2003 on improving the
leadership skills within the organization. Potential leaders
continue to attend leadership courses based on the
MacDonald & Associates models.
Employment equity targets have been set at
superintendent level. High potential employees will be
supported though a system of mentoring
and coaching in order to meet these
targets. Promotion will be based on merit.
From 2004, the underground operation
should be producing at 30 000 tons per day,
initially at 0,8% copper. This should result in
production of 77 000 tons of copper in
concentrate in 2003, 85 000 in 2004 and
then a steady decline in future years in line
with ore grade.
The key issue in future years is therefore to maintain
the smelter at full capacity through the processing of
purchased concentrate. A project team has been
established to identify and analyse probable impacts on
the operation and possible sources.
The Palabora Foundation has effectively re-focused
on education, skills development, development of
entrepreneurs and the management of HIV/AIDS within
the communities as its core work.
Wells Ntuli retired as a director and as chairman on
31 December 2002. He has been a director since 1991
and chairman since July 1999. On behalf of the Board,
management and employees, I would like to thank Wells
for his invaluable contribution to the Company during
this period and would like to wish him a fulfilling
retirement in Pietermaritzburg. I would like to welcome
Clifford Zungu to the Board. I have been asked to act as
chairman by the Board until a successor to Wells is
appointed later this year.
My thanks and appreciation goes to all our
employees and contractors for their commitment during
a challenging year.
Josh Sachikonye
Acting Chairman
PALABORA MINING COMPANY LIMITED
9
Chairman’s statement
Josh Sachikonye
Acting Chairman
Palabora achieved a consolidated net profit of
R257 million compared with R220 million in 2001.
The increase can largely be attributed to the
strengthening of the Rand in 2002 compared to 2001.
The Board of Directors declared no dividends in
2002 (2001: R0,60 per share). This is in line with the
undertaking given by the Company that it would not, in
respect of the calendar years 2001 and 2002, distribute
any of its distributable profits for each calendar year
except for the dividend that was declared on 24 April
2001. This is one of the conditions pertaining to the
granting of a four-and-a-half year unsecured syndicated
loan of US$125 million by a consortium of nine local and
overseas banks in 2001.
The Group’s net debt decreased by R158 million
during the year. Consolidated net debt was
R1 435 million at 31 December 2002. This was largely due
to exchange gains on the dollar porton of the medium
term loan facility due to the strengthening of the Rand
between the start and end of 2002. The Company will be
paying the first half yearly instalment of its medium-term
loan facility of US$15 million and R47 million on 11 June
2003. As a consequence of the strengthening of the
South African Rand in late 2002, coupled with the delay
in ramp up of underground mine production, the cash
flow in the latter part of 2002 was worse than expected.
Management is taking the necessary action to ensure
that adequate funding is made available and it is unlikely
that dividend payments will recommence within the next
two years.
Copper sales, including concentrates, amounted to
R1 459 million (2001: R1 378 million) representing 69% of
turnover. Vermiculite sales were R373 million compared
to R291 million in 2001.
Some 4 340 dry metric tons of concentrate (952 tons
of contained copper) were sold during 2002 compared to
13 284 tons in 2001.
Capital expenditure
The capital expenditure for the year was R695 million,
R7 million lower than the R702 million in 2002. The major
projects included:
R million
Underground project 504
Information systems strategy – SAP 45
ZBS plant upgrade 22
Electric blowers and 11Kv upgrade 20
Projected expenditure for 2003 includes the following:
R million
Underground project 323
Acid plant modifications 21
Primary converter hood upgrade 7
Operating Costs
Operating costs were R1 720 million compared with
R1 625 million in the previous year.
The increase was mainly due to the increased imports
of copper concentrates (R91 million), open pit contract
mining costs (R88 million) and the cost of pension fund
contributions arising from a change in pension fund
legislation (R30 million). These additional costs were
partly offset by the realization of cost savings from the
Total Operating Performance (TOP) programme.
The average unit cash cost of cathode delivered to
customers in Rand per ton increased by 62%
(31% increase in US cents per lb.) compared with 2001.
Rand/ton US cents/lb
2002 2001 2002 2001
Cathode cash cost
delivered 14 476 8 928 62,3 47,4
The following major processes and activities contributed
to cash costs in US cents per lb.:
% %
2002 2001
Mining and underground mining 45 37
Milling 30 22
Smelting/refining 16 26
Indirect/selling 24 36
By-products (15) (21)
100 100
10
Review by the managing director
PALABORA MINING COMPANY LIMITED

As expected, 2002 was a year of transition for
Palabora Mining Company.
The planned closure of the open pit for
large-scale mining took place as scheduled in
April 2002. Smaller scale contract mining of
the open pit ramps began in May. This has
been a great success with mining rates being
in excess of those forecast.
The underground mine did not achieve its
targeted full production rate of 30 000 tons of ore per
day by the end of 2002. Production increased during the
year from a monthly average of 4 700 tons per day in
January to 13 500 tons per day in December.
Production rates have been constrained primarily by
the poor availability of secondary breaking equipment.
This equipment is required to handle oversize material
reporting to the draw bells from the cave. Operating
plans to improve production rates are currently being
implemented, including the increase in size of the
secondary breaking fleet and changes to operating
methods. It is anticipated that the target of 30 000 tons
per day will be achieved in the third quarter of 2003.
The delay in the ramp up of production from the
underground mine has necessitated the mining of
the haulage ramps in the open pit (ramp scavenging); the
recovery of low grade or weathered ore from surface
dumps and the purchase of imported concentrate, in
order to maintain consistent feed to the smelter.
The impact of this variation in ore sources from 2001 to
2002 is demonstrated in the following table.
Source Tons ore (000) Tons ore (000)
2002 % 2001 %
Mining (conventional) 2 473 26 11 348 82
Mining (scavenging) 2 705 29 - -
Surface dumps 892 10 1 549 11
Underground 3 277 35 1 007 7
9 347 100 13 905 100
Tons concentrate
purchased 37 000 12 000
Zirconium Basic Sulphate ( ZBS )
The upgraded ZBS plant was commissioned in the second
half of 2002. Commissioning of the plant was delayed
following a fire in January 2002. As a result, production of
ZBS was limited to 501 tons in 2002
(2001: 1 229 tons). Production of ZBS within
tightened customer specifications was being
achieved from the refurbished plant by the
end of 2002. Average sales prices achieved for
ZBS in 2002 were low due to the sale of
stockpiled low-grade material.
Safety and Environment
Palabora’s safety performance deteriorated in 2002,
but I am pleased to report that there were no fatalities
compared to the two fatalities that occurred in 2001.
The lost time injury frequency rate for the year was
0,46 compared to 0,27 achieved in 2001. The 0,27 in 2001
was the lowest on record. Of the 26 lost time injuries
17 occurred in the underground mine. Contractors
accounted for 65% of the lost time injuries.
On the environmental front there was an increase in
the annual average raw water consumption with an
average of 43,5 Ml/day for 2002, compared with
36,6 Ml/day achieved in 2001. This increase is largely due
to the low rainfall for the calendar year of 154mm against
the annual average of 527mm.
Sulphur recovery for the year was 69%, 2% lower
than in 2001. The lower sulphur capture was mainly
due to low SO2 gas flows caused by low smelter
throughput, resulting in poor acid plant performance.
The performance of the primary hooding on converter
1 also contributed to increased fugitive and secondary
gas emissions. This issue will be addressed during 2003.
Conclusion
Detailed reports on Copper Operations, Industrial
Minerals, Asset Management, Human Resources and the
Underground Mine are contained in the following pages.
A detailed Sustainable Development Report accompanies
this Annual Report as a separate document. In conclusion
I would like to express my appreciation to management,
all our employees and contracting staff for their
endeavours during one of the most telling years of
change in the Company’s history.
David Sadler
Managing Director
14 May 2003
PALABORA MINING COMPANY LIMITED
11
Review by the managing director
David Sadler
Managing Director

The smelter experienced a markedly wider variation
in matte grade during the year as the ability to blend concentrate
from different sources diminished
12

Copper
Mining from the open pit ceased in its conventional
form in April 2002 after 38 years. The depth of the pit
was extended to 822 metres, or 416m below sea level,
and production slowed progressively as access
diminished and haul distances to the in-pit crusher
lengthened.
In May a programme to reclaim ore from the main
access ramps was initiated. The exercise, which
involves lowering the ramp level by 20m along most
of its 4.8km available length, supplied a further
2,7 million tons of ore during 2002. Total production
from the open pit was 5,2 million tons at an average
grade of 0.63% Cu.
The recovery of reverbatory furnace slag
continued during the year and a total of almost
680 000 tons, grading 0.60% Cu, was delivered to the
concentrator for further processing.
Ore production from the underground mine rose
steadily during the year and totalled 3,3 million tons,
a rise of 70% over 2001.
Concentrator
Production of copper concentrate declined in 2002 as
the full impact of formal closure of the open pit was
felt. Output of copper-in-concentrate reduced by
16% to 64 367 tons of which just under 20% was
derived from the processing of smelter secondaries,
including slag and low grade reverts.
The copper concentrate grade reduced sharply to
31,1% in line with the change in ore mix. Copper
recoveries declined marginally to 80,9% from 82,3% in
2001 as the weathered nature of ore removed from
the open pit ramps influenced flotation performance.
Smelter
Production of new anode copper totalled 82 262 tons,
a slight decline of 3,8% on the prior year. Output was
constrained by the lower production of concentrate
with the shortfall being filled by the reclaiming of
various low grade concentrate stockpiles. Towards the
end of the year a trial parcel of 10 000 tons imported
copper concentrate was successfully transported to
Palabora and processed through the smelter.
A markedly wider variation in matte grade was
experienced during the year as the ability to blend
ore from different sources diminished. This was
successfully managed in the converters where a
process control initiative enabled a significant
reduction in blowing cycle times to be achieved.
Sulphuric acid production reduced by 15,7% to
117 238 tons on the back of lower throughput in the
converters. Stable plant operations resulted in SO2
emission levels reducing again to 14ppb, a new
record low.
Refinery
Cathode production was dependant upon the supply
of anode copper from the smelter and, with this
dipping slightly, new refined cathode output slipped
by 6% to 81 619 tons.
Production of copper rod rose by 12% from
65 801 tons in 2001 to 73 513 tons in 2002. Production
of the old imperial sizes of 12,25mm and 9,50mm rod
were stopped and replaced by new metric products
of 10mm and 14mm rod. Small quantities of cathode
were again imported in order to supplement feed to
the rod plant during periods when domestic market
demand exceeded the cathode available from the
tank house.
Copper By-Products
Magnetite
Magnetite production reduced to 171 651 tons during
2002 as lower demand from the South African coal
washing industry and a stock draw down during the
commissioning of a new recovery circuit both
influenced output.
Nickel Sulphate
Production rose sharply to 316 tons as higher nickel
levels in certain of the ore sources translated into
higher production in the tank house.
PALABORA MINING COMPANY LIMITED
13
Operations review
Co
pp
er

Sales
Sales of copper rod rose to 71 095 tons, a 7% increase
on 2001. Demand remained firm from all sectors of
the local market and small quantities of rod were also
exported to selected Southern African customers.
Sales of copper cathode declined sharply as reduced
product availability necessitated the rescheduling of
certain export commitments.
Copper prices remained stable during the year
averaging US 70,6c/lb, as compared with US 71,6 c/lb
in 2001. The lacklustre copper price was given some
shine through the depreciation of the local currency
against the US dollar with the result that the average
SA Rand price achieved during 2002 rose by 22% over
the prior year. Negative sentiment in many major
economies weighed down copper prices, which failed
to respond to several significant cutbacks in output,
mainly in North and South America.
14
Operations review
Feeding of Wehnberg machine with starting sheets in the refinery tankhouse
Continual casting of copper anodes on the casting wheel
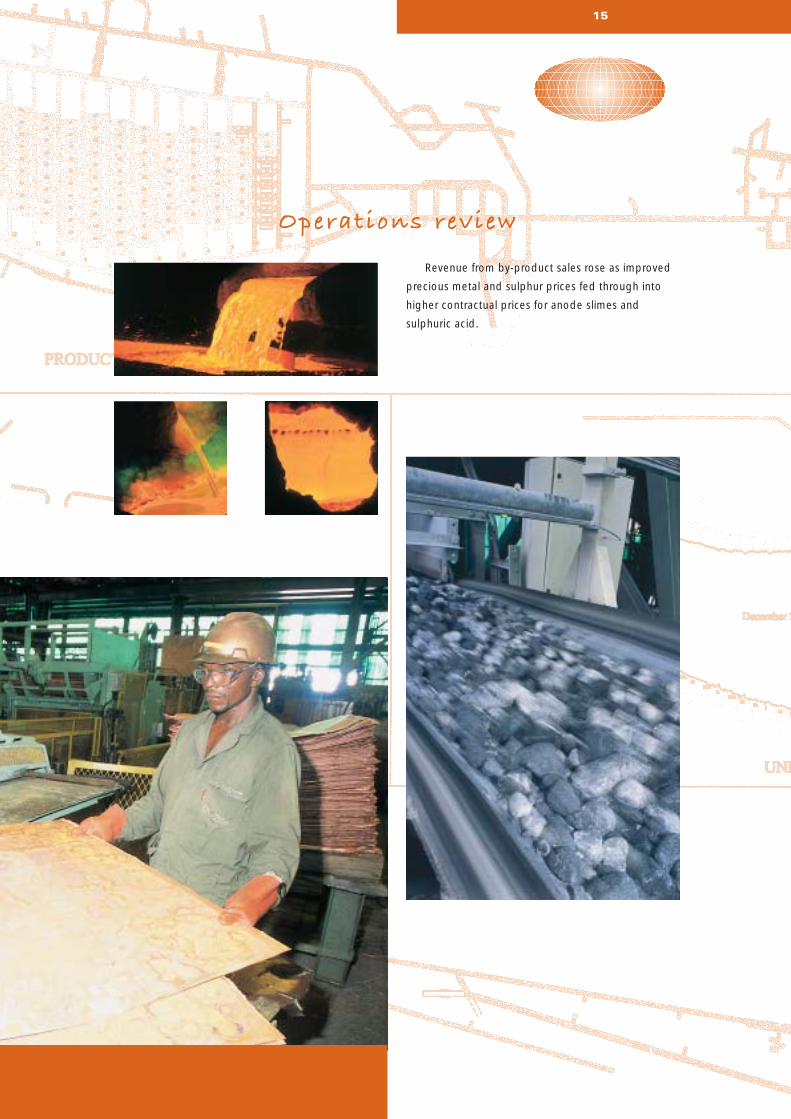
Revenue from by-product sales rose as improved
precious metal and sulphur prices fed through into
higher contractual prices for anode slimes and
sulphuric acid.
15
Operations review
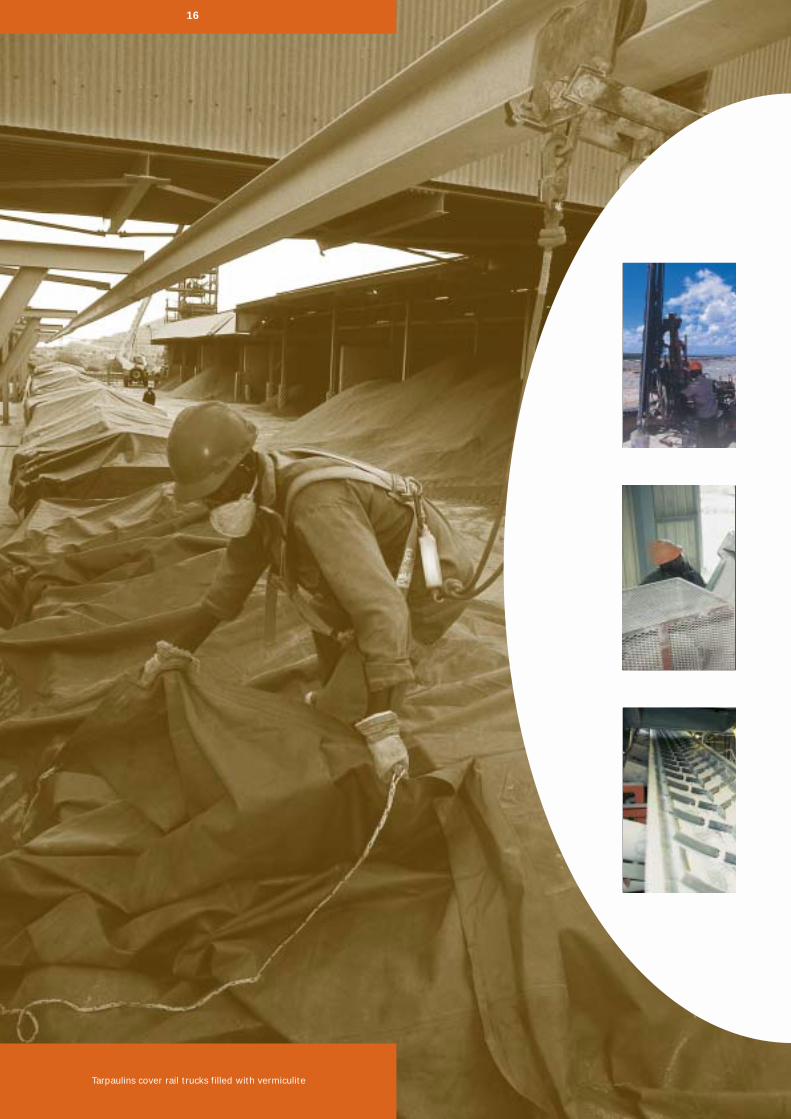
Tarpaulins cover rail trucks filled with vermiculite
16

Ind
ustr
ial M
iner
als
PALABORA MINING COMPANY LIMITED
17
Operations review
Vermiculite
Production of vermiculite improved 40% over the
previous year to 225 033 tons. This set a new record
for the plant. Fortunately 2002 proved to be a dry
year and the projects embarked upon to manage the
effects of high rainfall proceeded according to plan.
The new roof for the covered stockpile was
completed early in the year and construction work on
the Loole creek diversion channel neared completion
at year end.
Plant recoveries improved significantly to 56%,
which was above the planned level of 48% and
allowed for a reduction in plant feed. Product quality
was in line with plan.
Sales volumes to end customers for the full year
improved from 174 392 tons in 2001 to 189 990 tons.
European sales were maintained at the previous years
levels despite a downturn in the international
refractory industry. In America, a key customer
switching grades impacted sales whilst in Asia stiff
competition in the fireproofing industry affected sales.
Palabora still maintains its lead as the main supplier of
vermiculite in the world commanding 40% of the
market
Logistics continues to be an important
component in the industrial minerals market and the
geographic location of Palabora relative to the end
customers contributes almost 70% of the delivered
costs of vermiculite. Ocean freight rates were
successfully contained and remained flat for the year.
Rail transport during the year presented significant
challenges for the logistics team as the local rail
service provider struggled to meet national demands.
Sales revenue was aided by favourable exchange
rates. The development of a particle board in 2002 for
use in dry wall construction in the Far East by one of
Palabora’s vermiculite customers has reached the
stage where the board is now being offered for sale.
Palabora’s vermiculite has been found to be the ideal
raw material in the boards manufacture to meet the
required performance specifications. The impact of
this development will have a significant effect on sales
volumes in the future should the markets find favour
with the end product.
Zirconia
Cessation of mining activities in the copper open pit
also culminated in the closure of the baddeleyite
plants and 193 tons of baddeleyite, the bulk of the
remaining stock, were sold in Europe and America.
Zirconium Basic Sulphate
The zirconium basic sulphate (ZBS) plant upgrade
project was successfully completed, below budget,
on 4 January 2002. However a fire related incident on
29 January 2002 caused extensive damage to the
leaching section of the plant. Repairs to re-instate the
integrity in all sections damaged by the fire
commenced in February and were completed by the
end of April 2002.
Plant operations improved to the extent that the
stringent final product specifications for the major
customer were met by mid December 2002. The plant
is now in a production ramp up mode to meet sales
as they are secured. Total production of ZBS for 2002
was 501 tons of which 399 tons were sold.
Development of markets for the product will be
the key focus for 2003.
Safety
The Industrial Minerals division had an excellent year
on the safety front completing the year without a lost
time injury.

18
The major focus during 2002 was on cost reduction,
improvement of process and equipment effectiveness
and implementation of new business systems.
Asset Management continued to provide high levels
of support and service to the Copper and Industrial
Minerals businesses. The major focus during 2002 was
on cost reduction, improvement of process and
equipment effectiveness and implementation of new
business systems.
The division achieved over eight months LTI Free
during 2002 due to effective safety leadership using
systems such as safety management audit technique
(SMAT) and hazard identification and risk assessment
(HIRA). Asset Management projects team designed
and implemented a new contractor safety
management system for Palabora which included a
revised permit to work system.
Implementation of the SAP R3/4.6c business
system under budget and on time was a major
highlight in 2002. The finance, maintenance, materials
management and human resource modules of SAP
were implemented as part of an overall information
systems strategy that resulted in the mainframe
system being decommissioned. Extensive change
management and communication ensured excellent
business support during “go live” and the business
benefits from SAP are already being realised ahead of
the plan.
Asset Management successfully completed the
total operational performance (TOP) process in
electrical and instrumentation, provisioning and
maintenance services areas during the year. A total of
R36 million was targeted for saving over the next two
years.
PALABORA MINING COMPANY LIMITED
19
O p e r a t i o n s r e v i e w
Service/support departments
Asset planning
The implementation of reliability centred maintenance
(RCM) based equipment strategies was completed on
plan for all critical equipment in both the copper and
industrial minerals businesses. These maintenance
strategies now form the basis for the SAP maintenance
system. A new integrated maintenance planning and
scheduling process was also introduced and is now
fully supported by the SAP system.
Information services and technology
The implementation of the information systems
strategy was the key focus of the IS&T team.
In addition to the implementation of SAP, the team
had to replace the mainframe based legacy systems
and develop a data warehouse and reporting tools to
provide the business with more timely and effective
management information. These projects were
completed on time and under budget.
Provisioning
The provisioning team managed a particularly
challenging year, implementing both SAP materials
management and undertaking TOP successfully.
The SAP implementation required a complete
overhaul of the stock catalogue. SAP has allowed the
integration of the maintenance planning process with
the procurement and warehousing functions.
Cost savings of R10 million were identified in the
Provisioning TOP programme.
A successful programme of asset sales was
undertaken in 2002 to maximise the resale values of
redundant mining equipment from the open pit
operation.
Maintenance services
The maintenance workshops identified R18 million of
cost savings during the TOP programme.
The heavy support equipment team have
achieved excellent availability for the vermiculite
operations through the application of RCM based
maintenance strategies. The maintenance workshops
increased efficiency through the successful
implementation of the “5S” improvement programme
and steadily increased the support for the new
underground mine during 2002.
The power plant provided consistent blowing
rates to the smelter convertors despite the steam
driven blowers reaching the end of their economic
life. These units will be replaced by electric blowers
early in 2003.
Projects
The projects team completed a very challenging year
of project management maintaining an excellent
“on time / on budget” completion rate of over 90%.
The diverse range of projects included the diversion
of Loole Creek to extend the Vermiculite mining
operations, the construction of materials handling
infrastructure for the imported copper concentrate
and demolition and rehabilitation of the Heavy
Minerals and Zirconia plants.
Process improvement
The implementation of the integrated process
management system (IPMS) continued to gather pace
during 2002 with the completion of the copper stream
and commencing in Vermiculite and ZBS plants.
This process improvement approach has provided
significant operational improvements in reducing
smelter cycle times, reducing scrap rates in rod
casting, improved process management in the
concentrator given the variety of feed materials in
2002 and significantly increasing plant recoveries from
the Vermiculite processing plant.
Electrical and instrumentation
This team identified significant savings of R8 million
during the TOP process including better power
management for the business. The instrumentation
team provided excellent support for the IPMS work
throughout Copper and the upgraded ZBS plant.
Ass
et
Man
agem
ent
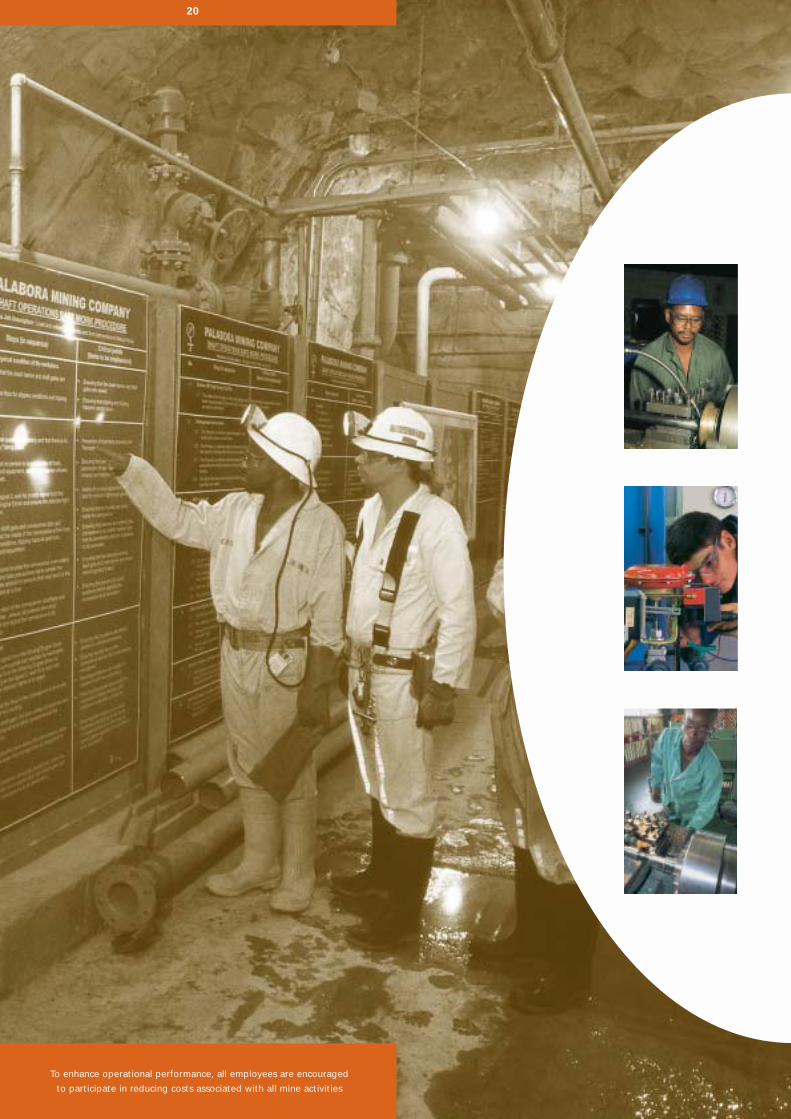
To enhance operational performance, all employees are encouraged
to participate in reducing costs associated with all mine activities
20

PALABORA MINING COMPANY LIMITED
21
Hum
an R
eso
urce
s
The Company integrated all systems related to
Employment Equity, such as bursaries,
apprenticeships and engineers in training, as well as
recruitment and selection. The Palabora Foundation,
has been actively running Master Maths and ProTec
programmes with tangible results emerging over the
past several years. This has assisted with the
recruitment of historically disadvantaged South
Africans.
Palabora constituted a task team in August 2002,
arising from the Mineral and Petroleum Resources
Development Act and Charter, to monitor the
development of the legislation and to prepare
Palabora’s compliance with anticipated requirements.
The State President has signed the Act, but a
commencement date has not yet been set. The draft
Charter was issued in October 2002, but has not yet
been finalised. Palabora is in a strong position to
comply with the documentary requirements regarding
the proof of surface and mining rights. The task team
is currently compiling statistics relating to human
resources development, progress with employment
equity plans, socio-economic empowerment in the
mine community and rural development and
procurement from Black Economic Empowerment
businesses. Development of Black Economic
Empowerment businesses is carried out through the
support of the Business Linkage Centre, which assists
with skills training and with preparing tender
documents and business plans.
New mines are being developed in South Africa,
which are anticipated to employ some 13 000 people
over the next two years. 1 800 positions are
anticipated to be in the technically skilled categories,
which are the categories in which Palabora
experiences the highest turnover. There is strong
competition for technical skills in the labour market,
with demand exceeding the presently available
supply. Palabora has developed a new system to
attract and retain key South African professionals.
The year 2002 also delivered a reduction in labour
strength:
• Manpower reductions during 2002
January 2002: 2428
December 2002: 2011
The following avenues were used to redeploy those in
redundant positions:
• Voluntary retrenchment: 46
• Voluntary early retirement: 154
• Redeployment: 121
These labour reductions had an impact on
employment equity through demographic change
and a changed profile in terms of skills requirements.
The Company aspired during 2002 to establish a
culture change to entrench leadership principles and
models, meritocracy, and accountability at the
respective levels. As part of this culture change the
Company continues to identify and develop new
leaders through the leadership courses, implementing
new systems and symbols and integrating the
underground mine with the surface organisation.
New systems were developed to entrench leadership
accountability, such as the new recruitment and
selection redesign, the new disciplinary redesign and
the potential assessment system to identify high
potential employees.
The Company continued to use TOP target
setting exercises, to broaden business objectives at
all levels of the organisation and to improve business
skills. Systems, such as IPMS and RCM, have been
successfully implemented and applied across the
business to achieve process and equipment
performance, continuous improvement and to
develop key people in facilitator roles.
Industrial relations
During the year the National Union of Mineworkers
(NUM) suspended the Palabora Branch Committee
due to internal conflict. The suspension has since
been lifted and the NUM Branch Committee
Operations review

re-instated. With the expiry of the term of office of
this committee, a new Branch Committee and
Executive Committee was elected and appointed.
The election and appointment of the new committee
has since ushered a steady improvement in the
relationship between the Company and the NUM.
With this improved relationship, the parties
succeeded in bringing about amendments to the
Recognition Agreement, Retrenchment Agreement
and the Recognition of Full Time Shop Steward
Agreement to be focused with business objectives.
A successful management/unions annual
“bosberaad” was held in the latter part of the year.
The parties shared their future vision of the Company
and the challenges ahead.
The Congress of South African Trade Unions’
(COSATU) two day strike on 1 and 2 October 2002,
protesting against the government’s privatisation
plans had no effect on Palabora.
The National Employees’ Trade Union (NETU) has
agreed to change from the Performance Management
System to the Work Performance System, which is in
line with the Company’s future objectives. The NUM
are also being engaged with the view to change to
this system.
Audits were conducted on the Company’s
Industrial Relations systems and Employment Equity
initiatives, the results of which were largely
satisfactory.
22
Blacksmiths shaping reaming bars
Operations reviewcontinued
PALABORA MINING COMPANY LIMITED
23
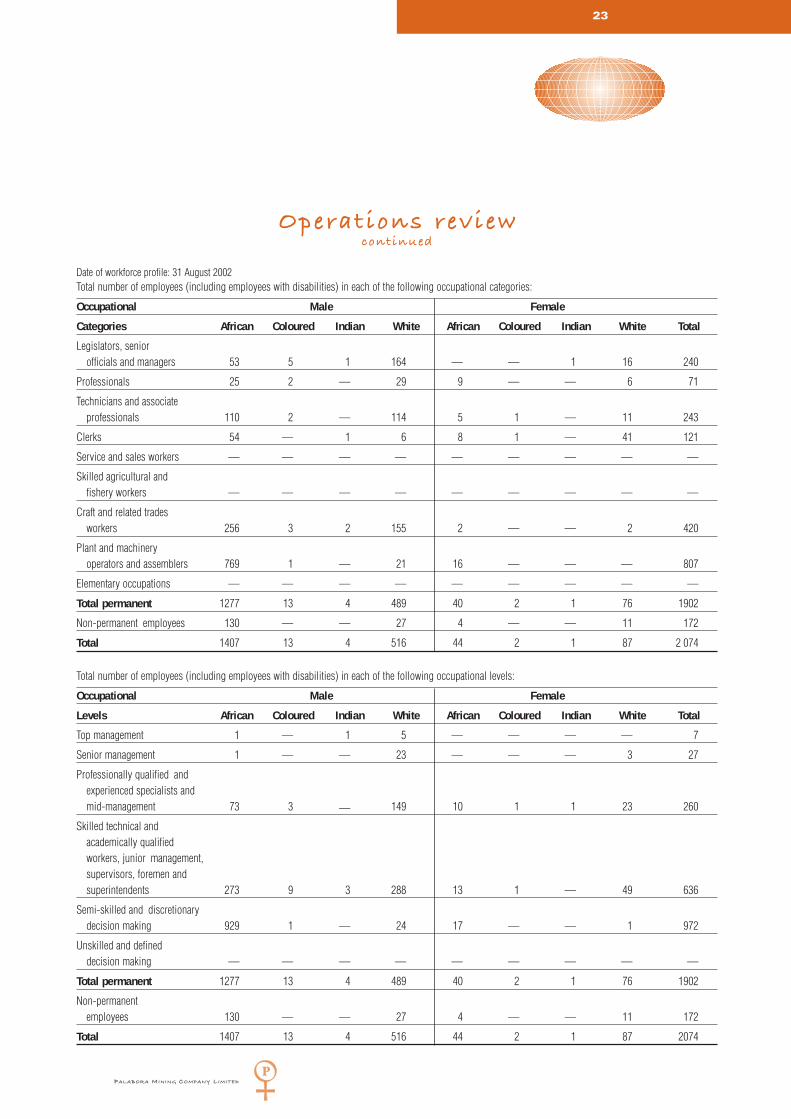
Date of workforce profile: 31 August 2002Total number of employees (including employees with disabilities) in each of the following occupational categories:
Occupational Male Female
Categories African Coloured Indian White African Coloured Indian White Total
Legislators, senior officials and managers 53 5 1 164 — — 1 16 240
Professionals 25 2 — 29 9 — — 6 71
Technicians and associateprofessionals 110 2 — 114 5 1 — 11 243
Clerks 54 — 1 6 8 1 — 41 121
Service and sales workers — — — — — — — — —
Skilled agricultural andfishery workers — — — — — — — — —
Craft and related tradesworkers 256 3 2 155 2 — — 2 420
Plant and machineryoperators and assemblers 769 1 — 21 16 — — — 807
Elementary occupations — — — — — — — — —
Total permanent 1277 13 4 489 40 2 1 76 1902
Non-permanent employees 130 — — 27 4 — — 11 172
Total 1407 13 4 516 44 2 1 87 2 074
Total number of employees (including employees with disabilities) in each of the following occupational levels:
Occupational Male Female
Levels African Coloured Indian White African Coloured Indian White Total
Top management 1 — 1 5 — — — — 7
Senior management 1 — — 23 — — — 3 27
Professionally qualified and experienced specialists andmid-management 73 3 — 149 10 1 1 23 260
Skilled technical andacademically qualifiedworkers, junior management, supervisors, foremen andsuperintendents 273 9 3 288 13 1 — 49 636
Semi-skilled and discretionary decision making 929 1 — 24 17 — — 1 972
Unskilled and defineddecision making — — — — — — — — —
Total permanent 1277 13 4 489 40 2 1 76 1902
Non-permanentemployees 130 — — 27 4 — — 11 172
Total 1407 13 4 516 44 2 1 87 2074
Operations reviewcontinued

24
The development of the underground continues
towards its target of 30 000 tons per day
PALABORA MINING COMPANY LIMITED
25
Operations review
Und
erg
roun
d
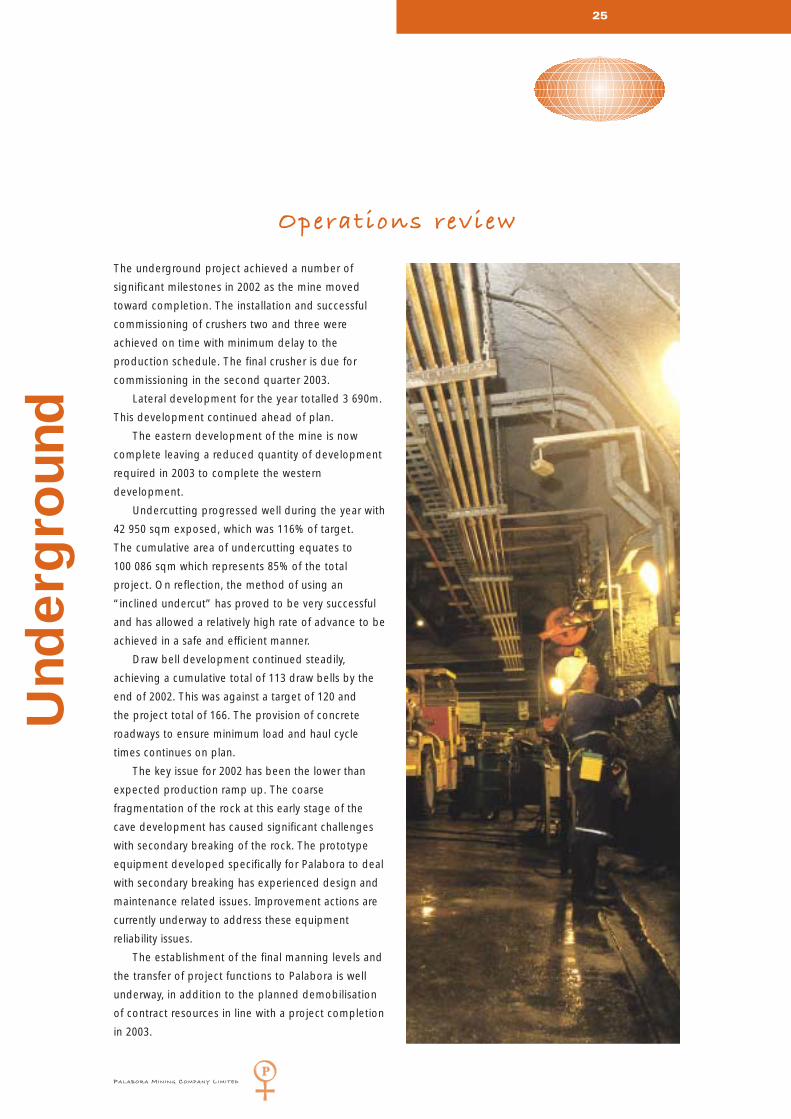
The underground project achieved a number of
significant milestones in 2002 as the mine moved
toward completion. The installation and successful
commissioning of crushers two and three were
achieved on time with minimum delay to the
production schedule. The final crusher is due for
commissioning in the second quarter 2003.
Lateral development for the year totalled 3 690m.
This development continued ahead of plan.
The eastern development of the mine is now
complete leaving a reduced quantity of development
required in 2003 to complete the western
development.
Undercutting progressed well during the year with
42 950 sqm exposed, which was 116% of target.
The cumulative area of undercutting equates to
100 086 sqm which represents 85% of the total
project. On reflection, the method of using an
“inclined undercut” has proved to be very successful
and has allowed a relatively high rate of advance to be
achieved in a safe and efficient manner.
Draw bell development continued steadily,
achieving a cumulative total of 113 draw bells by the
end of 2002. This was against a target of 120 and
the project total of 166. The provision of concrete
roadways to ensure minimum load and haul cycle
times continues on plan.
The key issue for 2002 has been the lower than
expected production ramp up. The coarse
fragmentation of the rock at this early stage of the
cave development has caused significant challenges
with secondary breaking of the rock. The prototype
equipment developed specifically for Palabora to deal
with secondary breaking has experienced design and
maintenance related issues. Improvement actions are
currently underway to address these equipment
reliability issues.
The establishment of the final manning levels and
the transfer of project functions to Palabora is well
underway, in addition to the planned demobilisation
of contract resources in line with a project completion
in 2003.

PALABORA MINING COMPANY LIMITED
26
Statement of responsibility by the board of directors
The Directors are responsible for the preparation, integrity and fair presentation of the financial statements of Palabora
Mining Company Limited and its subsidiaries. The financial statements, presented on pages 36 to 63, have been
prepared in accordance with South African Statements of Generally Accepted Accounting Practice, and include amounts
based on judgements and estimates made by management. The directors also prepared the other information included
in the annual report and are responsible for both its accuracy and its consistency with the financial statements.
The going concern basis has been adopted in preparing the financial statements.The directors have no reason to believe
that the Company or the Group will not be a going concern in the foreseeable future based on forecasts and available
cash resources. The viability of the Company and the Group are supported by the financial statements.
The financial statements have been audited by the independent accounting firm, PricewaterhouseCoopers Inc, which
was given unrestricted access to all financial records and related data, including minutes of all meetings of shareholders,
the Board of Directors and committees of the Board. The Directors believe that all representations made to the
independent auditors during their audit were valid and appropriate. PricewaterhouseCoopers Inc's audit report is
presented on page 35.
The financial statements were approved by the board of directors on 14 May 2003 and are signed on its behalf.
J H K Sachikonye D S Sadler
(Acting) Chairman Managing Director
Statement by the company secre tary
I, the undersigned, in my capacity as Company Secretary, do hereby confirm that for the financial year ended
31 December 2002, Palabora Mining Company Limited has lodged with the Registrar of Companies all such returns as
are required of a public Company in terms of the Companies Act 61 of 1973, as amended, and that all such returns are
true, correct and up to date.
E B R Hone
Company Secretary
14 May 2003
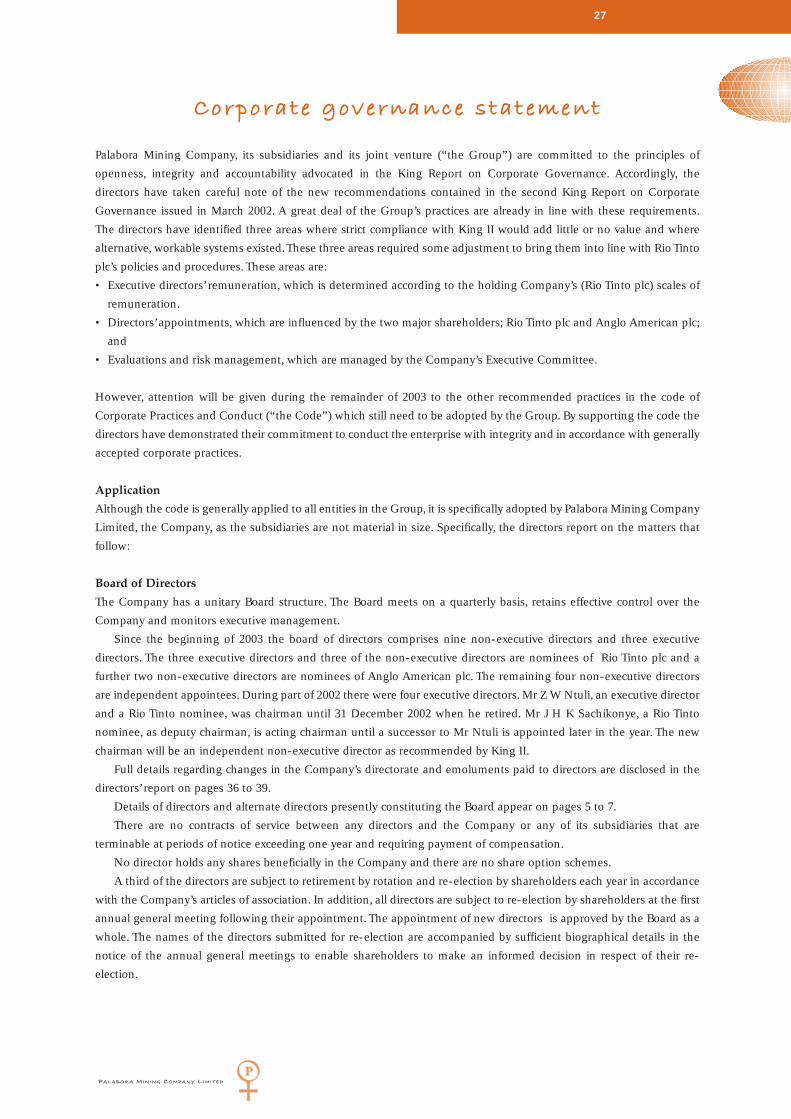
Palabora Mining Company, its subsidiaries and its joint venture (“the Group”) are committed to the principles of
openness, integrity and accountability advocated in the King Report on Corporate Governance. Accordingly, the
directors have taken careful note of the new recommendations contained in the second King Report on Corporate
Governance issued in March 2002. A great deal of the Group’s practices are already in line with these requirements.
The directors have identified three areas where strict compliance with King II would add little or no value and where
alternative, workable systems existed.These three areas required some adjustment to bring them into line with Rio Tinto
plc’s policies and procedures. These areas are:
• Executive directors’ remuneration, which is determined according to the holding Company’s (Rio Tinto plc) scales of
remuneration.
• Directors’appointments, which are influenced by the two major shareholders; Rio Tinto plc and Anglo American plc;
and
• Evaluations and risk management, which are managed by the Company’s Executive Committee.
However, attention will be given during the remainder of 2003 to the other recommended practices in the code of
Corporate Practices and Conduct (“the Code”) which still need to be adopted by the Group. By supporting the code the
directors have demonstrated their commitment to conduct the enterprise with integrity and in accordance with generally
accepted corporate practices.
Application
Although the code is generally applied to all entities in the Group, it is specifically adopted by Palabora Mining Company
Limited, the Company, as the subsidiaries are not material in size. Specifically, the directors report on the matters that
follow:
Board of Directors
The Company has a unitary Board structure. The Board meets on a quarterly basis, retains effective control over the
Company and monitors executive management.
Since the beginning of 2003 the board of directors comprises nine non-executive directors and three executive
directors. The three executive directors and three of the non-executive directors are nominees of Rio Tinto plc and a
further two non-executive directors are nominees of Anglo American plc. The remaining four non-executive directors
are independent appointees. During part of 2002 there were four executive directors. Mr Z W Ntuli, an executive director
and a Rio Tinto nominee, was chairman until 31 December 2002 when he retired. Mr J H K Sachikonye, a Rio Tinto
nominee, as deputy chairman, is acting chairman until a successor to Mr Ntuli is appointed later in the year. The new
chairman will be an independent non-executive director as recommended by King II.
Full details regarding changes in the Company’s directorate and emoluments paid to directors are disclosed in the
directors’ report on pages 36 to 39.
Details of directors and alternate directors presently constituting the Board appear on pages 5 to 7.
There are no contracts of service between any directors and the Company or any of its subsidiaries that are
terminable at periods of notice exceeding one year and requiring payment of compensation.
No director holds any shares beneficially in the Company and there are no share option schemes.
A third of the directors are subject to retirement by rotation and re-election by shareholders each year in accordance
with the Company’s articles of association. In addition, all directors are subject to re-election by shareholders at the first
annual general meeting following their appointment. The appointment of new directors is approved by the Board as a
whole. The names of the directors submitted for re-election are accompanied by sufficient biographical details in the
notice of the annual general meetings to enable shareholders to make an informed decision in respect of their re-
election.
27
Corporate governance statement
PALABORA MINING COMPANY LIMITED
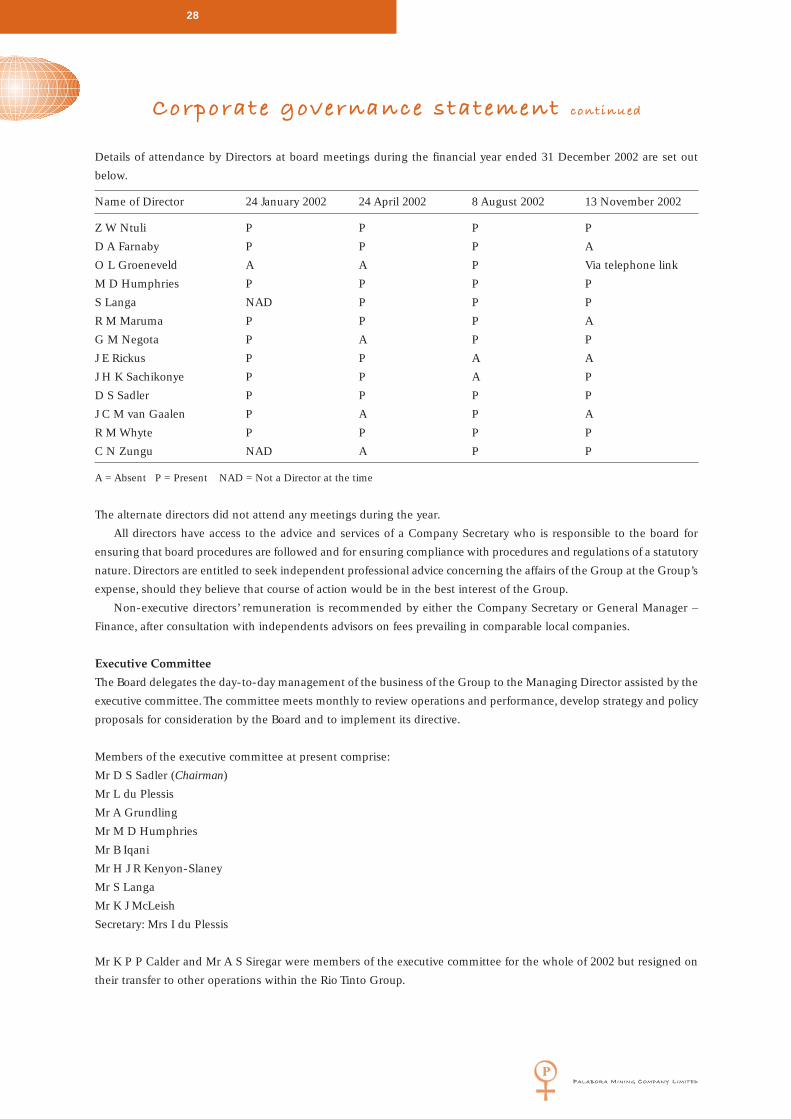
Details of attendance by Directors at board meetings during the financial year ended 31 December 2002 are set out
below.
Name of Director 24 January 2002 24 April 2002 8 August 2002 13 November 2002
Z W Ntuli P P P P
D A Farnaby P P P A
O L Groeneveld A A P Via telephone link
M D Humphries P P P P
S Langa NAD P P P
R M Maruma P P P A
G M Negota P A P P
J E Rickus P P A A
J H K Sachikonye P P A P
D S Sadler P P P P
J C M van Gaalen P A P A
R M Whyte P P P P
C N Zungu NAD A P P
A = Absent P = Present NAD = Not a Director at the time
The alternate directors did not attend any meetings during the year.
All directors have access to the advice and services of a Company Secretary who is responsible to the board for
ensuring that board procedures are followed and for ensuring compliance with procedures and regulations of a statutory
nature. Directors are entitled to seek independent professional advice concerning the affairs of the Group at the Group’s
expense, should they believe that course of action would be in the best interest of the Group.
Non-executive directors’ remuneration is recommended by either the Company Secretary or General Manager –
Finance, after consultation with independents advisors on fees prevailing in comparable local companies.
Executive Committee
The Board delegates the day-to-day management of the business of the Group to the Managing Director assisted by the
executive committee. The committee meets monthly to review operations and performance, develop strategy and policy
proposals for consideration by the Board and to implement its directive.
Members of the executive committee at present comprise:
Mr D S Sadler (Chairman)
Mr L du Plessis
Mr A Grundling
Mr M D Humphries
Mr B Iqani
Mr H J R Kenyon-Slaney
Mr S Langa
Mr K J McLeish
Secretary: Mrs I du Plessis
Mr K P P Calder and Mr A S Siregar were members of the executive committee for the whole of 2002 but resigned on
their transfer to other operations within the Rio Tinto Group.
PALABORA MINING COMPANY LIMITED
28
Corporate governance statement continued

Board Audit Committee
A board appointed Audit Committee was established in 1995 and is an important element of the Board’s system of
monitoring and control. The Board Audit Committee has adopted a formal written Audit Committee Charter, which
contains terms of reference dealing with membership, structure, and levels of authority and duties. To assist the Board
Audit Committee in discharging its responsibilities, internal audits are performed throughout the Group, according to a
three year internal audit plan, and function under the control of, and report to, the Internal Audit Superintendent. The
internal audits are performed by teams of appropriate, qualified and experienced employees and by the Business Risk
Services Division of Ernst & Young. The primary mandate of the Group’s internal auditors is to examine, review and
evaluate the effectiveness of the applicable operating activities, the attendant business risks and the systems of internal
operation and financial control, so as to bring material deficiencies, instances of non-compliance, high-risk exposure
and development work needs to the attention of management for resolution. The Internal Auditing Superintendent
reports on an administrative basis to the General Manager – Finance, who is an executive director, and functionally to
the Board Audit Committee.
Members of the Board Audit Committee at present comprise:
Mr J H K Sachikonye (Chairman)
Mr J Ashmore
Mrs D A Farnaby
Mr M Leech
Mr J C M van Gaalen
Secretary: Ernst & Young
While the Chairman of the Board Audit Committee, Mr Sachikonye is a Non-Executive Director, he is a Rio Tinto
nominee. The appointment of a non-executive independent director to the position of chairman of this committee will
be reviewed during 2003. Mr van Gaalen is a non-executive director of the Company and a Anglo American nominee.
Mrs Farnaby is a non-executive independent director. Mr Ashmore is a Senior Surveillance Officer at the Surveillance
Division of the JSE Securities Exchange South Africa. Mr Leech is General Manager – Commercial, of Rossing Uranium
in Namibia.
Both the external and internal auditors have free access to this committee and to the Chairman of the Board Audit
Committee and where necessary, to the Chairman of the Board and the Managing Director. All important findings
arising from the audit are brought to the attention of the committee and, if necessary, to the board. Meetings are held
at least four times a year and are attended by the Group’s internal and external auditors and the General Manager –
Finance, to review the financial statements and accounting policies, the effectiveness of management information and
other systems of internal control, the interim financial position, the effectiveness of the internal audit function and the
internal and external auditors’ findings.
Details of attendance by members of the Board Audit Committee during the financial year ended 31 December 2002 are
set out below.
Name of Member 23 January 2002 10 April 2002 24 July 2002 30 October 2002
J Ashmore P P P P
D A Farnaby* NAM NAM NAM NAM
M Leech P P P P
G M Negota P NAM NAM NAM
J H K Sachikonye P P A P
J C M van Gaalen P P P P
*appointed a member 13 November 2002 A = Absent P = Present NAM = Not a member at the time
PALABORA MINING COMPANY LIMITED
29
Corporate governance statement continued

Internal Control
The Group maintains systems of internal control over financial reporting and over safeguarding of assets against
unauthorized acquisition, use or disposition, which are designed to provide reasonable assurance to the Board of
Directors regarding the preparation of reliable published financial statements and the safeguarding of the Company’s
assets. The systems include a documented organizational structure and division of responsibility, established policies
and procedures, and the careful selection, training and development of staff. Internal auditors monitor the operation of
the internal control system and report findings and recommendations to management and the Board of Directors.
Corrective actions are taken to address control deficiencies and other opportunities for improving the system as they are
identified. The board, operating through its Audit Committee, provides oversight of the financial reporting process.
There are inherent limitations in the effectiveness of any system of internal control, including the possibility of
human error and the circumvention or overriding of controls. Accordingly, even an effective internal control system can
provide only reasonable assurance with respect to financial statement preparation and the safeguarding of assets.
Furthermore, the effectiveness of an internal control system can change with circumstances.
The Group assessed its internal control system as at 31 December 2002 in relation to the criteria for effective internal
control over financial reporting as set out in the holding Company’s Group Internal Control Questionnaire. Based on its
assessment, the Group believes that, as at 31 December 2002 and at the date of this report, its system of internal control
over financial reporting and over safeguarding of assets against unauthorized acquisitions, use or disposition, met those
criteria.
Safety, Health, Environment and Quality Executive Committee
The Company attaches great importance to the safety and health of its employees and to the environment at large. One
of the prime objectives of this committee is the elimination of all accidents of a mining nature.
Through a comprehensive environmental policy, the committee assesses the impact that the Company’s operations
might have on the environment.
The committee, which meets on a monthly basis, comprises
Mr D S Sadler (Chairman)
Mr L du Plessis
Mr A Grundling
Mr M D Humphries
Mr I Iqani
Mr H J R Kenyon-Slaney
Mr S Langa
Mr K J McLeish
Secretary: Mrs I du Plessis
Mr K P P Calder and Mr A S Siregar were members of this committee for the whole of 2002 but resigned on their
transfer to other operations in the Rio Tinto Group.
Risk Management
The board is responsible for the total risk management process within the Group. The Executive Committee is
accountable to the board and has established a group-wide system of internal control to manage significant group risks.
This system supports the board in discharging its responsibility for ensuring that the range or risks associated with the
Group’s operations, are effectively managed in support of the creation and preservation of shareholder wealth.
The management of risk encompasses all significant risks, including operational risk, which could undermine the
achievement of business objectives. The board has approved the level of acceptable risk and required that operations
manage and report in terms thereof. Issues and circumstances which could give rise to material adverse reputational
considerations are also considered to be unacceptable risks.
PALABORA MINING COMPANY LIMITED
30
Corporate governance statement continued

Some of the major risks to which the Group is exposed are listed below:
• Financing the business
There is a need to finance the business because of the delay in the ramp-up of the underground mine and the
strenghening of the Rand against the US dollar. Management is taking the necessary action to ensure that adequate
funding is available. In the circumstances the board is of the opinion that it is unlikely that dividend payments will
recommence within the next two years. As mentioned in the Chairman’s statement, Rio Tinto, Palabora’s largest single
shareholder, has made available a US$50 million short-term loan facility. This will meet working capital and other
requirements until the process of raising additional financial resources is complete.The Board of Directors agreed in May
2003 to raise additional capital by means of a shareholder supported re-financing package.
The funds issue will be utilised to service existing debt commitments as well as to allow completion of the
underground project and other fixed capital commitments, including enhancements to various plants.
• HIV/AIDS
Discussions have started with the National Employees Trade Union (NETU) and the National Union
of Mineworkers (NUM) aimed at forming a partnership to jointly develop programmes to minimize the impact of
HIV/AIDS on all stakeholders. It is expected that an agreement will be signed in the near future. In the meantime the
Company’s HIV/AIDS management system is in place and is focusing on education and awareness, condom
distribution, voluntary counselling and testing, awareness about and treatment of STIs and opportunistic diseases, et
cetera.
• The Underground Mine
Full production from the new block cave underground mine was scheduled for the end of 2002, but this has not occurred
as a result of difficulties experienced with the ability of the secondary breaking equipment to deal with large rocks.
The ramp up to full production is delayed and is not now expected until the third quarter of 2003. This delay has
stretched financial resources. Other significant risks are water management and ground conditions in the faulted
western end of the mine.
• Industrial Minerals
Managing the threat from Chinese Vermiculite sources will be a key issue. As regards Zirconium Basic Sulphate,
it is essential that low Titanium levels in Zircon sand be maintained to meet customer specifications, as well as to
produce quality product on demand. Work will continue on optimising the process so that the constraint becomes sales
demand rather than production capability. Additional markets will be identified to ensure that the full potential of the
plant can be realized.
• Transportation
The deteriorating service levels of Spoornet and Portnet are a matter of concern. The Company is investigating the
establishment of reliable land transport from Phalaborwa to Richards Bay and Durban.
• Pension Fund legislation
The recent change in Pension Fund legislation, which requires that companies can no longer take pension fund
contribution holidays with effect from 1 December 2001, has meant that the Company now has to contribute 12,5% of
pensionable emoluments to the pension fund. This has added approximately R31 million to the Company’s annual cost
base and will continue to increase on an annual basis.
PALABORA MINING COMPANY LIMITED
31
Corporate governance statement continued

• Attracting and retaining key professionals
Sourcing and retaining high quality employees, whether historically disadvantaged South Africans or not, in key
positions remains a risk. The Human Resources and Organizational Development departments are ensuring that
systems are in place to recruit and develop people for these positions.
• The Minerals and Petroleum Resources Development Act
The Minerals and Petroleum Resources Development Act, the Mining Charter and score card have been identified as
critical issues facing the Company in the medium term. A task team has been established to address the matter.
The Company has embarked on gathering data to compile baseline assessments on a number of processes involving
human resources development, employment equity, mine community and rural development and procurement. In
addition, the task team will be exploring various options relating to the active or passive involvement of Historically
Disadvantaged South Africans.
Business Continuity Plan
The executive committee reviews on an annual basis a business plan for the following year. Forecasts are also prepared
for the subsequent four years. The plan takes into account key performance indicators, plan assumptions and key value
drivers, costs and capital, risks and opportunities and key performance areas.
The business plan is reviewed by the board at the last board meeting for the year. On the basis of this review, and in
the light of the prevailing financial position and likely availability of funding resources, the directors satisfy themselves
each year that the Group is a going concern.
Company Secretarial Function
Appointment and removal of the Company Secretary are matters for the board.
The Company Secretary is required to provide the directors of the Company, collectively and individually, with
guidance as to their duties and responsibilities and powers. He is also required to ensure that the directors are aware of
all laws, legislation, regulations and corporate governance issues relevant to, or affecting the Company and to report at
any meetings of the shareholders of the Company or of the Company’s directors, any failure to comply with such laws,
legislation, regulations or corporate governance issues.
The Company Secretary is also required to ensure that minutes of all shareholders’meetings, directors’meetings and
the meetings of the various committees of the board of directors are properly recorded in accordance with section 242
of the Companies Act. These minutes are circulated to members of the board.
Insider Trading
No employee may deal directly or indirectly in Palabora ordinary shares on the basis of unpublished price-sensitive
information regarding its business or affairs. No director or officer of the Company may trade in these shares during a
closed period determined by the board. Closed periods are operated prior to the publication of the interim and year-end
results. Where appropriate, the closed period is also extended to include other sensitive periods.
Worker participation and affirmative action
The Group employs a variety of participative structures on issues which affect employees directly and materially and is
committed to complying with the Employment Equity Act. These participative structures are further developed and
adapted from time to time to meet variations in operational requirements and to accommodate changing circumstances.
Management and employee representatives meet in formal and informal forums at Company and operational levels to
share information and to address matters of mutual concern.
PALABORA MINING COMPANY LIMITED
32
Corporate governance statement continued

PALABORA MINING COMPANY LIMITED
33
Corporate governance statement continued
Code of Ethics
The Group has developed and promulgated a formal written code of ethics. In accordance with this objective, the code
of ethics has been circulated throughout the Group to provide a clear guide to the conduct expected of all employees in
their dealings with each other and with the Group’s stakeholders. All employees of the Group are required to maintain
the highest ethical standards to ensure the Group’s business practices are conducted in accordance with high standards
and expectations. The Group is committed to the highest standards of integrity, behaviour and ethics in dealing with all
its stakeholders, including its shareholders, directors, managers, employees, customers, suppliers and society at large.
The Group operates an independent system through Whistle Blowers for the anonymous reporting of unethical or risky
business. It is the responsibility of the General Manager – Finance to oversee compliance with the code of ethics. All
breaches of ethical behaviour are consistently and fairly dealt with under the Group’s disciplinary code and appropriate
disciplinary action is taken. As well as being dealt with under the disciplinary code, all cases of fraud or theft are reported
to the South African Police Service for further action.
The directors are of the belief that ethical standards are being met and supported by the abovementioned ethics
programme.

34
Draw bell development continued steadily, achieving a
total of 113 draw bells out of the project total 166 draw bells
by the end of 2002.
Contents
Annual financial statements
Report of the independent auditors
Directors’ report
Income statements
Balance sheets
Statement of changes in equity
Cash flow statements
Notes to the financial statements
Selected data –
financial and statistical
Selected data –
production
Ore reserves and mineral
resource overview
Shareholders’ diary
Addresses
Analysis of shareholders
Notice to members
Proxy Form
35
36
40
41
42
43
44
64
66
68
70
70
71
72

PALABORA MINING COMPANY LIMITED
35
Report of the independent auditors
REPORT OF THE INDEPENDENT AUDITORS TO THE MEMBERS OF
PALABORA MINING COMPANY LIMITED AND ITS SUBSIDIARIES
We have audited the Company and Group annual financial statements set out on pages 36 to 63 for the year ended
31 December 2002. These financial statements are the responsibility of the Company’s Directors. Our responsibility is to
express an opinion on these financial statements based on our audit.
Scope
We conducted our audit in accordance with statements of South African Auditing Standards. Those standards require
that we plan and perform the audit to obtain reasonable assurance that the financial statements are free of material
misstatement. An audit includes:
– examining, on a test basis, evidence supporting the amounts and disclosures in the financial statements;
– assessing the accounting principles used and significant estimates made by management; and
– evaluating the overall financial statement presentation.
We believe that our audit provides a reasonable basis for our opinion.
Audit opinion
In our opinion, the financial statements fairly present, in all material respects, the financial position of the Company and
the Group at 31 December 2002 and the results of their operations and cash flows for the year then ended in conformity
with South African Statements of Generally Accepted Accounting Practice and in the manner required by the
Companies Act in South Africa.
PricewaterhouseCoopers Inc.
Registered Accountants and Auditors
Chartered Accountants (S.A.)
Johannesburg
20 May 2003
The directors have pleasure in presenting their report which forms part of the audited financial statements of the
Company and the Group for the year ended 31 December 2002.
Nature of business
The main business of the Group relates to the mining, extraction and sale of copper and associated by-products
including anode slimes, Magnetite, and Sulphuric Acid. In a smaller business segment the Company also exploits a
Vermiculite deposit adjacent to the Copper operation and operates a Zirconium Basic Sulphate production plant.
During the first half of 2003, the aggregate effect of the delay in ramp-up of the underground mine and the strength
of the Rand against the US dollar, partly offset by the cost savings achieved by the Company, had a significant adverse
effect on the Company’s cash flow. The cumulative effect of these issues is that the Company needs to re-finance the
business. The Board of Directors agreed during May 2003 to raise additional capital in the form of a shareholder
supported re-financing package. It is anticipated that the re-financing will include an offer to shareholders to participate
and will be underwritten by Palabora’s major shareholders. The directors believe that the funds raised from this process
will be adequate to meet the Company’s financial commitments over the coming year.
Group results
The Group profit after taxation for the year amounted to R257 million compared to R220 million achieved in 2001.
Additional details on the results and financial position of the Company and Group are set out in the income
statements, balance sheets, cash flow statements and notes.The performance of the Group and the nature of the various
operations are dealt with in the Statement by the Chairman and Review by the Managing Director.
Underground mining project
The project to develop an underground mine had been in progress for 80 months at the end of 2002. Approximately
93% of the work had been completed against the schedule of 97%. Cumulative expenditure on the project to the end
of 2002 was R2 703 million. It is anticipated that the construction of the underground mine will be completed during
2003. The original project schedule anticipated that the planned production level of 30 000 tons of ore per day would be
achieved by the end of 2002. This has not been achieved, with production averaging 13 500 tons per day in December
2002. Production rates have been limited by the inability efficiently to clear draw points that have been blocked by
poorly fragmented, large rocks. Operating plans to improve production rates are currently being implemented. It is
anticipated that the target of 30 000 tons per day will be achieved in the third quarter of 2003. The Company estimates
that the overall project will cost R3 088 million in escalated terms.
Dividends
No dividends in respect of profits for the year ended 31 December 2002 were declared to shareholders.
There was no change in the authorised share capital of 28 500 000 shares of R1 each of which 28 315 500 have been
issued and are fully paid.
Shareholders will be asked to extend the authority of the directors to control the unissued shares of the Company
at the forthcoming annual general meeting.
Fixed assets
Investments in fixed assets are detailed in the financial statements and there has been no change in the policy relating
to their use.
Holding Company and related parties
The immediate holding Company is Palabora Holdings Limited and the ultimate holding Company is Rio Tinto plc,
which is incorporated in the United Kingdom. Rio Tinto plc’s beneficial interest is 49,2% (2001 : 49,2%). The Group
undertakes various arm’s length transactions with Rio Tinto Group companies primarily relating to the supply of
managerial, administration, consulting and secretarial services.
PALABORA MINING COMPANY LIMITED
36
Directors’ r eportf o r t h e y e a r e n d e d 3 1 D e c e m b e r 2 0 0 2

PALABORA MINING COMPANY LIMITED
37
Directors’ r eport continued
f o r t h e y e a r e n d e d 3 1 D e c e m b e r 2 0 0 2
Administration
The Secretary of the Company is Mr E B R Hone.
The RTZ (South Africa) Environmental Rehabilitation Fund
An amount of R55 million (2001: R48 million) has been placed with the RTZ (South Africa) Environmental
Rehabilitation Fund at 31 December 2002. The intention is to accumulate funds to be used on the restoration of mining
property when the mine closes.
Subsidiaries and joint venture
Issued Effective Amounts
share Group interest receivable
capital 2002 2001 2002 2001
R000 % % R000 R000
Palfos Aviation (Pty) Limited 50 50 50 10 417 10 010
Hans Merensky Country Club (Pty) Limited ** — — 100 — 9 118
Palabora Singapore Pte Limited *** 127 100 100 — 710
Zirlite Holdings Limited (incorporated in Cyprus) 11 100 100 — —
Zirconia Sales Limited
(incorporated in United Kingdom) * 100 100 — 1 101
Palabora Europe Limited
(incorporated in United Kingdom) 754 100 100 12 752 0
Mandoval Coatings Limited
(incorporated in United Kingdom) 1 100 100 33 33
Mandoval Vermiculite Products Inc
(incorporated in United States of America) 3 061 100 100 — 16 729
American Vermiculite Corporation
(incorporated in United States of America) 107 100 100 13 639 21 838
Zirconia Sales Inc
(incorporated in United States of America)* 100 100 — 4 660
Total 36 841 64 199
* Share capital less than R500.
** Hans Merensky Country Club (Pty) Limited was sold during 2002
*** in liquidation
Foreign subsidiaries, which are all unlisted, are mainly concerned with the marketing of by-products.The after-tax profits
of subsidiaries for the year ended 31 December 2002 amounted to R49,1 million (2001 : R74,6 million) and the net assets
at 31 December 2002 amounted to R112,9 million (2001: R186,1 million ).
Directorate and secretaries
The names of the directors as at 31 December 2002 appear on page 4. The addresses and name of the Transfer
Secretaries appear on page 70.
The following changes have taken place in the composition of the board of directors during the year and date
of this report:
Mr R G Mills resigned on 24 January 2002.
Mr J C M van Gaalen was appointed as a director on 24 January 2002
Mr J H K Sachikonye was appointed as a director on 24 January 2002, and as Deputy Chairman on 24 April 2002,
Mr D P C Heugh was withdrawn as alternate director to Mr R G Mills on 24 January 2002.
Mr B K Wood was appointed as alternate to Mr J C M van Gaalen on 24 January 2002 and withdrawn as alternate
to Mr R M Whyte.
Mr S D L Reynish was appointed as alternate to Mr R M Whyte on 24 January 2002, and withdrawn as alternate
to Mr R M Whyte on 8 August 2002.
Mr S Langa was appointed as a director on 24 April 2002.
Mr C N Zungu was appointed as a director on 24 April 2002.
Mr F B Weldon was appointed as alternate to Mr R M Whyte on 8 August 2002.
Mr Z W Ntuli resigned as a director and chairman on 31 December 2002.
Mr W R J Ranson was appointed as alternate to Mr J E Rickus on 11 March 2003.
In terms of the articles of association Mrs D A Farnaby and Messers R M Maruma, G M Negota and D S Sadler as
well as the newly appointed directors, Mr S Langa, Mr W R J Ranson and Mr C N Zungu, retire at the forthcoming
annual general meeting but are all eligible and offer themselves for re-election.
None of the directors and alternate directors beneficially held any shares in the Company. Total shares in respect
of non-beneficial interests were 1 200 (2001: 1 200). There were no material changes between the end of the financial
year and the date of this report.
Board audit committee
The members of the board audit committee as at 31 December 2002 were as follows: Mr J H K Sachikonye
(Chairman), Mr J E Ashmore, Mrs D A Farnaby, Mr M D Leech, Mr J C M van Gaalen. Mrs D A Farnaby was
appointed a member of the committee on the 13 November 2002.
Auditors
PricewaterhouseCoopers Inc. will continue as auditors in accordance with section 270(2) of the Companies Act.
PALABORA MINING COMPANY LIMITED
38
Directors’ r eport continued
f o r t h e y e a r e n d e d 3 1 D e c e m b e r 2 0 0 2
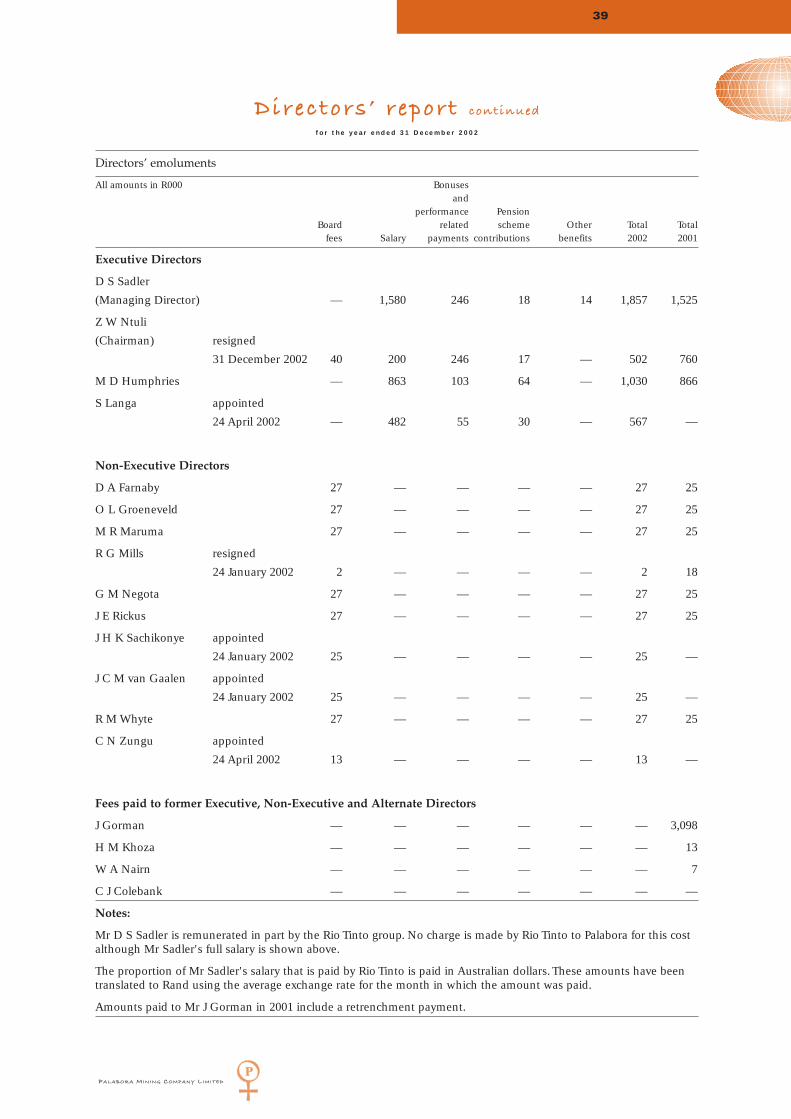
PALABORA MINING COMPANY LIMITED
39
Directors’ r eport continued
f o r t h e y e a r e n d e d 3 1 D e c e m b e r 2 0 0 2
Directors’ emoluments
All amounts in R000 Bonusesand
performance PensionBoard related scheme Other Total Total
fees Salary payments contributions benefits 2002 2001
Executive Directors
D S Sadler
(Managing Director) — 1,580 246 18 14 1,857 1,525
Z W Ntuli
(Chairman) resigned
31 December 2002 40 200 246 17 — 502 760
M D Humphries — 863 103 64 — 1,030 866
S Langa appointed
24 April 2002 — 482 55 30 — 567 —
Non-Executive Directors
D A Farnaby 27 — — — — 27 25
O L Groeneveld 27 — — — — 27 25
M R Maruma 27 — — — — 27 25
R G Mills resigned
24 January 2002 2 — — — — 2 18
G M Negota 27 — — — — 27 25
J E Rickus 27 — — — — 27 25
J H K Sachikonye appointed
24 January 2002 25 — — — — 25 —
J C M van Gaalen appointed
24 January 2002 25 — — — — 25 —
R M Whyte 27 — — — — 27 25
C N Zungu appointed
24 April 2002 13 — — — — 13 —
Fees paid to former Executive, Non-Executive and Alternate Directors
J Gorman — — — — — — 3,098
H M Khoza — — — — — — 13
W A Nairn — — — — — — 7
C J Colebank — — — — — — —
Notes:
Mr D S Sadler is remunerated in part by the Rio Tinto group. No charge is made by Rio Tinto to Palabora for this costalthough Mr Sadler's full salary is shown above.
The proportion of Mr Sadler's salary that is paid by Rio Tinto is paid in Australian dollars. These amounts have beentranslated to Rand using the average exchange rate for the month in which the amount was paid.
Amounts paid to Mr J Gorman in 2001 include a retrenchment payment.
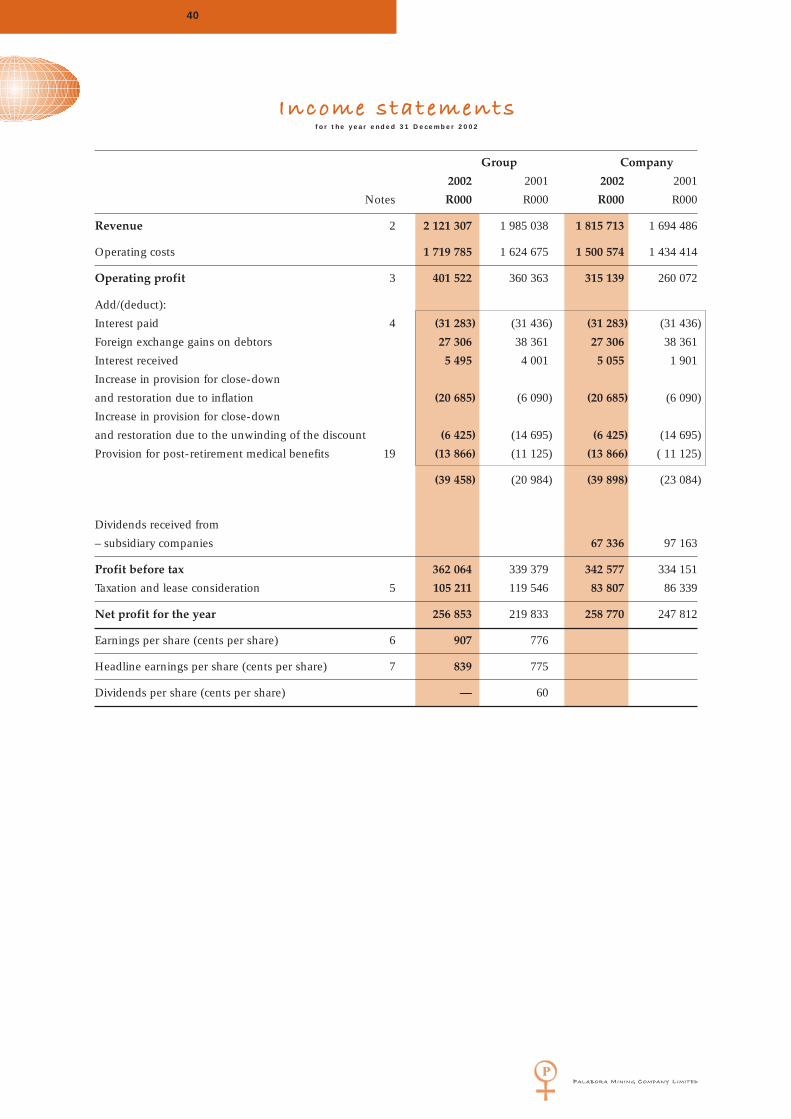
Group Company
2002 2001 2002 2001
Notes R000 R000 R000 R000
Revenue 2 2 121 307 1 985 038 1 815 713 1 694 486
Operating costs 1 719 785 1 624 675 1 500 574 1 434 414
Operating profit 3 401 522 360 363 315 139 260 072
Add/(deduct):
Interest paid 4 (31 283) (31 436) (31 283) (31 436)
Foreign exchange gains on debtors 27 306 38 361 27 306 38 361
Interest received 5 495 4 001 5 055 1 901
Increase in provision for close-down
and restoration due to inflation (20 685) (6 090) (20 685) (6 090)
Increase in provision for close-down
and restoration due to the unwinding of the discount (6 425) (14 695) (6 425) (14 695)
Provision for post-retirement medical benefits 19 (13 866) (11 125) (13 866) ( 11 125)
(39 458) (20 984) (39 898) (23 084)
Dividends received from
– subsidiary companies 67 336 97 163
Profit before tax 362 064 339 379 342 577 334 151
Taxation and lease consideration 5 105 211 119 546 83 807 86 339
Net profit for the year 256 853 219 833 258 770 247 812
Earnings per share (cents per share) 6 907 776
Headline earnings per share (cents per share) 7 839 775
Dividends per share (cents per share) — 60
PALABORA MINING COMPANY LIMITED
40
Income statementsf o r t h e y e a r e n d e d 3 1 D e c e m b e r 2 0 0 2
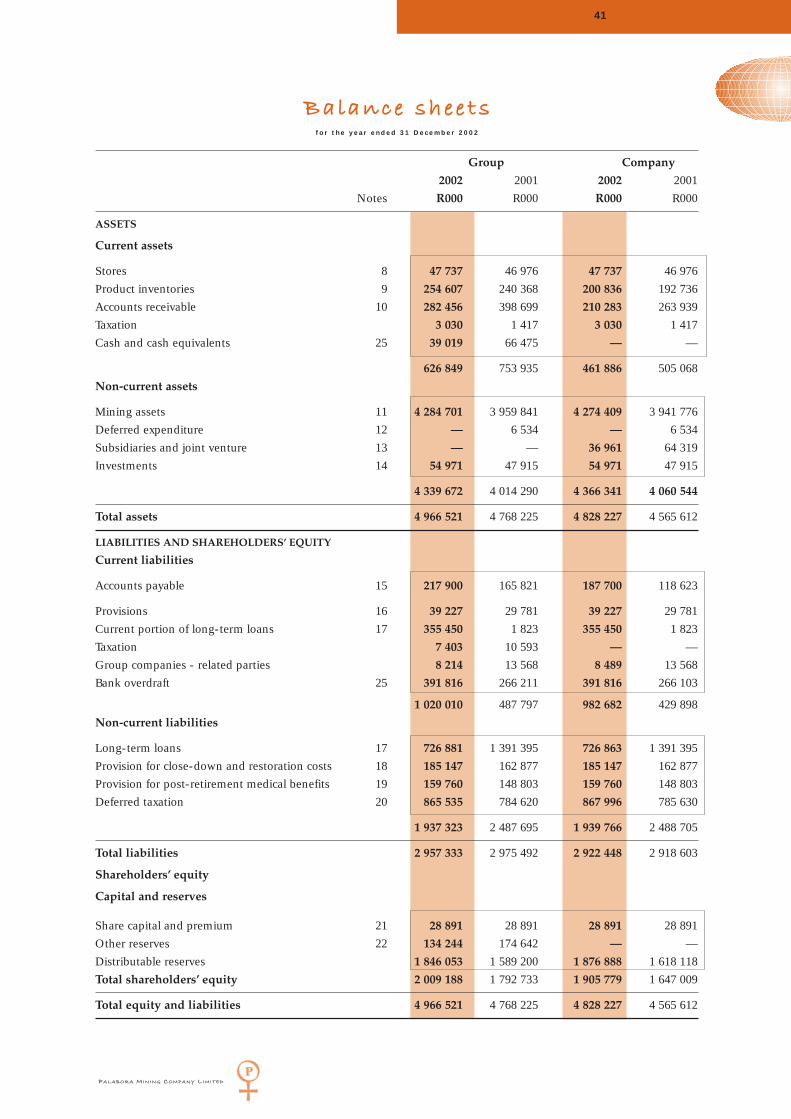
Group Company
2002 2001 2002 2001
Notes R000 R000 R000 R000
ASSETS
Current assets
Stores 8 47 737 46 976 47 737 46 976
Product inventories 9 254 607 240 368 200 836 192 736
Accounts receivable 10 282 456 398 699 210 283 263 939
Taxation 3 030 1 417 3 030 1 417
Cash and cash equivalents 25 39 019 66 475 — —
626 849 753 935 461 886 505 068
Non-current assets
Mining assets 11 4 284 701 3 959 841 4 274 409 3 941 776
Deferred expenditure 12 — 6 534 — 6 534
Subsidiaries and joint venture 13 — — 36 961 64 319
Investments 14 54 971 47 915 54 971 47 915
4 339 672 4 014 290 4 366 341 4 060 544
Total assets 4 966 521 4 768 225 4 828 227 4 565 612
LIABILITIES AND SHAREHOLDERS’ EQUITY
Current liabilities
Accounts payable 15 217 900 165 821 187 700 118 623
Provisions 16 39 227 29 781 39 227 29 781
Current portion of long-term loans 17 355 450 1 823 355 450 1 823
Taxation 7 403 10 593 — —
Group companies - related parties 8 214 13 568 8 489 13 568
Bank overdraft 25 391 816 266 211 391 816 266 103
1 020 010 487 797 982 682 429 898
Non-current liabilities
Long-term loans 17 726 881 1 391 395 726 863 1 391 395
Provision for close-down and restoration costs 18 185 147 162 877 185 147 162 877
Provision for post-retirement medical benefits 19 159 760 148 803 159 760 148 803
Deferred taxation 20 865 535 784 620 867 996 785 630
1 937 323 2 487 695 1 939 766 2 488 705
Total liabilities 2 957 333 2 975 492 2 922 448 2 918 603
Shareholders’ equity
Capital and reserves
Share capital and premium 21 28 891 28 891 28 891 28 891
Other reserves 22 134 244 174 642 — —
Distributable reserves 1 846 053 1 589 200 1 876 888 1 618 118
Total shareholders’ equity 2 009 188 1 792 733 1 905 779 1 647 009
Total equity and liabilities 4 966 521 4 768 225 4 828 227 4 565 612
PALABORA MINING COMPANY LIMITED
41
Balance shee tsf o r t h e y e a r e n d e d 3 1 D e c e m b e r 2 0 0 2

Group
Share Share Distributable Other Total
Capital premium reserves reserves
R000 R000 R000 R000 R000
Balance at 1 January 2001
– as previously reported 28 316 575 1 386 356 109 419 1 524 666
Currency translation differences — — — 65 223 65 223
Net profit — — 219 833 — 219 833
Dividend declared — — (16 989) — (16 989)
Balance at 31 December 2001 28 316 575 1 589 200 174 642 1 792 733
Balance at 1 January 2002
– as previously reported 28 316 575 1 589 200 174 642 1 792 733
Currency translation differences — (40 398) (40 398)
Net profit — — 256 853 — 256 853
Balance at 31 December 2002 28 316 575 1 846 053 134 244 2 009 188
Company
Share Share Distributable Other
Capital premium reserves reserves Total
R000 R000 R000 R000 R000
Balance at 1 January 2001
– as previously reported 28 316 575 1 387 295 — 1 416 186
Net profit — — 247 812 — 247 812
Dividend declared — — (16 989) — (16 989)
Balance at 31 December 2001 28 316 575 1 618 118 — 1 647 009
Balance at 1 January 2002
– as previously reported 28 316 575 1 618 118 — 1 647 009
Net profit — — 258 770 — 258 770
Balance at 31 December 2002 28 316 575 1 876 888 — 1 905 779
PALABORA MINING COMPANY LIMITED
42
Statement of changes in equityf o r t h e y e a r e n d e d 3 1 D e c e m b e r 2 0 0 2

PALABORA MINING COMPANY LIMITED
43
Group Company
2002 2001 2002 2001
Notes R000 R000 R000 R000
Operating activities
Cash generated from operations 23 643 803 839 744 563 215 663 589
Net finance expense (25 788) (27 435) (26 228) (29 535)
Taxation paid 24 (29 099) (40 931) (3 054) (3 946)
Net cash from operating activities 588 916 771 378 533 933 630 108
Investing activities
Replacement of mining assets (195 323) (108 242) (195 225) (103 843)
Development expenditure (499 279) (633 752) (499 277) (633 751)
Capitalised interest on development expenditure (70 796) (53 927) (70 796) (53 927)
Proceeds on disposal of mining assets and subsidiaries 30 459 1 462 18 014 1 012
Amounts invested in Rehabilitation Fund (7 056) (5 948) (7 056) (5 948)
Decrease in loans to subsidiary companies — — 27 358 36 434
Dividends received — — 67 336 97 163
Net cash used in investing activities (741 995) (800 407) (659 646) (662 860)
Financing activities
Long term loans raised 18 1 032 575 — 1 032 575
Long term loans repaid — (599 125) — (599 125)
Dividends paid — (16 989) — (16 989)
Net cash generated from financing activities 18 416 461 — 416 461
Decrease/ (increase) in cash and cash equivalents (153 061) 387 432 (125 713) 383 709
At beginning of year (199 736) (587 168) (266 103) (649 812)
At end of year 25 (352 797) (199 736) (391 816) (266 103)
Cash flow statementsf o r t h e y e a r e n d e d 3 1 D e c e m b e r 2 0 0 2

1. PRINCIPAL ACCOUNTING POLICIES
The consolidated financial statements are prepared in accordance with and comply with South African Statements of
Generally Accepted Accounting Practice. The consolidated financial statements are prepared on the historical cost basis.
The following are the principal accounting policies adopted by the Group which are consistent with those of the
previous year:
1.1 General
The financial statements are presented in South African Rands, as it is the primary functional currency in which the
transactions are undertaken. Monetary assets and liabilities in foreign currencies are translated to SA Rands at rates of
exchange ruling at the end of the financial year. Translation gains and losses arising at year end, as well as those arising
on the translation of settled transactions occurring in currencies other than the functional currency, are included in net
income.
1.2 Consolidation
The consolidated financial information includes the financial statements of the Company, its subsidiaries and its joint
venture.
(a) Subsidiaries
A Company in which the Group holds directly or indirectly, through other subsidiary undertakings, a controlling interest
is classified as a subsidiary undertaking. The minority interest in the consolidated equity and in the consolidated results
are shown separately. Any excess of deficits of the purchase price when compared to the net fair value of the subsidiary
acquired is generally attributed to the mineral property interests of the underlying Company and amortised in terms of
the Group accounting policies.
For self-sustaining foreign entities, assets and liabilities are translated using the closing rates, and income statements
are translated at average rates. Differences arising on translation are taken directly to shareholders’ equity.
(b) Joint ventures
The Group’s interest in a jointly controlled entity is accounted for by proportionate consolidation. Under this method
the Group includes its share of the joint venture’s individual income and expenses, assets and liabilities in the relevant
components of the financial statements.
1.3 Cash and cash equivalents
Cash and cash equivalents include all highly liquid investments with a maturity of three months or less at the date of
purchase.
1.4 Foreign currency
Foreign currency transactions are accounted for at the rates of exchange ruling at the date of the transaction. Monetary
assets and liabilities are translated at the exchange rate ruling at the balance sheet date. Gains and losses arising on
settlement of such transactions and from the translation of monetary assets and liabilities are recognised in the income
statement.
1.5 Non-current investments
Investments, which include monies contributed to environmental rehabilitation funds, are stated at cost and are written
down only where there is a permanent impairment in value.
1.6 Stores and product inventories
Stores and product inventories are valued at the lower of cost and net realisable value. The cost of inventories is
determined principally on the average cost basis.
The cost of product inventories comprises the direct cost of production which includes mining and production
overheads but excludes depreciation, amortisation and transport costs to port. No value is attributed to material before
it reaches the concentrator nor to inventories of anode slimes.
PALABORA MINING COMPANY LIMITED
44
No tes to the f inancial statementsf o r t h e y e a r e n d e d 3 1 D e c e m b e r 2 0 0 2
PALABORA MINING COMPANY LIMITED
45
No tes to the f inancial statements continued
for the year ended 31 December 2002
1.7 Exploration and development expenditure
Property acquisition costs and entry premiums paid to gain access to areas of interest are carried forward at cost where
considered recoverable from resale or development. During the initial exploration stage of projects, full provision is
made in respect of such costs by a charge against profits of the year.
Development costs relating to major projects at the mine are capitalised. Development costs consist primarily of
expenditure to expand the capacity of the mine. Mine development costs in the ordinary course to maintain production
are expensed as incurred. Initial development and pre-production costs are capitalised until the asset reaches
commercial levels of production, at which time the costs are amortised as set out in 1.8 below. Interest and foreign
exchange differences arising on funds borrowed for specific development are capitalised until commercial levels of
production are achieved.
1.8 Mining assets
Mining assets include mine properties, development costs, mine plant facilities as well as certain essential plant spares
which must be held to minimise delays arising from plant breakdowns. Mining assets are carried at cost less
accumulated depreciation. Depreciation is calculated on the straight-line basis to write off mining assets by the end of
their economic life or the estimated life of the mine, whichever is shorter.
Expenditure on maintenance, repairs and renewals is charged to income as incurred. Improvements are capitalised.
The cost of assets sold or scrapped and the related accumulated depreciation is eliminated from the accounts at the time
of disposal and the resulting profits or losses are reflected in the income statement.
1.9 Deferred expenditure
1.9.1 Mine extension costs
Mine extension costs incurred to maintain current production are included in the income statement as they are incurred.
Costs, including depreciation, incurred in mining estimated additional waste to enable the ore body to continue to be
mined by open cast techniques after 1992, were deferred up to 31 December 1992 and are amortised to income on a
straight line basis over the remaining life of the open pit mine.These deferred costs were reduced by amounts recovered
from Foskor Limited for deliveries of ore prior to 31 December 1992.
1.9.2 Residences built on state-owned land in Namakgale
Expenditure relating to these residences is amortised over the estimated life of the open pit mine and represents
expenditure which, although not properly chargeable to fixed assets, confers a continuing benefit to the company.
1.10 Recoverability of long-term assets
Recoverability of the long-term assets of the Group is reviewed periodically. Estimated future net cash flows are
calculated using estimates of ore reserves, estimated future sales prices (considering historical and current prices, price
trends and related factors) and operating, capital and restoration costs. Reductions in the carrying value of the long-term
assets of the Group are recorded to the extent the remaining investment exceeds the estimate of future discounted cash
flows.
1.11 Provisions
Provisions are recognised when the Group has a present legal or constructive obligation as a result of past events, where
it is probable that an outflow of resources embodying economic benefits will be required to settle the obligation, and a
reliable estimate of the amount of the obligation can be made.
1.12 Close-down and restoration costs
The provision in the accounts reflects the net present value of the estimated cost of restoring the environmental
disturbance that has occurred up to the balance sheet date. The costs so provided are capitalised as part of mining assets
and are depreciated accordingly.

Annual increases in the provision are split between finance cost relating to the change in the net present value of the
provision, inflationary increases in the provision estimate and restoration costs relating to additional environmental
disturbances that have occurred.
1.13 Post-retirement medical benefits
The Group provides post-retirement medical benefits for certain retired employees and their spouses by way of
contributions to medical aid schemes. The expected costs of these benefits are accrued over the period of employment
using a methodology similar to that of defined benefit plans.Valuations of these obligations are carried out on a periodic
basis by professionally qualified independent actuaries. The post-retirement medical benefits are not funded.
1.14 Deferred tax
Deferred tax represents the estimated liability for taxation deferred to the future which arises mainly as a result of certain
capital and deferred expenditure being allowed in full for tax purposes in the year in which it is incurred. For accounting
purposes the capital expenditure is deducted from profits by means of annual depreciation charges and the deferred
expenditure is amortised. The provision is reduced by the tax effect of expenditure which is not allowed for tax until
future years. Deferred tax is calculated on the liability method using the current rate of normal taxation and an estimate
of the rate used to determine the State's share of profits based on forecasts of operating results.
1.15 Pensions
With effect from 1 September 2002, the Group’s significant pension plan is a defined contribution plan.The assets of this
plan are separate from the Company’s finances.The cost of the Company’s contribution to the defined contribution plan,
which is based on a proportion of pensionable emoluments, is recognised as an expense in the period in which it arises.
Until 31 August 2002, the Group’s significant pension plan was a defined benefit plan, the assets of which were
generally held in separate trustee-administered funds. The pension plan was generally funded by payments from
employees and the Company, taking account of the recommendations of independent qualified actuaries.
The pension accounting costs for the defined benefit plan are assessed using the projected unit credit method. Under
this method, the cost to the Company of providing pensions is charged to the income statement so as to spread the
regular cost over the service lives of employees in accordance with the advice of qualified actuaries who carry out a full
valuation of the plans at intervals of not more than three years. The pension obligation to the Company, if any, is
measured as the present value of the estimated future cash outflows using interest rates of government securities which
have terms to maturity approximating the terms of the related liability. All actuarial gains and losses are spread forward
over the average remaining service lives of employees.
1.16 Comparatives
Where necessary, comparative figures have been adjusted to conform with changes in presentation in the current year.
2. REVENUE RECOGNITION
2.1 Revenue
Revenue represents the invoiced amounts of product inventories supplied and excludes value added tax. Sales are
invoiced and recognised when delivered at ex mine, FOB or CIF prices, depending on contract terms.
2.2 Dividends received
Dividends receivable are recognised when the right to receive payment is established.
2.3 Interest received
Interest receivable is recognised on a time proportion basis, taking into account the principal outstanding and the
effective rate over the period to maturity, when it is determined that such income will accrue to the Group.
PALABORA MINING COMPANY LIMITED
46
No tes to the f inancial statements continued
for the year ended 31 December 2002

PALABORA MINING COMPANY LIMITED
47
No tes to the f inancial statements continued
for the year ended 31 December 2002
3. OPERATING PROFIT Group Company
2002 2001 2002 2001
R000 R000 R000 R000
Operating profit is stated after charging/(crediting):
Amortisation of deferred expenditure– Residences built on state-owned land in Namakgale Township 308 913 308 913– Mine extension costs 6 226 18 678 6 226 18 678
6 534 19 591 6 534 19 591Depreciation of mining assets– Mine buildings, plant, equipment and residential property 133 186 163 421 130 483 160 166– Pre-production expenditure — 114 — 114
133 186 163 535 130 483 160 280Maintenance and repairs 223 202 299 137 223 160 298 828
Donation, including donation to Palabora Foundation 12 400 7 600 12 400 7 600Impairment of investment in subsidiary — — — 6 390Staff costs 393 987 338 519 380 911 329 923Average number of persons employed by thegroup during the yearSouth Africa 2 158 2 270 2 158 2 245Overseas 13 17 — —
2 171 2 287 2 158 2 245
Directors’ emolumentsExecutive– Director fees 40 109– Managerial services 2 461 3 498Non Executive– Director fees 227 180
2 728 3 787Auditors’ remuneration– Audit fees 1 356 1 179 800 754– Other services 2 020 1 454 1 635 852
3 376 2 633 2 435 1 606Lease rentals– Land and buildings 2 046 1 713 — —
Other professional servicesManagerial, administration,consulting and secretarial– Group companies-related parties 13 908 13 442 13 538 12 709– Third parties 3 702 5 363 3 332 3 901Technical– Group companies - related parties 3 724 729 3 724 729– Third parties 99 3 383 99 3 383
21 433 22 917 20 693 20 722
Profit on disposal of fixed assets and subsidiary (25 360) (554) (17 786) (644)

4. INTEREST PAID Group and Company
2002 2001
R000 R000
Bank borrowings 102 079 85 363
Capitalised to development expenditure (70 796) (53 927)
31 283 31 436
5. TAXATION AND LEASE CONSIDERATION Group Company
2002 2001 2002 2001
R000 R000 R000 R000
Current normal tax :
– South African 1 441 — 1 441 —
– Foreign 23 569 33 960 — —
– Adjustment in respect of prior years — 2 472 — 2 472
State’s share of profits in terms
of mining lease — — — —
25 010 36 432 1 441 2 472
Deferred taxation:
– Movements during year
attributable to timing differences 80 201 83 114 82 366 83 867
105 211 119 546 83 807 86 339
Deferred tax arises from temporary differences in the timing of the recognition of revenue and expenses for the tax
and financial reporting purposes. The source of the permanent differences in the years 2002 and 2001 and the
tax effect are as follows:
Group Company
2002 2001 2002 2001
% % % %
Reconciliation of rate of taxation
Current standard statutory rate 30,0 30,0 30,0 30,0
Estimated state share (after tax) rate 3,3 3,3 3,3 3,3
33,3 33,3 33,3 33,3
Adjusted for:
Dividend income - (affected foreign dividend income) — — (5,9) (9,7)
Prior year adjustment on normal tax — 0,7 — 0,7
Prior year adjustment on deferred tax (2,8) — (2,8) —
Taxable income of foreign entity — 2,2 — 2,2
Other (1,4) (1,0) (0,1) (0,7)
Effective tax rate 29,1 35,2 24,5 25,8
The State's share of profits in terms of the mining lease is determined on a formula which takes into account the
profit and revenue from mining operations during the year. This rate is applied to the taxable income for the year.
South African normal tax at the rate of 30% (2001: 30%) is calculated on the balance of taxable income after
deducting the State’s share of profits.
PALABORA MINING COMPANY LIMITED
48
No tes to the f inancial statements continued
for the year ended 31 December 2002
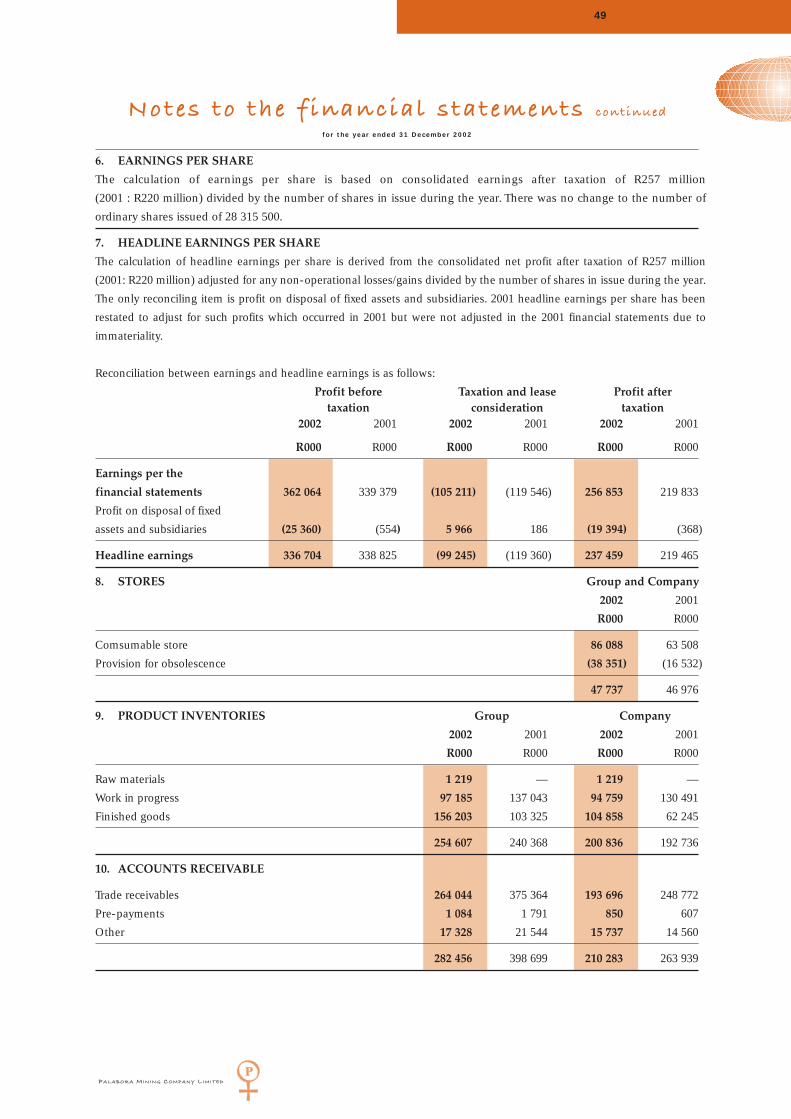
6. EARNINGS PER SHARE
The calculation of earnings per share is based on consolidated earnings after taxation of R257 million
(2001 : R220 million) divided by the number of shares in issue during the year. There was no change to the number of
ordinary shares issued of 28 315 500.
7. HEADLINE EARNINGS PER SHARE
The calculation of headline earnings per share is derived from the consolidated net profit after taxation of R257 million
(2001: R220 million) adjusted for any non-operational losses/gains divided by the number of shares in issue during the year.
The only reconciling item is profit on disposal of fixed assets and subsidiaries. 2001 headline earnings per share has been
restated to adjust for such profits which occurred in 2001 but were not adjusted in the 2001 financial statements due to
immateriality.
Reconciliation between earnings and headline earnings is as follows:
Profit before Taxation and lease Profit aftertaxation consideration taxation
2002 2001 2002 2001 2002 2001
R000 R000 R000 R000 R000 R000
Earnings per the
financial statements 362 064 339 379 (105 211) (119 546) 256 853 219 833
Profit on disposal of fixed
assets and subsidiaries (25 360) (554) 5 966 186 (19 394) (368)
Headline earnings 336 704 338 825 (99 245) (119 360) 237 459 219 465
8. STORES Group and Company
2002 2001
R000 R000
Comsumable store 86 088 63 508
Provision for obsolescence (38 351) (16 532)
47 737 46 976
9. PRODUCT INVENTORIES Group Company
2002 2001 2002 2001
R000 R000 R000 R000
Raw materials 1 219 — 1 219 —
Work in progress 97 185 137 043 94 759 130 491
Finished goods 156 203 103 325 104 858 62 245
254 607 240 368 200 836 192 736
10. ACCOUNTS RECEIVABLE
Trade receivables 264 044 375 364 193 696 248 772
Pre-payments 1 084 1 791 850 607
Other 17 328 21 544 15 737 14 560
282 456 398 699 210 283 263 939
PALABORA MINING COMPANY LIMITED
49
No tes to the f inancial statements continued
for the year ended 31 December 2002
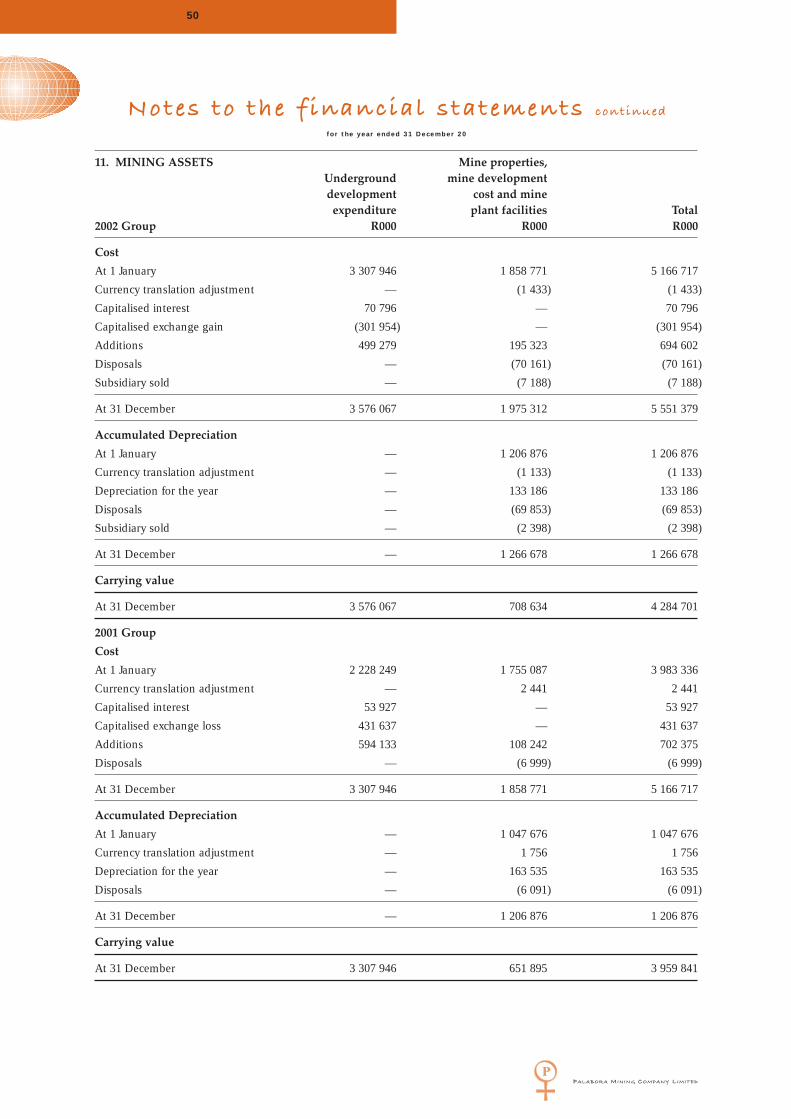
11. MINING ASSETS Mine properties,Underground mine developmentdevelopment cost and mine
expenditure plant facilities Total2002 Group R000 R000 R000
Cost
At 1 January 3 307 946 1 858 771 5 166 717
Currency translation adjustment — (1 433) (1 433)
Capitalised interest 70 796 — 70 796
Capitalised exchange gain (301 954) — (301 954)
Additions 499 279 195 323 694 602
Disposals — (70 161) (70 161)
Subsidiary sold — (7 188) (7 188)
At 31 December 3 576 067 1 975 312 5 551 379
Accumulated Depreciation
At 1 January — 1 206 876 1 206 876
Currency translation adjustment — (1 133) (1 133)
Depreciation for the year — 133 186 133 186
Disposals — (69 853) (69 853)
Subsidiary sold — (2 398) (2 398)
At 31 December — 1 266 678 1 266 678
Carrying value
At 31 December 3 576 067 708 634 4 284 701
2001 Group
Cost
At 1 January 2 228 249 1 755 087 3 983 336
Currency translation adjustment — 2 441 2 441
Capitalised interest 53 927 — 53 927
Capitalised exchange loss 431 637 — 431 637
Additions 594 133 108 242 702 375
Disposals — (6 999) (6 999)
At 31 December 3 307 946 1 858 771 5 166 717
Accumulated Depreciation
At 1 January — 1 047 676 1 047 676
Currency translation adjustment — 1 756 1 756
Depreciation for the year — 163 535 163 535
Disposals — (6 091) (6 091)
At 31 December — 1 206 876 1 206 876
Carrying value
At 31 December 3 307 946 651 895 3 959 841
PALABORA MINING COMPANY LIMITED
50
No tes to the f inancial statements continued
for the year ended 31 December 20
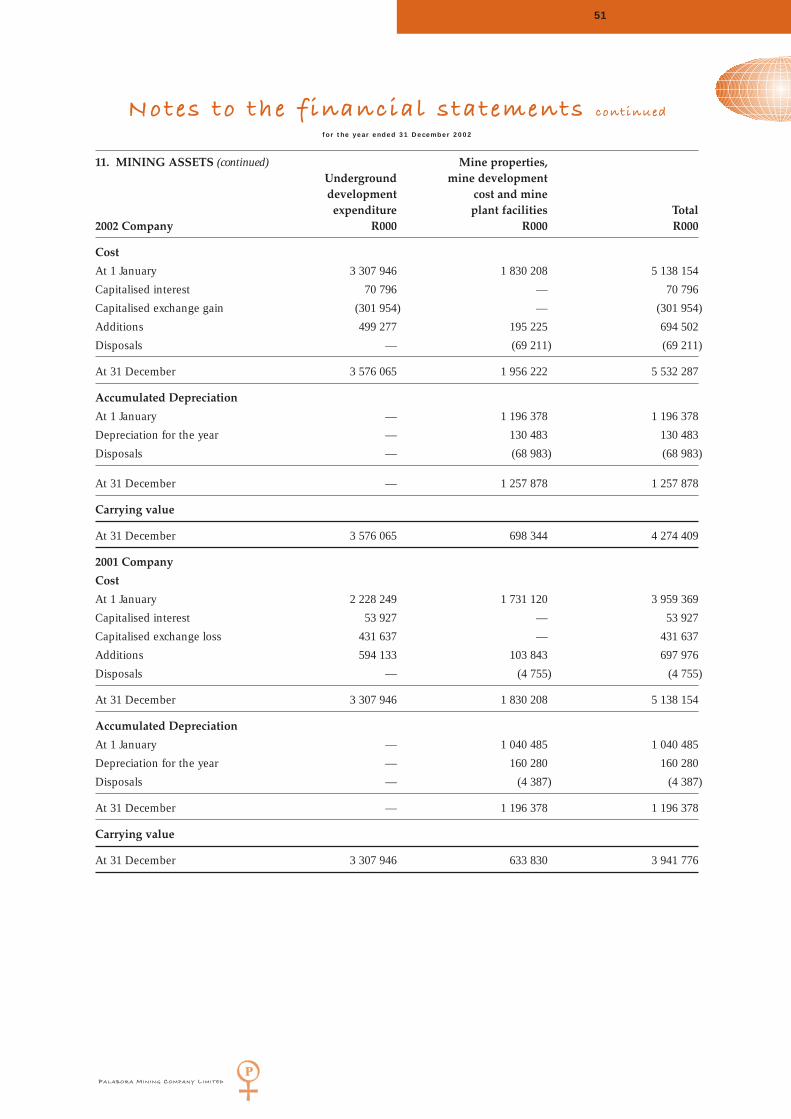
PALABORA MINING COMPANY LIMITED
51
No tes to the f inancial statements continued
for the year ended 31 December 2002
11. MINING ASSETS (continued) Mine properties,Underground mine developmentdevelopment cost and mine
expenditure plant facilities Total2002 Company R000 R000 R000
Cost
At 1 January 3 307 946 1 830 208 5 138 154
Capitalised interest 70 796 — 70 796
Capitalised exchange gain (301 954) — (301 954)
Additions 499 277 195 225 694 502
Disposals — (69 211) (69 211)
At 31 December 3 576 065 1 956 222 5 532 287
Accumulated Depreciation
At 1 January — 1 196 378 1 196 378
Depreciation for the year — 130 483 130 483
Disposals — (68 983) (68 983)
At 31 December — 1 257 878 1 257 878
Carrying value
At 31 December 3 576 065 698 344 4 274 409
2001 Company
Cost
At 1 January 2 228 249 1 731 120 3 959 369
Capitalised interest 53 927 — 53 927
Capitalised exchange loss 431 637 — 431 637
Additions 594 133 103 843 697 976
Disposals — (4 755) (4 755)
At 31 December 3 307 946 1 830 208 5 138 154
Accumulated Depreciation
At 1 January — 1 040 485 1 040 485
Depreciation for the year — 160 280 160 280
Disposals — (4 387) (4 387)
At 31 December — 1 196 378 1 196 378
Carrying value
At 31 December 3 307 946 633 830 3 941 776

12. DEFERRED EXPENDITURE Group and CompanyCarrying
Cost Amortisation Value
R000 R000 R000
At 31 December 2002
Deferred mining costs net of recoveries from Foskor Limited 164 899 164 899 —
Residences built on State-owned land in Namakgale 16 034 16 034 —
180 933 180 933 —
At 31 December 2001
Deferred mining costs net of recoveries from Foskor Limited 164 899 158 673 6 226
Residences built on State-owned land in Namakgale 16 034 15 726 308
180 933 174 399 6 534
13. SUBSIDIARIES AND JOINT VENTURE Company
2002 2001
R000 R000
Shares at cost 120 120
Amounts receivable 36 841 64 199
Interest in subsidiaries and joint venture 36 961 64 319
Additional information regarding the Company’s subsidiaries and joint venture is set out in the Directors’ Report and
note 31.
14. INVESTMENTS Group and Company
2002 2001
R000 R000
Amounts contributed to the RTZ (South Africa)
Environmental Rehabilitation Fund 54 971 47 915
The fund is an irrevocable trust under the Company's control. The monies in the fund are invested primarily in equity
securities. At 31 December 2002 the market value of the fund was R87 million (2001: R82 million).
15. ACCOUNTS PAYABLE Group Company
2002 2001 2002 2001
R000 R000 R000 R000
Trade payables 154 662 122 439 127 062 87 419
Pension fund contribution 29 665 — 29 665 —
Other 33 573 43 382 30 973 31 204
217 900 165 821 187 700 118 623
PALABORA MINING COMPANY LIMITED
52
No tes to the f inancial statements continued
for the year ended 31 December 2002

PALABORA MINING COMPANY LIMITED
53
No tes to the f inancial statements continued
for the year ended 31 December 2002
16. PROVISIONS Group and Company
2002 2001
R000 R000
Leave pay provision
Opening balance 17 781 15 133
Utilised during the year (28 887) (16 880)
Additional provision 25 489 19 528
14 383 17 781
Donations, including donation to Palabora Foundation
Opening balance 12 000 12 000
Utilised during the year — (7 600)
Interest accrued 444 —
Additional provision 12 400 7 600
24 844 12 000
Total provisions 39 227 29 781
17. LONG TERM LOAN Group Company
Rate of interest 2002 2001 2002 2001
Description of loan % per annum R000 R000 R000 R000
Citibank (a) Libor + 1,5% / Jibor + 1,5% 1 060 895 1 363 250 1 060 895 1 363 250
Less: Current portion included in
current liabilities (353 632) — (353 632) —
Daiichi Kigenso Kagaku Kogyo Co Ltd (b) Libor + 2,38% 21 418 29 968 21 418 29 968
Less: Current portion included in
current liabilities (1 818) (1 823) (1 818) (1 823)
Other long term borrowings 18 — — —
726 881 1 391 395 726 863 1 391 395
Security and terms of repayment
(a) Citibank is acting as an agent for a long-term loan with a group of national and international banks for an
unsecured facility agreement of US$125 million. The facility consists of a US$90 million tranche and a Rand tranche of
R282,8 million. The loan, which is being used to fund the underground mine development and the repayment of other
short term loans, is repayable in six equal half yearly instalments of US$15,0 million and R47,1 million commencing on
11 June 2003. The interest rate is based on Libor/Jibor + 1,5%.
(b) Unsecured loan of US$2,5 million from Daiichi Kigenso Kagaku Kogyo Co Limited in Japan for the development of
the ZBS project. The capital and interest is repayable in 24 half yearly instalments of approximately US$ 135 000 which
commenced on 30 June 2002. The interest rate is based on six month Libor + 2,38%.

18. PROVISION FOR CLOSE DOWN AND RESTORATION COSTS Group and Company
2002 2001
R000 R000
Balance at beginning of the year 162 877 142 092
Utilised during the year (4 840) —
Charge for the year 27 110 20 785
185 147 162 877
19. PENSION AND POST RETIREMENT OBLIGATIONS
Amount recognised in the balance sheet
Pension schemes — —
Post retirement benefits 159 760 148 803
159 760 148 803
Pension scheme
The most significant pension fund in the Group is that operated by Palabora Mining Company Limited.
Until 31 August 2002 Palabora Mining Company’s pension schemes were defined benefit schemes, registered under the
Pensions Funds Act 1956. The process of closing these schemes commenced on 1 September 2002. Each member’s vested
benefit as at 31 August 2002 was transferred out of the defined benefit schemes and in to a new defined contribution
pension scheme, known as the Palabora Pension Fund. Pensioners in the defined benefit schemes had their vested benefits
transferred to Old Mutual’s Platinum Portfolio. The only assets remaining in the defined benefit schemes at 31 December
2002 were surplus funds that existed in those schemes at the surplus apportionment date, 31 August 2002. These assets are
independent of the Company’s finances and are to be distributed to past members of the schemes in line with the Pension
Funds Second Amendment Act, which was promulgated on 7 December 2001. It is possible that Palabora Mining Company
will be entitled to receive part of this surplus distribution. No account is given to this in the Company’s financial statements,
as its value is uncertain.
An accrual of R30 million has been made in the financial statements for company pension contributions for the period
from 7 December 2001 to 31 August 2002 at the rate advised by the Company’s actuary.
The latest actuarial valuations of the defined benefit schemes were carried out as at 28 February 2001.The schemes were
considered to be in sound financial condition.
Group and Company
2002 2001
R000 R000
Present value of funded obligations — (1 014 781)
Fair value of assets 395 039 1 468 781
Surplus 395 039 454 000
PALABORA MINING COMPANY LIMITED
54
No tes to the f inancial statements continued
for the year ended 31 December 2002

PALABORA MINING COMPANY LIMITED
55
No tes to the f inancial statements continued
for the year ended 31 December 2002
19. PENSIONS AND POST RETIREMENT OBLIGATIONS (continued)
The principal actuarial assumptions used for accounting purposes were: Group and Company
2002 2001
% %
Discount rate — 6,4
Expected return on assets — 11,0
Future salary increases — 9,0
Future pension increases — 9,0
With effect from 1 September 2002, Palabora Mining Company Limited operated a defined contribution scheme. This
pension scheme is registered under the Pension Funds Act 1956. The assets of the scheme are independent of the
Company’s finances. The scheme is funded by contributions from employees and the Company, determined as a percentage
of pensionable emoluments. Company contributions for the period 1 September 2002 to 31 December 2002 were
R7,2 million.
Post retirement medical benefits
The Group’s provision for post retirement medical benefits is based on the assumptions used by the independent actuaries
which includes appropriate mortality tables, long term estimates of increases in medical costs and appropriate discount
rates. The level of claims is based on the Group’s experience. The post retirement medical benefit plan is unfunded.
The principal actuarial assumptions are as follows: Group and Company
2002 2001
% %
Discount rate 12,5 12,5
Expected return on assets 12,5 12,5
Increase of health costs 13,6 10,5
The amounts recognised in the balance sheet are as follows:Actuarial gain 34 248 34 248Amortisation of actuarial gain (5 411) (2 439)
Unamortised actuarial gain 28 837 31 809Present value of unfunded obligations 130 923 116 994
Liability in the balance sheet 159 760 148 803
The amounts recognised in the income statement are as follows:Current service cost 2 214 2 039Interest cost 14 624 11 525Amortisation of actuarial gain (2 972) (2 439)
13 866 11 125
Movement in the liability recognised in the balance sheet:At beginning of year 148 803 141 490Total expenses as above 13 866 11 125Benefits paid (2 909) (3 812)
159 760 148 803
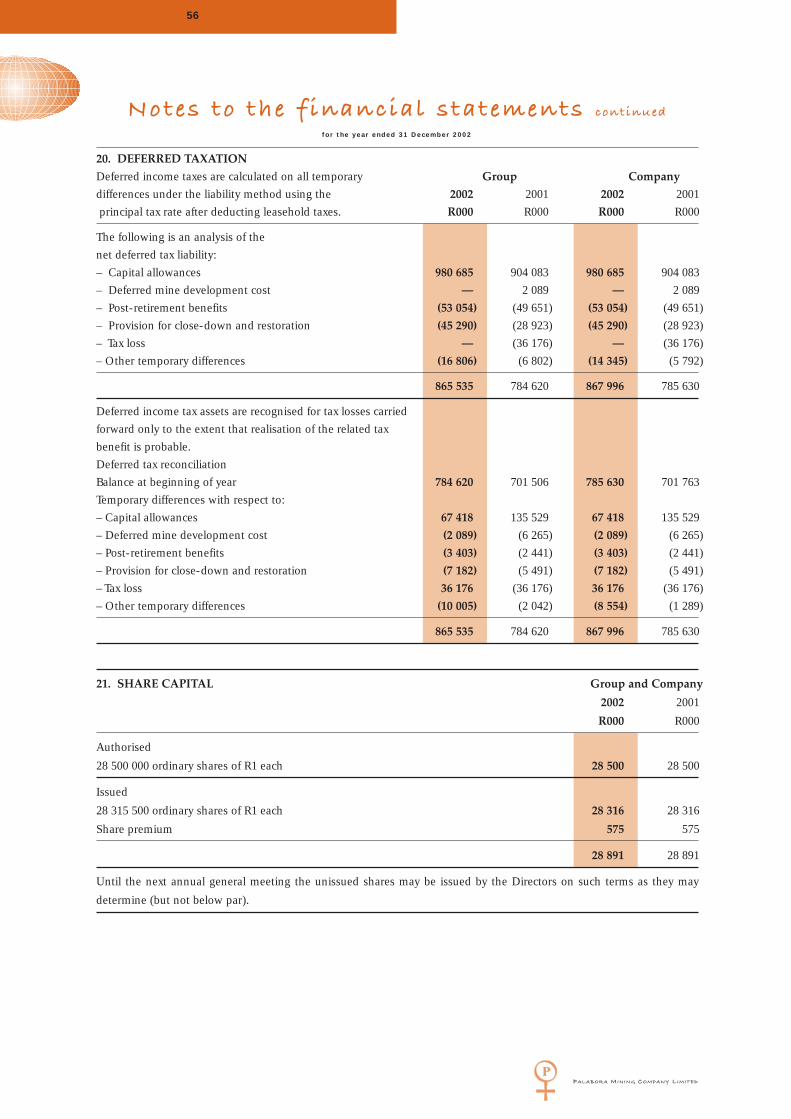
20. DEFERRED TAXATIONDeferred income taxes are calculated on all temporary Group Companydifferences under the liability method using the 2002 2001 2002 2001principal tax rate after deducting leasehold taxes. R000 R000 R000 R000
The following is an analysis of the net deferred tax liability:– Capital allowances 980 685 904 083 980 685 904 083– Deferred mine development cost — 2 089 — 2 089– Post-retirement benefits (53 054) (49 651) (53 054) (49 651)– Provision for close-down and restoration (45 290) (28 923) (45 290) (28 923)– Tax loss — (36 176) — (36 176)– Other temporary differences (16 806) (6 802) (14 345) (5 792)
865 535 784 620 867 996 785 630
Deferred income tax assets are recognised for tax losses carriedforward only to the extent that realisation of the related tax benefit is probable.Deferred tax reconciliation Balance at beginning of year 784 620 701 506 785 630 701 763Temporary differences with respect to:– Capital allowances 67 418 135 529 67 418 135 529– Deferred mine development cost (2 089) (6 265) (2 089) (6 265)– Post-retirement benefits (3 403) (2 441) (3 403) (2 441)– Provision for close-down and restoration (7 182) (5 491) (7 182) (5 491)– Tax loss 36 176 (36 176) 36 176 (36 176)– Other temporary differences (10 005) (2 042) (8 554) (1 289)
865 535 784 620 867 996 785 630
21. SHARE CAPITAL Group and Company
2002 2001
R000 R000
Authorised
28 500 000 ordinary shares of R1 each 28 500 28 500
Issued
28 315 500 ordinary shares of R1 each 28 316 28 316
Share premium 575 575
28 891 28 891
Until the next annual general meeting the unissued shares may be issued by the Directors on such terms as they may
determine (but not below par).
PALABORA MINING COMPANY LIMITED
56
No tes to the f inancial statements continued
for the year ended 31 December 2002

PALABORA MINING COMPANY LIMITED
57
No tes to the f inancial statements continued
for the year ended 31 December 2002
22. OTHER RESERVES Group
2002 2001
R000 R000
Exchange difference on translation of
net investment in foreign subsidiaries:
At 1 January 174 642 109 419
(Decrease)/increase during year (40 398) 65 223
At 31 December 134 244 174 642
23. CASH GENERATED BY OPERATIONS - GROUP Group Company
2002 2001 2002 2001
R000 R000 R000 R000
Profit before taxation 362 064 339 379 342 577 334 151
Adjustments for non-cash items:
Depreciation of mining assets 133 186 163 535 130 483 160 280
Amortisation of deferred expenditure 6 534 19 591 6 534 19 591
Provision for close-down and restoration costs 27 110 20 785 27 110 20 785
Profit on disposal of mining assets (25 360) (554) (17 786) (644)
Provision for post-retirement medical benefits 13 866 7 313 13 866 7 313
Impairment of investment in subsidiary — — — 6 390
Other non-cash items (8 951) (1 369) (8 951) —
Exchange adjustment on translation of
foreign subsidiaries (40 099) 65 908 — —
106 286 275 209 151 256 213 715
Adjustments - other
Interest paid 31 283 31 436 31 283 31 436
Interest received (5 495) (4 001) (5 055) (1 901)
Dividends received — — (67 336) (97 163)
25 788 27 435 (41 108) (67 628)
Increase in working capital
Stores (761) 12 566 (761) 12 566
Product inventories (14 239) 121 477 (8 100) 111 726
Accounts receivable 116 243 63 018 53 656 57 286
Amount owing to group companies (5 354) (1 299) (5 079) (1 016)
Accounts payable and provisions 61 525 1 959 78 523 2 789
Utilisation of long term provisions (7 749) — (7 749) —
Net increase 149 665 197 721 110 490 183 351
643 803 839 744 563 215 663 589

24. TAXATION PAID Group Company
2002 2001 2002 2001
R000 R000 R000 R000
Tax charge to income statement (105 211) (119 546) (83 807) (86 339)
Movement in taxation liability (4 803) (4 499) (1 613) (1 474)
Movement in deferred tax liability 80 915 83 114 82 366 83 867
Payments made (29 099) (40 931) (3 054) (3 946)
25. CASH AND CASH EQUIVALENTS
Cash and cash equivalents 39 019 66 475 — —
Bank overdraft (391 816) (266 211) (391 816) (266 103)
(352 797) (199 736) (391 816) (266 103)
26. SEGMENT REPORTING
From a business segment point of view the only significant segments are copper and industrial minerals mining and
production. Copper by-
Industrial products
Copper Minerals and other Total
Year ended 31 December 2002 R000 R000 R000 R000
Profit and loss
Revenues 1 459 146 535 249 126 912 2 121 307
Cost and expenses 1 156 909 457 495 105 381 1 719 785
Operating profit 302 237 77 754 21 531 401 522
Finance cost (39 458)
Profit before tax 362 064
Taxation 105 211
Net profit for the year 256 853
Segment assets 4 504 233 311 950 95 367 4 911 550
Unallocated assets 54 971
Consolidated total assets 4 966 521
Segment liabilities 1 577 062 87 225 74 390 1 738 677
Unallocated liabilities 1 218 656
Consolidated total liabilities 2 957 333
Capital expenditure 592 200 32 730 4 029 628 959
Unallocated capital expenditure 65 643
694 602
Depreciation 92 348 25 403 3 626 121 377
Unallocated depreciation 11 809
133 186
Amortisation 6 226 — — 6 226
Unallocated amortisation 308
6 534
PALABORA MINING COMPANY LIMITED
58
No tes to the f inancial statements continued
for the year ended 31 December 2002
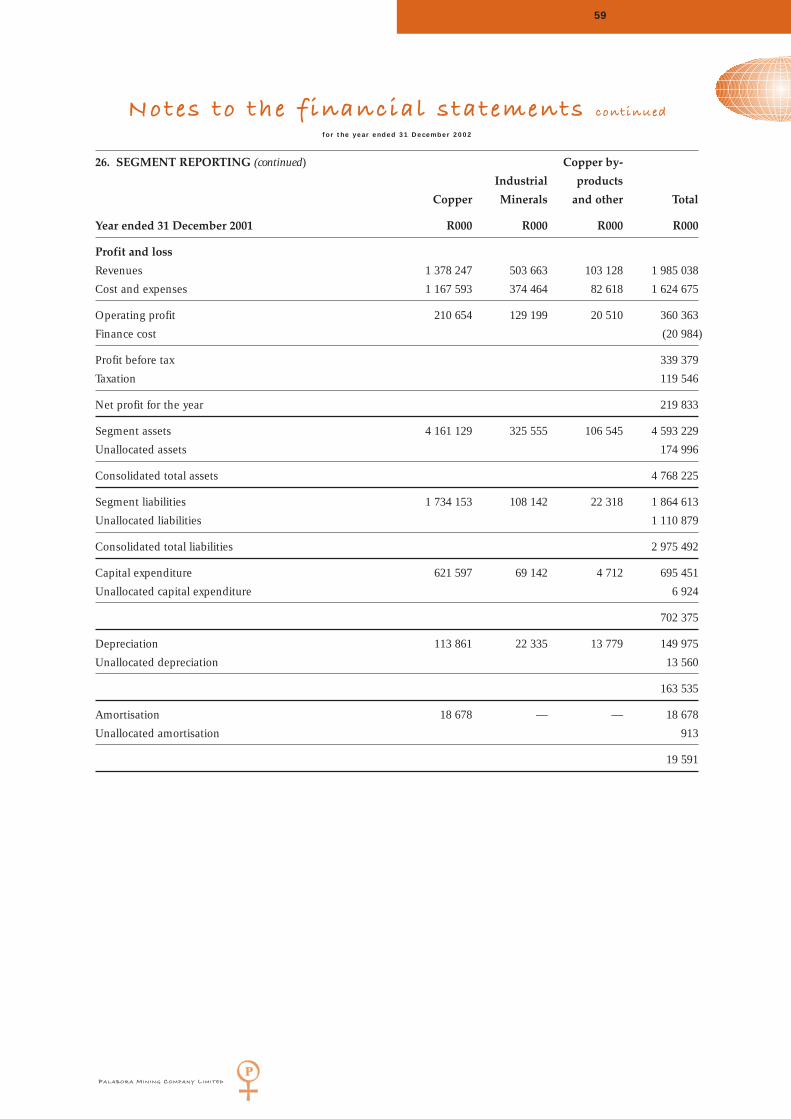
PALABORA MINING COMPANY LIMITED
59
No tes to the f inancial statements continued
for the year ended 31 December 2002
26. SEGMENT REPORTING (continued) Copper by-
Industrial products
Copper Minerals and other Total
Year ended 31 December 2001 R000 R000 R000 R000
Profit and loss
Revenues 1 378 247 503 663 103 128 1 985 038
Cost and expenses 1 167 593 374 464 82 618 1 624 675
Operating profit 210 654 129 199 20 510 360 363
Finance cost (20 984)
Profit before tax 339 379
Taxation 119 546
Net profit for the year 219 833
Segment assets 4 161 129 325 555 106 545 4 593 229
Unallocated assets 174 996
Consolidated total assets 4 768 225
Segment liabilities 1 734 153 108 142 22 318 1 864 613
Unallocated liabilities 1 110 879
Consolidated total liabilities 2 975 492
Capital expenditure 621 597 69 142 4 712 695 451
Unallocated capital expenditure 6 924
702 375
Depreciation 113 861 22 335 13 779 149 975
Unallocated depreciation 13 560
163 535
Amortisation 18 678 — — 18 678
Unallocated amortisation 913
19 591
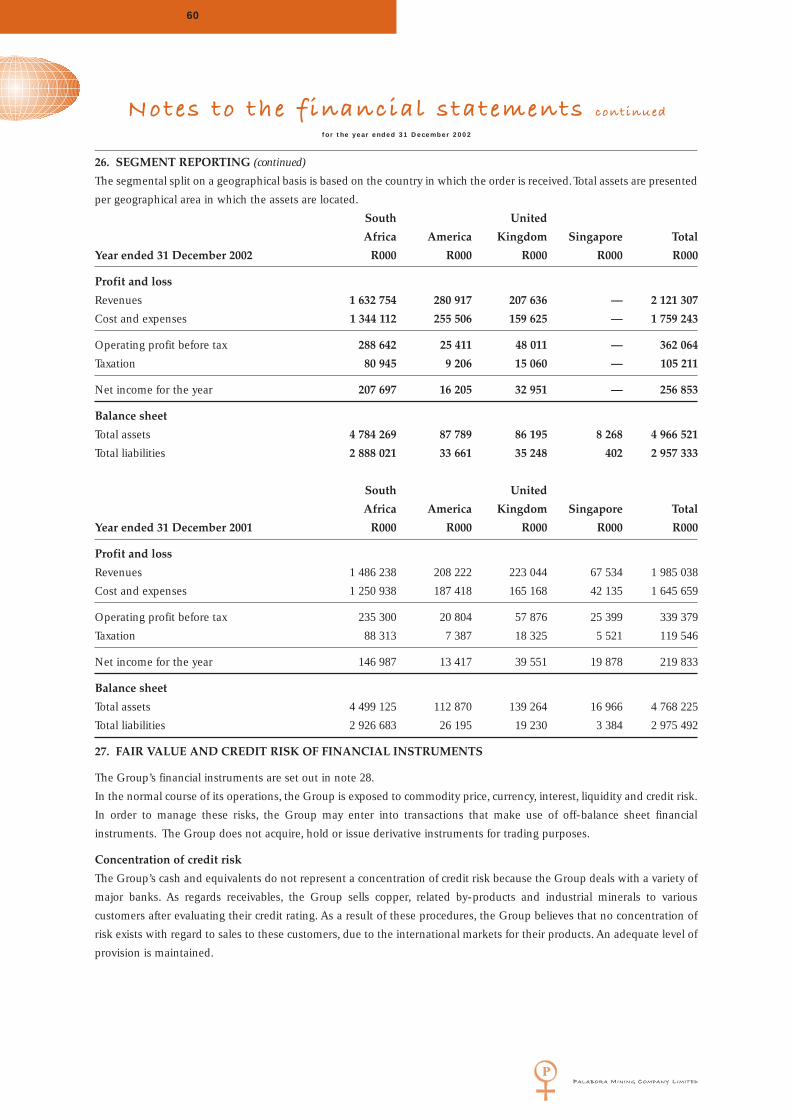
26. SEGMENT REPORTING (continued)
The segmental split on a geographical basis is based on the country in which the order is received.Total assets are presented
per geographical area in which the assets are located.
South United
Africa America Kingdom Singapore Total
Year ended 31 December 2002 R000 R000 R000 R000 R000
Profit and loss
Revenues 1 632 754 280 917 207 636 — 2 121 307
Cost and expenses 1 344 112 255 506 159 625 — 1 759 243
Operating profit before tax 288 642 25 411 48 011 — 362 064
Taxation 80 945 9 206 15 060 — 105 211
Net income for the year 207 697 16 205 32 951 — 256 853
Balance sheet
Total assets 4 784 269 87 789 86 195 8 268 4 966 521
Total liabilities 2 888 021 33 661 35 248 402 2 957 333
South United
Africa America Kingdom Singapore Total
Year ended 31 December 2001 R000 R000 R000 R000 R000
Profit and loss
Revenues 1 486 238 208 222 223 044 67 534 1 985 038
Cost and expenses 1 250 938 187 418 165 168 42 135 1 645 659
Operating profit before tax 235 300 20 804 57 876 25 399 339 379
Taxation 88 313 7 387 18 325 5 521 119 546
Net income for the year 146 987 13 417 39 551 19 878 219 833
Balance sheet
Total assets 4 499 125 112 870 139 264 16 966 4 768 225
Total liabilities 2 926 683 26 195 19 230 3 384 2 975 492
27. FAIR VALUE AND CREDIT RISK OF FINANCIAL INSTRUMENTS
The Group’s financial instruments are set out in note 28.
In the normal course of its operations, the Group is exposed to commodity price, currency, interest, liquidity and credit risk.
In order to manage these risks, the Group may enter into transactions that make use of off-balance sheet financial
instruments. The Group does not acquire, hold or issue derivative instruments for trading purposes.
Concentration of credit risk
The Group’s cash and equivalents do not represent a concentration of credit risk because the Group deals with a variety of
major banks. As regards receivables, the Group sells copper, related by-products and industrial minerals to various
customers after evaluating their credit rating. As a result of these procedures, the Group believes that no concentration of
risk exists with regard to sales to these customers, due to the international markets for their products. An adequate level of
provision is maintained.
PALABORA MINING COMPANY LIMITED
60
No tes to the f inancial statements continued
for the year ended 31 December 2002
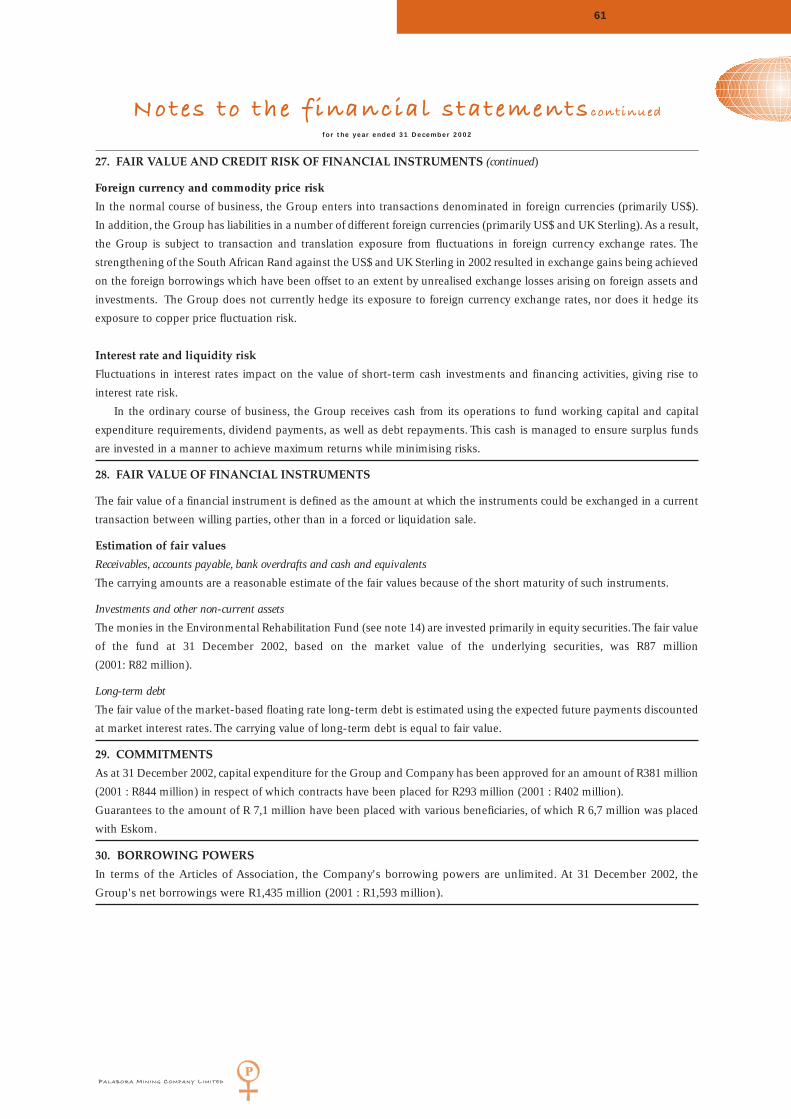
PALABORA MINING COMPANY LIMITED
61
No tes to the f inancial statements continued
for the year ended 31 December 2002
27. FAIR VALUE AND CREDIT RISK OF FINANCIAL INSTRUMENTS (continued)
Foreign currency and commodity price risk
In the normal course of business, the Group enters into transactions denominated in foreign currencies (primarily US$).
In addition, the Group has liabilities in a number of different foreign currencies (primarily US$ and UK Sterling). As a result,
the Group is subject to transaction and translation exposure from fluctuations in foreign currency exchange rates. The
strengthening of the South African Rand against the US$ and UK Sterling in 2002 resulted in exchange gains being achieved
on the foreign borrowings which have been offset to an extent by unrealised exchange losses arising on foreign assets and
investments. The Group does not currently hedge its exposure to foreign currency exchange rates, nor does it hedge its
exposure to copper price fluctuation risk.
Interest rate and liquidity risk
Fluctuations in interest rates impact on the value of short-term cash investments and financing activities, giving rise to
interest rate risk.
In the ordinary course of business, the Group receives cash from its operations to fund working capital and capital
expenditure requirements, dividend payments, as well as debt repayments. This cash is managed to ensure surplus funds
are invested in a manner to achieve maximum returns while minimising risks.
28. FAIR VALUE OF FINANCIAL INSTRUMENTS
The fair value of a financial instrument is defined as the amount at which the instruments could be exchanged in a current
transaction between willing parties, other than in a forced or liquidation sale.
Estimation of fair values
Receivables, accounts payable, bank overdrafts and cash and equivalents
The carrying amounts are a reasonable estimate of the fair values because of the short maturity of such instruments.
Investments and other non-current assets
The monies in the Environmental Rehabilitation Fund (see note 14) are invested primarily in equity securities.The fair value
of the fund at 31 December 2002, based on the market value of the underlying securities, was R87 million
(2001: R82 million).
Long-term debt
The fair value of the market-based floating rate long-term debt is estimated using the expected future payments discounted
at market interest rates. The carrying value of long-term debt is equal to fair value.
29. COMMITMENTS
As at 31 December 2002, capital expenditure for the Group and Company has been approved for an amount of R381 million
(2001 : R844 million) in respect of which contracts have been placed for R293 million (2001 : R402 million).
Guarantees to the amount of R 7,1 million have been placed with various beneficiaries, of which R 6,7 million was placed
with Eskom.
30. BORROWING POWERS
In terms of the Articles of Association, the Company's borrowing powers are unlimited. At 31 December 2002, the
Group's net borrowings were R1,435 million (2001 : R1,593 million).
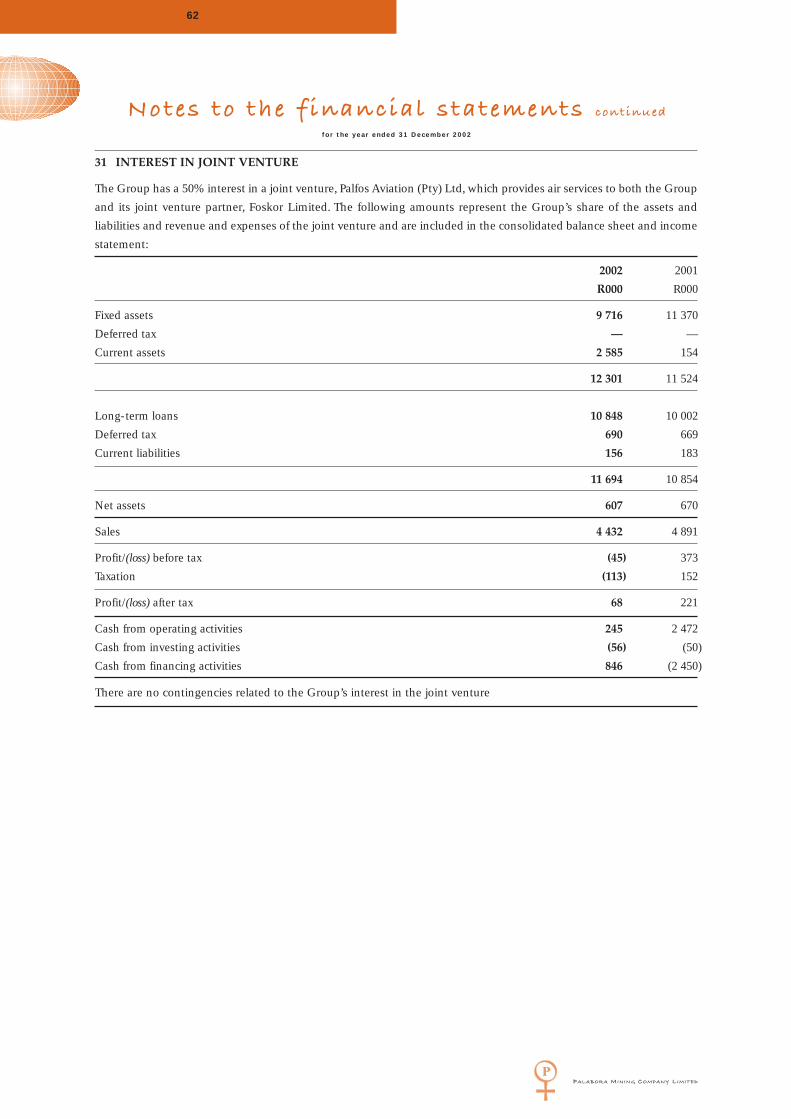
31 INTEREST IN JOINT VENTURE
The Group has a 50% interest in a joint venture, Palfos Aviation (Pty) Ltd, which provides air services to both the Group
and its joint venture partner, Foskor Limited. The following amounts represent the Group’s share of the assets and
liabilities and revenue and expenses of the joint venture and are included in the consolidated balance sheet and income
statement:
2002 2001
R000 R000
Fixed assets 9 716 11 370
Deferred tax — —
Current assets 2 585 154
12 301 11 524
Long-term loans 10 848 10 002
Deferred tax 690 669
Current liabilities 156 183
11 694 10 854
Net assets 607 670
Sales 4 432 4 891
Profit/(loss) before tax (45) 373
Taxation (113) 152
Profit/(loss) after tax 68 221
Cash from operating activities 245 2 472
Cash from investing activities (56) (50)
Cash from financing activities 846 (2 450)
There are no contingencies related to the Group’s interest in the joint venture
PALABORA MINING COMPANY LIMITED
62
No tes to the f inancial statements continued
for the year ended 31 December 2002

PALABORA MINING COMPANY LIMITED
63
No tes to the f inancial statements continued
for the year ended 31 December 2002
32. CONTINGENT ASSETS AND LIABILITIES
As outlined in note 19, Palabora Mining Company operated a defined benefit pension fund until 31 August 2002.
Liquidation of this pension fund commenced in September 2002. The only remaining assets in the pension fund relate to
the surplus that existed when liquidation commenced. The South African Parliament approved revised pension fund
legislation in December 2002. The new legislation stipulates that, in addition to the Company being entitled to a share of
the surplus, past and current employees are also entitled to share in the distribution of the surplus.
Consequently, the Company has not recognized its portion of the surplus as an asset in its balance sheet. An asset may
be recognized once the impact of the revised legislation on the Company’s share of the surplus has been determined.
During 2001, the Company offered early voluntary retirement to its employees with no reduction in pension
entitlement. The cost of early voluntary retirement was borne by the defined benefit pension scheme in operation at the
time. It is possible that the Company will be required to fund this cost to the pension scheme.
33. RELATED PARTY TRANSACTIONS
The immediate holding company is Palabora Holdings Limited and the ultimate holding company is Rio Tinto plc which
is incorporated in the United Kingdom. Rio Tinto plc’s beneficial interest is 49,2% (2001: 49,2%).
The Group undertakes various arm’s length transactions with related parties for the supply of managerial,
administration, consulting, secretarial and technical services as disclosed in note 3 from the following companies:
Rio Tinto London, Rio Tinto Technical Services Bristol, Rio Tinto Technical Services Australia, Rio Tinto Japan, Rio
Tinto Services Melbourne, Rio Tinto Indonesia, Comalco Aluminium Australia and Rio Tinto Management Services
South Africa.
During 2002, the Group also entered into a transaction with Minera Escondida Limitada, a Chilean copper mining
company, to purchase approximately 10 000 tons of copper concentrate on an arm’s length basis. Minera Escondida
Limitada is ultimately 30% owned by Rio Tinto plc.
The amount payable to Group Companies per the balance sheet is predominantly an intercompany loan of
R10,9 million from Rio Tinto Management Services South Africa. The loan is interest free with no fixed terms of
repayment. The carrying value of the Group Company liabilities approximates the fair value.
34. POST BALANCE SHEET EVENTS
Since 1987, Palabora donated 3% of its after tax profits to the Palabora Foundation. As intended, the Foundation has
been able to build up a capital base from these donations. At a board meeting in 2003 the directors passed a resolution
approving a three year moratorium on donations from Palabora Mining Company to the Palabora Foundation. During
this period, the capital base of the Foundation together with donations from a number of parties for specific projects will
provide it with adequate funding. The future funding of the Foundation will be reviewed once the moratorium period
ceases. The period covered by the moratorium is the financial accounting periods for 2001, 2002 and 2003.
During the first half of 2003, the aggregate effect of the delay in ramp up of the underground mine and the strength
of the Rand against the US dollar, partly offset by the cost savings achieved by the company, had a significant adverse
effect on the company’s cash flow. The cumulative effect of these issues is that the company needs to increase its cash
resources through a shareholder supported re-financing package.
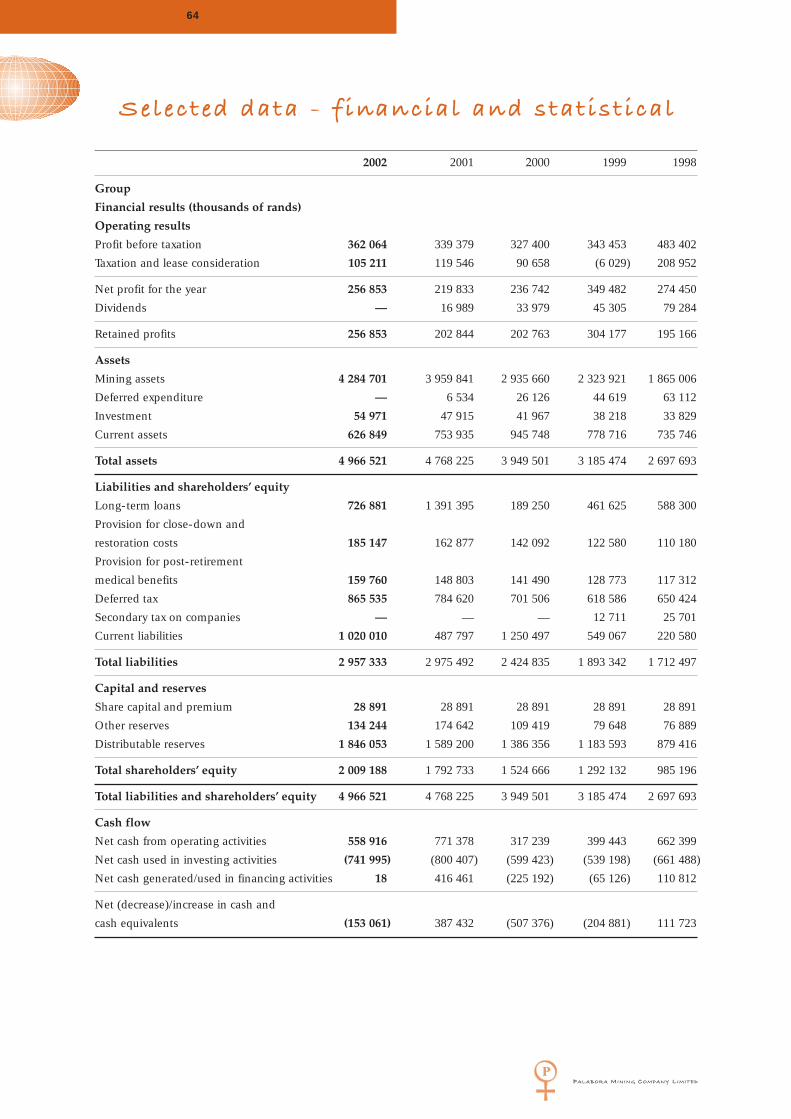
2002 2001 2000 1999 1998
Group
Financial results (thousands of rands)
Operating results
Profit before taxation 362 064 339 379 327 400 343 453 483 402
Taxation and lease consideration 105 211 119 546 90 658 (6 029) 208 952
Net profit for the year 256 853 219 833 236 742 349 482 274 450
Dividends — 16 989 33 979 45 305 79 284
Retained profits 256 853 202 844 202 763 304 177 195 166
Assets
Mining assets 4 284 701 3 959 841 2 935 660 2 323 921 1 865 006
Deferred expenditure — 6 534 26 126 44 619 63 112
Investment 54 971 47 915 41 967 38 218 33 829
Current assets 626 849 753 935 945 748 778 716 735 746
Total assets 4 966 521 4 768 225 3 949 501 3 185 474 2 697 693
Liabilities and shareholders’ equity
Long-term loans 726 881 1 391 395 189 250 461 625 588 300
Provision for close-down and
restoration costs 185 147 162 877 142 092 122 580 110 180
Provision for post-retirement
medical benefits 159 760 148 803 141 490 128 773 117 312
Deferred tax 865 535 784 620 701 506 618 586 650 424
Secondary tax on companies — — — 12 711 25 701
Current liabilities 1 020 010 487 797 1 250 497 549 067 220 580
Total liabilities 2 957 333 2 975 492 2 424 835 1 893 342 1 712 497
Capital and reserves
Share capital and premium 28 891 28 891 28 891 28 891 28 891
Other reserves 134 244 174 642 109 419 79 648 76 889
Distributable reserves 1 846 053 1 589 200 1 386 356 1 183 593 879 416
Total shareholders’ equity 2 009 188 1 792 733 1 524 666 1 292 132 985 196
Total liabilities and shareholders’ equity 4 966 521 4 768 225 3 949 501 3 185 474 2 697 693
Cash flow
Net cash from operating activities 558 916 771 378 317 239 399 443 662 399
Net cash used in investing activities (741 995) (800 407) (599 423) (539 198) (661 488)
Net cash generated/used in financing activities 18 416 461 (225 192) (65 126) 110 812
Net (decrease)/increase in cash and
cash equivalents (153 061) 387 432 (507 376) (204 881) 111 723
PALABORA MINING COMPANY LIMITED
64
Selected data - f inancial and statist ical

PALABORA MINING COMPANY LIMITED
65
Selected data - f inancial and statist icalcontinued
2002 2001 2000 1999 1998
Group
Statistics per share
Shares in issue (thousands) 28 316 28 316 28 316 28 316 28 316
Earnings (cents) 907 776 836 1 234 969
Headline earnings (cents) 839 775 791 1 131 923
Dividends (cents) — 60 120 160 280
Dividend cover — 12,93 6,97 7,71 3,46
Market price during year (cents)
High 7 600 6 550 5 100 5 550 5 000
Low 5 850 3 400 2 650 2 655 2 500
Market price at 31st December (cents) 6 999 6 500 4 600 4 475 3 250
Market capitalization at 31st December (Rm) 1 982 1 841 1 303 1 267 920
Number of employees 2 011 2 245 2 617 2 524 2 657
Sales revenue (thousands of rand)
Copper 1 459 146 1 378 247 1 139 965 1 117 982 1 231 249
Industrial minerals 535 249 503 663 502 073 411 378 489 734
Other products 126 912 103 128 105 647 52 600 82 931
Total sales 2 121 307 1 985 038 1 747 685 1 581 960 1 803 914
Average copper price realised per
metric ton 17 355 14 006 12 949 10 102 9 574
Production and sales statistics
(metric tons)
Palabora material 81 619 86 904 85 243 100 044 104 026
Purchased material — — 2 440 564 59
Total cathode production 81 619 86 904 87 683 100 608 104 085
Production cost per metric ton of copper
including depreciation R14 476 R8 928 R7 682 R6 901 R5 614
Sales (metric tons)
– Copper 83 390 95 900 84 211 101 390 109 284
– Concentrate (copper content) 952 4 263 5 472 6 885 33 115
Anode slimes 112 151 213 174 156
Uranium concentrates — 45 89 168 —
Vermiculite 189 948 185 542 189 765 200 071 229 040
Zirconia products 1 696 7 090 8 443 6 762 9 030
Magnetite 176 129 190 882 193 593 187 344 204 719
Sulphuric acid 114 301 119 679 103 778 107 024 104 389

PALABORA MINING COMPANY LIMITED
66
Selected data - production continued
Mining and milling
Mining MillingMaterialloaded Ore treated Copper concentrate produced Finished magnetite
and hauled concentrate producedYear Metric tons Metric tons % Cu Metric tons % Cu Tons Cu % Rec Metric tons % Fe % TiO2
1964 859 444 — — — — — — — — —1965 13 032 175 35 878 1,08 597 33,30 199 59,54 — — —1966 23 483 559 10 880 635 0,78 205 519 31,62 64 980 78,15 315 161 67,2 0,781967 26 365 391 13 257 691 0,71 230 115 33,47 77 106 81,90 872 309 67,0 0,751968 33 160 107 14 258 160 0,64 210 698 35,18 74 133 81,61 726 206 66,2 0,831969 29 970 399 15 700 128 0,60 247 481 32,22 79 748 84,34 1 032 293 66,1 0,881970 41 231 770 18 948 438 0,54 261 154 33,23 86 769 84,39 977 455 66,5 0,941971 42 805 300 19 086 776 0,57 270 675 33,83 91 578 83,96 951 531 66,6 0,921972 45 192 690 19 298 692 0,56 260 133 35,18 91 524 84,06 946 425 66,6 0,901973 47 347 590 19 184 961 0,57 249 828 37,29 93 158 84,89 726 257 66,0 0,961974 50 021 150 19 232 245 0,56 259 939 35,19 91 468 84,45 741 864 66,2 1,171975 56 716 240 19 527 088 0,56 266 073 35,15 93 527 84,71 587 922 65,7 1,071976 79 286 530 19 627 222 0,55 257 244 36,72 94 450 86,81 563 808 65,8 1,101977 89 480 040 24 863 927 0,52 307 248 35,64 109 503 84,89 449 798 65,8 1,221978 90 029 980 27 473 847 0,51 330 883 35,86 118 641 84,87 96 476 66,2 1,191979 86 214 160 27 076 914 0,49 296 295 37,76 111 872 84,84 — — —1980 107 940 469 28 571 069 0,48 322 149 35,95 115 826 84,39 94 667 64,6 1,051981 100 741 752 28 748 075 0,51 355 131 35,00 124 311 84,77 119 228 65,1 1,051982 98 881 581 29 314 456 0,50 331 299 37,36 123 761 84,04 91 363 64,8 1,251983 100 972 849 28 943 773 0,51 322 453 36,50 121 337 82,63 48 737 67,3 0,901984 101 660 644 29 199 214 0,50 332 261 38,37 123 668 84,07 156 313 67,1 1,091985 100 230 188 27 084 009 0,51 311 245 36,46 113 476 82,04 79 601 67,1 1,241986 95 390 673 29 412 163 0,49 338 473 35,70 120 842 83,82 110 000 67,2 1,181987 82 605 747 29 425 615 0,50 339 585 36,73 124 730 84,23 70 931 67,1 1,071988 71 505 213 29 230 845 0,45 294 429 37,94 111 692 84,12 55 556 64,6 2,051989 62 121 824 29 408 436 0,49 323 120 37,43 120 937 83,57 178 204 64,8 2,311990 49 102 124 29 293 312 0,51 324 946 38,72 125 829 84,12 50 800 64,7 1,741991 37 315 989 28 179 598 0,53 348 800 36,16 126 112 84,01 104 121 65,0 1,771992 37 767 664 28 964 423 0,53 366 245 35,17 128 794 83,79 90 311 65,1 1,741993 37 811 244 28 544 250 0,53 369 927 34,17 126 401 84,15 150 264 62,3 2,041994 38 224 317 28 351 531 0,54 380 352 33,54 127 571 82,82 133 133 63,4 2,151995 34 786 613 29 550 629 0,58 418 936 33,83 141 723 83,12 133 428 65,3 2,091996 33 193 259 29 153 304 0,59 421 711 34,00 143 365 84,06 118 288 66,9 1,871997 30 794 431 28 846 152 0,55 389 280* 35,34* 137 576* 83,73* 183 574 65,5 1,601998 30 342 455 28 758 548 0,58 446 786* 33,22* 148 413* 83,93* 217 338 61,7 1,601999 25 418 937 28 343 747 0,47 386 099* 34,07* 131 536* 83,78* 190 692 — —2000 20 054 094 25 735 830 0,58 388 151* 32,86* 127 548* 77,36* 239 847 — —2001 12 002 168 14 522 487 0,65 225 300* 33,94* 76 466* 82,36* 200 995 — —2002 9 976 390 9 932 721 0,63 205 484* 31,32* 64 367* 80,27 171 651 — —
*Includes concentrate produced from recycled smelter inventory.Smelting and heavy minerals
Smelting Heavy mineralsConcen- 100% U308 in Zr02
trate Anodes produced sulphuric calcine processedsmelted Palabora Purchased Toll Total % % acid produced to chemicals
Year Metric tons Cu Recovery Metric tons Year Kilograms Metric tons1964 — — — — — — — — 1964 — —1965 — — — — — — — — 1965 — —1966 204 448 61 939 — — 61 939 99,26 96,65 46 340 1966 — —1967 231 500 76 539 — — 76 539 99,30 98,09 94 813 1967 — —1968 227 780 72 060 — 14 121 86 181 99,50 98,29 92 828 1968 — —1969 286 913 77 290 1 249 3 064 81 603 99,49 98,20 96 060 1969 — —1970 273 659 87 602 4 301 659 92 562 99,50 97,81 82 799 1970 — —1971 281 034 90 290 7 664 — 97 954 99,49 98,60 70 327 1971 60 842 —1972 300 284 90 252 9 635 13 143 113 030 99,52 99,36 81 324 1972 140 275 391973 293 687 93 637 2 300 12 834 108 771 99,55 98,29 103 676 1973 131 089 6431974 312 681 90 364 2 057 19 724 112 145 99,49 97,79 98 379 1974 124 312 3 1031975 266 315 91 816 2 536 11 193 105 544 99,47 97,47 108 496 1975 125 291 5 1961976 256 684 93 360 2 304 10 223 105 888 99,44 98,32 114 882 1976 143 277 3671977 353 638 106 519 2 414 17 104 126 037 99,48 97,96 130 533 1977 88 661 1 5061978 367 349 114 678 36 15 368 130 082 99,50 97,29 133 653 1978 140 860 3 0671979 342 606 112 204 — 18 066 130 270 99,52 98,03 122 410 1979 121 252 4 4521980 357 802 115 826 — 15 178 131 004 99,47 98,94 117 488 1980 170 369 4 3591981 373 743 120 082 118 7 977 128 177 99,45 97,69 116 855 1981 234 206 4 9411982 346 254 122 316 118 9 864 132 298 99,47 98,01 128 373 1982 257 879 6 4901983 369 236 120 679 1 346 12 928 134 953 99,50 98,48 127 855 1983 218 635 5 5311984 370 913 117 196 7 748 12 900 137 845 99,53 97,43 116 023 1984 159 769 9 1581985 366 997 112 347 7 310 12 616 132 273 99,47 97,61 135 631 1985 217 828 11 2971986 366 479 107 553 13 794 10 589 131 936 99,48 97,38 147 067 1986 185 443 12 0111987 360 817 116 863 12 569 — 129 432 99,43 96,56 150 701 1987 175 944 10 1291988 325 316 107 927 12 539 — 120 466 99,55 97,53 134 610 1988 87 496 13 0171989 359 293 111 235 15 111 — 126 345 99,56 97,32 135 661 1989 110 671 12 4891990 331 669 111 559 8 468 — 120 027 99,57 96,67 97 655 1990 109 170 14 6391991 333 375 119 359 2 940 — 122 299 99,57 96,55 123 535 1991 130 501 13 1041992 302 782 100 849 4 602 — 105 451 99,51 96,64 107 942 1992 115 048 12 2391993 331 243 110 549 1 327 — 111 876 99,49 97,11 120 984 1993 92 570 13 1881994 364 396 112 498 4 650 — 117 148 99,46 97,55 147 657 1994 162 254 12 1631995 366 964 111 221 2 794 — 114 014 99,49 96,77 158 895 1995 132 653 13 2431996 327 687 101 217 4 541 — 105 758 99,44 96,38 142 491 1996 100 168 11 4481997 371 893* 111 557 7 485 — 119 042 99,48 92,47 121 650 1997 87 070 9 3871998 319 201* 106 296 — — 106 296 99,44 94,75 135 148 1998 104 950 7 4861999 337 861* 101 583 — — 101 583 99,41 97,84 140 229 1999 96 210 —2000 311 394* 90 727 — — 90 727 99,40 95,40 139 491 2000 86 200 —2001 317 983* 85 517 — — 85 517 99,44 95,58 139 214 2001 41 585 —2002 258 556* 82 261 — — 82 261 99,45 97,13 117,238 2002 — —
*Includes recycled concentrate smelted

PALABORA MINING COMPANY LIMITED
67
Selected data - production continued
Refining
PreciousPalabora copper produced Other copper produced metal content
of refineryTotal Processed to: Total Processed to shapes Total* slimes
cathode Cast shapes Rod cathode Purchased Toll producedYear Metric tons Kilograms1964 — — — — — — — —1965 — — — — — — — —1966 — — — — — — — —1967 — — — — — — — —1968 37 241 25 490 2 399 7 362 — 7 362 44 603 5 1221969 41 397 17 606 21 428 5 192 1 241 3 951 46 589 5 0201970 48 086 20 083 30 316 5 335 4 272 1 063 53 421 6 8111971 52 005 15 930 36 046 7 613 7 613 — 59 618 7 8981972 51 998 16 560 35 463 9 322 9 322 — 61 320 10 5171973 70 114 23 357 46 385 2 252 2 252 — 72 366 11 9461974 61 391 15 715 44 343 9 199 2 021 7 178 70 590 10 3471975 61 923 16 007 43 204 8 144 2 518 5 292 70 067 12 1991976 71 501 14 589 36 175 10 438 2 271 764 81 939 11 8481977 106 698 7 808 35 782 19 983 2 383 — 126 681 16 1591978 114 652 15 782 37 121 14 757 37 1 313 129 409 20 5161979 111 014 8 051 48 829 17 253 — 2 662 128 267 22 5371980 114 008 3 621 72 230 15 584 — 2 340 129 592 22 6801981 120 924 152 79 668 6 359 — — 127 283 15 5451982 116 080 511 70 082 10 394 — — 126 474 19 1621983 124 852 1 153 68 050 13 886 — — 138 738 19 6711984 116 448 715 77 950 20 047 — — 136 495 18 7071985 112 008 995 66 492 20 035 — — 132 043 17 2921986 104 846 1 049 66 369 24 018 — — 128 864 17 0201987 106 662 824 67 424 20 610 — — 127 272 17 7241988 99 164 1 238 74 049 19 292 — — 118 456 17 2271989 115 689 — 69 646 10 517 — — 126 206 17 1181990 107 750 20 63 508 8 255 — — 116 005 17 7591991 117 965 4 60 863 705 — — 118 670 16 3391992 104 246 1 59 359 — — — 104 246 14 3381993 109 145 76 62 520 506 — — 109 650 14 8521994 111 138 2 75 181 4 410 — — 115 549 14 8831995 112 855 9 79 758 2 926 — — 115 782 14 3711996 100 180 109 71 764 4 163 –– –– 104 343 12 6771997 105 557 164 82 529 7 607 — — 113 164 15 5461998 104 026 5 003 68 742 58 940 — — 104 085 11 2911999 100 044 3 285 56 640 — — — 100 608 10 4462000 87 683 6 169 66 999 — — — 88 254 7 8042001 86 904 2 697 65 801 — — — 86 904 9 5182002 81 619 5 277 73 513 — — — 81 619 8 285
* Copper cathodes contain 99,97% Cu.Vermiculite
Mining ProcessingMaterial
loaded and hauled Ore treated Tailings reclaim Vermiculite concentrate producedYear Metric tons % Vermiculite1964 1 489 208 595 748 — 101 836 93,401965 1 242 945 587 450 — 115 132 88,001966 1 361 948 596 542 — 103 176 90,601967 1 602 883 697 902 — 100 552 92,601968 1 911 308 697 350 — 110 040 91,701969 1 886 049 791 065 — 128 787 91,101970 1 783 318 747 840 — 123 500 90,701971 1 866 398 702 925 — 132 071 88,401972 1 914 326 974 455 — 147 903 88,101973 2 061 924 1 126 286 — 155 852 90,601974 1 851 145 1 125 364 — 182 613 89,701975 1 769 546 1 228 259 — 207 386 90,501976 1 984 050 1 218 195 — 222 079 90,001977 1 437 834 1 059 713 — 165 420 90,501978 1 756 125 1 208 880 — 209 093 90,101979 1 968 750 1 317 353 — 193 627 89,801980 2 133 833 1 337 355 — 181 794 89,901981 2 095 898 1 254 803 — 175 125 89,401982 2 066 265 1 190 813 — 180 992 89,301983 1 835 190 1 024 088 — 139 292 89,801984 1 930 095 1 138 905 — 164 421 89,901985 2 073 915 1 142 843 — 177 598 90,001986 2 005 155 1 129 972 — 193 973 89,901987 2 174 063 1 372 073 280 778 185 838 89,801988 2 201 626 1 390 680 414 652 203 101 88,501989 2 291 064 1 358 213 397 056 195 525 88,801990 2 610 952 1 239 783 445 783 217 738 89,401991 3 452 025 1 753 447 91 759 197 768 90,381992 2 952 320 1 424 680 236 240 163 894 90,891993 2 827 520 1 557 640 112 240 161 501 89,801994 3 153 560 1 961 990 299 920 216 196 90,211995 2 896 440 1 907 840 197 600 211 965 90,391996 2 737 380 2 074 040 117 100 190 364 89,621997 3 298 080 1 931 080 188 260 207 070 90,741998 3 440 940 1 893 540 280 920 207 337 90,501999 2 844 740 1 965 900 86 160 208 603 90,702000 2 944 240 2 031 100 44 160 208 422 90,652001 2 768 900 1 753 920 242 640 166 078 90,522002 3 651 360 2 270 580 — 224 258 90,10
Copper
Copper operations have made a considerable effort to bring the resource and reserve reporting into line with the
standards laid down by the SAMREC and JORC codes.
The ore reserves and mineral resources were compiled by deducting ore processed in 2002 from ore reserves
compiled in 2001. The other data and reconciliation of production figures were supplied by the survey department.
The reserves previously reported as part of the Sulphide Stockpiles are no longer entirely reportable as a reserve or
resource for Palabora Mining Company Limited as 42 Mt of the original material was awarded to Foskor in exchange for
that part of the underground reserve that is beyond the Foskor boundary. This leaves Palabora with a 12 Mt reserve. The
contaminated sulphide stockpile has been included as a measured resource only, due to the low likelihood of this
material being mined.
The underground reserve has depleted by more than has been produced from the underground mine. This is due to
the inclusion of a part of the underground reserve in the present open pit reserve, to be mined by ramp scavenging.
The Company is in a transition phase from a large volume open pit to a smaller underground cave mine. The open
pit is being mined by a ramp roll-up process called ramp scavenging, and previously stockpiled oxide and low grade
sulphide ores are being processed.
Resources and reserves have been compiled by D H Mossop and P A Townsend, who are the geologist and manager
process improvement respectively, are competent persons in terms of the JSE Securities Exchange regulations and have
extensive experience in resource and reserve estimation.
Vermiculite
Vermiculite Operations have also made a similar effort as per copper operations to bring the resource and reserve
reporting into line with the standards laid down by the SAMREC code. Further refinement of the models is required
before the resources and reserves can he signed off by a Competent Person(s) or team.
Over the past years, an extensive reverse-circulation drilling programme has been completed in the PP and V Area,
which is currently being mined. The drilling and survey database has been thoroughly checked by staff and outside
consultants. This has been followed up with computerized ore body modelling, geostatistical studies and reconciliation
of mining blocks versus resource models and a database of regularly spaced production holes. This has enabled a good
understanding of the ore body in the PP&V mine, as well as the area directly southeast of the mine. It has also highlights
the grey areas in the ore body where more exploration drilling needs to be done.
Resources have been derived by manual pit design at a cut-off of 10% + 425 micron vermiculite.
Reserves have been derived by manual pit design at a cut-off of 15% + 425 micron vermiculite but marginal material
(10% +425 micron included in the pit design) may be blended into the total plant feed. This blending is controlled at the
short-term planning level.
The mineral resources are quoted inclusive of the reserves.
A 13 000-metre R C drilling exploration programme is currently underway in order to address the less-known areas in
the ore body. After completion of the exploration programme and as soon as the analysed results of the drilled samples
have been received, the results will be computerised and block models generated with the GcmCom software package.
The vermiculite reserves will also be classified according to the fraction sizes.
No VODT, VO mine and Ex. Copper pit vermiculite were mined during 2002. Vermiculite ore was mined only from
the PP&V mine.
The preliminary resources and reserves have been compiled by the geologist responsible for long term
planning, H S Coetzee.
PALABORA MINING COMPANY LIMITED
68
Ore reser ve and mineral resource over view

PALABORA MINING COMPANY LIMITED
69
Ore reser ve and mineral resource over viewcontinued
Measured, Indicated and Inferred Mineral Resource
Category Tons (Mt) Grade (%) Metal (t)
Copper - 2002 2001 2002 2001 2002 2001
Oxide Measured 4,41 4,70 0,60 0,60 26 460 28 200
Stockpiles Indicated — — — — — —
Inferred — — — — — —
Total 4,41 4,70 0,60 0,60 26 460 28 200
Category Tons (Mt) Grade (%) Metal (t)
Copper - 2002 2001 2002 2001 2002 2001
Mixed Measured 0,40 0 0,50 0 2 000 0
Stockpiles Indicated — — — — — —
Inferred — — — — — —
Total 0,40 0 0,50 0 2 000 0
Category Tons (Mt) Grade (%+ 180 micron) Vermiculite (Mt)
2003 2002 2003 2002 2003 2002
Vermiculite Measured 37,4 39,6 34,3 34,3 12,8 13,6
Indicated 46,7 46,7 24,5 24,5 11,4 11,4
Inferred 12,9 12,9 21,6 21,6 2,8 2,8
Total 97,0 99,2 27,9 28,0 27,0 27,8
Proved and Probable Mineral Reserves
Category Tons (Mt) Grade (%) Metal (t)
Copper - 2002 2001 2002 2001 2002 2001
Open pit Proved 2,98 3,30 0,40 0,85 11 920 28 050
Probable — — — — — —
Total 2,98 3,30 0,40 0,85 11 920 28 050
Category Tons (Mt) Grade (%) Metal (t)
Copper - 2002 2001 2002 2001 2002 2001
Underground Proved 216 225 0,69 0,69 1 490 400 1 582 000
Probable 16 16 0,49 0,49 78 400 78 400
Total 232 241 0,68 0,68 1 568 800 1 660 400
Category Tons (Mt) Grade (%) Metal (t)
Copper - 2002 2001 2002 2001 2002 2001
Sulphide Proved 12 0 0,14 0 16 800 0
Stockpiles Probable — — — — — —
Total 12 0 0,14 0 16 800 0
Category Tons (Mt) Grade (%+ 180 micron) Vermiculite (Mt)
2003 2002 2003 2002 2003 2002
Vermiculite Proved 7,6 9,8 26,6 28,3 2,0 2,8
Probable 36,2 36,1 33,5 33,5 12,1 12,1
Total 43,8 45,9 32,3 32,3 14,1 14,9
January
Announcement of summary of consolidated results
June
Publication of annual report
Annual general meeting
July
Publication of half-yearly interim report
December
End of financial year
Registered office
1 Copper Road
1389 Phalaborwa
website: www.palabora.co.za
Postal address
PO Box 65, Phalaborwa 1390
Mine address
1 Copper Road
Phalaborwa 1389
PO Box 65, Phalaborwa 1390
website: www.palabora.co.za
Transfer Secretaries
Computershare Investor Services Limited
70 Marshall Street, Johannesburg 2001
Postal address
PO Box 61051, Marshalltown 2107
PALABORA MINING COMPANY LIMITED
70
Shareho lders’ diary Addresses
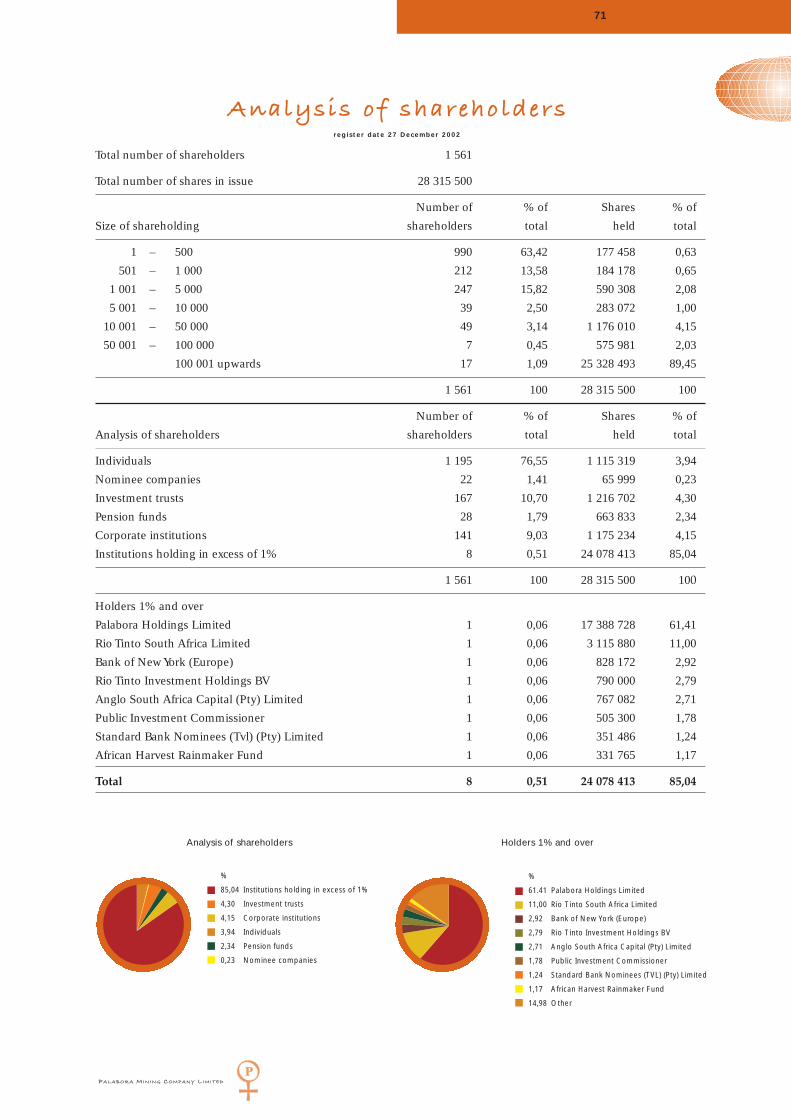
PALABORA MINING COMPANY LIMITED
71
Analysis of shareho ldersregister date 27 December 2002
Total number of shareholders 1 561
Total number of shares in issue 28 315 500
Number of % of Shares % of
Size of shareholding shareholders total held total
1 – 500 990 63,42 177 458 0,63
501 – 1 000 212 13,58 184 178 0,65
1 001 – 5 000 247 15,82 590 308 2,08
5 001 – 10 000 39 2,50 283 072 1,00
10 001 – 50 000 49 3,14 1 176 010 4,15
50 001 – 100 000 7 0,45 575 981 2,03
100 001 upwards 17 1,09 25 328 493 89,45
1 561 100 28 315 500 100
Number of % of Shares % of
Analysis of shareholders shareholders total held total
Individuals 1 195 76,55 1 115 319 3,94
Nominee companies 22 1,41 65 999 0,23
Investment trusts 167 10,70 1 216 702 4,30
Pension funds 28 1,79 663 833 2,34
Corporate institutions 141 9,03 1 175 234 4,15
Institutions holding in excess of 1% 8 0,51 24 078 413 85,04
1 561 100 28 315 500 100
Holders 1% and over
Palabora Holdings Limited 1 0,06 17 388 728 61,41
Rio Tinto South Africa Limited 1 0,06 3 115 880 11,00
Bank of New York (Europe) 1 0,06 828 172 2,92
Rio Tinto Investment Holdings BV 1 0,06 790 000 2,79
Anglo South Africa Capital (Pty) Limited 1 0,06 767 082 2,71
Public Investment Commissioner 1 0,06 505 300 1,78
Standard Bank Nominees (Tvl) (Pty) Limited 1 0,06 351 486 1,24
African Harvest Rainmaker Fund 1 0,06 331 765 1,17
Total 8 0,51 24 078 413 85,04
Holders 1% and overAnalysis of shareholders
%
61.41 Palabora Holdings Limited
11,00 Rio Tinto South Africa Limited
2,92 Bank of New York (Europe)
2,79 Rio Tinto Investment Holdings BV
2,71 Anglo South Africa Capital (Pty) Limited
1,78 Public Investment Commissioner
1,24 Standard Bank Nominees (TVL) (Pty) Limited
1,17 African Harvest Rainmaker Fund
14,98 Other
%
85,04 Institutions holding in excess of 1%
4,30 Investment trusts
4,15 Corporate institutions
3,94 Individuals
2,34 Pension funds
0,23 Nominee companies

Notice is hereby given that the forty-seventh annual general meeting of members of Palabora Mining Company Limited
will be held in the boardroom, Cleveland Centre, 1 Copper Road, Phalaborwa on Monday 30 June 2003, at 09h00 for the
transaction of the following business:
1. To receive and consider the financial statements for the year ended 31 December 2002.
2. To re-elect the following directors of the Company in accordance with the provisions of the Company’s articles of
association: Mrs D A Farnaby, Mr S Langa, Mr R M Maruma, Mr G M Negota, Mr W R J Ranson, Mr D S Sadler and
Mr C N Zungu. Biographical details of those directors who are retiring and are seeking re-election can be found on
pages 5 to 7 of the Annual Report accompanying this notice to members.
3. To authorize the directors to fix the remuneration of the auditors for the year ended 31 December 2002.
4. To consider, and if thought fit, to pass, with or without modification, the following as an ordinary resolution:
“That in terms of article 4(ii)(b) of the articles of association and subject to the statutes, any unissued shares of the
Company may be issued by the directors on such terms and conditions and with such rights and privileges attached
thereto as the directors may determine.”
5. Special resolutions
Special resolution No 1
To consider, and if thought fit to pass, with or without modification, the following resolution as a special resolution:
“That the articles of association of the Company be and there are hereby amended in the following manner:
‘Delete article 92”
The reason for the resolution is that it is no longer a requirement of the J S E Securities Exchange South Africa that a
director of the Company be required to hold qualification shares in a Company.
The effect of the resolution would be to amend the Company’s articles of association by the deletion of article 93, which
requires a director to hold qualification shares in the Company.
Special resolutions No 2
To consider, and if thought fit to pass, with or without modification, the following resolution as a special resolution:
“That the articles of association of the Company be and they amended by the insertion of the following new article 161
after article 160
Communications by electronic medium
161(a)
Notwithstanding anything to the contrary contained in these articles, but subject to the Act and the listings
requirements of the JSE Securities Exchange South Africa (‘JSE’):
161(a)(i)
the Company may send (which, for the purposes of this article 161, includes serving, giving, delivering and the like)
shareholder information to members by electronic medium provided that:
PALABORA MINING COMPANY LIMITED
72
No tice to members

PALABORA MINING COMPANY LIMITED
73
No tice to members continued
161(a)(i)(1)
sending by electronic medium may only be effected to members who have consented in writing, in such form as has
been approved by the JSE, to the sending of such shareholder information by electronic medium and such consent has
not been withdrawn; and
161(a)(i)(2)
the directors have approved the method by which and the electronic medium through which sending of shareholder
information is to be effected;
161(a)(ii)
if the directors so authorize, members may deposit forms of proxy with the Company by electronic medium provided
that the directors have approved the method by which and the electronic medium through which forms of proxy may
be so deposited.
161(b)
For the purposes of this article 144:
161(b)(i)
“electronic medium”means a method of electronic communication which includes, but is not limited to, facsimile,
electronic data message (including, but not limited to, email), bulletin board, internet website, CD ROM and
computer network;
161(b)(ii)
‘shareholder information’ includes, but is not limited to, notices (including, but not limited to, notices of general
meetings and annual general meetings of the Company, dividend notices and interest notices), forms of proxy,
circulars to shareholders (including, but not limited to, circulars requires in terms of the listings requirements of the
(JSE), listing particulars, annual financial statements, group annual financial statements, group reports and interim
reports, and any other document which is determined by the directors to be shareholder information;
161(b)(iii)
shareholder information sent by electronic medium to members shall be deemed to have been received on the day on
which such shareholder information was sent by the Company;
161(b)(iv)
a form of proxy sent by electronic medium shall be deemed to constitute an instrument of proxy for the purposes of
these articles and shall be deemed to comply with such provisions of these articles as may require signature of
instruments of proxy;
161(b)(v)
the reference to ‘in writing’ in article 2 (o) shall include shareholder information produced or communicated by
electronic medium;
161(b)(vi)
the reference to ‘under the hand of the person’ in article 83 shall include the sending of forms of proxy by electronic
medium;

161(b)(vii)
the references to ‘deposited’ in article 84 in respect of the instruments appointing a proxy, shall include the depositing
and lodging of forms of proxy, by electronic medium;
161(b)(viii)
article 147 shall not apply to shareholder information sent by electronic medium. For the purposes of this article 161,
shareholder information sent by electronic medium shall be sent to each member at the address notified in writing by
the member to the Company for this purpose;
161(b)(ix)
the references to ‘by post’ in articles 147 and 154 shall include the sending of shareholder information by “electronic
medium.”
The reasons for and effect of special resolution 2 are to amend the Company’s articles of association to permit the
sending of notices, Company information (including annual financial statements, group annual financial statements
and group reports) and forms of proxy to members electronically and to allow members to deposit forms of proxy
electronically; and, for this purpose to make consequential amendments to other provisions in the articles of
association which deal with writing, depositing, lodging, posting and the like in relation to the sending of such
information and the depositing of forms of proxy. The effect of this resolution will be to allow the Company to send
notices, Company information and forms of proxy electronically.
6. To transact such other business as may be transacted at an ordinary general meeting.
A member entitled to attend and vote at the meeting is entitled to appoint a proxy to attend and speak and vote
in his stead. A proxy need not be a member of the Company. The attention of members is drawn to the fact that
completed proxy forms must reach the transfer secretaries of the Company, Computershare Investor Services Limited,
70 Marshall Street (P O Box 61051, Marshalltown, 2107), Johannesburg, at least 24 hours before the time of the
meeting.
By order of the board
E B R Hone
Company Secretary
14 May 2003
PALABORA MINING COMPANY LIMITED
74
No tice to members continued
Maj
or
pho
tog
rap
hy -
Pie
ter
Min
naar
Des
ign
- Sa
ndi A
rren
bre
cht
and
Dee
Hel
ling
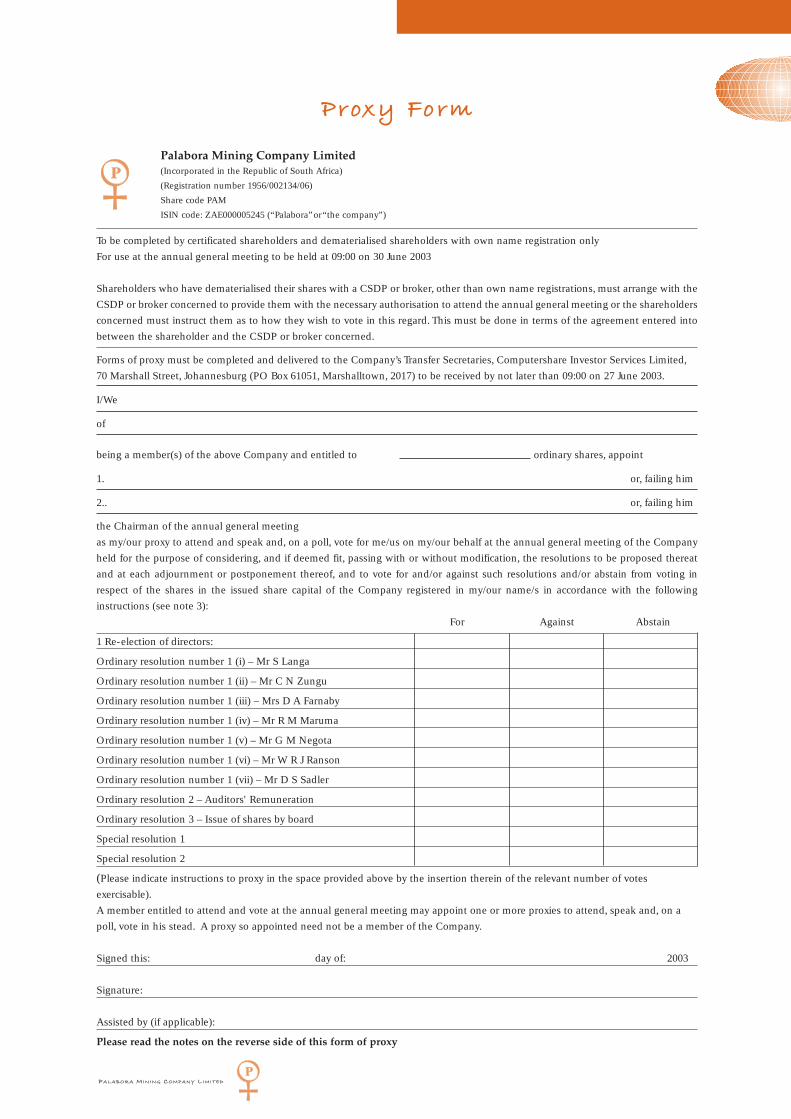
PALABORA MINING COMPANY LIMITED
Proxy Form
To be completed by certificated shareholders and dematerialised shareholders with own name registration only
For use at the annual general meeting to be held at 09:00 on 30 June 2003
Shareholders who have dematerialised their shares with a CSDP or broker, other than own name registrations, must arrange with the
CSDP or broker concerned to provide them with the necessary authorisation to attend the annual general meeting or the shareholders
concerned must instruct them as to how they wish to vote in this regard. This must be done in terms of the agreement entered into
between the shareholder and the CSDP or broker concerned.
Forms of proxy must be completed and delivered to the Company’s Transfer Secretaries, Computershare Investor Services Limited,
70 Marshall Street, Johannesburg (PO Box 61051, Marshalltown, 2017) to be received by not later than 09:00 on 27 June 2003.
I/We
of
being a member(s) of the above Company and entitled to ordinary shares, appoint
1. or, failing him
2.. or, failing him
the Chairman of the annual general meeting
as my/our proxy to attend and speak and, on a poll, vote for me/us on my/our behalf at the annual general meeting of the Company
held for the purpose of considering, and if deemed fit, passing with or without modification, the resolutions to be proposed thereat
and at each adjournment or postponement thereof, and to vote for and/or against such resolutions and/or abstain from voting in
respect of the shares in the issued share capital of the Company registered in my/our name/s in accordance with the following
instructions (see note 3):
For Against Abstain
1 Re-election of directors:
Ordinary resolution number 1 (i) – Mr S Langa
Ordinary resolution number 1 (ii) – Mr C N Zungu
Ordinary resolution number 1 (iii) – Mrs D A Farnaby
Ordinary resolution number 1 (iv) – Mr R M Maruma
Ordinary resolution number 1 (v) – Mr G M Negota
Ordinary resolution number 1 (vi) – Mr W R J Ranson
Ordinary resolution number 1 (vii) – Mr D S Sadler
Ordinary resolution 2 – Auditors' Remuneration
Ordinary resolution 3 – Issue of shares by board
Special resolution 1
Special resolution 2
(Please indicate instructions to proxy in the space provided above by the insertion therein of the relevant number of votes
exercisable).
A member entitled to attend and vote at the annual general meeting may appoint one or more proxies to attend, speak and, on a
poll, vote in his stead. A proxy so appointed need not be a member of the Company.
Signed this: day of: 2003
Signature:
Assisted by (if applicable):
Please read the notes on the reverse side of this form of proxy
Palabora Mining Company Limited(Incorporated in the Republic of South Africa)
(Registration number 1956/002134/06)
Share code PAM
ISIN code: ZAE000005245 (“Palabora”or “the company”)

PALABORA MINING COMPANY LIMITED
P r o x y f o r m
Notes
1. Shareholders who have dematerialised their shares with a CSDP or broker, other than own name registrations, must
arrange with the CSDP or broker concerned to provide them with the necessary authorisation to attend the annual
general meeting or the shareholders concerned must instruct them as to how they wish to vote in this regard. This
must be done in terms of the agreement entered into between the shareholder and the CSDP or broker concerned.
2. A deletion of any printed matter and the completion of any blank spaces need not be signed or initialled. Any
alteration must be signed, not initialled.
3. A shareholder may insert the name of a proxy or the names of two alternate proxies of the shareholder’s choice in
the space provided, with or without deleting “the chairman of the annual general meeting”. The person whose
name stands first on the form of proxy and who is present at the annual general meeting will be entitled to act as
proxy to the exclusion of those whose names follow.
4. A shareholder’s instructions to the proxy must be indicated by the insertion of the relevant number of votes
exercisable by that shareholder in the appropriate space provided. Failure to comply with the above will be deemed
to authorise the proxy to vote or to abstain from voting at the annual general meeting as he deems fit in respect of
all the shareholder’s votes exercisable thereat. A shareholder or his proxy is not obliged to use all the votes
exercisable by the shareholder or by his proxy, but the total of the votes cast and in respect of which abstention is
recorded may not exceed the total of the votes exercisable by the shareholder or his proxy.
5. Where there are joint holders of shares and if more than one of such joint holders is present or represented, then
the person whose name appears first in the register in respect of such shares or his proxy, as the case may be, shall
alone be entitled to vote in respect thereof.
6. Documentary evidence establishing the authority of a person signing this form of proxy in a representative capacity
must be attached to this form, unless previously recorded by the transfer secretaries of the Company or waived by
the Chairman of the annual general meeting.
7. The completion and lodging of this form of proxy will not preclude the signatory from attending the annual general
meeting and speaking and voting in person thereat to the exclusion of any proxy appointed in terms hereof should
such signatory wish to do so.
8. The Chairman of the annual general meeting may reject or, provided that he is satisfied as to the manner in which
a member wishes to vote, accept any form of proxy which is completed other than in accordance with these
instructions.
8. Proxies will only be valid for the purpose of the annual general meeting if delivered to the company’s transfer
secretaries, Computershare Investor Services Limited, 70 Marshall Street, Johannesburg 2001 (PO Box 61051,
Marshalltown, 2107) by not later than 09:00 on 27 June 2003.


![Palabora Copper REQUEST FOR PROPOSAL LOAD AND HAUL ... · Load and Haul Equipment for Logistics At Palabora Copper Request For Proposal – Tender No. [RFP.PC.2017/4] Part 1 – Proposal](https://img.pdfslide.net/doc/110x75/5f9f9b27522d434b842647a5/palabora-copper-request-for-proposal-load-and-haul-load-and-haul-equipment-for.jpg)


![12734 NUEVO CODIGO Procesal Penal de la Provincia de Santa Fe[1].pdf](https://img.pdfslide.net/doc/110x75/55cf989f550346d03398b3ab/12734-nuevo-codigo-procesal-penal-de-la-provincia-de-santa-fe1pdf.jpg)


![CPP Santa Fe - Ley 12734[1]](https://img.pdfslide.net/doc/110x75/5571f8bf49795991698e009d/cpp-santa-fe-ley-127341.jpg)