Embed Size (px)
Citation preview

Northwest Territories Air Quality Report 2016 Rapport de 2016 sur la qualité de l’air aux Territoires du Nord-Ouest


Executive Summary ....................................................................1Résumé ......................................................................................5Glossary .....................................................................................9Acronyms .................................................................................11Introduction .............................................................................12Operations (Network) ...............................................................14Developments in 2016 ..............................................................18Future Plans .............................................................................20NWT Air Quality Standards .......................................................22NWT Air Quality .......................................................................25
Fine Particulate Matter (PM2.5) .........................................................................26Coarse Particulate Matter (PM10) .....................................................................27Ground Level Ozone (O3) .....................................................................................28Nitrogen Dioxide (NO2) ........................................................................................29Carbon Monoxide (CO) .........................................................................................31Sulphur Dioxide (SO2) ...........................................................................................32
Long-term Trends .....................................................................33National Comparisons ..............................................................36Snare Rapids CAPMoN ..............................................................39NWT 2016 Forest Fire Season ...................................................41
Health Messaging from Forest Fires ...............................................................43
Appendix A: 2016 Data Capture ................................................45Appendix B: Air Pollutants ........................................................48
Total Suspended Particulate (TSP) .................................................................48Particulate Matter (PM2.5) and (PM10) ............................................................48Sulphur Dioxide (SO2) ...........................................................................................49Hydrogen Sulphide (H2S) ....................................................................................49Nitrogen Oxides (NOx) ..........................................................................................50Ground Level Ozone (O3) .....................................................................................50Carbon Monoxide (CO) .........................................................................................51Acid Deposition .......................................................................................................51
Appendix C: Monitoring History ...............................................52
All photos credit GNWT unless otherwise stated.
Table of Contents


D e p a r t m e n t o f E n v i r o n m e n t a n d N a t u r a l R e s o u r c e s 1
The Department of Environment and Natural Resources (ENR) monitors air quality in the Northwest Territories (NWT). ENR maintains and operates the NWT Ambient Air Quality Monitoring Network, which consists of four monitoring stations located in Yellowknife, Inuvik, Fort Smith and Norman Wells. Each station continuously collects information on any pollutants in the air as well as temperature, wind speed and wind direction. The Yellowknife, Inuvik and Fort Smith stations are operated in partnership with the National Air Pollution Surveillance (NAPS) program – a joint federal/provincial/territorial monitoring network that tracks regional air quality trends across Canada. Rainwater and snow quantities and chemistry are monitored at Snare Rapids and Wood Buffalo National Park as part of the Canadian Air and Precipitation Monitoring Network (CAPMoN).
THE POLLUTANTS WE MONITOR AND WHYThe air surrounding us on the land and in our communities is called “ambient air”. It contains nitrogen, oxygen, a small amount of carbon dioxide and water vapour. It also contains small amounts of particulate matter and other chemicals. The NWT Ambient Air Quality Standards (AAQS) describe the amount of chemicals and particulate matter allowable in the ambient air. The naturally occurring levels of particulate matter and chemicals in the air are called “background levels”. Human activities and natural events, such as forest fires, can cause the amount of particulate matter and chemicals in the ambient air to increase. By tracking background levels of particulate matter and chemicals we can better assess the impacts of human activities and natural events on air quality.
Particulate Matter (PM2.5 and PM10)Particulate matter comes in different sizes. Fine particulate matter (PM2.5) is about 30 times smaller than the width of a human hair. Coarse particulate matter (PM10) is slightly larger than PM2.5. Both types of particulate matter can be inhaled and can aggravate existing pulmonary and cardiovascular disease. PM2.5 is more dangerous because the particles are so small that they pass easily through our nose and throat defenses and can get deep into our lungs.
Particles in the PM2.5 range are primarily the result of industrial activities, commercial and residential heating, vehicle emissions and forest fire smoke. Particles in the PM10 range include road dust and wind-blown soil.
Executive Summary

N o r t h w e s t Te r r i t o r i e s A i r Q u a l i t y R e p o r t 2 0 1 62
Sulphur Dioxide (SO2)SO2 is a colourless gas that can have negative effects on human and environmental health. Certain types of vegetation (especially lichens) are very sensitive to SO2. SO2 also contributes to the formation of other pollutants in the air. Emissions of SO2 are created during the burning of fossil fuels containing sulphur. Sources of SO2 in the north include power generating plants, commercial and residential heating, and forest fires.
Nitrogen Dioxide (NO2)The sources of NO2 are the same as SO2 as well as vehicle exhaust. High levels can cause serious breathing problems that can become chronic. High levels of NO2 can also lead to formation of other pollutants.
Ground Level Ozone (O3)This is the same gas that is found higher up in the atmosphere, where it is called stratospheric ozone. High in the atmosphere, ozone is a good thing – it protects the planet from the sun’s harmful ultraviolet rays. However, at ground level, ozone can be harmful to humans and plants. High levels of ozone can be created in the lower atmosphere by sunlight and heat causing gases, usually NO2, and cause substances called volatile organic compounds (VOCs) to undergo chemical reactions with each other. High ozone levels can lead to chest tightness, coughing, wheezing and other heart and lung problems. The effect of ozone on plants can be seen as discoloured leaves and general poor vegetation growth.
Carbon Monoxide (CO)CO comes from a number of sources, including home heating, vehicle exhaust and forest fires. Extremely high levels of CO in our air can be poisonous and can cause headaches, shortness of breath and nausea.
OUR NETWORKENR’s monitoring stations are small trailers holding highly specialized instruments that are continuously measuring particulate matter and chemicals in the air. All four stations monitor levels of PM2.5, PM10, SO2, NO2 and O3. At the Yellowknife, Inuvik and Fort Smith stations, we also monitor for CO.
D e p a r t m e n t o f E n v i r o n m e n t a n d N a t u r a l R e s o u r c e s 3
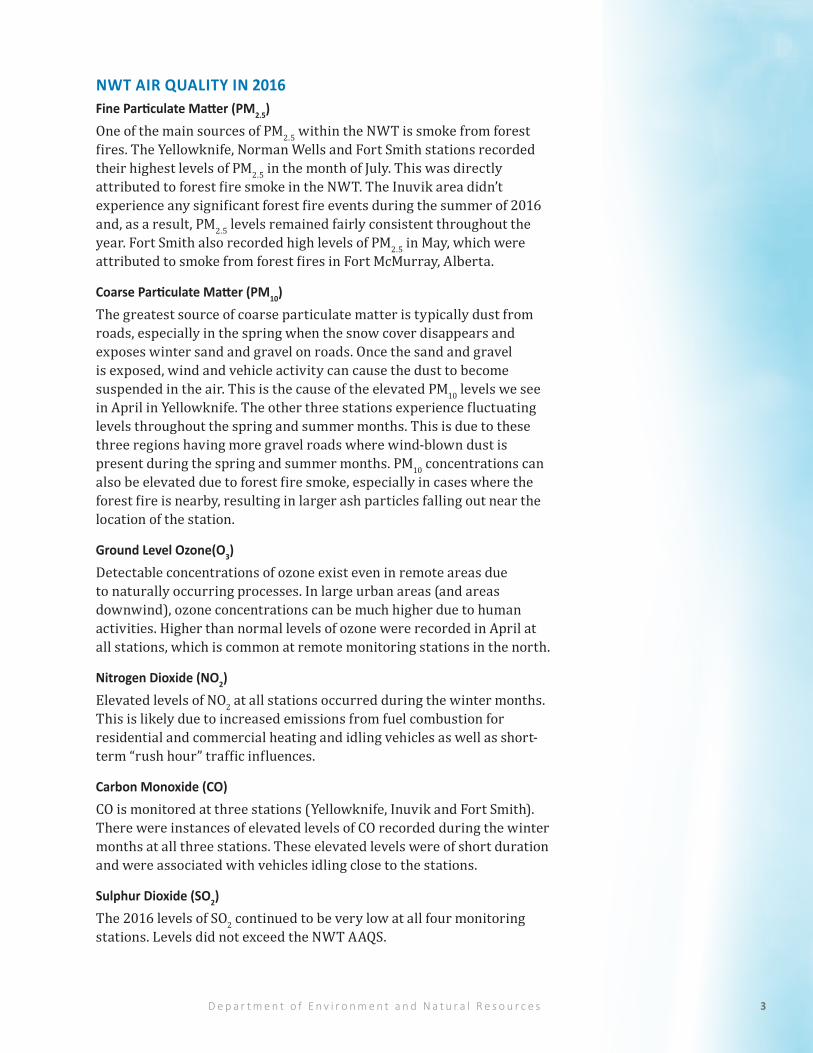
NWT AIR QUALITY IN 2016Fine Particulate Matter (PM2.5)One of the main sources of PM2.5 within the NWT is smoke from forest fires. The Yellowknife, Norman Wells and Fort Smith stations recorded their highest levels of PM2.5 in the month of July. This was directly attributed to forest fire smoke in the NWT. The Inuvik area didn’t experience any significant forest fire events during the summer of 2016 and, as a result, PM2.5 levels remained fairly consistent throughout the year. Fort Smith also recorded high levels of PM2.5 in May, which were attributed to smoke from forest fires in Fort McMurray, Alberta.
Coarse Particulate Matter (PM10)The greatest source of coarse particulate matter is typically dust from roads, especially in the spring when the snow cover disappears and exposes winter sand and gravel on roads. Once the sand and gravel is exposed, wind and vehicle activity can cause the dust to become suspended in the air. This is the cause of the elevated PM10 levels we see in April in Yellowknife. The other three stations experience fluctuating levels throughout the spring and summer months. This is due to these three regions having more gravel roads where wind-blown dust is present during the spring and summer months. PM10 concentrations can also be elevated due to forest fire smoke, especially in cases where the forest fire is nearby, resulting in larger ash particles falling out near the location of the station.
Ground Level Ozone(O3)Detectable concentrations of ozone exist even in remote areas due to naturally occurring processes. In large urban areas (and areas downwind), ozone concentrations can be much higher due to human activities. Higher than normal levels of ozone were recorded in April at all stations, which is common at remote monitoring stations in the north.
Nitrogen Dioxide (NO2)Elevated levels of NO2 at all stations occurred during the winter months. This is likely due to increased emissions from fuel combustion for residential and commercial heating and idling vehicles as well as short-term “rush hour” traffic influences.
Carbon Monoxide (CO)CO is monitored at three stations (Yellowknife, Inuvik and Fort Smith). There were instances of elevated levels of CO recorded during the winter months at all three stations. These elevated levels were of short duration and were associated with vehicles idling close to the stations.
Sulphur Dioxide (SO2)The 2016 levels of SO2 continued to be very low at all four monitoring stations. Levels did not exceed the NWT AAQS.

N o r t h w e s t Te r r i t o r i e s A i r Q u a l i t y R e p o r t 2 0 1 64
CONTACT INFORMATIONIf you have questions about ENR’s air quality monitoring program or would like more information, please contact us or check out ENR’s air quality website at www.enr.gov.nt.ca/en/services/air-quality
Environment DivisionDepartment of Environment and Natural ResourcesGovernment of the Northwest TerritoriesP.O. Box 1320Yellowknife, NT X1A 2L9Telephone: (867) 767-9236 ext. 53176

D e p a r t m e n t o f E n v i r o n m e n t a n d N a t u r a l R e s o u r c e s 5
RésuméLe ministère de l’Environnement et des Ressources naturelles (MERN) surveille la qualité de l’air aux Territoires du Nord-Ouest (TNO). Le MERN maintient et gère le Réseau de surveillance de la qualité de l’air des TNO, composé de quatre stations de surveillance situées à Yellowknife, à Inuvik, à Fort Smith et à Norman Wells. Chacune de ces stations recueille en continu des données sur les polluants atmosphériques présents, la température, ainsi que la vitesse et la direction du vent. Les stations de Yellowknife, d’Inuvik et de Fort Smith sont exploitées en collaboration avec le Réseau national de surveillance de la pollution atmosphérique (Réseau NSPA), un programme fédéral-provincial-territorial visant à observer les tendances régionales de la qualité de l’air au Canada. Les quantités d’eau de pluie et de neige et leur composition chimique sont surveillées à la centrale hydroélectrique Snare Rapids et au parc national Wood Buffalo, dans le cadre du Réseau canadien d’échantillonnage des précipitations et de l’air (RCEPA).
QUELS POLLUANTS SURVEILLONS-NOUS, ET POURQUOI?L’air qui nous entoure sur les terres et dans les collectivités est appelé « l’air ambiant ». Il est constitué d’azote, d’oxygène, et d’une petite quantité de dioxyde de carbone, de vapeur d’eau, de particules et d’autres substances chimiques. Les normes de qualité de l’air ambiant des TNO indiquent la quantité acceptable de substances chimiques et de particules qui peut se trouver dans l’air ambiant. La concentration naturelle de ces éléments dans l’air est appelée « niveau naturel », niveau que les activités humaines et les phénomènes naturels, comme les feux de forêt, peuvent faire augmenter. Le suivi du niveau naturel nous aide à mieux évaluer les répercussions des activités humaines et des phénomènes naturels sur la qualité de l’air.
Particules (PM2,5 et PM10) Les particules peuvent avoir plusieurs tailles : les particules fines (PM2,5) sont environ 30 fois plus petites que la largeur d’un cheveu, alors que les grosses particules (PM10) sont un peu plus larges que les PM2,5. Les deux types peuvent être inhalés et aggraver les maladies pulmonaires ou cardiovasculaires. Les PM2,5 sont plus dangereuses, car elles sont si petites qu’elles contournent facilement les moyens de défense du nez et de la gorge et peuvent pénétrer profondément dans les poumons.
Les PM2,5 proviennent majoritairement des activités industrielles, du chauffage d’immeubles résidentiels et commerciaux, des émissions des véhicules et de la fumée des feux de forêt. Les PM10 comprennent la poussière des routes et la terre portée par le vent.

N o r t h w e s t Te r r i t o r i e s A i r Q u a l i t y R e p o r t 2 0 1 66
Dioxyde de soufre (SO2)Le SO2 est un gaz incolore qui peut avoir des effets nocifs sur la santé humaine et environnementale. Certains types de végétation (en particulier le lichen) y sont très sensibles. Le SO2 contribue aussi à la formation d’autres polluants atmosphériques. Les émissions de SO2 proviennent de l’utilisation de combustibles fossiles qui contiennent du soufre. Dans le Nord, le SO2 provient entre autres des centrales électriques, du chauffage d’immeubles résidentiels et commerciaux, et des feux de forêt.
Dioxyde d’azote (NO2)Les sources de NO2 sont les mêmes que celles du SO2, en plus des gaz d’échappement des véhicules. Un niveau élevé de NO2 peut causer des problèmes respiratoires graves et potentiellement chroniques, et peut contribuer à la formation d’autres polluants.
Ozone troposphérique (O3)On retrouve aussi ce gaz très haut dans l’atmosphère, où il est appelé « ozone stratosphérique » et joue un rôle important : protéger notre planète du rayonnement ultraviolet nocif du soleil. Par contre, l’ozone qu’on retrouve au niveau du sol peut être nocif pour les êtres humains et la végétation. Dans la basse atmosphère, une concentration élevée d’ozone peut se former lorsque la lumière du soleil et les gaz qui libèrent de la chaleur (habituellement le NO2) entraînent des réactions chimiques entre les substances appelées « composés organiques volatils » (COV) qui s’y trouvent. Une forte concentration d’ozone peut causer une gêne respiratoire, une toux, une respiration sifflante et d’autres problèmes cardiaques ou pulmonaires. Les effets de l’ozone sur les plantes se traduisent par une décoloration des feuilles et une faible croissance.
Monoxyde de carbone (CO)Le CO provient d’un certain nombre de sources, par exemple du chauffage d’immeubles résidentiels, des gaz d’échappement des véhicules et des feux de forêt. Une concentration très élevée de CO dans l’air peut être toxique et causer des maux de tête, un essoufflement et des nausées.
NOTRE RÉSEAULes stations de surveillance du MERN sont des petites remorques contenant des instruments hautement spécialisés qui mesurent en continu la quantité de particules et de substances chimiques dans l’air. Les quatre stations surveillent les concentrations de PM2,5, de PM10, de SO2, de NO2 et d’O3. Les stations de Yellowknife, d’Inuvik et de Fort Smith surveillent aussi le CO.
D e p a r t m e n t o f E n v i r o n m e n t a n d N a t u r a l R e s o u r c e s 7
LA QUALITÉ DE L’AIR DES TNO EN 2016Particules fines (PM2,5)L’une des plus importantes sources de PM2,5 aux TNO est la fumée des feux de forêt. Les stations de Yellowknife, de Norman Wells et de Fort Smith ont enregistré en juillet la plus haute concentration de PM2,5, qui était directement attribuable aux feux de forêt aux TNO. La région d’Inuvik n’a pas subi d’importants feux de forêt pendant l’été 2016, et la concentration de PM2,5 est donc restée assez stable toute l’année. Une concentration assez élevée de PM2,5 a été enregistrée à Fort Smith en mai, attribuable aux feux de forêt de Fort McMurray, en Alberta.
Grosses particules (PM10)La plus importante source de grosses particules est habituellement la poussière des routes, particulièrement au printemps, quand la neige fond et expose le sable et le gravier déposés sur la route pendant l’hiver. Le vent et les véhicules soulèvent ensuite ces particules, qui restent suspendues dans l’air. Ce phénomène explique la concentration élevée de PM10 enregistrée en avril à Yellowknife. Les trois autres stations ont recensé des concentrations variables au printemps et à l’été, puisque c’est à ce moment que la poussière des routes de gravier, abondantes dans ces régions, est portée par le vent. Les concentrations de PM10 peuvent aussi augmenter en raison des feux de forêt, surtout si le feu est à proximité de la station, puisque les poussières de cendre sont alors plus volumineuses.
Ozone troposphérique (O3)En raison de processus naturels, des concentrations détectables d’ozone existent même dans les régions éloignées. Dans les grands centres urbains (ou les régions dans la direction du vent), les activités humaines peuvent faire augmenter considérablement la concentration d’ozone. Des concentrations d’ozone plus élevées que la normale ont été recensées en avril à toutes les stations, ce qui est fréquent aux stations de surveillance nordiques éloignées.
Dioxyde d’azote (NO2)Des concentrations élevées de NO2 ont été enregistrées à toutes les stations pendant l’hiver, probablement en raison des émissions provenant de la combustion de carburant due au chauffage d’immeubles résidentiels et commerciaux, aux véhicules tournant au ralenti et à la congestion temporaire causée par « l’heure de pointe ».
Monoxyde de carbone (CO)Les trois stations qui surveillent le CO (Yellowknife, Inuvik et Fort Smith) ont enregistré des concentrations élevées de courte durée pendant l’hiver, attribuables aux véhicules tournant au ralenti près des stations.
Dioxyde de soufre (SO2)Aux quatre stations, les niveaux de SO2 sont restés très bas en 2016 et n’ont pas dépassé les normes de qualité de l’air ambiant des TNO.

N o r t h w e s t Te r r i t o r i e s A i r Q u a l i t y R e p o r t 2 0 1 68
COORDONNÉESSi vous avez des questions à propos du programme de surveillance de la qualité de l’air du MERN, ou si vous voulez en savoir plus, communiquez avec nous ou consultez le site du MERN sur la qualité de l’air : www.enr.gov.nt.ca/en/services/air-quality (en anglais seulement).
Division de l’environnementMinistère de l’Environnement et des Ressources naturelles Gouvernement des Territoires du Nord-OuestC. P. 1320 Yellowknife NT X1A 2L9Téléphone : 867-767-9236, poste 53176

D e p a r t m e n t o f E n v i r o n m e n t a n d N a t u r a l R e s o u r c e s 9
Ambient Air: Atmospheric air in its natural state. It is what we breathe in when the atmosphere is not contaminated by air-borne pollutants.
Anthropogenic: Emissions resulting from human activities, such as those from vehicles or manufacturing.
Black Carbon (BC): Is produced both naturally and by human activities as a result of the incomplete combustion of fossil fuels, biofuels and biomass. Primary sources include emissions from diesel engines, cook stoves, wood burning and forest fires.
Carbon Monoxide (CO): A gas formed from the incomplete combustion of substances that contain carbon (such as gasoline and wood).
Canadian Air and Precipitation Monitoring Network (CAPMoN): A program operated by Environment and Climate Change Canada, designed to study the regional patterns and trends of atmospheric pollutants such as acid rain, smog, particulate matter and mercury, in both air and precipitation.
Chemiluminescence: The emission of light during a chemical reaction that does not produce significant quantities of heat.
Exceedance: The amount by which something, especially a pollutant, exceeds a standard or permissible measurement.
Meteorological: The science that deals with the phenomena of the atmosphere, especially weather and weather conditions.
Micrograms per cubic meter (µg/m3): A measure of pollutant concentration. Micrograms of pollutant per cubic meter of air.
National Air Pollution Surveillance (NAPS): The NAPS network was established in 1969 as a joint program of the federal and provincial governments to monitor and assess ambient air in Canadian urban centres.
Nitrogen Dioxide (NO2): NO2 primarily gets in the air from the burning of fuel. NO2 forms from emissions from cars, trucks, buses, power plants and off-road equipment. Breathing air with a high concentration of NO2 can irritate airways in the human respiratory system.
Oxides of Nitrogen (NOx): Gases that form when nitrogen and oxygen in the atmosphere are burned with fossil fuels at high temperatures. NOx is a precursor to ozone formation.
Glossary

N o r t h w e s t Te r r i t o r i e s A i r Q u a l i t y R e p o r t 2 0 1 61 0
Ozone (O3): An invisible gas occurring naturally in the upper atmosphere, but at ground levels is a major component of smog. It is not emitted directly, but formed as a result of complex chemical reactions when VOCs and NOx react in the presence of sunlight.
Particulate Matter: • PM10 (Coarse Particulate Matter) – Solid or liquid particles with an
aerodynamic particle size less than or equal to 10 micrometers, such as dust and aerosols, which may settle to the ground or stay suspended in air.
• PM2.5 (Fine Particulate Matter) – Small particles or liquid droplets measuring less than or equal to 2.5 micrometers in diameter. Due to their smaller size, these particles can be more harmful to public health than PM coarse particles.
Parts per billion (ppb): A measure of pollutant concentration. Parts of pollutant per billion parts of air.
Parts per million (ppm): A measure of pollutant concentration. Parts of pollutant per million parts of air.
Precursor: A compound that participates in a chemical reaction that produces another compound.
Sulfur Dioxide (SO2): A heavy, pungent, colourless air pollutant formed primarily by the combustion of fossil fuels. It is a respiratory irritant, especially for asthmatics.
Transboundary pollution: Pollution that originates in one province or country, but by crossing the border through pathways of water or air, is able to cause damage to the environment in another province or country.
Volatile Organic Compounds (VOCs): Compounds that contain carbon, oxygen, hydrogen, chlorine and other atoms that can evaporate easily into the atmosphere. They are found in nature as well as in some glues, solvents and paints. They combine with NOx to form O3 near the ground.
D e p a r t m e n t o f E n v i r o n m e n t a n d N a t u r a l R e s o u r c e s 1 1
AAQS Ambient Air Quality Standards
AQHI Air Quality Health Index
ARI Aurora Research Institute
CAAQS Canadian Ambient Air Quality Standards
CAPMoN Canadian Air and Precipitation Monitoring Network
ECCC Environment and Climate Change Canada
ENR Department of Environment and Natural Resources
FS Fort Smith
IN Inuvik
NAPS National Air Pollution Surveillance Program
NTPC Northwest Territories Power Corporation
NW Norman Wells
NWT Northwest Territories
PM Particulate Matter
PM2.5 Fine Particulate Matter
PM10 Course Particulate Matter
ppb Parts per Billion
ppbv Parts per Billion by Volume
ppm Parts per Million
UV Ultraviolet light
VOCs Volatile Organic Compounds
YK Yellowknife
μg/m3 Micrograms per Cubic Meter
Acronyms

N o r t h w e s t Te r r i t o r i e s A i r Q u a l i t y R e p o r t 2 0 1 61 2
Introduction

D e p a r t m e n t o f E n v i r o n m e n t a n d N a t u r a l R e s o u r c e s 1 3
The Department of Environment and Natural Resources (ENR) monitors air quality in the Northwest Territories (NWT). ENR maintains and operates the NWT Ambient Air Quality Monitoring Network, consisting of four monitoring stations located in Yellowknife (YK), Inuvik (IN), Fort Smith (FS) and Norman Wells (NW). Each station is capable of continuously monitoring a variety of air pollutants and meteorological conditions. The Yellowknife, Inuvik and Fort Smith stations are operated in partnership with the National Air Pollution Surveillance (NAPS) program – a joint federal/provincial/territorial monitoring network. The goal of the NAPS program is to provide accurate and long-term air quality data of a uniform standard across Canada. ENR uses data collected from the stations to establish baseline levels of sulphur dioxide (SO2), nitrogen dioxide (NO2), ozone (O3) and particulate matter (PM2.5 and PM10) ahead of development as well as to track the trends and cumulative impacts from source emissions should they occur.
Deposition monitoring is also conducted in the NWT, in cooperation with the Canadian Air and Precipitation Monitoring Network (CAPMoN). One station is located in Wood Buffalo National Park and the other at the Snare Rapids Hydro Facility. The latter is operated in partnership with the Northwest Territories Power Corporation (NTPC).
The 2016 Annual Air Quality Report summarizes the air quality information collected in 2016, along with some discussion of trends. Data capture and select statistical information can be found in Appendix A. The report provides information on network operations, the air pollutants that were monitored and the air quality standards used in assessing the monitoring results. Additional information, including ‘near real-time’ air pollutant readings, can be found on the NWT Air Quality Monitoring Network website at aqm.enr.gov.nt.ca.
If you have questions regarding ENR’s air quality monitoring program or require further information, please contact us at the address below: Environment Division Department of Environment and Natural Resources Government of the Northwest Territories P.O. Box 1320 Yellowknife, NT X1A 2L9
Telephone: (867) 767-9236 ext. 53176
This report is also available on the internet at www.enr.gov.nt.ca/en/services/air-quality
N o r t h w e s t Te r r i t o r i e s A i r Q u a l i t y R e p o r t 2 0 1 61 4
Operations (Network)

D e p a r t m e n t o f E n v i r o n m e n t a n d N a t u r a l R e s o u r c e s 1 5
The NWT Air Quality Monitoring Network consists of four permanent monitoring stations located in Yellowknife, Inuvik, Fort Smith and Norman Wells. The stations are climate-controlled structures and include state-of-the-art monitoring equipment capable of continuously sampling and analyzing a variety of air pollutants and meteorological conditions. Pollutants monitored vary by station, but include sulphur dioxide (SO2), fine particulate matter (PM2.5), coarse particulate matter (PM10), ground level ozone (O3), carbon monoxide (CO) and nitrogen dioxide (NO2). Wind speed, wind direction and temperature are also monitored. For additional information on air pollutants see Appendix B.
NUNAVUT
YUKON
SNARE RAPIDS
FORT SMITH
NORMANWELLS
INUVIK
YELLOWKNIFE
WOOD BUFFALO
Figure 1: Map of the Air Quality Monitoring Network
NWT Air Monitoring Station

N o r t h w e s t Te r r i t o r i e s A i r Q u a l i t y R e p o r t 2 0 1 61 6
Data from each station is automatically transmitted every hour to ENR headquarters in Yellowknife using a sophisticated data acquisition system (DAS) and communications software. This allows for review of community air quality on a near real-time basis. The data also undergoes a series of ‘on the fly’ validity checks before being archived by the data management, analysis and reporting system.
The Yellowknife, Inuvik and Fort Smith stations are part of the National Air Pollution Surveillance (NAPS) program, a larger national network monitoring sulfur dioxide (SO2), nitrogen dioxide (NO2), ozone (O3), fine particulate matter (PM2.5) and carbon monoxide (CO) in communities across Canada. The NAPS program is a joint federal/provincial/territorial initiative, incorporating 286 stations in 203 communities across the country. ENR operates the Inuvik station in partnership with the Aurora Research Institute (ARI), which provides on-the-ground technical operations of the station. Data from the three stations, along with data from other cities, is summarized and assessed, with results published in the NAPS annual data reports. More information on the NAPS program, along with links to the data, can be found at www.canada.ca/en/environment-climate-change/services/air-pollution/monitoring-networks-data/national-air-pollution-program.html
Stations Particulate Matter Gaseous Precipitation Meteorological
Monitoring
PM2.
5 – F
ine
Parti
cula
te
PM10
– C
oars
e Pa
rticu
late
SO2 –
Sul
phur
Dio
xide
NO
2 – N
itrog
en D
ioxi
de
O3 –
Gro
und
Leve
l Ozo
ne
CO –
Car
bon
Mon
oxid
e
Depo
sition
Win
d Sp
eed
and
Dire
ction
Air T
empe
ratu
re
Yellowknife √ √ √ √ √ √ √ √
Inuvik √ √ √ √ √ √ √ √
Norman Wells √ √ √ √ √ √ √
Fort Smith √ √ √ √ √ √ √ √
Snare Rapids √ √
Wood Buffalo √ √
Table 1: Parameters Monitored by StationTable 1 shows the breakdown of the NWT Air Quality Monitoring Network by substances and meteorological parameters monitored at each station.

D e p a r t m e n t o f E n v i r o n m e n t a n d N a t u r a l R e s o u r c e s 1 7
The NAPS program has a stringent quality assurance/quality control (QA/QC) component, ensuring Canada-wide data is comparable. Participation in the NAPS program requires that ENR follows these QA/QC procedures at the Yellowknife, Inuvik and Fort Smith sites, and ENR applies these procedures at all four NWT stations. Fort Smith just came online as part of the NAPS program this year and the intent is for the Norman Wells station to become part of the NAPS program as well.
ENR also participates in the Canadian Air and Presipitation Monitoring Network (CAPMoN) program. CAPMoN is a non-urban monitoring network with 35 measurement sites in Canada and one in the United States designed to study the regional patterns and trends of atmospheric pollutants such as acid rain, smog, particulate matter and mercury, in both air and precipitation. Unlike NAPS, CAPMoN locates sites to limit the effect of anthropogenic sources. Most sites are remote and data is considered representative of background values. Two CAPMoN stations are operated in the NWT, one in Wood Buffalo National Park approximately 80 kilometres northwest of Fort Smith and the other at the Snare Rapids Hydro Facility approximately 150 kilometres northwest of Yellowknife. ENR, with assistance from the NTPC staff, operates the Snare Rapids station, which consists of an acid precipitation collector and an ozone analyzer. The Wood Buffalo station uses an automated precipitation collector and monitors continuous ozone. Daily rain and snow samples are collected and forwarded to the CAPMoN laboratory for analysis. The data from these sites is available on the National Atmospheric Chemistry Database (NATChem Database) through Environment and Climate Change Canada (ECCC).
Government of the Northwest
Territories
Partnership/Contract Stations Network
Yellowknife National Air Pollution Surveillance
Aurora Research Institute
Inuvik andFort Smith National Air Pollution
Surveillance
Norman Wells Northwest Territories Stations
NORTHWEST TERRITORIES
POWERCORPORATION
NWT Power
Corporation
Snare RapidsCanadian Air and Precipitation
Monitoring
Wood Buffalo
Table 2: NWT Air Quality Monitoring Network

N o r t h w e s t Te r r i t o r i e s A i r Q u a l i t y R e p o r t 2 0 1 61 8
Developments in 2016
D e p a r t m e n t o f E n v i r o n m e n t a n d N a t u r a l R e s o u r c e s 1 9
The NWT Air Quality Monitoring Network has been in operation since the 1990s, beginning with a single particulate monitor in Yellowknife in 1974. Currently, the network consists of four stations located in Yellowknife, Norman Wells, Inuvik and Fort Smith. Appendix C traces the history of air quality monitoring in the NWT.
To ensure the NWT Air Quality Monitoring Network is current with technological advancements and serving the needs of the NWT, continuous improvement of the monitoring network is required. Improvements conducted in 2016 included:• Upgrades to the data acquisition system provided by Environment and
Climate Change Canada (ECCC) to improve data capture techniques and how we track instrument performance and data flow. New industrial loggers were installed in each of the four stations.
• The Fort Smith station became part of the NAPS program and began reporting the Air Quality Health Index (AQHI), along with Yellowknife and Inuvik stations.
• Upgrading the Black Carbon Aethalometer (BCA) at the Yellowknife station. Black carbon is a component of fine particulate matter (PM2.5) that may affect human health and contribute to climate change. Some sources of black carbon in the NWT are from forest fires, vehicle exhaust and other diesel combustion emissions.
N o r t h w e s t Te r r i t o r i e s A i r Q u a l i t y R e p o r t 2 0 1 62 0
Future Plans
D e p a r t m e n t o f E n v i r o n m e n t a n d N a t u r a l R e s o u r c e s 2 1
Volatile organic compounds (VOCs) monitoring and particulate speciation monitoring will be added to the suite of parameters currently being measured at the Yellowknife station. This is expected to occur sometime in 2018. In 2018, ENR will have two portable Met One Environmental Beta Attenuation Mass (EBAM) monitors available for deployment during forest fire events to communities without a permanent air quality station. The portable monitors measured fine particulate matter (PM2.5), which is a component of forest fire smoke. This information is useful in determining the Air Quality Health Index (AQHI) for communities affected by forest fire smoke.
N o r t h w e s t Te r r i t o r i e s A i r Q u a l i t y R e p o r t 2 0 1 62 2
NWT Air Quality Standards
D e p a r t m e n t o f E n v i r o n m e n t a n d N a t u r a l R e s o u r c e s 2 3
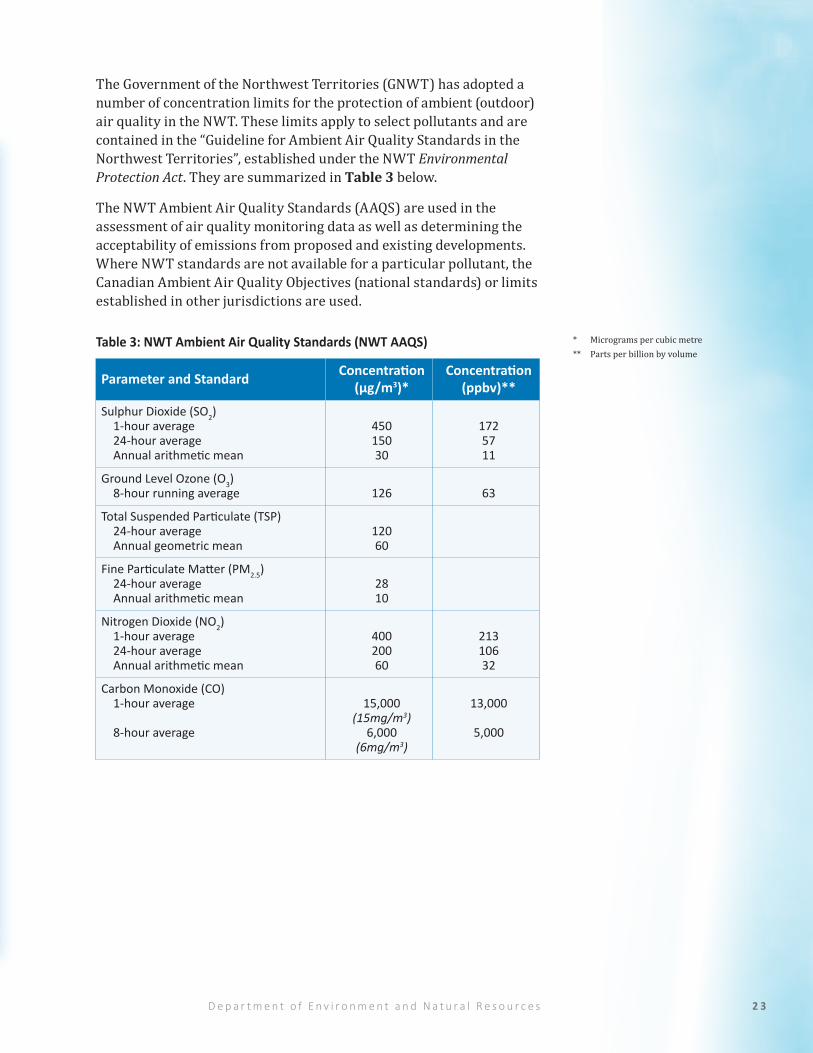
The Government of the Northwest Territories (GNWT) has adopted a number of concentration limits for the protection of ambient (outdoor) air quality in the NWT. These limits apply to select pollutants and are contained in the “Guideline for Ambient Air Quality Standards in the Northwest Territories”, established under the NWT Environmental Protection Act. They are summarized in Table 3 below.
The NWT Ambient Air Quality Standards (AAQS) are used in the assessment of air quality monitoring data as well as determining the acceptability of emissions from proposed and existing developments. Where NWT standards are not available for a particular pollutant, the Canadian Ambient Air Quality Objectives (national standards) or limits established in other jurisdictions are used.
Parameter and Standard Concentration (μg/m3)*
Concentration (ppbv)**
Sulphur Dioxide (SO2) 1-hour average 24-hour average Annual arithmetic mean
450 150 30
172 57 11
Ground Level Ozone (O3) 8-hour running average
126
63
Total Suspended Particulate (TSP) 24-hour average Annual geometric mean
120 60
Fine Particulate Matter (PM2.5) 24-hour average Annual arithmetic mean
28 10
Nitrogen Dioxide (NO2) 1-hour average 24-hour average Annual arithmetic mean
400 200 60
213 106 32
Carbon Monoxide (CO) 1-hour average 8-hour average
15,000
(15mg/m3) 6,000
(6mg/m3)
13,000
5,000
Table 3: NWT Ambient Air Quality Standards (NWT AAQS) * Micrograms per cubic metre** Parts per billion by volume

N o r t h w e s t Te r r i t o r i e s A i r Q u a l i t y R e p o r t 2 0 1 62 4
Parameter and Standard Concentration Source
Coarse Particulate Matter (PM10) 24-hour average
50 μg/m3
Ontario Ambient Air Quality Criteria, Apr/12 B.C. Ambient Air Quality Objectives, Oct/14
The “Guideline for Ambient Air Quality Standards in the Northwest Territories” provides additional information on the application of the NWT standards and the pollutants of concern. For more information on air pollutants, see Appendix B.
Additional criteria from other jurisdictions used in this report are presented in Table 4.
Table 4: Additional Ambient Air Quality Standards (AAQS)
D e p a r t m e n t o f E n v i r o n m e n t a n d N a t u r a l R e s o u r c e s 2 5
NWT Air Quality

N o r t h w e s t Te r r i t o r i e s A i r Q u a l i t y R e p o r t 2 0 1 62 6
FINE PARTICULATE MATTER (PM2.5) Fine Particulate Matter (PM2.5) is monitored at all four stations with Met One Beta Attenuation Monitors (BAM). The BAM PM2.5 monitor measures fine particles in the range of 0.1 to 2.5µm in diameter, providing continuous, near real-time (hourly) analysis of particulate concentrations. Non-continuous particulate monitoring is also conducted at the Yellowknife station using a Partisol 2000i-D filter-based sampler. These smaller particles include combustion particles, organic compounds and metals. One of the main sources of PM2.5 within the NWT is smoke from forest fires. Forest fire events are observed and documented by regional ENR staff as they occur (i.e. visible smoke and olfactory indications of smoke) and this qualitative data serves as a validation to the conclusions drawn from measured PM2.5 readings.
Figure 2 shows the monthly averages measured at the four air monitoring stations in 2016. The Yellowknife, Norman Wells and Fort Smith stations all saw elevated levels in July. This was directly attributed to regional forest fire smoke. Inuvik didn’t experience any significant forest fire events during the summer of 2016 and, as a result, PM2.5 levels remained fairly consistent throughout the year. The Fort Smith PM2.5 BAM did not operate during the months of September through to November due to an instrument malfunction.
Figure 2: 2016 Fine Particulate Matter (PM2.5) Monthly Averages micrograms per cubic meter (µg/m3)
Figure 3: 2016 Fine Particulate Matter (PM2.5) Maximum Daily Averagemicrograms per cubic meter (µg/m3)
Figure 3 shows the maximum daily average for each month at each station. There were a total of four episodes where PM2.5 levels exceeded the 24-hour average AAQS of 28μg/m3. The Yellowknife, Norman Wells and Fort Smith stations all recorded PM2.5 levels above the AAQS in July and the Fort Smith station recorded an additional peak occurrence in May. The elevated levels of PM2.5 recorded in July at the three stations were attributed to regional forest fire smoke. The elevated PM2.5 level recorded at the Fort Smith station in May was attributed to forest fire smoke from Fort McMurray, Alberta.

D e p a r t m e n t o f E n v i r o n m e n t a n d N a t u r a l R e s o u r c e s 2 7
COARSE PARTICULATE MATTER (PM10) Coarse Particulate Matter (PM10) is monitored at all four stations with Met One Beta Attenuation Monitors (BAM). The BAM PM10 monitor measures coarse particles in the range of 2.5 to 10µm in diameter. The greatest source of coarse particulate matter is typically dust from roads, especially in the spring when the snow cover disappears and exposes winter sand and gravel on roads. Once the sand and gravel is exposed, wind and vehicle activity can cause the dust to become suspended in the air. This is the cause of the peak PM10 levels we see in April in Yellowknife. The other three stations also experience spring-time peaks, but are also susceptible to elevated levels during late spring and into the summer months. This is due to the fact that these three regions have more gravel roads where wind-blown dust is present during the spring and summer months. PM10 concentrations can also be elevated due to forest fire smoke, especially in cases where a forest fire is nearby, resulting in larger ash particles falling out near the location of the station.
The NWT does not have an AAQS for PM10. Instead, it adopts a 24-hour average criterion of 50μg/m3. This level is used in several Canadian jurisdictions, including British Columbia and Ontario. All monthly averages were lower than this guideline level.
Figure 4 shows the monthly averages measured at the four air monitoring stations in 2016. The Yellowknife station had its highest month in April, which can be attributed to spring melt and road dust. Inuvik experienced high levels of PM10 throughout the spring and summer months due to excessive wind-blown dust in that area. There were also recreational activities that created localized dust events (i.e. baseball tournaments) near the station during July and August. Norman Wells also experienced a spring dust event, but the highest monthly average occurred in July, due to smoke from a nearby forest fire. The highest Fort Smith monthly average occurred in May and was attributed to smoke reaching the region from forest fires burning in Fort McMurray.
Figure 4: 2016 Coarse Particulate Matter (PM10) Monthly Averagesmicrograms per cubic meter (µg/m3)

N o r t h w e s t Te r r i t o r i e s A i r Q u a l i t y R e p o r t 2 0 1 62 8
Figure 5 shows the maximum daily average for each month at each station. In 2016, there were a total of 37 episodes of PM10 readings that exceeded the adopted standard of 50µg/m3. Norman Wells had the most with 25; the majority of them occurring in the summer months due to a combination of forest fire smoke and wind-blown dust. Yellowknife had eight exceedances, all occurring in the month of April. All of these exceedances were associated with the springtime melt and dust events. Inuvik had three exceedances which occurred in August and September. These coincided with recreational activities that were taking place in close proximity to the air monitoring station. Fort Smith had only one exceedance, occurring on May 7, corresponding with the day that smoke from the Fort McMurray forest fires was the most intense in the area.
Figure 5: 2016 Coarse Particulate Matter (PM10) Maximum Daily Averagesmicrograms per cubic meter (µg/m3)
Figure 6 shows the monthly averages recorded in 2016. Ozone levels were highest in the spring-time, which coincides with increased sunlight, and natural and anthropogenic sources of precursor compounds. The highest monthly averages at all stations occurred in April, which is common at remote monitoring stations located in mid to high latitudes in the northern hemisphere. Typical monthly ozone concentrations at remote sites in Canada range between 20 and 45ppb.1
1 Vingarza, R. “A review of surface ozone background levels and trends”. Atmospheric Environment, Vol 38, Issue 21, pp 3431-3442 (2004).
GROUND LEVEL OZONE (O3)Ozone is monitored at all four stations with API 400 series UV absorption analyzers. Detectable concentrations of ozone exist even in remote areas due to naturally occurring sources of the precursor gases, such as VOC emissions from trees, and the introduction of stratospheric ozone to lower elevations that can occur due to atmospheric mixing processes. These background concentrations typically are in the range of 20 to 40ppb. In large urban areas (and areas downwind), ozone concentrations can be much higher due to the additional emissions of precursor gases that form as a result of human activities.
Figure 6: 2016 Monthly Ozone (O3) Averages

D e p a r t m e n t o f E n v i r o n m e n t a n d N a t u r a l R e s o u r c e s 2 9
Figure 7: 2016 Monthly Ozone (O3) Maximum 8-Hour Ozone (O3) Averages Figure 7 shows the maximum 8-hour averages per month recorded in 2016. The concentrations for all of the stations were well below the 8-hour NWT AAQS of 63ppb.
NITROGEN DIOXIDE (NO2) NO2 is monitored at all four stations with API 200 series chemiluminescence NOx analyzers. The NOx gas analyzers provide continuous information on oxides of nitrogen (NO, NO2 and NOx). However, the focus is on NO2 due to health concerns associated with this pollutant and the availability of national air quality standards for comparison. Exposure to elevated levels of NO2 increases the likelihood of respiratory problems. It has the ability to inflame the lining of the lungs, which can increase the risk of lung infections.

N o r t h w e s t Te r r i t o r i e s A i r Q u a l i t y R e p o r t 2 0 1 63 0
Figure 8: 2016 Nitrogen Dioxide (NO2) Monthly Averagesparts per billion (ppb)
Figure 9: 2016 Nitrogen Dioxide (NO2) 1-Hour Maximumsmicrograms per cubic meter (µg/m3)
Figure 10: 2016 Nitrogen Dioxide (NO2) 24-Hour Maximumsmicrograms per cubic meter (µg/m3)
Figures 8, 9 and 10 show the monthly average, 1-hour maximum and 24-hour maximum concentrations of NO2 at each station. Generally, the highest monthly averages and the highest hourly concentrations occurred during the winter months. This is likely due to increased emissions from fuel combustion for residential and commercial heating, and idling vehicles as well as short-term “rush hour” traffic influences. The effects of these combustion emissions on winter-time air quality can increase when combined with stagnant meteorological conditions. Cold, calm days can result in an atmospheric situation where the normal decrease in air temperature with elevation is reversed and a zone of colder air is present at ground level. This zone of colder air, along with the lack of wind, act to restrict dispersion and trap pollutants close to the ground. This is also known as an inversion. Neither the 1-hour (213 ppb) nor the 24-hour (106 ppb) AAQS for NO2 were exceeded.
D e p a r t m e n t o f E n v i r o n m e n t a n d N a t u r a l R e s o u r c e s 3 1
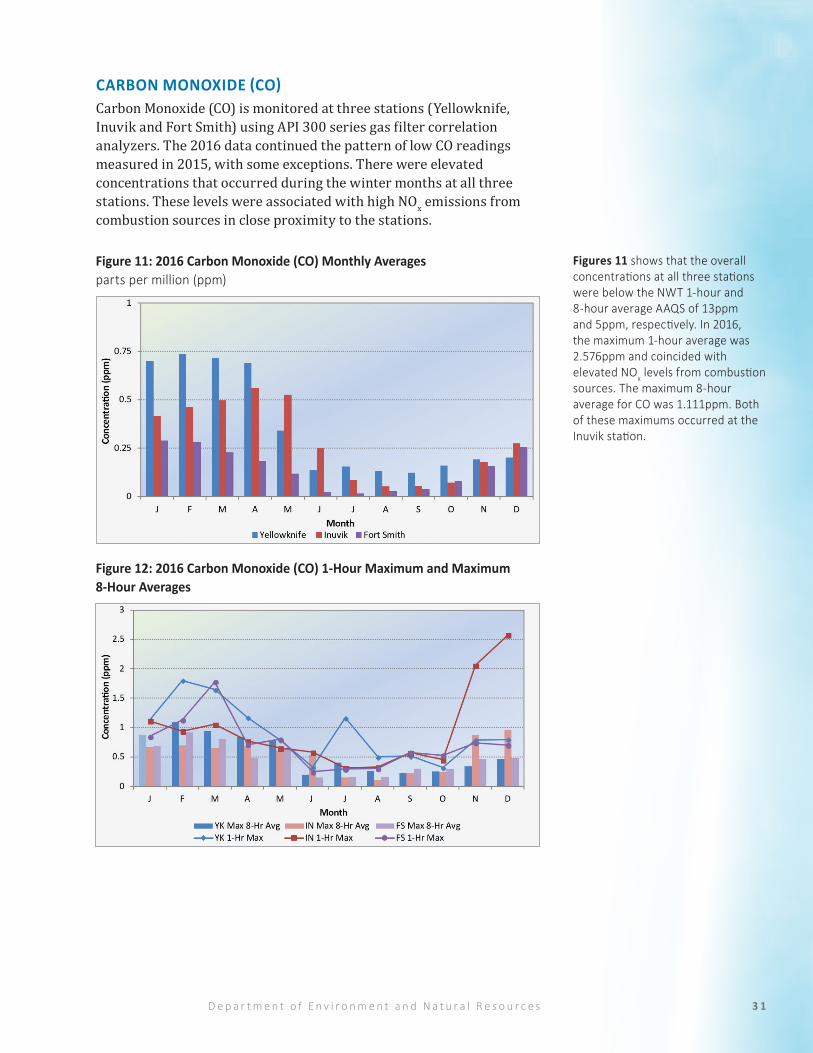
CARBON MONOXIDE (CO)Carbon Monoxide (CO) is monitored at three stations (Yellowknife, Inuvik and Fort Smith) using API 300 series gas filter correlation analyzers. The 2016 data continued the pattern of low CO readings measured in 2015, with some exceptions. There were elevated concentrations that occurred during the winter months at all three stations. These levels were associated with high NOx emissions from combustion sources in close proximity to the stations.
Figure 11: 2016 Carbon Monoxide (CO) Monthly Averagesparts per million (ppm)
Figure 12: 2016 Carbon Monoxide (CO) 1-Hour Maximum and Maximum 8-Hour Averages
Figures 11 shows that the overall concentrations at all three stations were below the NWT 1-hour and 8-hour average AAQS of 13ppm and 5ppm, respectively. In 2016, the maximum 1-hour average was 2.576ppm and coincided with elevated NOx levels from combustion sources. The maximum 8-hour average for CO was 1.111ppm. Both of these maximums occurred at the Inuvik station.

N o r t h w e s t Te r r i t o r i e s A i r Q u a l i t y R e p o r t 2 0 1 63 2
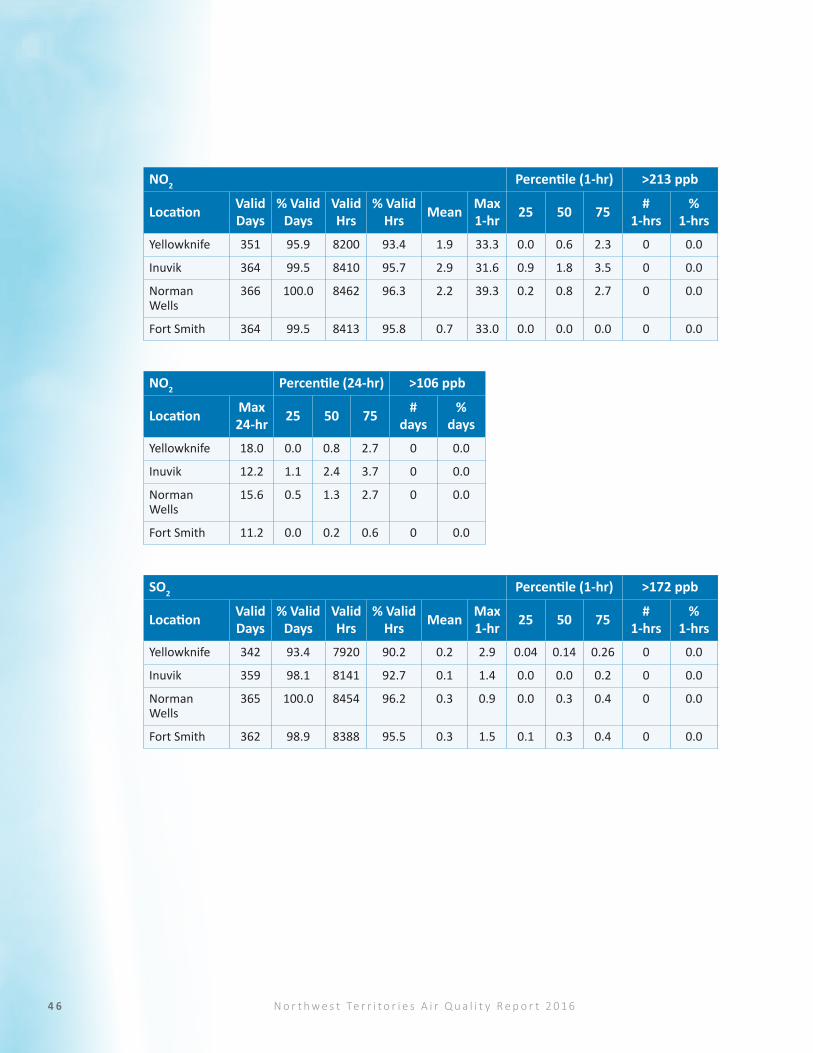
SULPHUR DIOXIDE (SO2)Sulphur Dioxide (SO2) is monitored at all four stations with API 100 series UV fluorescence analyzers. The 2016 levels continued to be very low at all four monitoring stations. Levels did not exceed the 24-hour average AAQS of 57ppb or the annual average AAQS of 11ppb.
Station
Annual Average
(ppb)
Annual Average
AAQS (ppb)
24-Hour Average
(ppb)
24-Hour Average
AAQS (ppb)
Yellowknife 0.2
11
1.2
57Inuvik 0.1 0.7
Norman Wells 0.3 0.8
Fort Smith 0.4 0.8

D e p a r t m e n t o f E n v i r o n m e n t a n d N a t u r a l R e s o u r c e s 3 3
Long-term Trends
N o r t h w e s t Te r r i t o r i e s A i r Q u a l i t y R e p o r t 2 0 1 63 4
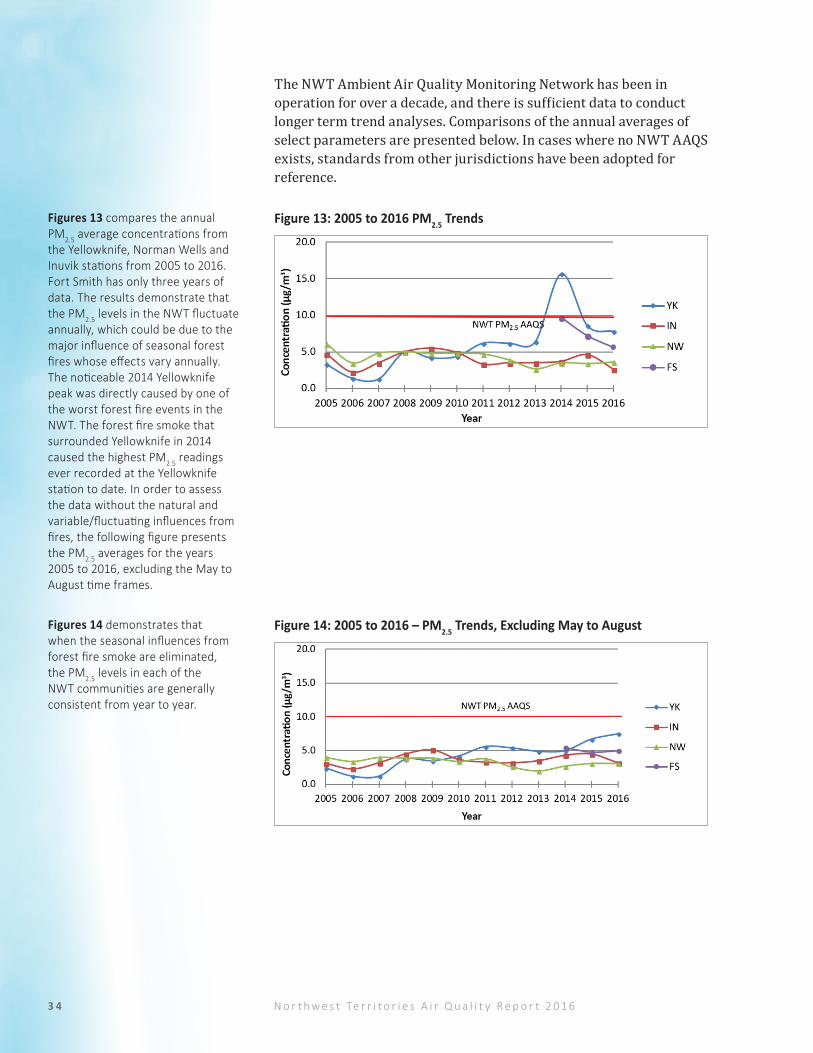
The NWT Ambient Air Quality Monitoring Network has been in operation for over a decade, and there is sufficient data to conduct longer term trend analyses. Comparisons of the annual averages of select parameters are presented below. In cases where no NWT AAQS exists, standards from other jurisdictions have been adopted for reference.
Figures 13 compares the annual PM2.5 average concentrations from the Yellowknife, Norman Wells and Inuvik stations from 2005 to 2016. Fort Smith has only three years of data. The results demonstrate that the PM2.5 levels in the NWT fluctuate annually, which could be due to the major influence of seasonal forest fires whose effects vary annually. The noticeable 2014 Yellowknife peak was directly caused by one of the worst forest fire events in the NWT. The forest fire smoke that surrounded Yellowknife in 2014 caused the highest PM2.5 readings ever recorded at the Yellowknife station to date. In order to assess the data without the natural and variable/fluctuating influences from fires, the following figure presents the PM2.5 averages for the years 2005 to 2016, excluding the May to August time frames.
Figure 13: 2005 to 2016 PM2.5 Trends
Figures 14 demonstrates that when the seasonal influences from forest fire smoke are eliminated, the PM2.5 levels in each of the NWT communities are generally consistent from year to year.
Figure 14: 2005 to 2016 – PM2.5 Trends, Excluding May to August

D e p a r t m e n t o f E n v i r o n m e n t a n d N a t u r a l R e s o u r c e s 3 5
Figures 15 compares the annual NO2 average concentrations from the Yellowknife, Norman Wells and Inuvik stations from 2005 to 2016. The Fort Smith data only includes three years. Results indicate that generally Yellowknife has slightly higher NO2 levels than the other communities, which is to be expected given the larger population size and resulting combustion sources. All results are below the AAQS of 32ppb. The trend over this time period for each monitoring station is relatively stable, which is to be expected given the absence of any major changes to emission sources or population growth in these communities.
Figure 15: 2005 to 2016 – Annual NO2 Averages
Figures 16 shows the O3 8-hour average concentrations from the Yellowknife, Norman Wells and Inuvik stations from 2005 to 2016. The Fort Smith data only includes three years. The concentrations are consistently below the AAQS of 63ppb. The results indicate that O3 levels are fairly consistent from year to year and between the communities. This was the second year in which a full set of O3 data was collected at the Fort Smith station.
Figure 16: 2005 to 2016 – 8-Hour Ozone (03)

N o r t h w e s t Te r r i t o r i e s A i r Q u a l i t y R e p o r t 2 0 1 63 6
National Comparisons

D e p a r t m e n t o f E n v i r o n m e n t a n d N a t u r a l R e s o u r c e s 3 7
In addition to comparing our air quality data within the NWT, this report compares NWT air quality against other parts of the country. When looking at ambient air data from other locations, it is important to note that there are many influences to local air quality, including geographic considerations, population size and density, local industrial sources, transboundary considerations, and others. For comparison purposes, ENR has presented Yellowknife air quality against select jurisdictional capitals (Figure 17), followed by a comparison to cities of similar population (Figure 18), regardless of the types and sources of their air emissions.
The data shows that Yellowknife O3 levels in 2016 were slightly higher than all but one of the comparison cities. Yellowknife NO2 levels, however, were significantly lower than all the comparison cities, presumably as a result of a much smaller size city with fewer combustion emission sources. The reverse ranking between Yellowknife’s O3 and NO2 concentrations is generally to be expected, in part since localized NOx levels contribute to ozone reduction through a chemical process known as scavenging. Therefore, higher O3 levels may be expected in areas with lower NO2 concentrations. NO2 levels for all comparison cities were below the AAQS. The PM2.5 levels in Yellowknife were the third highest, after Edmonton and Regina, but were still below the AAQS.
Figures 17 compares the 2016 annual average concentrations of O3, NO2 and PM2.5 between select capital cities across Canada. The values are measured against the AAQS for PM2.5 and NO2; no criteria are available for annual O3.
Figure 17: 2016 National Comparisons – Jurisdictional Capitals

N o r t h w e s t Te r r i t o r i e s A i r Q u a l i t y R e p o r t 2 0 1 63 8
Figure 18: 2016 National Comparisons – Similar Population SizeFigures 18 compares Yellowknife’s annual average concentrations of O3, NO2 and PM2.5 to select cities across Canada of a similar population size (<100,000). The results show that Yellowknife O3 levels are the second highest relative to the comparison cities, while Yellowknife NO2 levels were lower than all of the comparison cities. All the NO2 levels were below the AAQS. The higher Yellowknife O3 levels are likely due in part to a phenomenon known as the “ozone paradox”. In larger centers there are more industrial releases of oxides of nitrogen (NOx) from combustion sources that actually decrease O3 levels. The Yellowknife O3 levels are typical of rural sites. Yellowknife PM2.5 levels in 2016, as with all of the comparison cities, were below the AAQS.

D e p a r t m e n t o f E n v i r o n m e n t a n d N a t u r a l R e s o u r c e s 3 9
Snare Rapids CAPMoN

N o r t h w e s t Te r r i t o r i e s A i r Q u a l i t y R e p o r t 2 0 1 64 0
Since 1989, ENR has operated a CAPMoN station at the Northwest Territories Power Corporation's Snare Rapids hydro-electric generating site. This site is located approximately 150 kilometres northwest of Yellowknife. Rain and snow samples are collected on a daily basis and sent to ECCC CAPMoN laboratory in Toronto for analysis of precipitation chemistry. Select results are presented below.
The geology of the NWT is mostly characterized by non-carbonate bedrock resistant to weathering and/or shallow, coarse-textured soils with low cation exchange capacity, low sulphate adsorption capacity and low pH. The sulphate level of deposition that is considered to be protective of sensitive ecosystems in the NWT is 7 kg/ha/yr. In areas of eastern Canada where acid rain is a more serious environmental problem, sulphate deposition has been measured by CAPMoN in excess of 20 kg/ha/yr. Nitrate deposition at Snare Rapids is also low relative to eastern Canada.
Sulphate and nitrate deposition rates measured at Snare Rapids remain below levels expected to cause a significant environmental effect in sensitive ecosystems.
In 2014, a second CAPMoN station was opened in the NWT, within Wood Buffalo National Park, approximately 80 kilometres northwest of Fort Smith. The area was of interest to CAPMoN due to the remote nature of the park and its location relative to the oil sands operations in Alberta. The site uses a state-of-the-art, automated daily collection sampler for precipitation chemistry and a continuous ambient analyzer for ozone monitoring. The first complete set of precipitation raw data was captured at the site in 2015.
Figure 19: Snare Rapids: Acid Deposition kilograms per hectare per year (kg/ha/year)
Figures 19 shows the deposition rates for sulphate, calcium, nitrate and magnesium from 1998 to 2016.
D e p a r t m e n t o f E n v i r o n m e n t a n d N a t u r a l R e s o u r c e s 4 1
NWT 2016 Forest Fire Season

N o r t h w e s t Te r r i t o r i e s A i r Q u a l i t y R e p o r t 2 0 1 64 2
The 2016 forest fire season had substantially fewer fires than both the 2014 and 2015 seasons. There were 188 recorded forest fires in the NWT in 2016, which burned a total of 229,000 hectares.
Yellowknife, Norman Wells and Fort Smith experienced smoky conditions in July due to smoke attributed to regional forest fires. Fort Smith also experienced smoky conditions in May due to the forest fire that occurred in Fort McMurray at that time.
Figure 20: Summer 2016 – 24-Hour Average PM2.5 Concentrations for Yellowknife, Fort Smith, Norman Wells and Inuvik
Figure 21: Summer 2016 – 24-Hour Average PM10 Concentrations for Yellowknife, Fort Smith, Norman Wells and Inuvik
Figures 20 and 21 illustrate the elevated particulate (PM2.5 and PM10) concentrations from May through to August. Fort Smith experienced increases in PM2.5 concentrations in early May due to the Fort McMurray fires, while Yellowknife and Norman Wells experienced elevated levels in July due to regional forest fires.
Between all of the communities, there were 23 exceedances of the adopted PM10 24-hour standard between May and August. Of these, 21 were recorded at the Norman Wells station. Most of the 21 exceedances occurred during June to August and were directly related to regional forest fire events. The elevated May levels in Norman Wells are attributed to spring road dust. The Inuvik spikes in late August were caused by dust conditions, not forest fire smoke. This was confirmed by observations made by ARI staff based in Inuvik. As part of ARI’s tasks associated with the air monitoring station, they note any unusual meteorological episodes and/or events (i.e. forest fire smoke, wind-blown dust, etc.) that could affect air quality, as was the case with the August dust episodes.

D e p a r t m e n t o f E n v i r o n m e n t a n d N a t u r a l R e s o u r c e s 4 3
HEALTH MESSAGING FROM FOREST FIRESThe Air Quality Health Index (AQHI) is a health risk communication tool developed by Environment and Climate Change Canada (ECCC) and Health Canada. The AQHI, available in Yellowknife, Inuvik and Fort Smith in 2016, forecasts health risks related to air quality for the current and next day. It translates air quality monitoring data into a health scale from 1 to 10, and provides associated health-based messaging for the public, such as suggestions to adjust your activity level to protect yourself when the air quality is poor.
Air Quality Health Index La cote air santé
low riskfailble risque
moderate riskrisque modéré
high riskrisque élevé
very high riskrisque très élevé
Figure 22: Air Quality Health Index | La cote air santé
Image – courtesy of John Mckay
The 2016 forest fire season paled in comparison to the 2014 season when the City of Yellowknife often appeared to be enveloped in heavy fog from forest fire smoke. The above photo was taken at approximately 7:00 pm on July 30, 2014.
Since the AQHI is only available in Yellowknife, Inuvik and Fort Smith there is a gap in health-related messaging for the rest of the territory. ECCC is continuing to develop tools to provide air quality-related information for regions across Canada, including all the regions of the NWT. These tools use meteorological information and smoke modeling software to predict and disseminate real-time and predicted conditions for a geographic area. They are a valuable complement to the Air Quality Monitoring Network and can assist NWT residents in making health-related decisions based on air quality during forest fire season.

N o r t h w e s t Te r r i t o r i e s A i r Q u a l i t y R e p o r t 2 0 1 64 4
Figure 23: Summer 2016 Hourly AQHI for Yellowknife
Figure 24: Summer 2016 Hourly AQHI for Inuvik
Figure 25: Summer 2016 Hourly AQHI for Fort Smith
Figures 23, 24 and 25 demonstrate the frequency that the AQHI reached the various levels of risk throughout the summer of 2016 in Yellowknife, Inuvik and Fort Smith. Unfortunately, the AQHI system for Fort Smith was out of service during the Fort McMurray forest fire event in May. The PM2.5 readings during that time indicate that the AQHI for Fort Smith would likely have been in the moderate to high risk category.

D e p a r t m e n t o f E n v i r o n m e n t a n d N a t u r a l R e s o u r c e s 4 5
PM2.5 Data Percentile (24-hr) >28 μg/m3
Location Valid Days
% Valid Days
Valid Hrs
% Valid Hrs Mean Max
1-hrMax 24-hr 25 50 75 #
days%
days
Yellowknife 357 97.5 8597 97.9 7.8 119.0 35.4 5.8 7.1 9 2 0.5
Inuvik 358 97.8 8410 97.2 2.6 61.0 10.5 1.3 2.4 3.5 0 0.0
Norman Wells
328 89.6 7872 89.9 3.6 321.0 58.9 2.1 2.8 3.7 2 0.5
Fort Smith 263 71.9 6290 71.6 5.6 154.0 44.1 3.1 4.4 6.4 2 0.5
PM10 Data Percentile (24-hr) >50 μg/m3
Location Valid Days
% Valid Days
Valid Hrs
% Valid Hrs Mean Max
1-hrMax 24-hr 25 50 75 #
days%
days
Yellowknife 364 99.5 8682 98.9 11.8 594.0 136.0 4.9 7.5 12.3 8 2.2
Inuvik 349 95.4 8324 94.8 16.8 360.0 89.0 6.9 12.8 24.8 3 0.8
Norman Wells
348 95.1 8360 95.2 17.9 744.0 129.0 5.5 10.0 23.7 25 6.8
Fort Smith 298 81.4 7209 82.1 7.9 180.0 57.9 2.2 5.3 11.0 1 0.3
O3 Percentile (8-hr) >63 ppb
Location Valid Days
% Valid Days
Valid Hrs
% Valid Hrs Mean Max
1-hrMax 8-hr 25 50 75 #
8-hrs%
8-hrs
Yellowknife 356 97.3 8248 93.9 25.8 50.1 46.1 20.2 25.8 31.3 0 0.0
Inuvik 346 94.5 8021 91.3 24.7 45.5 45.1 18.8 24.7 30.4 0 0.0
Norman Wells
366 100.0 8462 96.3 23.0 47.2 44.3 16.3 22.4 29.2 0 0.0
Fort Smith 364 99.5 8418 95.8 23.8 51.4 46.1 17.5 23.8 30.7 0 0.0
Appendix A: 2016 Data Capture
N o r t h w e s t Te r r i t o r i e s A i r Q u a l i t y R e p o r t 2 0 1 64 6
NO2 Percentile (1-hr) >213 ppb
Location Valid Days
% Valid Days
Valid Hrs
% Valid Hrs Mean Max
1-hr 25 50 75 # 1-hrs
% 1-hrs
Yellowknife 351 95.9 8200 93.4 1.9 33.3 0.0 0.6 2.3 0 0.0
Inuvik 364 99.5 8410 95.7 2.9 31.6 0.9 1.8 3.5 0 0.0
Norman Wells
366 100.0 8462 96.3 2.2 39.3 0.2 0.8 2.7 0 0.0
Fort Smith 364 99.5 8413 95.8 0.7 33.0 0.0 0.0 0.0 0 0.0
SO2 Percentile (1-hr) >172 ppb
Location Valid Days
% Valid Days
Valid Hrs
% Valid Hrs Mean Max
1-hr 25 50 75 # 1-hrs
% 1-hrs
Yellowknife 342 93.4 7920 90.2 0.2 2.9 0.04 0.14 0.26 0 0.0
Inuvik 359 98.1 8141 92.7 0.1 1.4 0.0 0.0 0.2 0 0.0
Norman Wells
365 100.0 8454 96.2 0.3 0.9 0.0 0.3 0.4 0 0.0
Fort Smith 362 98.9 8388 95.5 0.3 1.5 0.1 0.3 0.4 0 0.0
NO2 Percentile (24-hr) >106 ppb
Location Max 24-hr 25 50 75 #
days%
days
Yellowknife 18.0 0.0 0.8 2.7 0 0.0
Inuvik 12.2 1.1 2.4 3.7 0 0.0
Norman Wells
15.6 0.5 1.3 2.7 0 0.0
Fort Smith 11.2 0.0 0.2 0.6 0 0.0

D e p a r t m e n t o f E n v i r o n m e n t a n d N a t u r a l R e s o u r c e s 4 7
SO2 Percentile (24-hr) >57 PPB
Location Max 24-hr 25 50 75 #
days%
days
Yellowknife 1.2 0.06 0.14 0.26 0 0.0
Inuvik 0.7 0.0 0.0 0.2 0 0.0
Norman Wells
0.8 0.1 0.3 0.4 0 0.0
Fort Smith 0.8 0.1 0.3 0.4 0 0.0
CO Percentile (8-hr) >5 PPB
Location Max 8-hr 25 50 75 #
8-hrs%
8-hrs
Yellowknife 1.088 0.136 0.188 0.688 0 0.0
Inuvik 0.955 0.080 0.244 0.494 0 0.0
Fort Smith 0.918 0.037 0.136 0.217 0 0.0
CO Percentile (1-hr) >13 PPM
Location Valid Days
% Valid Days
Valid Hrs
% Valid Hrs Mean Max
1-hrMax 24-hr 25 50 75 #
1-hrs%
1-hrs
Yellowknife 343 93.7 8180 93.4 0.370 1.799 0.838 0.135 0.188 0.683 0 0.0
Inuvik 365 100.0 8740 99.5 0.285 2.576 0.623 0.081 0.244 0.490 0 0.0
Fort Smith 364 99.5 8710 99.2 0.142 1.778 0.577 0.037 0.133 0.214 0 0.0

N o r t h w e s t Te r r i t o r i e s A i r Q u a l i t y R e p o r t 2 0 1 64 8
Appendix B: Air Pollutants
The NWT Air Quality Monitoring Network tracks a number of different air pollutants. With the exception of H2S, these pollutants are known as Criteria Air Contaminants (CACs). They represent the gases and compounds most often affecting community air quality and targeted by monitoring programs.
TOTAL SUSPENDED PARTICULATE (TSP)Total Suspended Particulate (TSP) is a general term for dust. TSP includes a wide variety of solid and liquid particles found floating in the air, with a size range of approximately 50 micrometers (µm) in diameter and smaller (a human hair is approximately 100 µm in diameter). While TSP can have environmental and aesthetic impacts, it is the smaller particles contained within TSP that are of concern from a human health perspective (see Particulate Matter (PM2.5) and (PM10) later in section). Road dust, forest fires, mining activities and combustion products from vehicles, heating and electricity generation contribute to TSP levels.
The NWT AAQS for TSP is 120μg/m3 over a 24-hour period. The standard for the annual average is 60µg/m3 (geometric mean).
TSP monitoring has not been conducted in the NWT network since 2005, since particulate monitoring has instead been focused on PM2.5 and PM10 monitoring.
PARTICULATE MATTER (PM2.5) AND (PM10)A sub-portion of TSP, these very small particulates are named for the diameter size of the particles contained within each group – PM10 contains particles with a diameter of 10 microns (1 millionth of a metre) or less, while PM2.5 (a sub-portion of PM10) contains particles with a diameter of 2.5 microns or less. The significance of these microscopic particles is that they can be inhaled and are associated with health effects, including aggravation of existing pulmonary and cardiovascular disease. Generally, the smaller the particle, the greater the penetration into the lung and the greater the associated health risk.
Sources of particulates that can be inhaled include road dust and wind-blown soil, which make up the majority of the PM10 particles. Particles in the PM2.5 size range primarily result from combustion of fossil fuels for industrial activities, commercial and residential heating as well as vehicle emissions, forest fire smoke and chemical reactions between other gases emitted to the air.
D e p a r t m e n t o f E n v i r o n m e n t a n d N a t u r a l R e s o u r c e s 4 9
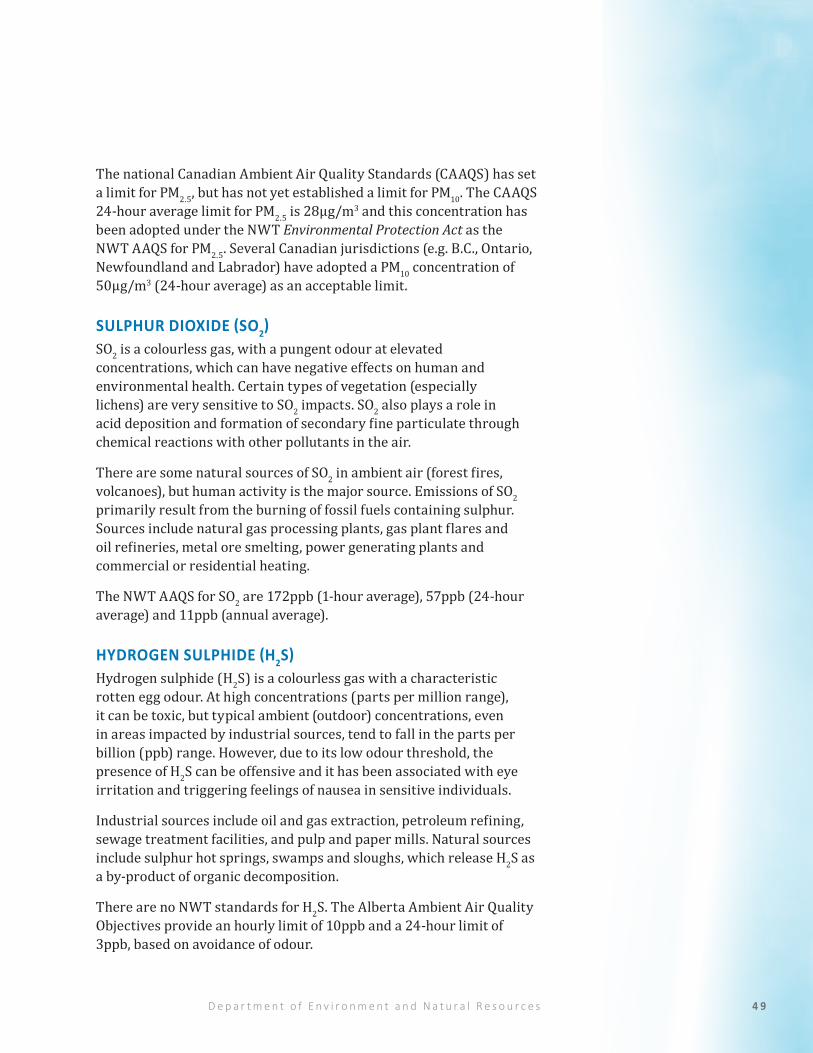
The national Canadian Ambient Air Quality Standards (CAAQS) has set a limit for PM2.5, but has not yet established a limit for PM10. The CAAQS 24-hour average limit for PM2.5 is 28µg/m3 and this concentration has been adopted under the NWT Environmental Protection Act as the NWT AAQS for PM2.5. Several Canadian jurisdictions (e.g. B.C., Ontario, Newfoundland and Labrador) have adopted a PM10 concentration of 50µg/m3 (24-hour average) as an acceptable limit.
SULPHUR DIOXIDE (SO2)SO2 is a colourless gas, with a pungent odour at elevated concentrations, which can have negative effects on human and environmental health. Certain types of vegetation (especially lichens) are very sensitive to SO2 impacts. SO2 also plays a role in acid deposition and formation of secondary fine particulate through chemical reactions with other pollutants in the air.
There are some natural sources of SO2 in ambient air (forest fires, volcanoes), but human activity is the major source. Emissions of SO2 primarily result from the burning of fossil fuels containing sulphur. Sources include natural gas processing plants, gas plant flares and oil refineries, metal ore smelting, power generating plants and commercial or residential heating.
The NWT AAQS for SO2 are 172ppb (1-hour average), 57ppb (24-hour average) and 11ppb (annual average).
HYDROGEN SULPHIDE (H2S)Hydrogen sulphide (H2S) is a colourless gas with a characteristic rotten egg odour. At high concentrations (parts per million range), it can be toxic, but typical ambient (outdoor) concentrations, even in areas impacted by industrial sources, tend to fall in the parts per billion (ppb) range. However, due to its low odour threshold, the presence of H2S can be offensive and it has been associated with eye irritation and triggering feelings of nausea in sensitive individuals.
Industrial sources include oil and gas extraction, petroleum refining, sewage treatment facilities, and pulp and paper mills. Natural sources include sulphur hot springs, swamps and sloughs, which release H2S as a by-product of organic decomposition.
There are no NWT standards for H2S. The Alberta Ambient Air Quality Objectives provide an hourly limit of 10ppb and a 24-hour limit of 3ppb, based on avoidance of odour.

N o r t h w e s t Te r r i t o r i e s A i r Q u a l i t y R e p o r t 2 0 1 65 0
NITROGEN OXIDES (NOX)Nitrogen oxides (NOx) consist of a mixture of nitrogen-based gases, primarily nitric oxide (NO) and nitrogen dioxide (NO2). Emissions of both NO and NO2 results from the high temperature combustion of fossil fuels. The predominant emission is NO, which then rapidly converts to NO2 through chemical reaction in the atmosphere. NO is a colourless and odourless gas, whereas NO2 is a reddish-brown colour, with a pungent, irritating odour. NO2 is considered the more toxic and irritating of the two gases and, at elevated concentrations, is associated with both acute and chronic respiratory effects. Both gases play a role in the atmospheric reactions resulting in acid deposition and secondary pollutant formation (i.e. O3 and fine particulate).
Due to the greater health effects associated with exposure to NO2, development of air quality standards has focused on this gas, rather than NO or total NOx. The NWT AAQS are reflective of national maximum desirable levels of 213ppb (1-hour average), 106ppb (24-hour average) and 32ppb (annual average).
GROUND LEVEL OZONE (O3)Ground level ozone (O3) should not be confused with stratospheric O3, which occurs at much higher elevations and forms a shield that protects life on the planet from the sun’s harmful ultraviolet radiation. The gas is the same, but at ground level O3 is regarded as undesirable due to its association with a variety of human health concerns, environmental impacts and property damage. O3 is a highly reactive gas and is defined as a secondary pollutant. It is not emitted in large quantities from any source, but is formed through a series of complex chemical reactions involving other pollutants called precursors (e.g. NOx and volatile organic compounds or VOCs) in the presence of sunlight.
The national standards provide a maximum acceptable level of 82ppb for O3 based on a 1-hour average, and an annual maximum acceptable level of 15ppb. The Canada-wide Standards (CWS) process has also set an acceptable limit of 63ppb based on an 8-hour average. The CWS 8-hour limit has been adopted under the NWT Environmental Protection Act as the NWT AAQS for O3.

D e p a r t m e n t o f E n v i r o n m e n t a n d N a t u r a l R e s o u r c e s 5 1
CARBON MONOXIDE (CO)Carbon monoxide (CO) is a colourless, odourless and tasteless gas produced by the incomplete combustion of fuels containing carbon. The primary source is vehicle exhaust, especially in cities with heavy traffic congestion. Other sources include industrial processes and fuel combustion for building heating. One natural source is wildfires.
CO affects humans and animals by interfering with the ability of the blood to transport oxygen around the body.
The NWT standards for CO reflect the national maximum desirable levels of 13ppm (1-hour average) and 5ppm (8-hour average). CO values are reported in ppm as opposed to other gaseous pollutants, which are reported in ppb.
ACID DEPOSITIONAcidity in precipitation is measured in pH units on a scale of 0 to 14. A value of seven indicates neutral, values less than seven indicate acidic conditions and values greater than seven indicate alkaline conditions. Even clean precipitation is slightly acidic – around pH5.6 – due to the presence of naturally occurring concentrations of carbon dioxide, and minor amounts of sulphate and nitrate ions. The introduction of sulphur dioxide and nitrogen oxide emissions from combustion of fossil fuels for industrial, commercial and individual activities can result in an increase in acidic compounds in the atmosphere – often in areas far removed from the original emission sources. The removal of these sulphur and nitrogen compounds through atmospheric washout is reflected in the increased acidity (lower pH values) of precipitation. Calcium and magnesium ions – mostly from natural sources – act to neutralize acidity in precipitation.
Generally, precipitation with a pH value of 5.0 or less is termed ‘acidic’. However, assessment of acid precipitation is usually based on deposition to an area over a specified time period (e.g. kilograms per hectare per year, kg/ha/yr) rather than review of specific precipitation event parameters. Also, the degree of impact to a particular environment is influenced by its ‘buffering’ capacity or ability to tolerate the acidic inputs. Therefore, determination of acceptable limits usually requires a range of values to reflect the differing tolerances of various areas.

N o r t h w e s t Te r r i t o r i e s A i r Q u a l i t y R e p o r t 2 0 1 65 2
1974 • Government of the NWT starts monitoring air quality in Yellowknife with the installation of a high-volume air sampler at the Post Office site.
1989 • Monitoring of acid precipitation at the Snare Rapids hydro-electric site begins.
1992 • SO2 analyzer installed at the City Hall site.
1997 • SO2 monitoring in N’dilo begins and continues until 2000.
1998 • O3 analyzer added in Yellowknife to the City Hall site.
2000 • A SO2 analyzer was installed in the ENR building in Fort Liard in March, followed by a H2S analyzer in October.
2002 • Daring Lake summer sampling of PM10 begins.• City Hall SO2 analyzer relocated to new air monitoring trailer located
at École Sir John Franklin High School.
2003 • Daring Lake summer sampling of PM2.5 begins (the same sampler is used for PM10 and PM2.5 monitoring).
• Air monitoring trailers are installed in Inuvik, Norman Wells and Fort Liard.
• CO and NOx analyzers added to the Yellowknife station as well as a continuous fine particulate sampler (PM2.5).
• Norman Wells station monitors SO2 and H2S.• Inuvik station monitors SO2, H2S, NOx and PM2.5.• Fort Liard station monitors SO2 and H2S. A PM2.5 sampler is installed
late in the year.• The O3 analyzer that was operating at the Yellowknife City Hall
location is relocated to the new Sir John Franklin station. • ENR initiates the upgrade of the Data Acquisition System, moving to a
specialized air monitoring system, which will allow more efficient and quality controlled data collection.
• Continuous PM2.5 samplers are installed in Inuvik and Fort Liard. • A second high-volume sampler is installed at the Sir John Franklin
station in Yellowknife.
2004 • PM2.5 sampler is installed in Norman Wells.• Data Acquisition System (DAS) is significantly upgraded. New
components are installed inside the stations and a new data management, analysis and reporting system is brought on-line.
2005 • NOx analyzer is installed in March at the Fort Liard station.• O3 and NOx analyzers are installed at the Norman Wells station in
April.• O3 analyzer purchased by Environment Canada (Yellowknife office) is
installed at the Inuvik station in April.• Due to years of significant data loss caused by extreme cold, the
Partisol Dichotomous fine particulate sampler at the Yellowknife Post Office station is relocated indoors at the Sir John Franklin station.
• The Yellowknife Post Office station is officially closed after the last TSP sample ran on December 6, 2005.
• Development of an Air Quality web site begins. The web site will link with the data management, analysis and reporting system to provide public access to air quality data for each monitoring location. Access to archived data will also be available by querying the database using web-based tools.
History of Air Quality Monitoring in the Northwest Territories
Appendix C: Monitoring History

D e p a r t m e n t o f E n v i r o n m e n t a n d N a t u r a l R e s o u r c e s 5 3
2006 • Yellowknife – A BAM Particulate Matter (PM10) monitor is installed and begins collecting data in April.
• Inuvik – A BAM Particulate Matter (PM10) monitor is installed and begins collecting data in October.
• The Air Quality Monitoring Network web site is officially released.
2007 • Fort Liard – A BAM Particulate Matter (PM10) monitor and an Ozone (O3) analyzer are installed and begin collecting data in late August.
• Completed the second phase of the Air Quality Monitoring Network web site, which included database related modifications as well as web design improvements.
2008 • No significant changes to the network.
2009 • Norman Wells – PM10 BAM installed to complete particulate sampling throughout the network.
• Yellowknife – Hi-vol sampler discontinued.• Daring Lake particulate monitoring temporarily discontinued due to
malfunction.
2010 • Norman Wells – PM10 BAM installation completed.• Inuvik – Entire station is relocated to a more representative location
due to ongoing construction activities in the original location.• Yellowknife – PM2.5 monitor upgraded to BAM FEM (Federal
Equivalency Method).
2011 • Inuvik – PM2.5 monitor upgraded to BAM FEM (Federal Equivalency Method).
• Data acquisition and management system upgraded in Yellowknife, Norman Wells and Inuvik, including Envista ARM software and PC-based industrial data loggers.
• Manual Partisol Dichotomous sampler installed in Yellowknife.• BAMs at all stations begin reporting in actual conditions instead of
STP, as per federal protocol.
2012 • Entered into partnership with Aurora Research Institute (ARI) to provide technical operations of the Inuvik station.
• Installed CO monitoring in Inuvik (end of 2012).• Discontinued H2S monitoring in Inuvik (end of 2012).• Switched to trace level SO2 monitoring in Yellowknife.• New Air Quality Monitoring Network web site launched to provide
current and historic data to users (http://aqm.enr.gov.nt.ca/).
2013 • AQHI launched for the City of Yellowknife.• PM2.5 FEM installed in Norman Wells.• Fort Liard Station closed in November 2013.• New air quality station installed in Fort Smith in December 2013.• Yellowknife and Inuvik stations equipped with trace level CO
analyzers.• Filter-based particulate sampler (Partisol 2000i-D) installed at the
Yellowknife station.
2014 • H2S monitoring discontinued at Norman Wells station.• Replaced Yellowknife station with a larger 10’ x 25’ building.• AQHI launched in Inuvik.
2015 • New deployable units added to inventory: 2 x E-BAMs and 2 x DustTraks.
• Black Carbon Aetholometer installed in Yellowknife station.


Environment DivisionDepartment of Environment and Natural ResourcesGovernment of the Northwest TerritoriesP.O. Box 1320Yellowknife, NT X1A 2L9
Telephone: (867) 767-9236 ext. 53176
This report is also available on the internet at www.enr.gov.nt.ca/programs/air-quality