Embed Size (px)
Citation preview
12a.1
One-Way Manova For an expository presentation of multivariate analysis of variance (MANOVA). See the following paper, which addresses several questions:
(a) Why should one use MANOVA. (b) What is the structure of MANOVA? (c) How are MANOVA test statistics obtained and interpreted? (d) How are MANOVA follow-up tests obtained and interpreted? (e) How is strength of association assessed in MANOVA. (f) How should the results of MANOVA be presented? (g) Are there any alternatives to MANOVA.
They use an example data set throughout the article to illustrate these points.
Multivariate Analysis of VarianceRichard F. Haase and Michael V. EllisJournal of Counselling Psychology, 1987, Vol. 34, No. 4 404-413
Paper
12a.22
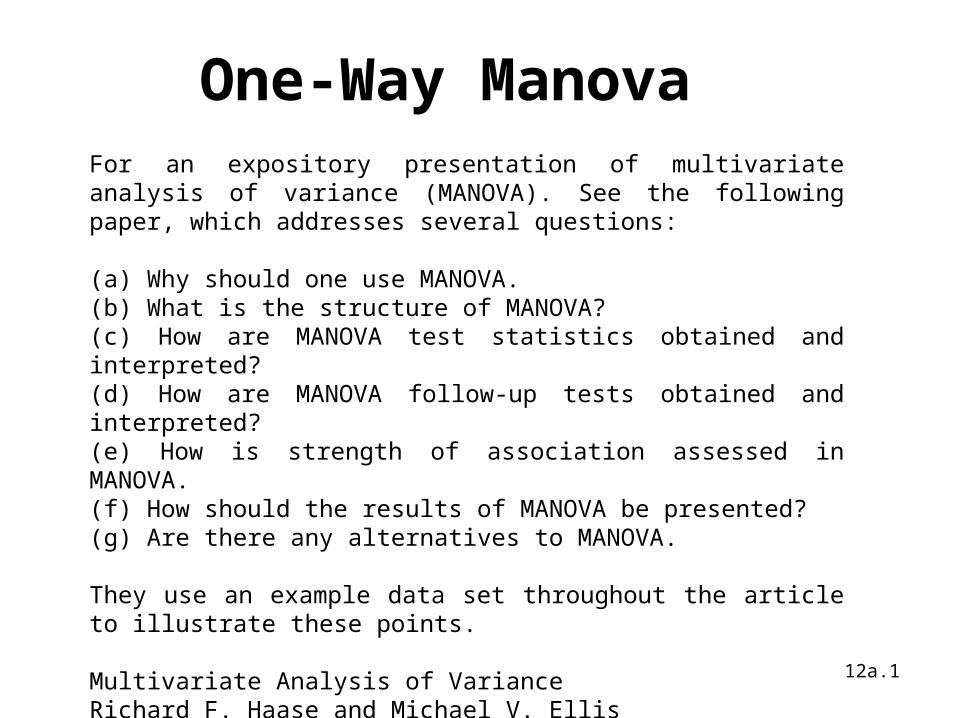
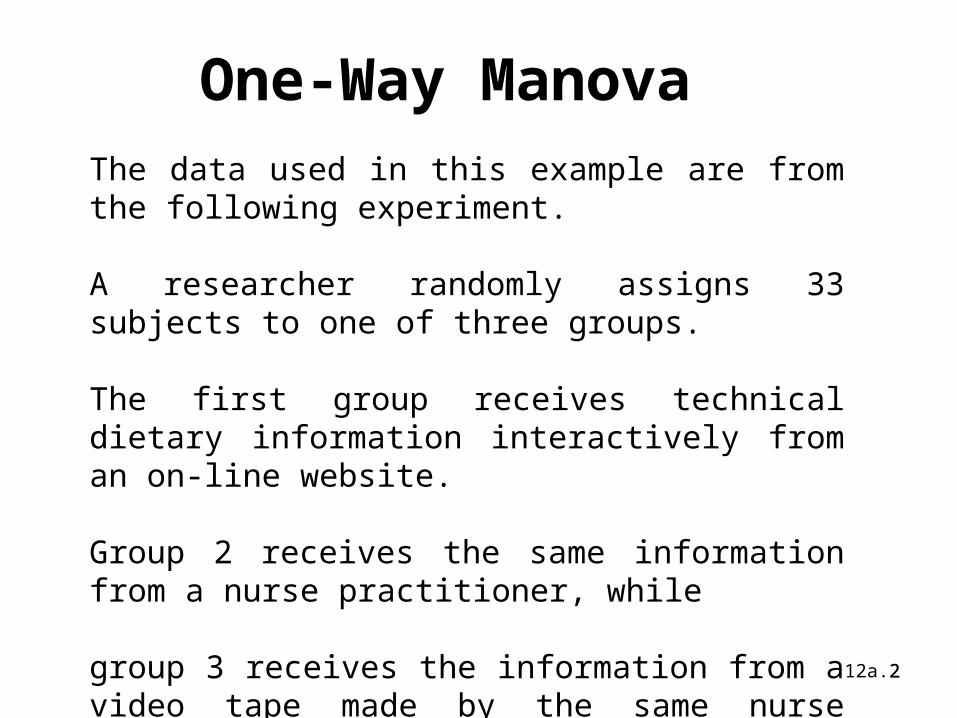
One-Way Manova The data used in this example are from the following experiment. A researcher randomly assigns 33 subjects to one of three groups.
The first group receives technical dietary information interactively from an on-line website.
Group 2 receives the same information from a nurse practitioner, while
group 3 receives the information from a video tape made by the same nurse practitioner.
12a.33
One-Way Manova
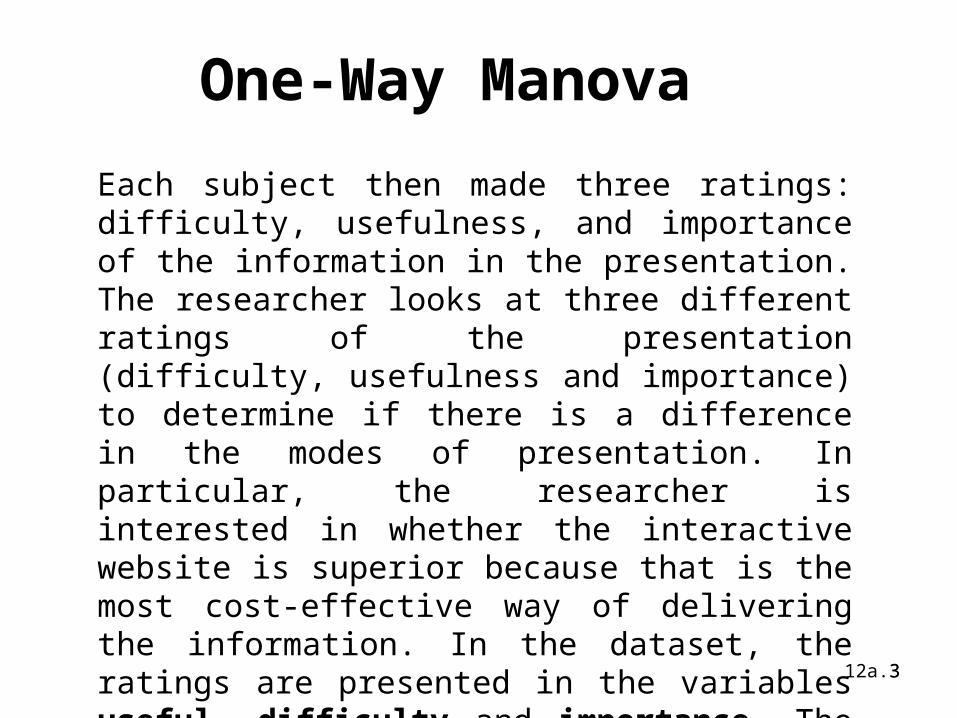
Each subject then made three ratings: difficulty, usefulness, and importance of the information in the presentation. The researcher looks at three different ratings of the presentation (difficulty, usefulness and importance) to determine if there is a difference in the modes of presentation. In particular, the researcher is interested in whether the interactive website is superior because that is the most cost-effective way of delivering the information. In the dataset, the ratings are presented in the variables useful, difficulty and importance. The variable group indicates the group to which a subject was assigned.
12a.44
One-Way Manova
We are interested in how the variability in the three ratings can be explained by a subject's group. Group is a categorical variable with three possible values: 1, 2 or 3. Because we have multiple dependent variables that cannot be combined, we will choose to use manova. Our null hypothesis in this analysis is that a subject's group has no effect on any of the three different ratings, and we can test this hypothesis on the dataset.
12a.55
One-Way Manova
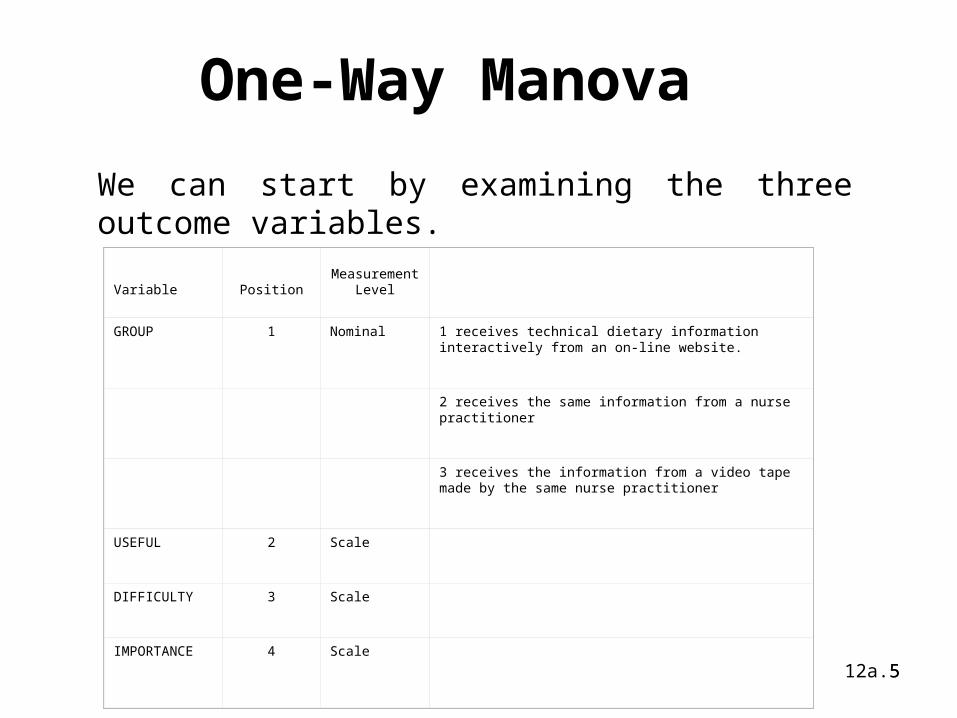
We can start by examining the three outcome variables.
Variable PositionMeasurement
Level
GROUP 1 Nominal 1 receives technical dietary information interactively from an on-line website.
2 receives the same information from a nurse practitioner
3 receives the information from a video tape made by the same nurse practitioner
USEFUL 2 Scale
DIFFICULTY 3 Scale
IMPORTANCE 4 Scale
12a.66
One-Way Manova
Next, we can enter our manova command. In SPSS, manova can be conducted through the generalized linear model function, GLM. In the manova command, we first list the outcome variables, then indicate any categorical factors after "by" and any covariates after "with". Here, group is a categorical factor. We must also indicate the lowest and highest values found in group. We are also asking SPSS to print the eigenvalues generated. These will be useful in seeing how the test statistics are calculated.
12a.77
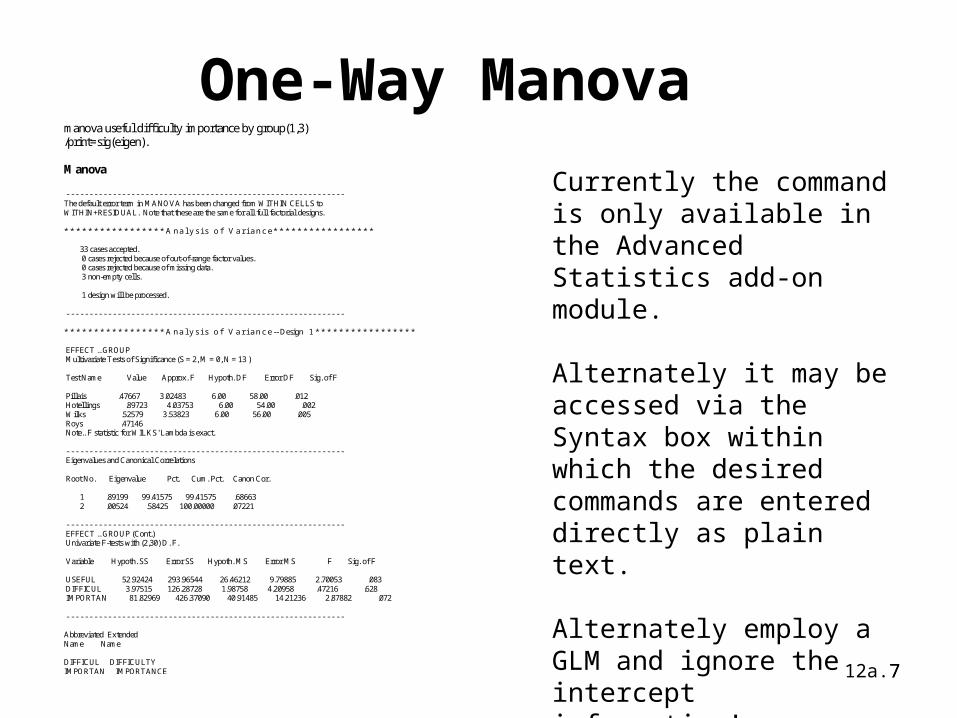
One-Way Manova manova useful difficulty importance by group(1,3) /print=sig(eigen). Manova - - - - - - - - - - - - - - - - - - - - - - - - - - - - - - - - - - - - - - - - - - - - - - - - - - - - - - - - - - - - The default error term in MANOVA has been changed from WITHIN CELLS to WITHIN+RESIDUAL. Note that these are the same for all full factorial designs. * * * * * * * * * * * * * * * * * A n a l y s i s o f V a r i a n c e * * * * * * * * * * * * * * * * * 33 cases accepted. 0 cases rejected because of out-of-range factor values. 0 cases rejected because of missing data. 3 non-empty cells. 1 design will be processed. - - - - - - - - - - - - - - - - - - - - - - - - - - - - - - - - - - - - - - - - - - - - - - - - - - - - - - - - - - - - * * * * * * * * * * * * * * * * * A n a l y s i s o f V a r i a n c e -- Design 1 * * * * * * * * * * * * * * * * * EFFECT .. GROUP Multivariate Tests of Significance (S = 2, M = 0, N = 13 ) Test Name Value Approx. F Hypoth. DF Error DF Sig. of F Pillais .47667 3.02483 6.00 58.00 .012 Hotellings .89723 4.03753 6.00 54.00 .002 Wilks .52579 3.53823 6.00 56.00 .005 Roys .47146 Note.. F statistic for WILKS' Lambda is exact. - - - - - - - - - - - - - - - - - - - - - - - - - - - - - - - - - - - - - - - - - - - - - - - - - - - - - - - - - - - - Eigenvalues and Canonical Correlations Root No. Eigenvalue Pct. Cum. Pct. Canon Cor. 1 .89199 99.41575 99.41575 .68663 2 .00524 .58425 100.00000 .07221 - - - - - - - - - - - - - - - - - - - - - - - - - - - - - - - - - - - - - - - - - - - - - - - - - - - - - - - - - - - - EFFECT .. GROUP (Cont.) Univariate F-tests with (2,30) D. F. Variable Hypoth. SS Error SS Hypoth. MS Error MS F Sig. of F USEFUL 52.92424 293.96544 26.46212 9.79885 2.70053 .083 DIFFICUL 3.97515 126.28728 1.98758 4.20958 .47216 .628 IMPORTAN 81.82969 426.37090 40.91485 14.21236 2.87882 .072 - - - - - - - - - - - - - - - - - - - - - - - - - - - - - - - - - - - - - - - - - - - - - - - - - - - - - - - - - - - - Abbreviated Extended Name Name DIFFICUL DIFFICULTY IMPORTAN IMPORTANCE
Currently the command is only available in the Advanced Statistics add-on module.
Alternately it may be accessed via the Syntax box within which the desired commands are entered directly as plain text.
Alternately employ a GLM and ignore the intercept information!
12a.88
One-Way Manova
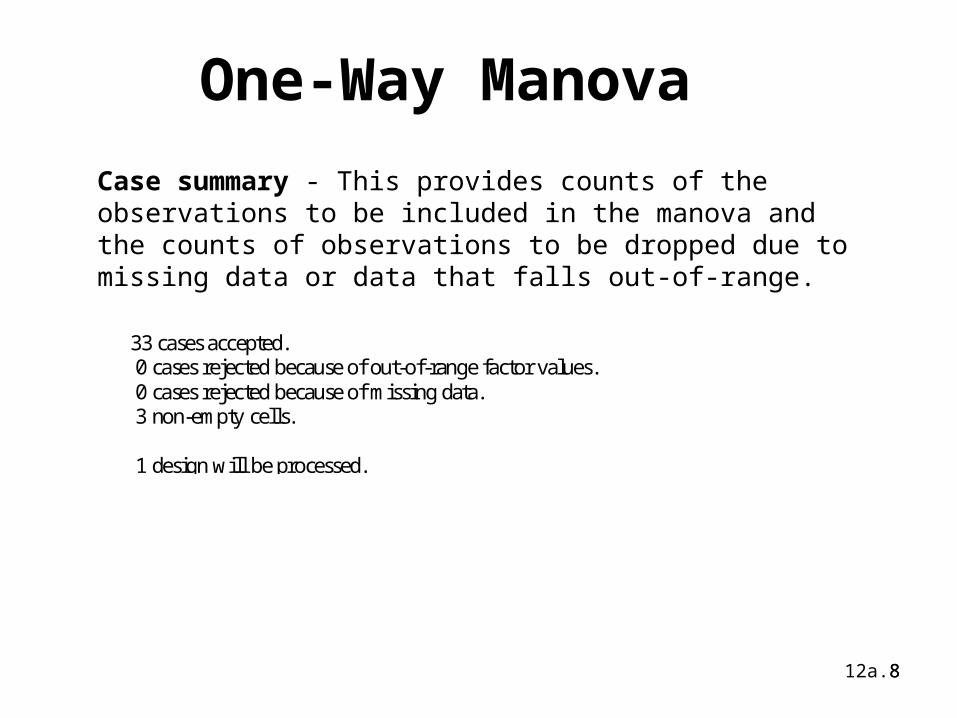
Case summary - This provides counts of the observations to be included in the manova and the counts of observations to be dropped due to missing data or data that falls out-of-range.
33 cases accepted. 0 cases rejected because of out-of-range factor values. 0 cases rejected because of missing data. 3 non-empty cells. 1 design will be processed.
12a.99
One-Way Manova
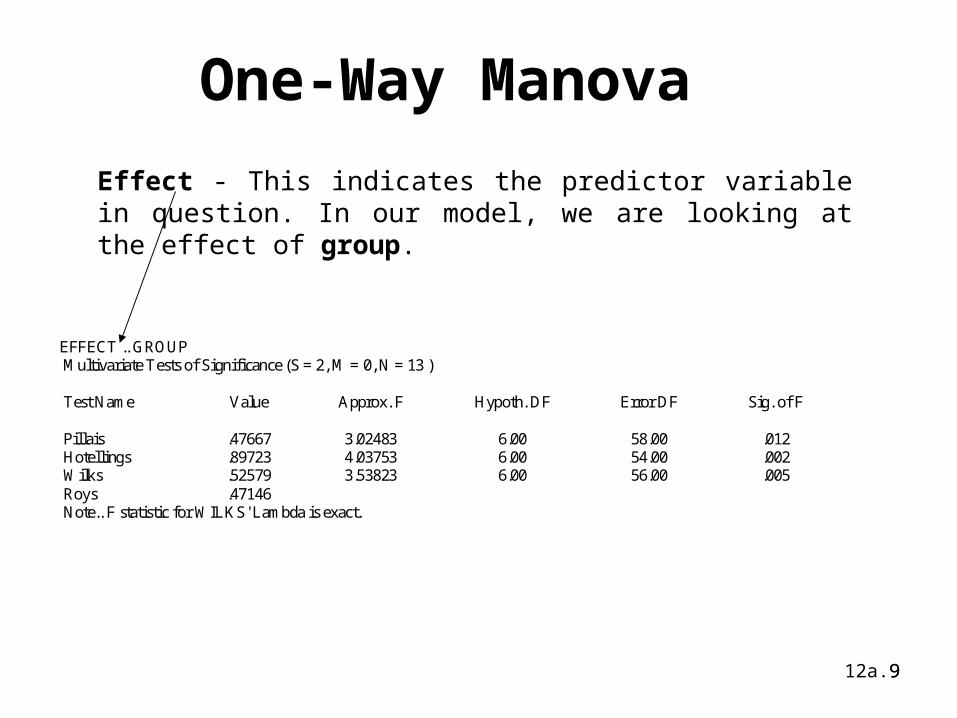
Effect - This indicates the predictor variable in question. In our model, we are looking at the effect of group.
EFFECT .. GROUP Multivariate Tests of Significance (S = 2, M = 0, N = 13 ) Test Name Value Approx. F Hypoth. DF Error DF Sig. of F Pillais .47667 3.02483 6.00 58.00 .012 Hotellings .89723 4.03753 6.00 54.00 .002 Wilks .52579 3.53823 6.00 56.00 .005 Roys .47146 Note.. F statistic for WILKS' Lambda is exact.
12a.1010
One-Way Manova
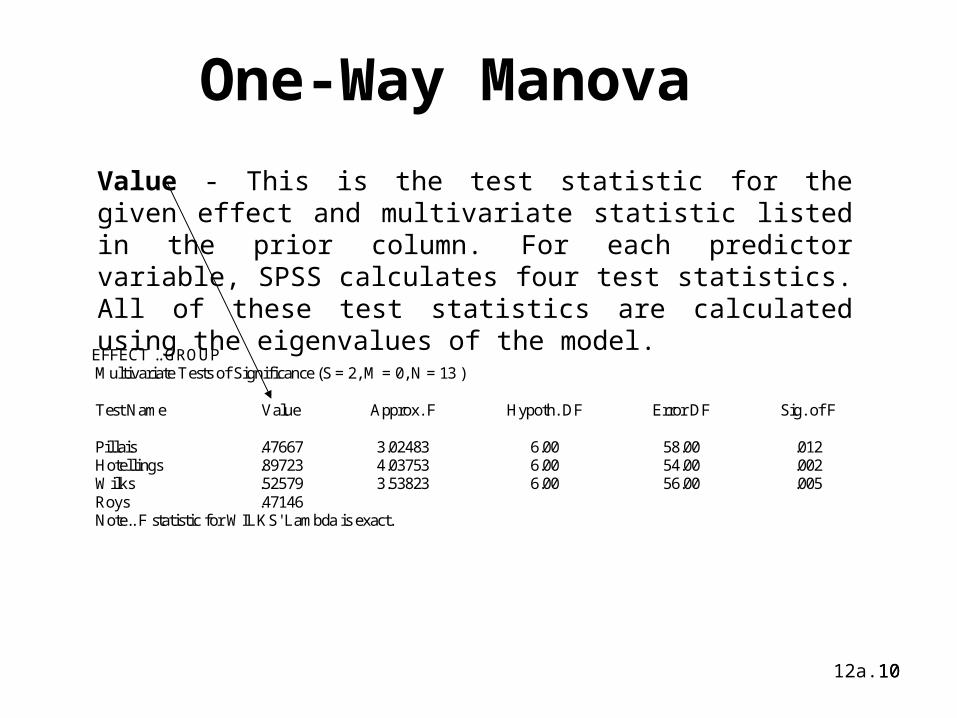
Value - This is the test statistic for the given effect and multivariate statistic listed in the prior column. For each predictor variable, SPSS calculates four test statistics. All of these test statistics are calculated using the eigenvalues of the model.
EFFECT .. GROUP Multivariate Tests of Significance (S = 2, M = 0, N = 13 ) Test Name Value Approx. F Hypoth. DF Error DF Sig. of F Pillais .47667 3.02483 6.00 58.00 .012 Hotellings .89723 4.03753 6.00 54.00 .002 Wilks .52579 3.53823 6.00 56.00 .005 Roys .47146 Note.. F statistic for WILKS' Lambda is exact.
12a.1111
One-Way Manova
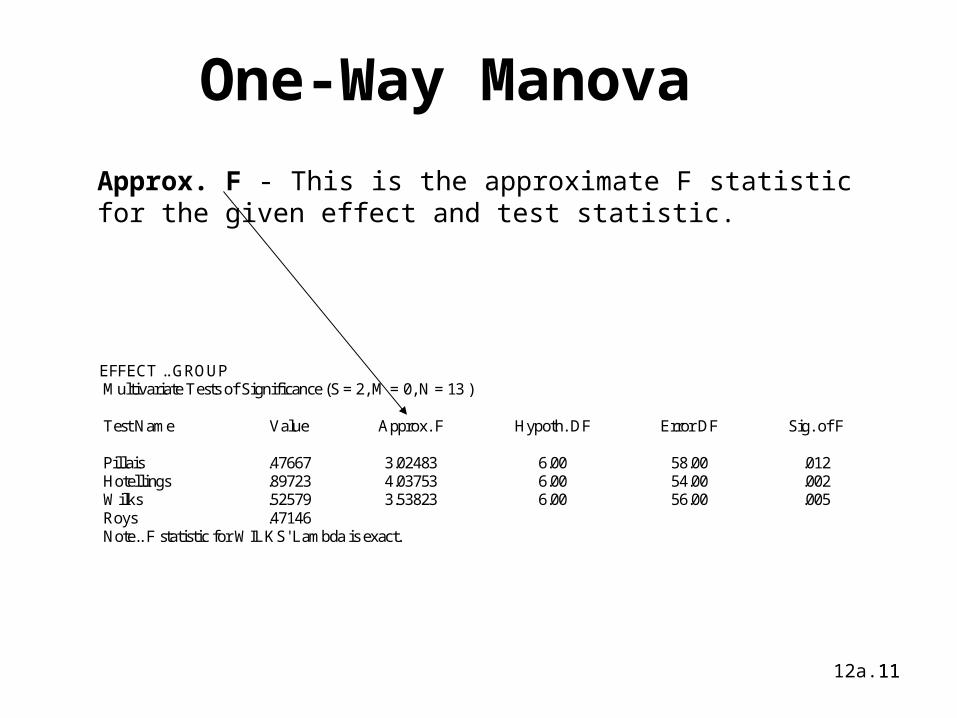
Approx. F - This is the approximate F statistic for the given effect and test statistic.
EFFECT .. GROUP Multivariate Tests of Significance (S = 2, M = 0, N = 13 ) Test Name Value Approx. F Hypoth. DF Error DF Sig. of F Pillais .47667 3.02483 6.00 58.00 .012 Hotellings .89723 4.03753 6.00 54.00 .002 Wilks .52579 3.53823 6.00 56.00 .005 Roys .47146 Note.. F statistic for WILKS' Lambda is exact.
12a.1212
One-Way Manova
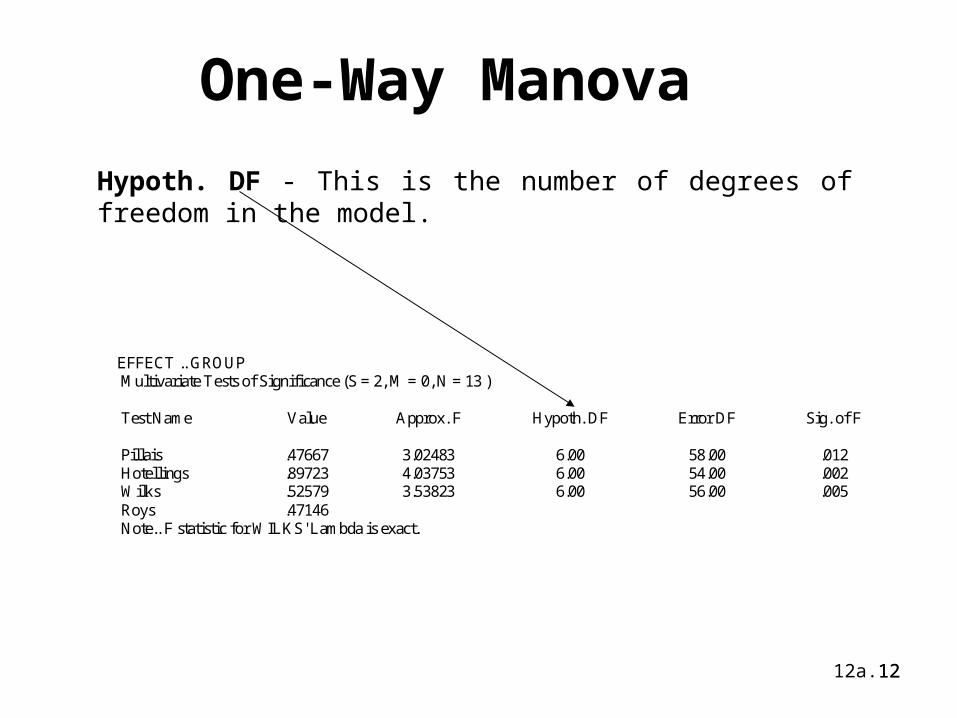
Hypoth. DF - This is the number of degrees of freedom in the model.
EFFECT .. GROUP Multivariate Tests of Significance (S = 2, M = 0, N = 13 ) Test Name Value Approx. F Hypoth. DF Error DF Sig. of F Pillais .47667 3.02483 6.00 58.00 .012 Hotellings .89723 4.03753 6.00 54.00 .002 Wilks .52579 3.53823 6.00 56.00 .005 Roys .47146 Note.. F statistic for WILKS' Lambda is exact.
12a.1313
One-Way Manova
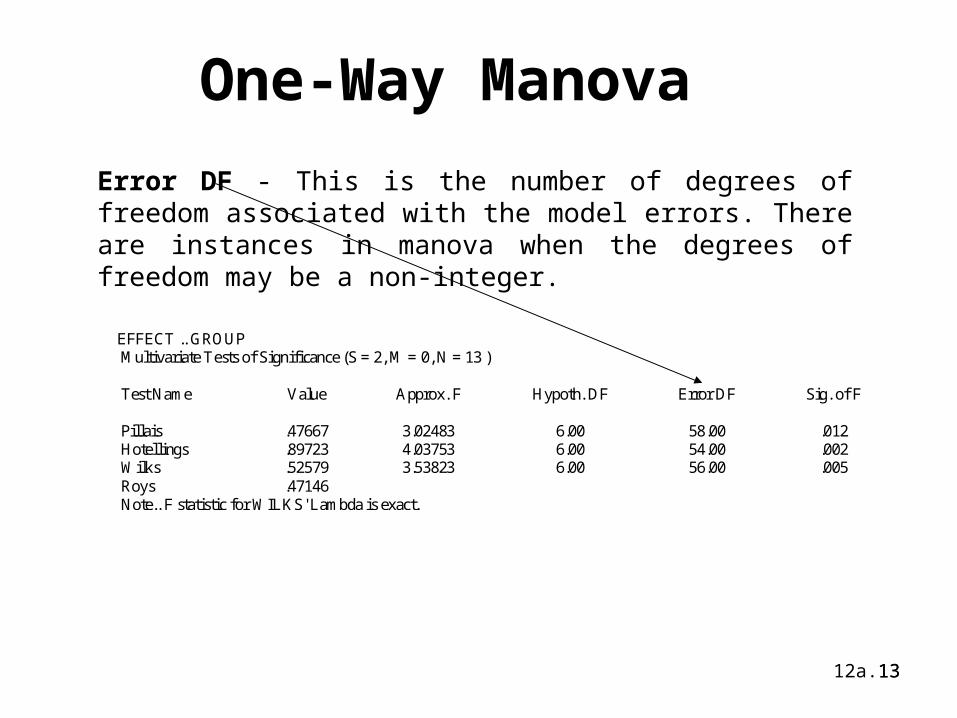
Error DF - This is the number of degrees of freedom associated with the model errors. There are instances in manova when the degrees of freedom may be a non-integer.
EFFECT .. GROUP Multivariate Tests of Significance (S = 2, M = 0, N = 13 ) Test Name Value Approx. F Hypoth. DF Error DF Sig. of F Pillais .47667 3.02483 6.00 58.00 .012 Hotellings .89723 4.03753 6.00 54.00 .002 Wilks .52579 3.53823 6.00 56.00 .005 Roys .47146 Note.. F statistic for WILKS' Lambda is exact.
12a.1414
One-Way Manova
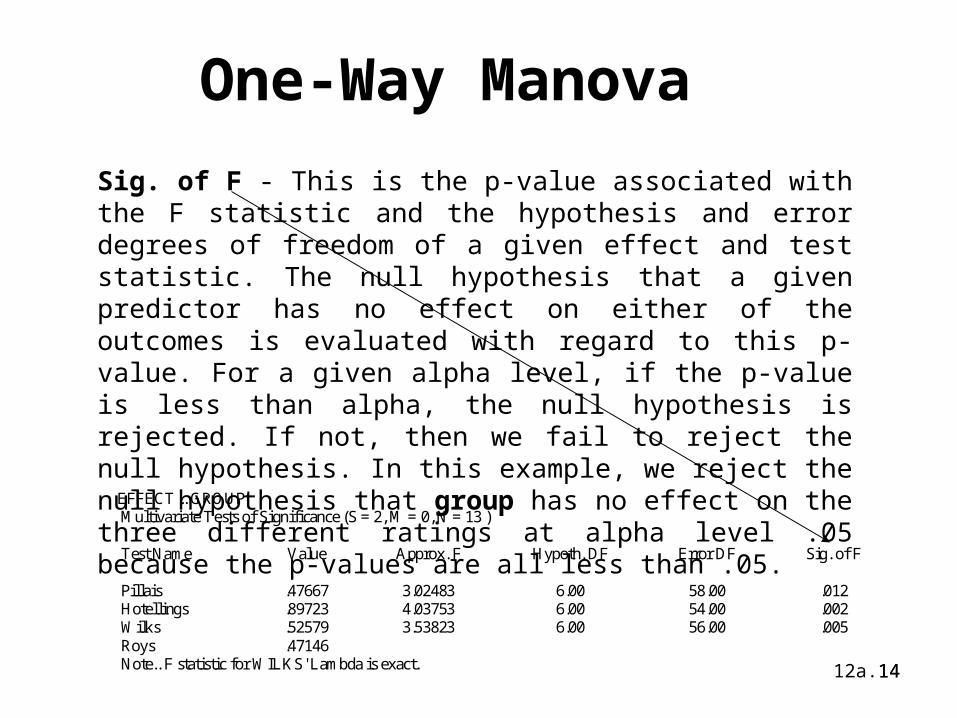
Sig. of F - This is the p-value associated with the F statistic and the hypothesis and error degrees of freedom of a given effect and test statistic. The null hypothesis that a given predictor has no effect on either of the outcomes is evaluated with regard to this p-value. For a given alpha level, if the p-value is less than alpha, the null hypothesis is rejected. If not, then we fail to reject the null hypothesis. In this example, we reject the null hypothesis that group has no effect on the three different ratings at alpha level .05 because the p-values are all less than .05.EFFECT .. GROUP
Multivariate Tests of Significance (S = 2, M = 0, N = 13 ) Test Name Value Approx. F Hypoth. DF Error DF Sig. of F Pillais .47667 3.02483 6.00 58.00 .012 Hotellings .89723 4.03753 6.00 54.00 .002 Wilks .52579 3.53823 6.00 56.00 .005 Roys .47146 Note.. F statistic for WILKS' Lambda is exact.
12a.1515
One-Way Manova
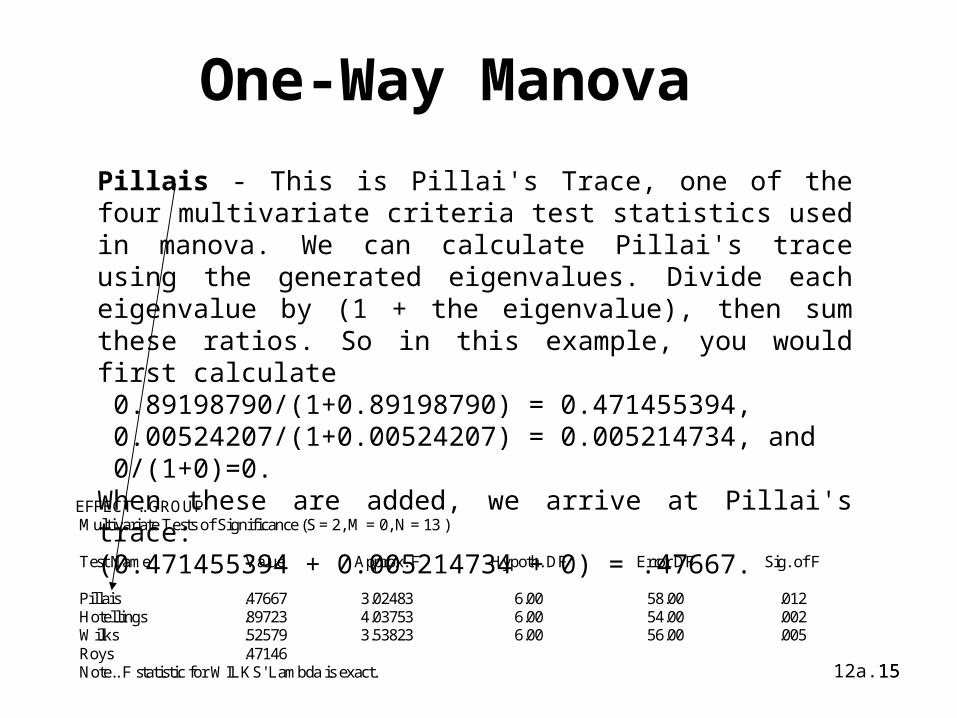
Pillais - This is Pillai's Trace, one of the four multivariate criteria test statistics used in manova. We can calculate Pillai's trace using the generated eigenvalues. Divide each eigenvalue by (1 + the eigenvalue), then sum these ratios. So in this example, you would first calculate 0.89198790/(1+0.89198790) = 0.471455394, 0.00524207/(1+0.00524207) = 0.005214734, and 0/(1+0)=0. When these are added, we arrive at Pillai's trace: (0.471455394 + 0.005214734 + 0) = .47667. EFFECT .. GROUP
Multivariate Tests of Significance (S = 2, M = 0, N = 13 ) Test Name Value Approx. F Hypoth. DF Error DF Sig. of F Pillais .47667 3.02483 6.00 58.00 .012 Hotellings .89723 4.03753 6.00 54.00 .002 Wilks .52579 3.53823 6.00 56.00 .005 Roys .47146 Note.. F statistic for WILKS' Lambda is exact.
12a.1616
One-Way Manova
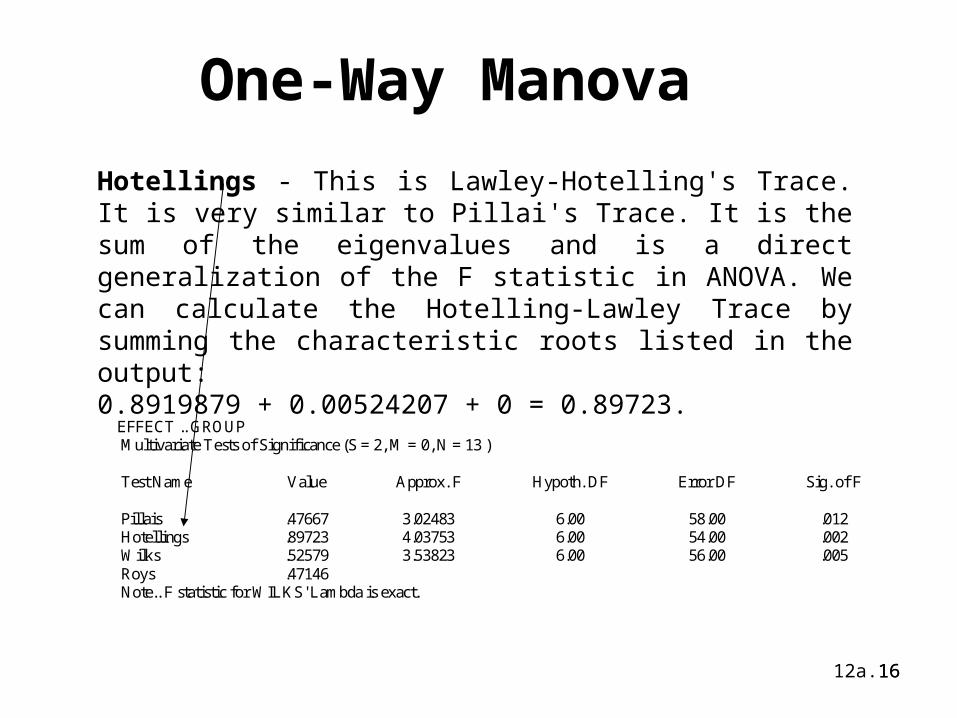
Hotellings - This is Lawley-Hotelling's Trace. It is very similar to Pillai's Trace. It is the sum of the eigenvalues and is a direct generalization of the F statistic in ANOVA. We can calculate the Hotelling-Lawley Trace by summing the characteristic roots listed in the output: 0.8919879 + 0.00524207 + 0 = 0.89723.
EFFECT .. GROUP Multivariate Tests of Significance (S = 2, M = 0, N = 13 ) Test Name Value Approx. F Hypoth. DF Error DF Sig. of F Pillais .47667 3.02483 6.00 58.00 .012 Hotellings .89723 4.03753 6.00 54.00 .002 Wilks .52579 3.53823 6.00 56.00 .005 Roys .47146 Note.. F statistic for WILKS' Lambda is exact.
12a.1717
One-Way Manova
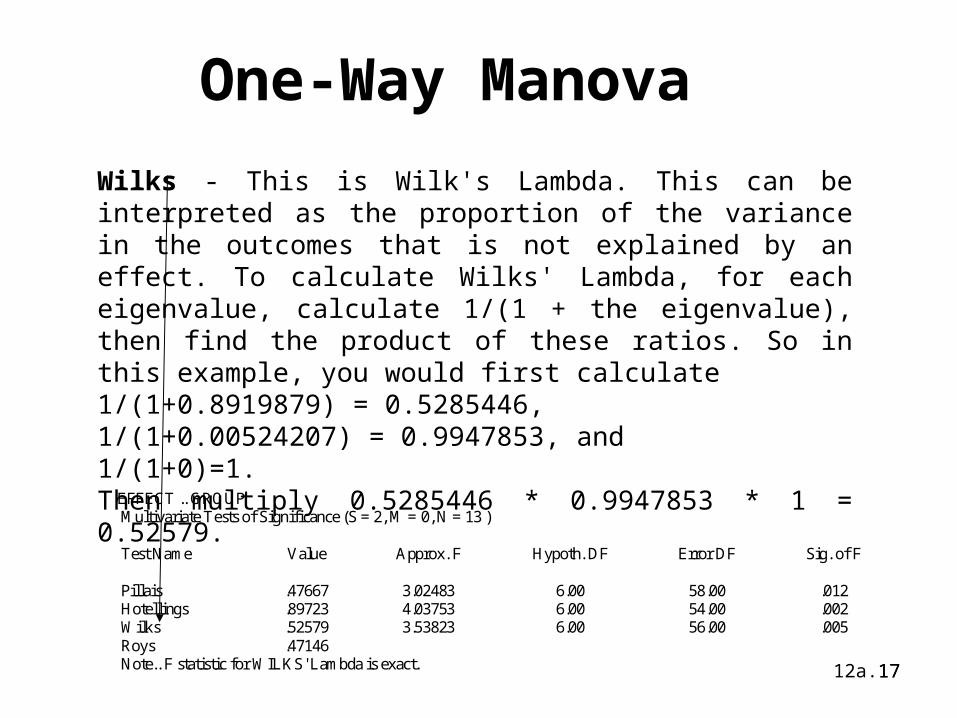
Wilks - This is Wilk's Lambda. This can be interpreted as the proportion of the variance in the outcomes that is not explained by an effect. To calculate Wilks' Lambda, for each eigenvalue, calculate 1/(1 + the eigenvalue), then find the product of these ratios. So in this example, you would first calculate 1/(1+0.8919879) = 0.5285446, 1/(1+0.00524207) = 0.9947853, and 1/(1+0)=1. Then multiply 0.5285446 * 0.9947853 * 1 = 0.52579.
EFFECT .. GROUP Multivariate Tests of Significance (S = 2, M = 0, N = 13 ) Test Name Value Approx. F Hypoth. DF Error DF Sig. of F Pillais .47667 3.02483 6.00 58.00 .012 Hotellings .89723 4.03753 6.00 54.00 .002 Wilks .52579 3.53823 6.00 56.00 .005 Roys .47146 Note.. F statistic for WILKS' Lambda is exact.
12a.1818
One-Way Manova
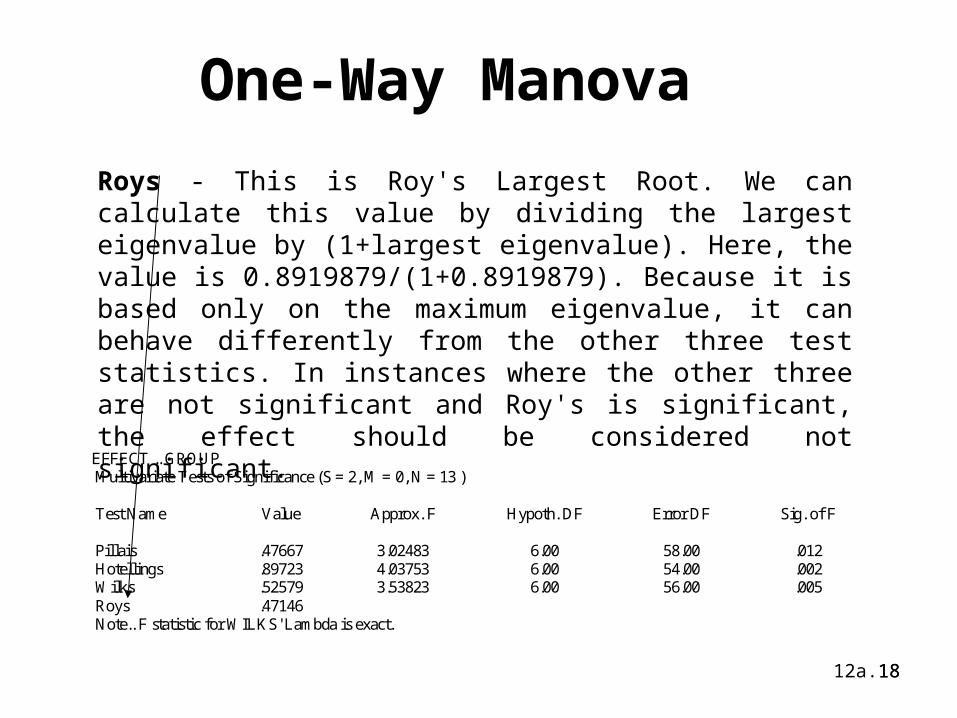
Roys - This is Roy's Largest Root. We can calculate this value by dividing the largest eigenvalue by (1+largest eigenvalue). Here, the value is 0.8919879/(1+0.8919879). Because it is based only on the maximum eigenvalue, it can behave differently from the other three test statistics. In instances where the other three are not significant and Roy's is significant, the effect should be considered not significant.
EFFECT .. GROUP Multivariate Tests of Significance (S = 2, M = 0, N = 13 ) Test Name Value Approx. F Hypoth. DF Error DF Sig. of F Pillais .47667 3.02483 6.00 58.00 .012 Hotellings .89723 4.03753 6.00 54.00 .002 Wilks .52579 3.53823 6.00 56.00 .005 Roys .47146 Note.. F statistic for WILKS' Lambda is exact.
12a.1919
One-Way Manova
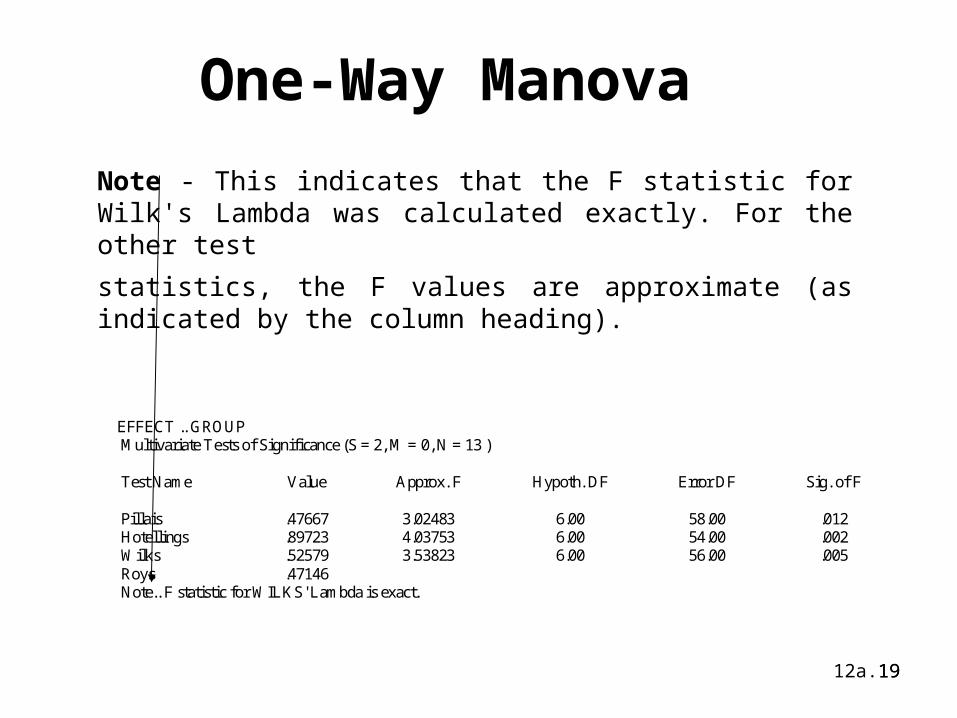
Note - This indicates that the F statistic for Wilk's Lambda was calculated exactly. For the other test
statistics, the F values are approximate (as indicated by the column heading).
EFFECT .. GROUP Multivariate Tests of Significance (S = 2, M = 0, N = 13 ) Test Name Value Approx. F Hypoth. DF Error DF Sig. of F Pillais .47667 3.02483 6.00 58.00 .012 Hotellings .89723 4.03753 6.00 54.00 .002 Wilks .52579 3.53823 6.00 56.00 .005 Roys .47146 Note.. F statistic for WILKS' Lambda is exact.
12a.2020
One-Way Manova
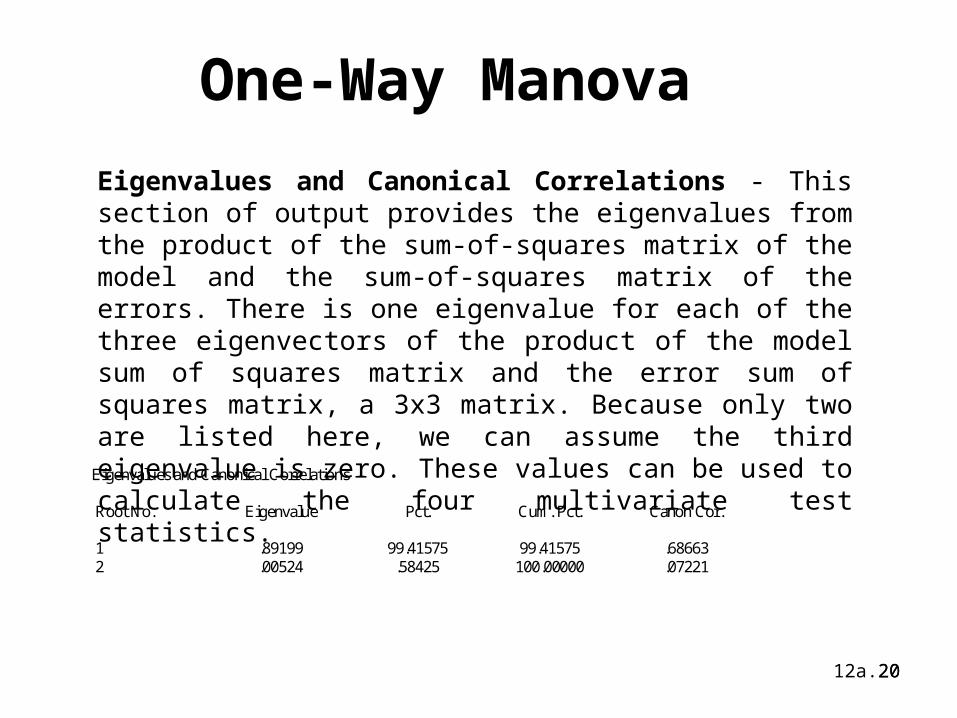
Eigenvalues and Canonical Correlations - This section of output provides the eigenvalues from the product of the sum-of-squares matrix of the model and the sum-of-squares matrix of the errors. There is one eigenvalue for each of the three eigenvectors of the product of the model sum of squares matrix and the error sum of squares matrix, a 3x3 matrix. Because only two are listed here, we can assume the third eigenvalue is zero. These values can be used to calculate the four multivariate test statistics. Eigenvalues and Canonical Correlations
Root No. Eigenvalue Pct. Cum. Pct. Canon Cor. 1 .89199 99.41575 99.41575 .68663 2 .00524 .58425 100.00000 .07221
12a.2121
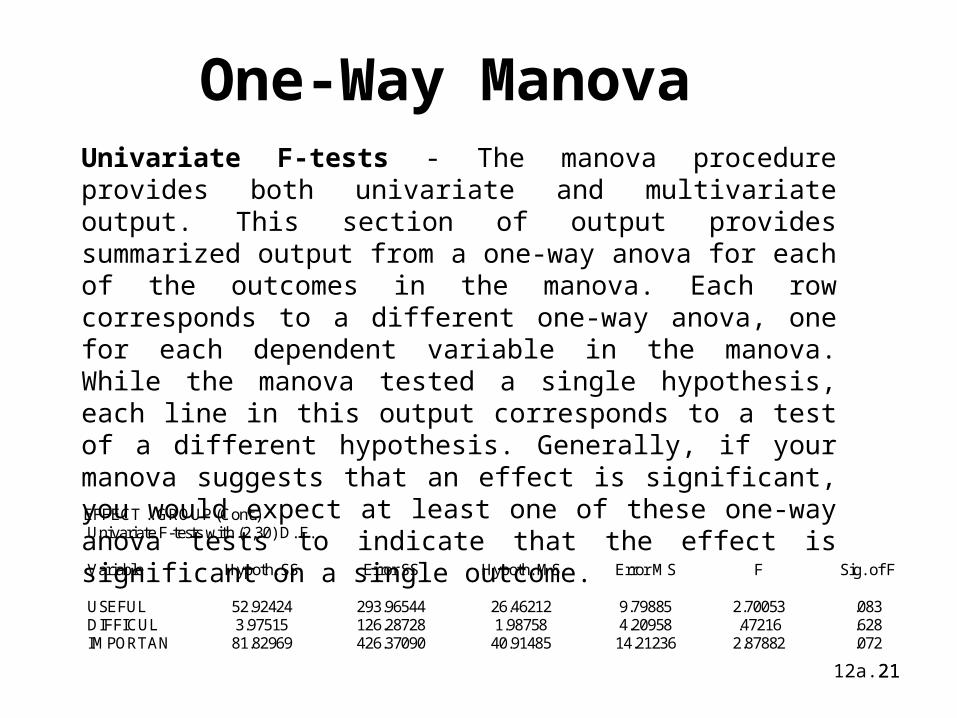
One-Way Manova Univariate F-tests - The manova procedure provides both univariate and multivariate output. This section of output provides summarized output from a one-way anova for each of the outcomes in the manova. Each row corresponds to a different one-way anova, one for each dependent variable in the manova. While the manova tested a single hypothesis, each line in this output corresponds to a test of a different hypothesis. Generally, if your manova suggests that an effect is significant, you would expect at least one of these one-way anova tests to indicate that the effect is significant on a single outcome. EFFECT .. GROUP (Cont.) Univariate F-tests with (2,30) D. F. Variable Hypoth. SS Error SS Hypoth. MS Error MS F Sig. of F USEFUL 52.92424 293.96544 26.46212 9.79885 2.70053 .083 DIFFICUL 3.97515 126.28728 1.98758 4.20958 .47216 .628 IMPORTAN 81.82969 426.37090 40.91485 14.21236 2.87882 .072
12a.2222
One-Way Manova
Discriminant analysis is just the inverse of a one-way MANOVA, the multivariate analysis of variance. The levels of the independent variable (or factor) for Manova become the categories of the dependent variable for discriminant analysis, and the dependent variables of the Manova become the predictors for discriminant analysis.
12a.2323
One-Way Manova
In MANOVA we ask whether group membership produces reliable differences on a combination of dependent variables. If the answer to that question is 'yes' then clearly that combination of variables can be used to predict group membership.
Mathematically, MANOVA and discriminant analysis are the same; indeed, the SPSS MANOVA command can be used to print out the discriminant functions that are at the heart of discriminant analysis, though this is not usually the easiest way of obtaining them.