Embed Size (px)
Citation preview

Nomura Real Estate Master Fund, Inc.8-5-1 Nishi-Shinjuku, Shinjuku Ward, Tokyo
https://www.nre-mf.co.jp/en/
12th Fiscal PeriodSemi-Annual ReportMarch 1, 2021 to August 31, 2021
Securities Code: 3462

Driving the Market as One of Japan’s Largest REITs
C O N T E N T S
Message from the Management P.03To Our Unitholders / Performance Highlights
Management Strategy P.05Track Record of Growth since Incorporation / External Growth / Internal Growth
ESG Measures P.15ESG Measures
Financing Status P.17Financing Status / Financial Statement Highlights / Market Review
Portfolio P.21Portfolio Analysis / Portfolio Gallery
Investor Information P.27Distribution Policy / Structure and Organization / Investor Information
Financial Section P.31Balance SheetStatement of Income and Retained EarningsStatement of Changes in Net AssetsStatement of Cash FlowsNotes to Financial StatementsIndependent Auditor’s Report
Retai l
Resident ia lOff ice
Logist ics

To Our Unitholders
PERFORMANCE HIGHLIGHTS
12th Fiscal Period 13th Fiscal Period(forecast)*
14th Fiscal Period(forecast)*
Cash Distribution per Unit(including distribution in excess of earnings)
¥3,288 ¥3,227 ¥3,242
Operating Revenues ¥37,519 million ¥37,466 million ¥37,833 million
Operating Expenses ¥22,777 million ¥22,653 million ¥22,972 million
Net Income ¥12,434 million ¥12,595 million ¥12,666 million
Total Assets ¥1,192,507 million ¥1,190,911 million ¥1,190,176 million
3,500
3,000
2,500
0
3,1283,209
3,2793,317 3,330
3,2883,227 3,242
30,000
20,000
10,000
0
7th FP 8th FP 9th FP 10th FP 11th FP 12th FP 13th FP(Forecast)
14th FP(Forecast)
7th FP 8th FP 9th FP 10th FP 11th FP 12th FP 13th FP(Forecast)
14th FP(Forecast)
(Yen)
40,000
(Millions of yen) Operating Revenues Net Income
* The above forecast distribution is calculated based on certain assumptions as disclosed in “SUMMARY OF FINANCIAL RESULTS (REIT) For the 12th Fiscal Period Ended August 31, 2021,” published October 13, 2021. As such, the actual distribution may differ from this forecast due to future property acquisitions or sales, changes in the real estate market, tenant changes or other changes in the circumstances surrounding NMF. The distribution forecast is not a guarantee of distributions.
(Note) Mika Okada is her maiden name and the name she uses professionally. The name recorded on her family register is Mika Furusawa.
Nomura Real Estate Master Fund, Inc.
Executive Director Shuhei Yoshida(From left)Supervisory Director Koichi OwadaSupervisory Director Mineo UchiyamaSupervisory Director Mika Okada (Note)
Message from the Management
NMF will strive to increase unitholder value by securing stable income over the medium to long term and ensuring the steady growth of assets under management.
Operating Revenues and Net Income Cash Distribution per Unit
First, we would like to express our deepest condolences to those who have lost their lives due to COVID-19 and their families, as well as our sympathies to those fighting the disease.
In reaching the end of our 12th fiscal period, we would also like to extend our sincere gratitude to all unitholders for your continued support for Nomura Real Estate Master Fund, Inc.
During the 12th fiscal period, we decided to acquire Landport Ome III (¥17 billion) following Landport Ome II which we acquired in the previous fiscal period. In addition, we have considered selling and replacing properties with concerns over the future including regional properties and aged proper-ties up to now, and recently decided to sell NMF Utsunomiya Building alongside the property acquisition.
As a result of the property replacement this time, not only just profitability but also the ratio of the logistics sector, which is expected to generate stable earnings even amid the COVID-19 crisis, will increase. Furthermore, the portfolio quality will improve from various perspectives such as the ratio of the Greater Tokyo area, building age and environmen-tal performance.
In the fiscal period under review, while retail facilities, etc. are repeatedly requested to shorten operating hours with the declaration of a state of emergency and implementation of semi-emergency COVID-19 measures due to the prolonged COVID-19 pandemic, we continued to offer rent reduction/exemption and other forms of relief to support some of our retail tenants. Nevertheless, the impact of this on overall portfolio revenue was limited.
Furthermore, in the office and rental apartment sectors, changes in the market, such as rising vacancy rates and declining advertised rents, were also continuously observed.
The properties held by NMF were also affected by increase in the area of contract terminations and such. However, through appropriate and flexible leasing activities based on market trends, as well as rent increases upon tenant change and upward rent revisions upon contract renewal, we continued to practice management with an aim to secure stable revenue.
As a result, at the end of the 12th fiscal period, our portfolio consisted of 299 properties with a total acquisition price of ¥1,068.4 billion. Operating revenues totaled ¥37,519 million, operating profit reached ¥14,741 million, and net income came to ¥12,434 million. As for rent reduction/exemption and other factors that led to temporary decrease in revenue due to COVID-19, partial reversal of internal reserves was made in the amount of ¥447 million for the purpose of leveling the amount of distribution and maintaining forecast distribution amount. Accordingly, cash distribution per unit for the 12th fiscal period came to ¥3,288, the same as the initial forecast.
In addition, in the area of ESG (environmental, social and governance) activities, which we have been promoting for some time, we continued to promote ESG initiatives, such as initiatives in the environmental field aiming for energy saving and initiatives in the social field including the survey on tenant satisfaction, in the fiscal period under review towards the achievement of materiality (material issues) and KPI targets formulated to realize sustainable growth of NMF. We will continue to proactively promote ESG initiatives as the front runner in the J-REIT industry.
With a careful eye on the impact of COVID-19, we remain strongly committed to enhancing fund performance and managing the fund’s assets in an aim to live up to the expec-tations and trust of our unitholders. We ask for your contin-ued support and encouragement.
Financing Status PortfolioManagement Strategy Investor InformationESG Measures Financial SectionMessage from the Management
3 4Nomura Real Estate Master Fund, Inc. Nomura Real Estate Master Fund, Inc.

783.6
-34.1
784.6
33.6
-34.1
932.8
181.9
-81.5
927.3
220.9
-105.0
922.5
237.4
-105.0
955.9
270.8
-110.3 -110.4
1,051.6 1,066.2
371.3 385.9
-110.3
960.3
-110.3 -110.3
1,011.2 1,031.0
279.9
330.9 350.6
-110.4 -113.1
1,068.4 1,083.1
388.0 405.0
792.6
9.0
Aug. 2019 FPFeb. 2019 FP Feb. 2021 FPFeb. 2020 FP Aug. 2021 FP After asset replacementAug. 2020 FPAug. 2018 FPFeb. 2018 FPAug. 2017 FPFeb. 2017 FPAug. 2016 FPFeb. 2016 FP
Incorporation(Oct. 2015)
19 properties ¥137.4 bln
Absorption type mergerwith TOP REIT, Inc.
10 properties ¥33.4 blnThe 1st PO 12 properties ¥57.4 bln
The 2nd PO9 properties ¥40.4 bln
The 3rd PO
0
AccumulatedAcquisition Price
AccumulatedDisposition Price
(Billions of yen) Asset Size Accumulated Acquisition Price Accumulated Disposition Price
77 properties
¥405.0 bln
37 properties
¥113.1 bln
200
400
600
800
1,000
(Note 1) Distributions for February 2016 FP are calculated on a six-month basis for 152 operating days. (Note 2) As of January 6, 2022.(Note3) It is an average building age without taking into account the effect of property acquisition and disposition from the original portfolio at incorporation until January 6, 2022.
NEC Head Office Bldg.
PMO Nihonbashi Mitsukoshi-mae
PROUD FLAT Sangenjaya II
PMO Tamachi Higashi
Summit Store Honamanuma
PMO Akihabara Kita
Harumi Triton Y&Z
Hotel Vista Sapporo Odori
GEMS Shinbashi
Serenite Shinsaibashi Grande
GEMS NambaPROUD FLAT
Shibuya Tomigaya
Incorporation
Number of properties 257
Ratio of top 10 properties 26.8%
Ratio of Greater Tokyo area 79.8%
Average building age 19.3 years
DPU (Note 1) ¥2,656
Aug. 2021 FP After asset replacement (Note 2)
299 299
22.2% 22.1%
82.8% 83.2%
19.8 years 19.8 years(25.6 years without SPR) (Note 3)
¥3,288(+23.8%)
Acquisition of high-quality properties mainly developed by the Sponsor
Disposition of less competitive properties due to building age, etc.
Improved portfolio quality through strategic property replacement supported by the Sponsor and achieved steady increase in distributions.
Track Record of Growth since Incorporation
Financing Status Portfolio Investor InformationESG Measures Financial SectionMessage from the Management Management Strategy
5 6Nomura Real Estate Master Fund, Inc. Nomura Real Estate Master Fund, Inc.

<Quality of sponsor-developed properties (Note)>
(1) Ratio of Greater Tokyo area (2) Average building age
Sponsor-developed properties Entire portfolio
Greater Tokyo97.8%
82.8%
7.8%
19.8%
(Reference) Properties Acquired in Aug. 2021 (12th) and Feb. 2022 (13th) FP
Acquisition price ¥2,139 mln
Appraisal value ¥2,210 mln
Acquisition date Jul 30, 2021
Location Osaka, Osaka
Total land area 8,788.67 m2
Landport Ome Ⅲ (Logistics)
Anticipated acquisition price ¥17,000 million
Appraisal value ¥18,300 million
Location Ome, Tokyo
NOI yield (after depreciation) 4.5% (3.7%)
Asset age (as of date of acquisition) 1.1 years
NMF Utsunomiya Building (Office)
Scheduled transfer price ¥2,720 million
Appraisal value ¥2,390 million
Notional book value ¥2,445 million
NOI yield (after depreciation) 5.6% (2.9%)
Asset age (as of date of disposition) 21.8 years
Ome IC
Ken-O Expressway
Iwakura-Kaido StreetOme-Kaido Street
Tama R
iv.
Om
e Line
Hamura City Office
YokotaAir Base
HakonegasakiSta.
Sayama Golf Club
Hachiko Line
To Hachioji JCT
To Tsurugashima JCT
Hamura Sta.
Ozaku Sta.
16LP Ome Ⅲ
LP Ome Ⅰ
LP Ome Ⅱ
Anticipated acquisition price ¥17,000 mln
Appraisal value ¥18,300 mln
Scheduled date of acquisition Jan 6, 2022
Location Ome, Tokyo
Total floor area 73,087.15 m2
Completion Nov. 2020
Acquisitions
Disposition
Landport Ome Ⅲ
Universal CityWalk Osaka (Additional stake acquisition of land)
Anticipated acquisition price ¥17.0 bln NOI yield 4.5% Building age 1.1 years
Favorable location allowing for wide area delivery to the entire Tokyo metropolitan areaLocated in approximately 2.9 km from the Ome Interchange on the Ken-O Expressway and close to National Route 16, allowing for wide-area delivery to the entire Tokyo metropolitan area.
24 hours a day, 365 days a year operation with favorable employment environmentLocated in the Nishi-Tokyo Industrial Park, which is a 10-minute walk from Ozaku Station on the JR Ome Line, the nearest station, so it can operate 24 hours a day, 365 days a year and allows tenants to maintain a favorable employment environment.
A “category-wide multi-function” logistic facilityA logistics facility that pursues optimization and efficiency by adopting a category-wide multi-function that adds functions specific to the target tenant’s industry needs. Furthermore, environmentally friendly LED lighting is adopted in the whole building.
End of Aug. 2020 FP After acquisition and sale
Main acquisitionsLandport Ome ⅡLandport Ome Ⅲ
Main saleNMF Utsunomiya Building
Residential
19.2%
Retail(Residential area)5.6%
Hotels
0.6%
Office
45.0%
Logistics
17.7%
Retail(Near stations)11.2%
Retail(Near stations)11.4%
Retail(Residential area)5.4%
Residential
18.7%Office
43.5%
Logistics
20.1%
Hotels
0.6%
Conducted asset replacement between a local office building and a relatively recently built logistics facility in the Greater Tokyo area that was developed by sponsors.
External Growth PolicyContinued selective investment with a focus on sponsor-developed properties and aimed for distribution growth and improved portfolio quality through appropriate sales.
(Note 1) NOI yield for the asset to be acquired is calculated based on the anticipated acquisition price, and NOI yield for the asset to be disposed is calculated based on the scheduled transfer price.
(Note 2) NAV for the asset to be acquired is calculated based on unrealized gain calculated from notional book value and appraisal value at the time of acquisition, and NAV for the asset to be disposed is calculated based on unrealized gain calculated from notional book value and appraisal value at the time of sale.
(Note 3) The green certification ratio refers to the percentage of properties with three stars or more for DBJ Green Building Certification, three stars or more for BELS Certification, and B+ or higher for CASBEE for Real Estate. Universal elements and all related indicia TM & © 2019 Universal Studios. All rights reserved. CR19-3958
(Note) PMO, GEMS, Landport, and PROUD FLAT series of properties.
(1) Accumulation of cash flow through acquisition of a new property
Selective investments based on profitability and competitiveness even in a rising market, with a focus on sponsor-developed properties
Disposition took future competitive advantage into consideration (profitability, asset age, marketability, area growth potential, medium- to long-term operation, etc.)
Improvement of portfolio quality
Effect of Asset Replacement
(2) Improvement of portfolio quality
(3) Distributions increased by returning gain on sale to unitholders (Feb. 2022 FP: +¥34/unit)
(Achieved external growth while maintaining LTV acquisition capacity through disposition and cash reserves)
(Decisions in the retail and hotel sector were made with particular care to consider the impact of the COVID-19 pandemic)
Distribution growth(Consider returning gain on sale, if any, through distributions)
• Grew logistics portfolio ratio to second largest (over 20%) through ongoing acquisition of logistics facility• Improved profitability (NOI yield after depreciation (Note 1): asset to be disposed 2.9% ⇒ asset to be acquired 3.7%)• Improved NAV (Note 2) (NAV per unit: +¥231/unit)• Improved Greater Tokyo area ratio (82.8% ⇒ 83.2%)• Improved asset age, after completion of replacement (20.2 years ⇒ 19.8 years)• Improved green certification ratio (Note 3) for materiality (56.3% ⇒ 57.8%)
PMO Akihabara Kita PROUD FLAT Shibuya Tomigaya
External Growth
Financing Status Portfolio Investor InformationESG Measures Financial SectionMessage from the Management Management Strategy
7 8Nomura Real Estate Master Fund, Inc. Nomura Real Estate Master Fund, Inc.

97.8%97.8%
99.0%99.0% 98.9%98.9% 99.1%99.1% 99.3%99.3% 99.3%99.3% 98.8%98.8% 99.3%99.3% 99.7%99.7% 99.5%99.5% 99.2%99.2%
97.3%
Aug. 2019 FPFeb. 2019 FPAug. 2018 FPFeb. 2018 FPAug. 2017 FPFeb. 2017 FPAug. 2016 FPFeb. 2016 FP Aug. 2020 FPFeb. 2020 FP Feb. 2021 FP Aug. 2021 FP
Feb. 2022 FP(Forecast)
Aug. 2021 FP Feb. 2021 FPAug. 2020 FP Feb. 2020 FPAug. 2019 FP Feb. 2019 FP
Breakdown of reasons for move-out
[ Aug. 2021 FP ]COVID-19-related 38/70 cases
(Remote work 16 cases) (Cost reduction 22 cases)
[ Feb. 2022 FP (as of September 30) ] COVID-19-related 19/40 cases
(Remote work 9 cases) (Cost reduction 10 cases)
Number of pandemic-related cancellations also
steadily trending downward
Move-out by large tenant
COVID-19 pandemic(After rapid rise)
Dramatic reduction
2,4552,455
3,0013,001
2,2042,204 2,2722,272 1,8091,809 3,1303,130 6,9446,944 3,6853,685
Approx. 4,100 tsubo
expected
Approx. 4,100 tsubo
expected
As of Sep. 30
• 1,000 tsubo or more• Unconfirmed intention to continue as tenant• Unclear impact of remote working
Percentage of total meeting above conditions:
Remote working difficulties due to usage patterns
Confirmed intention to continue as tenant
Less than1,000 tsuboApprox. 67%
8.8%
Of this, more than 70%
is within 5 minutes walk of multiple train lines
Up to 3 minutes walk73.5%
4–5 minutes walk
21.9%
Up to 5 minutes walk
95.4%
Ratio of properties at ¥20,000/tsubo or lower, which is a range with solid demand despite the pandemic Approx. 60%
0
5,000
10,000
15,000
20,000
25,000
(tsubo)
¥26,001~~¥26,000~¥24,000~¥22,000~¥20,000~¥18,000~¥16,000
PMO Shinjuku Nomura Building
Feb. 2022 FP(Forecast)
Aug. 2021 FPFeb. 2021 FPAug. 2020 FPFeb. 2020 FPAug. 2019 FPFeb. 2019 FP
Despite ongoing impactsfrom the pandemic,
highest levels reached over recent years
Tenancy recovery after large tenant move-out
COVID-19 pandemic
3,1013,101 2,1402,140 2,2552,255 1,3511,351 2,0522,052 3,1943,194 2,965 (Note)2,965 (Note)
2,4012,401
600600
Approx. 7,300 tsubo
expected
Approx. 7,300 tsubo
expected
As of Sep. 30
Despite reduced occupancy rates during the declarations of states of emergency, continued to raise rent levels by taking advantage of the rent gap.
Portfolio was composed mainly of rental properties with high transportation conve-nience, and solid demand despite the pandemic.
Move-outs: The trend is toward a dramatic reduction in move-out floor area, with limited move-out risk from large-scale sections of concern in the future.
Move-ins: Despite ongoing impacts from the pandemic and declarations of states of emergency, new contracts have reached their highest levels over recent years.
<PMO> Achieved steady contract progress and rent increases against the backdrop of high marketability.
Office
Aiming to improve occupancy rates by meeting the positive needs of tenants, which are increasing, and through property competitiveness and flexible leasing. (Period-average occupancy rate for August 2021 FP: 97.3% (actual) ⇒ Expected rate for February 2022 FP: 97.4% (end of period occupancy rate: 98.3%))(Note 3)
Aiming to achieve positive growth for average rents as well by taking advantage of the rent gap.
Among new tenants moving in,
approximately 85% have positive reasons
Total move-ins for August 2021 FP: 47 3,194 tsubo
Number of above with positive reasons: 40 2,723 tsubo
(increased floor area, new facility, improved location and specifications)
Number of above with other reasons: 7 470 tsubo
Changes in period-average occupancy rates
Minutes walk to nearest station (Greater Tokyo area) (Note 1)
Leasing results for August 2021 FP
Distribution of average rents in Greater Tokyo area (Note 2)
Leasing progress for February 2022 FP
+5.1%Rent gaps (Note1)
End of Aug. 2021 FP (Down 3.0pt from previous FP)
0
5
10
15
20
25(%)
-2
0
2
4
6
8
10
(1,109 tsubo)(2,740 tsubo) (2,255 tsubo)(5,502 tsubo)
Monthly rent decrease
Monthly rent increase
Monthly rent change rate
88 55 77 44
7.5%7.5%
11.4%11.4%
17.6%17.6%
20.7%20.7%
(2,052 tsubo)
77
15.9%15.9%
(3,194 tsubo)
66
7.0%7.0%
-1-1
PMO+7.8%
Aug. 2019 FPFeb. 2019 FP Aug. 2020 FPFeb. 2020 FP Aug. 2021 FPFeb. 2021 FP
(Millions of yen)
0
2
4
3
1
6
5
-5
0
15
10
5
25
20
30
2.4%2.4%
3.3%3.3% 3.4%3.4%
4.6%4.6%
-2-2
88 1515 1717 1717
(24,914 tsubo)(21,007 tsubo) (22,254 tsubo)
3.0%3.0%
88
(16,384 tsubo)
1.6%1.6%
77
(27,162 tsubo)(22,830 tsubo)
PMO+2.0%
Aug. 2019 FPFeb. 2019 FP Aug. 2020 FPFeb. 2020 FP Aug. 2021 FPFeb. 2021 FP
(%)(Millions of yen)
Monthly rent decrease
Monthly rent increase
Monthly rent change rate
Amount of change in monthly rent and rate of change in monthly rent upon tenant replacement (Note2)
Changes in move-out floor area (Tsubo)
Changes in move-in floor area (Tsubo)
Amount of change in monthly rent and rate of change in monthly rent upon rent revision (Note2)
Forecast move-out risks associated with large-scale sections and remote work
Reasons for move-in (Aug. 2021 FP)
(Note1) It is calculated subject to the properties held by NMF excluding the properties which the entire building leased to one tenant. (Note2) Figures in parentheses are the floor area upon tenant replacement and the floor area (Tsubo) subject to rent revision. The change in monthly rent is calculated
as the weighted average of all subjected area. The same applies to the following investment sectors.
(Note 1) Calculated based on the ratio of leasable area. (Note 2) Total leasable areas shown are based on average price per tsubo ranges of owned properties.(Note 3) Period-average occupancy rate is calculated based on the floor area subject to move-ins and move-outs assumed in the earning forecast.
+13.7%Average rate of rent increase within tenant replacement with rent increase
+5.0%Average rate of rent increase within rent revision with rent increase
New move-ins 975 tsubo New move-ins (planned) 764 tsubo
Rent changes rate +7.8% Rent changes rate +16.1%(Contracted sections only)
(As of September 30, including applications completed)
(Note) The figure shows floor area for which is contracted or NMF received applications for occupancy.
Internal Growth -Management Status-
Financing Status Portfolio Investor InformationESG Measures Financial SectionMessage from the Management Management Strategy
9 10Nomura Real Estate Master Fund, Inc. Nomura Real Estate Master Fund, Inc.

More than 90%
of total
Landport series76.5%
96.6%96.6% 97.0%97.0% 96.9%96.9%96.4%96.4%
95.9%95.9% 96.1%96.1%
ReversalReversal
Aug. 2021 FPFeb. 2021 FPAug. 2020 FPFeb. 2020 FPAug. 2019 FPFeb. 2019 FP
Landport Kashiwa Shonan I: Approx. 14,800 tsubo Landport Itabashi: Approx. 4,600 tsubo
Re-contracted with one tenant with a lease expiring after improving economic conditions.Rent increase rate: +4.0%
Logistics
Tenant with expired lease during August 2021 FP Tenant with expired lease during February 2022 FP
2,8442,844 3,2353,235 4,6174,617 5,0105,010 2,4262,426
-557-557
2.8%2.8% 2.6%2.6%
4.5%4.5% 4.3%4.3%
2.0%2.0%
Aug. 2021 FPFeb. 2021 FPAug. 2020 FPFeb. 2020 FPAug. 2019 FPFeb. 2019 FP
Amount of change in monthly rent Rate of change in monthly rent
(Thousands of yen)
-0.4%-0.4% 253253 217217 488488 832832 681681 855855
0.1%0.1%
0.4%0.4% 0.4%0.4% 0.4%0.4% 0.4%0.4%
0.2%0.2%
Aug. 2021 FPFeb. 2021 FPAug. 2020 FPFeb. 2020 FPAug. 2019 FPFeb. 2019 FP
(Thousands of yen)
Amount of change in monthly rent Rate of change in monthly rent
Achieved continuous high occupancy, and rent increases when re-contracting, against the backdrop of active logistics demand even during the pandemic.
Despite increased number of cancellations, occupancy rates increased through a flexible leasing strategy, and positive rent growth was achieved in total for tenant replacements and renewals.
Succeeded in lifting the occupancy rates for single-type properties in central Tokyo(Note), which was a priority issue.Continued to raise rents at replacements for family-type properties and in areas that were relatively strong outside the 23 wards of Tokyo.
Residential
Amount of change in monthly rent at move-ins and move-outs
Single-type property occupancy rates and rent increase rates at replacements in the 23 wards within Tokyo
Rate of change in monthly rent at renewals
Mar. 2017
Mar. 2018
Mar. 2019
Mar. 2020
Mar. 2021
Tokyo Outer Ring Road area 2.6% 2.5% 0.7% 0.4% 1.6%
National Route 16 area 4.1% 4.4% 4.0% 0.3% 0.0%
Metropolitan Intercity Expressway area 19.8% 18.9% 12.2% 0.6% 3.1%
Feb. 2018, 2019, 2020 FP average
Feb. 2021 FPPeriod-average
Aug. 2021 FPPeriod-average
Occupancy ratedifference
August 2021 FP replacementrent increase rate
5 central wards of Tokyo 97.9% 94.8% 95.8% +1.0% -0.3%
Jonan area 97.4% 95.5% 96.2% +0.7% -0.7%
Other wards 97.5% 96.4% 96.2% -0.2% +0.4%
(Note) Properties with average area per dwelling of less than 30 m2.
(Note) Properties with total floor space of 10,000 m2 or more, distance between pillars of 10 m or more, ceiling height of 5.5 m or more for the majority of floors, and floor weight capacity of 1.5 t/m2 or more.
* Comparison of nominal average rents without consideration of shortened rent-free periods
Source: “Japan Logistics MarketView” published by CBRE
Aug. 2021 FPFeb. 2021 FPAug. 2020 FPFeb. 2020 FPAug. 2019 FPFeb. 2019 FPAug. 2018 FPFeb. 2018 FPAug. 2017 FPFeb. 2017 FPAug. 2016 FPFeb. 2016 FP
100.0%100.0%
98.0%98.0%
100.0%100.0%99.2%99.2%
100.0%100.0%
Changes in period-average occupancy rates
Changes in number of lease cancellations (Note)
Changes in period-average occupancy rates
Leasing progress for sections with expired leases
Examples of rent increases when contracting
Logistics portfolio map (Greater Tokyo area)Ratio of advanced logistics facilities(Note)
(Acquisition price base)
Logistics portfolio is generally distributed along National Route 16 and the Tokyo Outer Ring Road, which are areas of solid demand
Changes in vacancy rates by area on the market
Atsugi IC
Kashiwa IC
Tokyo Gaikan Expressway
National Route 16
Metropolitan Intercity Expressway
Tohoku Expressway
Joban Expressway
Tom
ei E
xpre
ssw
ay
Haneda Airport
Kan-Etsu Expressway
ChuoExpresswayHachioji JCT
Kawagoe IC
Narita Airport
Higashi-KantouExpressway
Aug. 2021 FPFeb. 2021 FPAug. 2020 FPFeb. 2020 FPAug. 2019 FPFeb. 2019 FP Aug. 2021 FPFeb. 2021 FPAug. 2020 FPFeb. 2020 FPAug. 2019 FPFeb. 2019 FP
Record number of cancellations
Number of cancellations COVID-19 pandemic COVID-19 pandemicNumber of contracts Strategy focused on occupancy rates
↓ ↓Achieved steady tenancy recovery
<Average vacancy periods> (February 2021 FP: 84 days) (August 2021 FP: 64 days)
1,2091,209 1,2141,2141,2931,2931,1501,150
1,3511,351 1,2601,260
Sections with expired leases for August 2021 FP: 18,273 tsubo
100% contracted
Sections with expired leases for February 2022 FP: 15,970 tsubo
100% contracted or under offer
Through leasing strategy focused on occupancy rates:
Increased occupancy rates dramatically
Despite targeting both rents and occupancy rates, occupancy rates declined due to the
spreading impact of COVID-19.
For single-type properties, switched to a focus on occupancy rates in the other wards as well, while aiming to maximize cash flow.
(Period-average occupancy rate for August 2021 FP: 96.1% (actual) ⇒ Expected rate for February 2022 FP: 96.2% (forecast)
99.4%Average occupancy rates since incorporation
Landport series
Others
Of two tenants with leases expiring, re-contracted to lease one building with one tenant after improving economic conditions.Rent increase rate: +6.8%
Internal Growth -Management Status-
(Note) The number of contracts and cancellations is affected by the seasons, so figures are for August FP each year.
Financing Status Portfolio Investor InformationESG Measures Financial SectionMessage from the Management Management Strategy
11 12Nomura Real Estate Master Fund, Inc. Nomura Real Estate Master Fund, Inc.

Retail
• Sales of facilities located in residential areas remained as strong as previously.
• Sales of retail facilities near stations stagnated (mainly restaurant tenants) due to the prolonged request for shortened operat-
ing hours, etc.
New contracts for August 2021 FP increased by five con-tracts period-to-period by attracting services tenants.
Example of leasing with services tenant with strong performance
(Left: Background to tenant intention)
Number of new
contracts
February 2021 FP
3 cases
nORBESA F3 68.57 tsubo Restaurant tenant
Services tenant (beauty salon)
(Status of negotiations with tenants whose fixed term lease expires)
Planned fixed term lease expirations for February 2022 FP
8 floors in total
Intention to re-contract (rent deferral planned)
+Move-in demand from companies
related to re-contracting tenant
7floors in total
August 2021 FP
8 cases
(+5 cases)
Offices: 1
Retail: 1
Restaurants: 1
Services: 4
Retail: 2
Restaurants: 2
February 2020 FP (before COVID-19): ¥6,103 million
August 2021 FP: ¥5,520 million (Note 2)
The majority was comprised of fixed rents,
so rents linked to sales were very limited.
Occupancy rates based on fixed rents
maintained a high level.
Excluding temporary rent reductions/exemptions
and variable rent reductions,
the impact of cancellations was very limited.
(Breakdown)Temporary rent reduction/exemption: -280 (-4.6%)Variable rent reduction: -151 (-2.5%) Cancellations, etc.: -150 (-2.5%)
Sales status for each facility type New leasing status (Facilities located near stations)
Trends among restaurant tenants (E.g., GEMS Ichigaya, expiration of fixed term lease)
Rent composition for overall retail portfolio (Note 1)
Occupancy rate status (As of August 31, 2021)
Rent revenue comparison before/after arrival of COVID-19
Despite ongoing impact of the sale of tenants, there was only limited impact on retail sector revenue.
Completed rebranding, etc. with a focus on stable operations and securing revenue after the end of the pandemic.
Succeeded in attracting tenants that see opportunities in the current market to open stores even during the pandemic.Achieved good results even for restaurant tenants through property competitiveness and a flexible leasing strategy.
KindsYear 2021 (change from the results of 2019)
Major TenantMar. Apr. May Jun. Jul. Aug.
Summit Store Honamanuma residential areas 113% 119% 138% 136% 132% 135% Food supermarket
Summit Store Mukodaicho (only summit)
residential areas 95% 98% 101% 97% 108% 110% Food supermarket
Recipe SHIMOKITA near stations 89% 95% 98% 85% 88% 91% Retail/Services
nORBESA near stations 57% 56% 40% 33% 61% 33% Restaurant/Retail/
Services
Universal CityWalk Osaka near stations 46% 26% 1% 21% 39% 28% Restaurant/Retail
GEMS total near stations 43% 40% 33% 31% 34% 27% Restaurant
<Sales status (Change from same month of 2019)>
(Note 1) Calculated based on rents in February 2020 FP.(Note 2) Based on 50 properties owned as of February 2020 FP.
Overall retail sector: 97.9%
Retail facilities near stations: 93.7%
-¥582 million
(-9.5%)
Fixed rent Variable rent
Fixed rent ratio
97.0%Hotels
• Located with good access: 3 minutes walk to Ichigaya Station, 5 minutes walk to Kojimachi Station
• High visibility, located on a corner block on Nippon TV Dori
• Rent deferral represents a rent reduction for the time being. Economic support (rent-free, interior furnishings, etc.) proposed
Property has high competitive advantage
Temporary rent reduction to cover impact of pandemic
Hotel Vista Sapporo Odori
■ Progress of the civil rehabilitation
• Secured approval of rehabilitation schedule on September 14, 2021 (effective).
• Plan to complete repayment of rehabilitation receivables, and complete all proceedings, by October 31, 2021.
Operator VISTA HOTEL MANAGEMENT CO., Ltd.
Monthly rent
fixed rent + variable rent (GOP-linked)
While implementing a stepped rent reduction for a certain period, lowered variable rent interest rate in anticipation of recovery after return of demand.
Comfort Inn Naha Tomari Port(Ex-Red Planet Naha Okinawa)
Changed operator and rebranded, and reopened on July 5, 2021
Tenant GREENS Co., LTD.
Contract period 10 years (fixed-term)
Monthly rent
First 1-2 years: fixed rent
From 3rd year: fixed rent + variable rent(GOP-linked)
The rent level is expected to be the same as or above the previous level after demand recovers to pre-pandemic levels.
Rate of rent increase upon tenant replacement:
+4.7%
Internal Growth -Management Status-
Financing Status Portfolio Investor InformationESG Measures Financial SectionMessage from the Management Management Strategy
13 14Nomura Real Estate Master Fund, Inc. Nomura Real Estate Master Fund, Inc.
December 2017Signatory to Principles for Responsible Investment (PRI) and United Nations
Environment Programme Finance Initiative (UNEP FI)
March 5, 2020Received Minister of the Environment
Award (the Most Excellent Efforts) from Principles for Financial Action for the 21st
Century
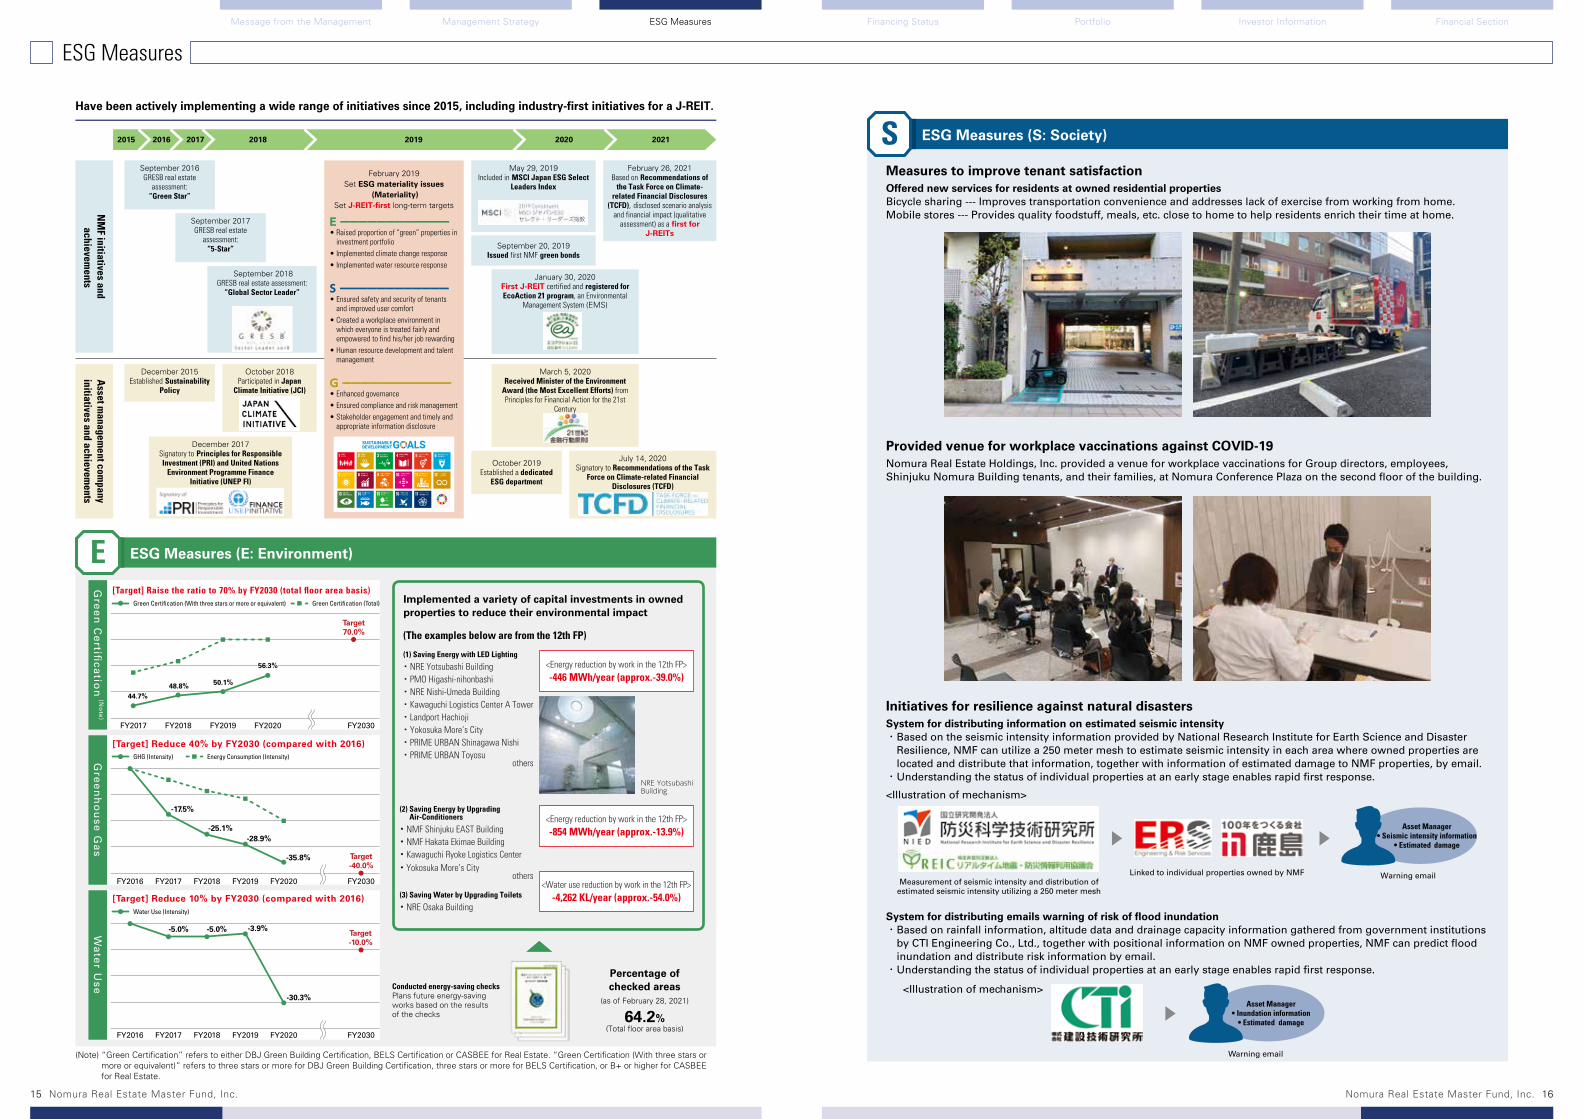
Implemented a variety of capital investments in owned properties to reduce their environmental impact
Conducted energy-saving checksPlans future energy-saving works based on the results of the checks
Percentage of checked areas
(as of February 28, 2021)
64.2%(Total floor area basis)
Measures to improve tenant satisfaction
Provided venue for workplace vaccinations against COVID-19
Initiatives for resilience against natural disasters
(1) Saving Energy with LED Lighting
・ NRE Yotsubashi Building・ PMO Higashi-nihonbashi・ NRE Nishi-Umeda Building・ Kawaguchi Logistics Center A Tower・ Landport Hachioji・ Yokosuka More’s City・ PRIME URBAN Shinagawa Nishi・ PRIME URBAN Toyosu
others
(The examples below are from the 12th FP)
NRE Yotsubashi Building
(2) Saving Energy by Upgrading Air-Conditioners
・ NMF Shinjuku EAST Building・ NMF Hakata Ekimae Building・ Kawaguchi Ryoke Logistics Center・ Yokosuka More’s City
others
(3) Saving Water by Upgrading Toilets
・ NRE Osaka Building
ESG Measures (S: Society)S
ESG Measures (E: Environment)E
Offered new services for residents at owned residential propertiesBicycle sharing --- Improves transportation convenience and addresses lack of exercise from working from home.Mobile stores --- Provides quality foodstuff, meals, etc. close to home to help residents enrich their time at home.
Nomura Real Estate Holdings, Inc. provided a venue for workplace vaccinations for Group directors, employees, Shinjuku Nomura Building tenants, and their families, at Nomura Conference Plaza on the second floor of the building.
System for distributing information on estimated seismic intensity・ Based on the seismic intensity information provided by National Research Institute for Earth Science and Disaster
Resilience, NMF can utilize a 250 meter mesh to estimate seismic intensity in each area where owned properties are located and distribute that information, together with information of estimated damage to NMF properties, by email.
・ Understanding the status of individual properties at an early stage enables rapid first response.
System for distributing emails warning of risk of flood inundation・ Based on rainfall information, altitude data and drainage capacity information gathered from government institutions
by CTI Engineering Co., Ltd., together with positional information on NMF owned properties, NMF can predict flood inundation and distribute risk information by email.
・ Understanding the status of individual properties at an early stage enables rapid first response.
<Illustration of mechanism>-17.5%
-3.9%
-30.3%
-25.1%-28.9%
-35.8%
Target-10.0%
温室効果ガス
水使用量
44.7%44.7%48.8%48.8% 50.1%50.1%
56.3%56.3%
-5.0% -5.0%
[Target] Raise the ratio to 70% by FY2030 (total floor area basis)Green Certification (With three stars or more or equivalent) Green Certification (Total)
Gre
en
Ce
rtifica
tion
(No
te)
[Target] Reduce 40% by FY2030 (compared with 2016)GHG (Intensity) Energy Consumption (Intensity)G
ree
nh
ou
se G
as
[Target] Reduce 10% by FY2030 (compared with 2016) Water Use (Intensity)
Wa
ter U
se
FY2019 FY2020 FY2030FY2018FY2016 FY2017
FY2019 FY2020 FY2030FY2018FY2016 FY2017
FY2019 FY2020 FY2030FY2018FY2017
Target70.0%
Target-40.0%
Have been actively implementing a wide range of initiatives since 2015, including industry-first initiatives for a J-REIT.
NM
F initiatives and achievem
entsA
sset managem
ent company
initiatives and achievements
2015 2016 2017 2018 2019 2020 2021
September 2016GRESB real estate
assessment:“Green Star”
December 2015Established Sustainability
Policy
October 2019Established a dedicated
ESG department
July 14, 2020Signatory to Recommendations of the Task
Force on Climate-related Financial Disclosures (TCFD)
October 2018Participated in Japan
Climate Initiative (JCI)
September 2017 GRESB real estate
assessment: “5-Star”
September 2018GRESB real estate assessment:
“Global Sector Leader”
January 30, 2020First J-REIT certified and registered for EcoAction 21 program, an Environmental
Management System (EMS)
May 29, 2019Included in MSCI Japan ESG Select
Leaders Index
September 20, 2019Issued first NMF green bonds
February 26, 2021Based on Recommendations of
the Task Force on Climate-related Financial Disclosures
(TCFD), disclosed scenario analysis and financial impact (qualitative
assessment) as a first for J-REITs
February 2019Set ESG materiality issues
(Materiality)Set J-REIT-first long-term targets
E ーーーーーーーーーーーー• Raised proportion of “green” properties in
investment portfolio• Implemented climate change response• Implemented water resource response
S ーーーーーーーーーーーー• Ensured safety and security of tenants
and improved user comfort• Created a workplace environment in
which everyone is treated fairly and empowered to find his/her job rewarding
• Human resource development and talent management
G ーーーーーーーーーーーー• Enhanced governance• Ensured compliance and risk management• Stakeholder engagement and timely and
appropriate information disclosure
<Water use reduction by work in the 12th FP>-4,262 KL/year (approx.-54.0%)
<Energy reduction by work in the 12th FP>-854 MWh/year (approx.-13.9%)
<Energy reduction by work in the 12th FP>-446 MWh/year (approx.-39.0%)
Warning emailMeasurement of seismic intensity and distribution of
estimated seismic intensity utilizing a 250 meter mesh
Linked to individual properties owned by NMF
Asset Manager• Seismic intensity information
• Estimateddamage
<Illustration of mechanism>
Warning email
Asset Manager• Inundation information
• Estimateddamage
ESG Measures
(Note) “Green Certification” refers to either DBJ Green Building Certification, BELS Certification or CASBEE for Real Estate. “Green Certification (With three stars or more or equivalent)” refers to three stars or more for DBJ Green Building Certification, three stars or more for BELS Certification, or B+ or higher for CASBEE for Real Estate.
Financing Status PortfolioManagement Strategy Investor Information Financial SectionMessage from the Management ESG Measures
15 16Nomura Real Estate Master Fund, Inc. Nomura Real Estate Master Fund, Inc.

Repayment Overview (Note 1)
Total amount of repayment
¥28,650 million
Average interest rate 1.19%
Average remaining duration
6.7 years
60,000
30,000
40,000
50,000
20,000
10,000
(FP)
1.5
1.0
0.5
0
(%)
0
Feb.2022
Aug.2031
Aug.2038
Feb.2040
1.021.020.920.92
0.700.70
0.990.99
0.660.660.540.54
0.670.67 0.630.63 0.660.66 0.590.59 0.580.58 0.640.64 0.640.64
1.061.06
0.580.58 0.500.500.610.61 0.540.54
0.760.760.640.64
1.031.030.900.90
Investment corporation bonds (left axis) Debt (left axis) Average interest rate (%)
(Millions of yen)
Aug.2022
Feb.2023
Aug.2023
Feb.2024
Aug.2024
Feb.2025
Aug.2025
Feb.2026
Aug.2026
Feb.2027
Aug.2027
Feb.2028
Aug.2028
Feb.2029
Aug.2029
Feb.2030
Aug.2030
Feb.2031
3,600
3,200
3,300
3,400
3,500
3,100
3,000
0
2,900
Aug. 2021 FPDPU
(Forecast)
Decrease in asset management feesDecrease in interest expenses, etc.Absence of extraordinary loss, etc.
+10+3+5
Increase in taxes and public duesIncrease in depreciationDecrease in utility expenses paidOthers
-32-22+27
+1
3,330
3,288(13)
(95) (83)
3,288
-116 -26 18
DPU Increase factors Decrease factors Reversal of internal reserves
(Yen)
Feb. 2021 FPDPU
(Result)
Rental revenues Rental businessexpenses
Other expenses Aug. 2021 FPDPU
(Result)
Decrease in rent revenues and common area charges -92 Office -60 Retail -28 Logistics +6 Residential +6 Hotels -16
Acquisition of Landport Ome II +13Decrease in utility expenses received, etc. -11Increase in temporary rent reduction/exemption -26 Absence in 11th FP +34 12th FP -59 (of which, unreflected forecast -46)
(Millions of yen)
Ended Feb. 28, 2021 (11th FP)
Ended Aug. 31, 2021(12th FP)
Differences
Result (A) Result (B) (B) - (A)Operating Revenue 38,064 37,519 -545
Rental revenues 35,172 34,679 -493
Other rental revenues 2,892 2,839 -52Operating Expenses 22,693 22,777 84
Rental business expenses 15,973 16,097 123Repair expenses 1,510 1,531 20
Tax and public dues 3,110 3,263 153
Depreciation and amortization 5,482 5,586 103
Others 5,869 5,715 -154Loss on sales of real estate 6 ー -6Asset management fees 3,441 3,394 -47Amortization of goodwill 2,622 2,622 ーOther operating expenses 649 663 14
Operating Income 15,370 14,741 -629
Non-operating Revenues 2 4 1
Non-operating Expenses 2,324 2,310 -14Interest Expenses and other financial costs
2,312 2,297 -14
Other non-operating expenses 12 12 -0Ordinary Income 13,048 12,435 -613
Extraordinary Loss -31 ー 31
Net Income 13,016 12,434 -582(Net Income excluding realized gain)
(13,022) (12,434) (-588)
Distribution of Earnings a 13,018 12,433 -584
Distribution in Excess of Earnings b 2,682 3,069 386
Total Distributions a+b 15,701 15,503 -198
Internal Reserves -62 -447 -384
(Total Internal Reserves) (3,138) (2,691) (-447)
(Yen)DPU 3,330 3,288 -42
Distributions of earnings per unit 2,761 2,637 -124
Distributions in excess of retained earnings per unit [allowance for adjustment of temporary differences]
374 387 13
Distributions in excess of retained earnings per unit [other distributions in excess of earnings]
195 264 69
(Millions of yen)Total Assets 1,196,357 1,192,507 -3,850
Interest-bearing debt 517,841 517,798 -42
LTV 43.3% 43.4% 0.1%
Market capitalization 752,074 800,169 48,095
NOI 27,573 27,008 -565
FFO 21,167 20,651 -515
Revenues decreased due to COVID-19, but distributions were achieved as forecast as a result of external and internal growth, reversal of internal reserves, etc.
DPU for Aug. 2021 FP is ¥3,288, down ¥42 (-1.3%) from the Feb. 2021 FP results
Feb. 2020(9th FP)
Aug. 2020(10th FP)
Feb. 2021(11th FP)
Aug. 2021(12th FP)
Total interest-bearing debt
¥510,727 million ¥517,884 million ¥517,841 million ¥517,798 million
Average remaining duration
4.82 years 4.97 years 4.97 years 4.92 years
Average interest rate 0.82% 0.76% 0.74% 0.71%
Ratio of long-term debt 87.1% 88.2% 88.7% 89.4%
Ratio of fixed-rate debt 95.6% 95.7% 95.7% 95.7%
LTV 42.8% 43.2% 43.3% 43.4%
Credit Rating Agency Rating Description
Japan Credit Rating Agency, Ltd. (JCR) Long-term issuer rating: AA
Rating and Investment Information, Inc. (R&I) Issuer rating: AA-
Status of Interest-Bearing Debt (As of end of fiscal period)
Diversification of Repayment Dates (As of end of fiscal period)
Credit Ratings
Main Factors in Change of DPU (yen/unit)
Refinancing Overview (Note 2)
Total amount of refinancing
¥28,650 million
Average interest rate 0.49%
Average remaining duration
8.1 years
Scheduled Repayment (Note 3)
Total amount of repayment
¥30,025 million
Average interest rate 1.02%
Average remaining duration
6.6 years
Scheduled Repayment during February 2022 FPRefinancing during August 2021 FP
(Note1) Average remaining duration is it at the time of borrowing and average interest rate is weighted average interest rate at the time of repayment. Excluding ¥42.8 million in contractual repayment.
(Note2) Average interest rate and average remaining duration are those at the time of refinancing. (Note3) Average remaining duration is it at the time of borrowing and average interest rate is weighted average interest rate as of the end of August 2021. Excluding
¥42.8 million in contractual repayment.
Financing Status
Pursuing low interest rates and prolonged borrowing periods through refinancing.
Financial Statement Highlights
(Millions of yen)
Operating Revenue -545
Rental revenues -493
Rent and common area charges(of which, absence of rent reduction/exemption in 11th FP +159, rent reduction/exemption in 12th FP -280)
-556
Impact of acquisition 63
Other rental revenues -52
Increase in utility expenses received -217
Increase in cancellation penalty fee, etc. 165
Operating Expense 84
Rental Business Expenses 123
Decrease in utility expenses paid -129
Increase in depreciation 103
Increase in taxes and public dues 153
Increase in other expenses -3
Asset management fees/Other operating expenses -39
Non-operating Expenses -14
Interest Expenses and other financial costs -14
Extraordinary gain and loss 31
Absence of extraordinary loss in 11th FP 31
Net Income -582
Absence of 11th FP’s reversal of internal reserves -62
12th FP’s reversal of internal reserves(assuming earnings forecast announced April 2021)
393
(partial cover of temporary rent reduction/exemption for restaurant tenants) 53
Main Factors Accounting for Differences Between the 11th Results and the 12th Results
PortfolioManagement Strategy Investor InformationESG Measures Financial SectionMessage from the Management Financing Status
17 18Nomura Real Estate Master Fund, Inc. Nomura Real Estate Master Fund, Inc.

10.00
8.00
6.00
4.00
2.00
0.00
24,000
22,000
22,901
16,207
Aug.202120,93220,000
18,000
16,000
14,000
Aug.20216.31
9.43
2.49
’18 ’19’15’13’10 ’17’14’12’09’07 ’16’11’08 ’20 ’21’18 ’19’15’13’10 ’17’14’12’09’07 ’16’11’08 ’20 ’21
(%) (Yen/tsubo) Apr. May Jun. Jul.20%
-20%
0%
-40%
-60%
-80%
-100%
Feb. Mar.Jan.
Supermarkets Drugstores General merchandise stores (GMS)
Convenience stores Restaurants totalDepartment stores Pubs/izakaya
800
700
500
600
400
200
300
100
0
23,000
21,000
22,000
20,000
19,000
18,000
16,000
17,000
15,000
’18 ’19 ’20 ’21 ’22 ’23’17’16 ’24 ’25 1085 9742 631
New supply
Q2 ‘216.05%
Current peakQ1 ‘201.5%
Forecast
(Thousands of tsubo) Rent(Yen)
Vacancy Rate(%)
Previous peak Q2 ‘083.49%
PreviousbottomQ2 ‘129.43%
Q3 ‘013.24%
Q2 ‘038.57%
900,000
800,000
500,000
600,000
700,000
400,000
200,000
300,000
100,000
0
35
30
25
0.4%1.5%
20
15
5
10
0
’18 ’22’21’20’19’17’16 ’19 ’20 ’21 ’22 ’23 ’25’24
14
16
20
18
12
8
6
4
2
10
0
(%)
20.022.2
24.926.4
27.929.4
23.5
(Tsubo) (Trillions of yen)
ForecastForecast
Online retail sales revenue
New supply (left axis)
New demand (left axis)
Vacancy rate (right axis)
Vacancy rate (a year or more after completion) (right axis)
10,000 2,000
1,600
1,200
800
400
0
-400
4,000
6,000
8,000
2,000
0
-2,000
125
115
105
95
09Q1=100
’18 ’21’19’17’16 ’18 ’21’20 ’20’19’17’16
出所:マンション賃料インデックス(アットホーム・三井住友トラスト基礎研究所)よりNREAM作成
Single Type 18 m2 – 30 m2
Compact Type 30 m2 – 60 m2
Family Type 60 m2 – 100 m2
(People) (People)
Tokyo Osaka (right axis) Aichi (right axis) 2019 2021 2019 2021YoY change (right axis) 0
-20
-100
-80
-60
-40
-98.3%-98.3%-99.7-99.7 -99.6-99.6 -99.6-99.6 -99.6-99.6 -99.7-99.7 -98.3-98.3
(%)(Millions of people) (Millions of people)
4.0
3.2
1.6
2.4
0.8
0 0
10
20
30
40
50
60
Jan. Apr. May Jun. Jul.Mar.Feb. Jan. Apr. May Jun. Jul.Mar.Feb.
Market Review
Retail
Logistics
Office
Residential Hotels
Net Population Inflow (12-month moving average) Rental Condominium Rent Index (Tokyo’s 23 Wards)
Source: Prepared by NREAM based on data from Ministry of Internal Affairs and Communications
Source: Prepared by NREAM based on data from At Home Co., Ltd. and Sumitomo Mitsui Trust Research Institute Co., Ltd.
Supply of Office Buildings (Tokyo Central Five Wards) Rent and Vacancy Rate Matrix (Tokyo Central Five Wards)
Source: Prepared by NREAM based on data from Miki Shoji Co., Ltd.Source: Prepared by NREAM based on results of surveys by brokers, etc.
Vacancy Rate (Tokyo Central Five Wards) Average Monthly Rent (Tokyo Central Five Wards)
Source: Prepared by NREAM based on data from Miki Shoji Co., Ltd.Source: Prepared by NREAM based on data from Miki Shoji Co., Ltd.
Retail and Restaurant Sales Volume by Store Type Year-on-Year Change (2019 to 2021)
Source: Prepared by NREAM based on data from the Ministry of Economy, Trade and Industry and various organizations in the respective industriesNote: The figures represent change from the same month in 2019 in nationwide sales, partially including preliminary figures. Drugstores, restaurants total, and pubs/izakaya are
on an all-shops basis. All others are on an existing-shop basis.
Japanese Ecommerce (B2C) MarketLarge-Scale Rental Logistics Facility Supply and Demand in the Tokyo Metropolitan Area as of June 30, 2021
Source: Prepared by NREAM based on data from “IT Navigator 2021 published by Nomura Research Institute, Ltd.
*”Years” show fiscal years
Source: Prepared by NREAM based on data from CBRE
Total Number of Overnight Guests Year-on-Year Comparison of 2019 and 2021 (Nationwide, including foreign visitors)
Foreign Visitor Arrivals Year-on-Year Comparison of 2019 and 2021
Source: Prepared by NREAM based on data from JNTONote: Preliminary figures are included.
Source: Prepared by NREAM based on data from the Japan Tourism AgencyNote: Preliminary figures are included.
PortfolioManagement Strategy Investor InformationESG Measures Financial SectionMessage from the Management Financing Status
19 20Nomura Real Estate Master Fund, Inc. Nomura Real Estate Master Fund, Inc.

Others
Sapporo City
Tochigi
Chiba
Tokyo
Kanagawa
Saitama
Sendai City
Nagoya City
Kyoto
Osaka
HyogoHiroshima City
Naha City
Fukuoka City1 Property2,650
5 Properties2,477
2 Properties6,440
2 Properties6,580
1 Property2,280
1 Property18,300
1 Property3,460
5 Properties46,375
4 Properties25,650
3 Properties8,997
5 Properties7,645
2 Properties4,520
3 Properties7,400
5 Properties3,942
1 Property2,030
1 Property8,500
2 Properties10,390
12 Properties10,267
1 Property3,600
1 Property1,580
4 Properties5,830
7 Properties48,310
5 Properties37,9909 Properties
33,960
3 Properties15,910 9 Properties
13,471
1 Property3,080
1 Property4,900
7 Properties4,632
4 Properties49,972
5 Properties61,450
26 Properties68,718 108 Properties
149,036
51 Properties385,745
1 Property2,320
Diversification by location
(based on acquisition price)
Diversification by property type
(based on acquisition price)
Diversification by use
(based on acquisition price)
Diversification by tenant
(based on leased area)
Other Area
17.2%
Other
77.8%289 Properties
Tokyo Area
82.8%
Top Ten Properties as a Percentage of Portfolio
22.2%
Top Ten Tenantsas a Percentage of Portfolio
29.6%
Other
70.4%
Office Buildings
44.3%
Hotels
0.6%
Other
0.5%
Residential Facilities
18.9%
Logistics Facilities
18.8%
Retail Facilities(near stations)
11.4%
Retail Facilities(Residential areas)
5.5%
■ Office 54 Properties
■ Retail 40 Properties
■ Logistics 21 Properties
■ Residential 125 Properties
■ Other 1 Property
■ Office 14 Properties
■ Retail 11 Properties
■ Logistics 1 Property
■ Residential 30 Properties
■ Hotels 2 Properties
Total 241 Properties Total 58 Properties
Tokyo Area Other Areas
Other
Office
Retail
Logistics
Residential
Hotels
Others
299 properties 98.1%¥1,068,409 million
NUMBER OF PROPERTIES OCCUPANCY RATEASSET SIZE
Portfolio Analysis (As of Aug. 31, 2021)
(Note) In the diversification by tenant, the leased areas of properties under pass-through master lease agreements are calculated based on the leased areas of end tenants.
Portfolio Distribution (Property locations in Japan, millions of yen)
For a detailed list of properties in our portfolio, visit the website below.
https://www.nre-mf.co.jp/en/portfolio/index.html
Financing StatusManagement Strategy Investor InformationESG Measures Financial SectionMessage from the Management Portfolio
21 22Nomura Real Estate Master Fund, Inc. Nomura Real Estate Master Fund, Inc.
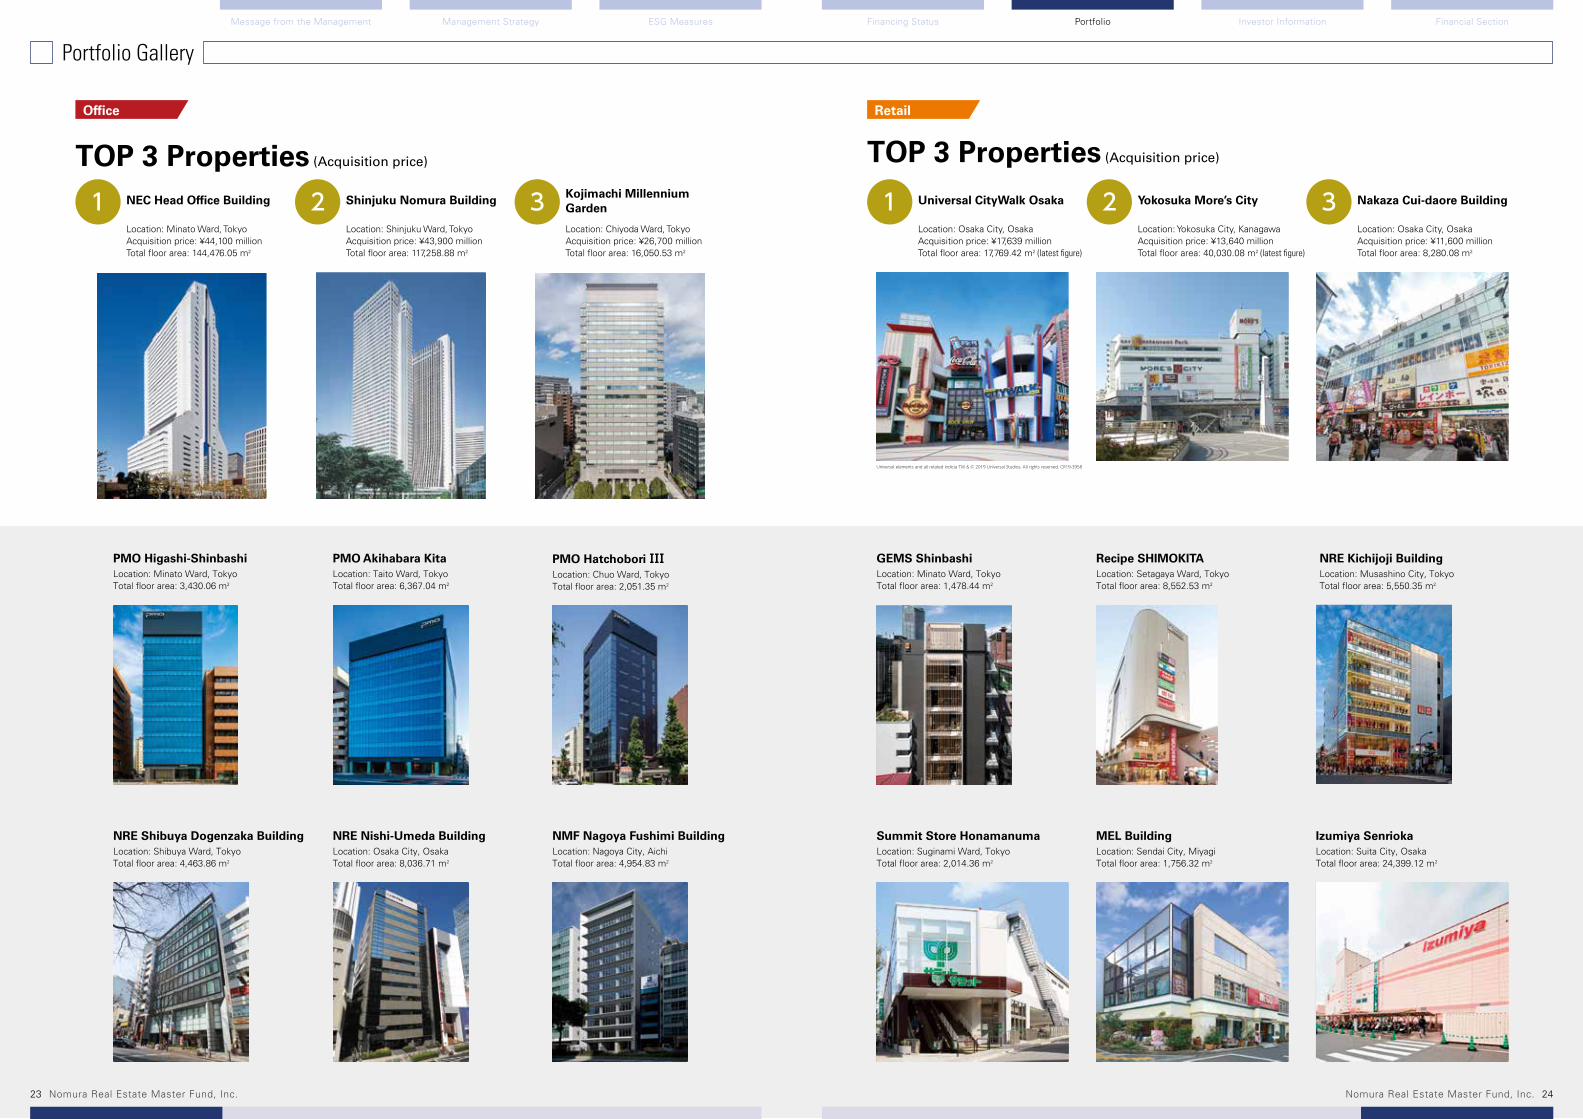
TOP 3 Properties (Acquisition price)
3 32 21 1
メルビル
Office
Universal elements and all related indicia TM & © 2019 Universal Studios. All rights reserved. CR19-3958
NEC Head Office Building
Location: Minato Ward, TokyoAcquisition price: ¥44,100 millionTotal floor area: 144,476.05 m2
Shinjuku Nomura Building
Location: Shinjuku Ward, TokyoAcquisition price: ¥43,900 millionTotal floor area: 117,258.88 m2
Kojimachi Millennium Garden
Location: Chiyoda Ward, TokyoAcquisition price: ¥26,700 millionTotal floor area: 16,050.53 m2
TOP 3 Properties (Acquisition price)
Retail
Nakaza Cui-daore Building
Location: Osaka City, OsakaAcquisition price: ¥11,600 millionTotal floor area: 8,280.08 m2
Universal CityWalk Osaka
Location: Osaka City, OsakaAcquisition price: ¥17,639 millionTotal floor area: 17,769.42 m2 (latest figure)
Yokosuka More’s City
Location: Yokosuka City, KanagawaAcquisition price: ¥13,640 millionTotal floor area: 40,030.08 m2 (latest figure)
GEMS ShinbashiLocation: Minato Ward, TokyoTotal floor area: 1,478.44 m2
PMO Higashi-ShinbashiLocation: Minato Ward, TokyoTotal floor area: 3,430.06 m2
NRE Shibuya Dogenzaka BuildingLocation: Shibuya Ward, TokyoTotal floor area: 4,463.86 m2
NRE Nishi-Umeda BuildingLocation: Osaka City, OsakaTotal floor area: 8,036.71 m2
NMF Nagoya Fushimi BuildingLocation: Nagoya City, AichiTotal floor area: 4,954.83 m2
PMO Akihabara KitaLocation: Taito Ward, TokyoTotal floor area: 6,367.04 m2
PMO Hatchobori ⅠⅠⅠLocation: Chuo Ward, TokyoTotal floor area: 2,051.35 m2
Summit Store HonamanumaLocation: Suginami Ward, TokyoTotal floor area: 2,014.36 m2
MEL BuildingLocation: Sendai City, MiyagiTotal floor area: 1,756.32 m2
Izumiya SenriokaLocation: Suita City, OsakaTotal floor area: 24,399.12 m2
Recipe SHIMOKITALocation: Setagaya Ward, TokyoTotal floor area: 8,552.53 m2
NRE Kichijoji BuildingLocation: Musashino City, TokyoTotal floor area: 5,550.35 m2
Portfolio Gallery
Financing StatusManagement Strategy Investor InformationESG Measures Financial SectionMessage from the Management Portfolio
23 24Nomura Real Estate Master Fund, Inc. Nomura Real Estate Master Fund, Inc.

TOP 3 Properties (Acquisition price) TOP 3 Properties (Acquisition price)
32 2 31 1
ResidentialLogistics
Landport Urayasu
Location: Urayasu City, ChibaAcquisition price: ¥17,400 millionTotal floor area: 71,570.64 m2
Landport Itabashi
Location: Itabashi Ward, TokyoAcquisition price: ¥15,710 millionTotal floor area: 53,561.44 m2
Landport Ome ⅠⅠ
Location: Ome City, Tokyo Acquisition price: ¥14,620 million Total floor area: 63,879.98 m2
Landport Ome ⅠLocation: Ome City, Tokyo Total floor area: 57,721.34 m2
Landport Higashi-NarashinoLocation: Narashino City, ChibaTotal floor area: 61,573.49 m2
Hanyu Logistics CenterLocation: Hanyu City, SaitamaTotal floor area: 24,888.67 m2
Atsugi Minami Logistics Center A TowerLocation: Atsugi City, KanagawaTotal floor area: 9,788.62 m2
Hirakata Kuzuha Logistics CenterLocation: Hirakata City, OsakaTotal floor area: 19,628.03 m2
Landport IwatsukiLocation: Saitama City, SaitamaTotal floor area: 24,177.15 m2
PROUD FLAT Shibuya TomigayaLocation: Shibuya Ward, TokyoTotal floor area: 5,079.46 m2
PRIME URBAN Meguro Ohashi HillsLocation: Meguro Ward, TokyoTotal floor area: 3,658.54 m2
PRIME URBAN Sapporo RiverfrontLocation: Sapporo City, HokkaidoTotal floor area: 21,239.84 m2
PRIME URBAN IzumiLocation: Nagoya City, AichiTotal floor area: 9,636.50 m2
PROUD FLAT Asakusabashi ⅠⅠⅠLocation: Taito Ward, Tokyo
Total floor area: 1,575.38 m2
PROUD FLAT Shirokane TakanawaLocation: Minato Ward, Tokyo
Total floor area: 3,620.46 m2
Serenite Shinsaibashi Grande
Location: Osaka City, OsakaAcquisition price: ¥5,567 millionTotal floor area: 7,794.23 m2
Fukasawa House Towers H&I
Location: Setagaya Ward, TokyoAcquisition price: ¥7,140 millionTotal floor area: 12,135.36 m2
PRIME URBAN Toyosu
Location: Koto Ward, TokyoAcquisition price: ¥5,290 millionTotal floor area: 9,630.96 m2
Portfolio Gallery
Financing StatusManagement Strategy Investor InformationESG Measures Financial SectionMessage from the Management Portfolio
25 26Nomura Real Estate Master Fund, Inc. Nomura Real Estate Master Fund, Inc.

※記載の数値は、イメージを示すために例示したものです。
Reserve
利益超過分配
売却益
売却益
売却益
売却益相当額の留保
売却益は分配し、利益超過分配にて調整
10
10
10
80
当期利益(損益計算書)
分配方針 分配金の内訳
売却益を除く
売却益を除く
売却益を除く
10
10
80
20
80Net
incomeNet
income 当期利益
当期利益
当期利益
Totaldistribution
Net income(Statement of income)
のれん償却費Distributions in
excess of earnings
Distribution ofearnings
About distribution in excess of earnings
Amortizationof goodwill
12,434
2,622 2,622 3,069 3,069
12,434 12,434
447
12,433 12,433
1,824(fractional adjustment)
1,244
Distributions of earnings¥12,433 million(¥2,637/unit)
Distributions in excess of earnings¥3,069 million(¥651/unit)
1,825(Note 2)
Total distribution¥15,503 million(¥3,288/unit)
Distributions of earnings, etc.(Income tax withheld)¥14,258 million(¥3,024/unit)
Other distributions in excess of earnings(Income tax not withheld)¥1,244 million(¥264/unit)
Reversal of internal reservesCompensation for some of the declinein sales caused by COVID-19 infection
Amortization of goodwill
Total distribution(Before adjustment
of fractions less than one unit)
Total distribution(After adjustment of fractions less than one unit)
Net income
Distributionpolicy
Net income(Statement of
income)
Distribution of allowance for temporary difference adjustments
Other distributions in excess of earnings
Distributions in excess of earnings
(breakdown)
Allowance for temporary difference
adjustments
(Millions of yen)
Net income + amortization of goodwill
Basic Distribution Policy
Distributions in Excess of Earnings in the 12th Fiscal Period
Structure of NMF
Organization of NREAM
Distribution Policy for Periods with Gain on Sales
Statutory Auditors Board of Directors
President & CEO
General Meeting of Shareholders
NPR Valuation Committee
Risk Management Committee
Compliance Committee
Investment Committee
Project Screening Committee
Chief Strategy Officer
Private Fund Management
Investment Management Planning
NMF Investment Management Group
Fund Management
Asset Management I
Asset Management II
NPR Investment Management
Corporate Planning
International Business Planning
Legal & Compliance
Internal Audit
Finance & Accounting
Client Relations & Marketing
Acquisitions
Structure and OrganizationDistribution Policy
Specified Related Party
Parent Company of the Asset Management Company
Nomura Real Estate Holdings, Inc.
Nomura Real Estate Development Co., Ltd.
Asset Management Company
Nomura Real Estate Asset Management Co., Ltd.
Leasing Value Chain
Nomura Real Estate Development Co., Ltd.
Nomura Real Estate Partners Co., Ltd.
Nomura Real Estate Retail Properties Co., Ltd.
Information Provider
Nomura Real Estate Development Co., Ltd.
Custodian
Sumitomo Mitsui Trust Bank, Ltd.
Asset Custody Agreement
Asset Management Agreement
General Administrator (Institutional Administration /
Accounting)Transfer Agent and
Special Account Administrator
Mitsubishi UFJ Trust and Banking Corporation
Transfer Agency Agreement, General Administration AgreementAgreement on Special Account Management
Information Provision Agreement
Basic Agreement with respect to Leasing Value Chain
Financial Agent Agreement
Investment Corporation
Auditor
Ernst & Young Shin Nihon LLC
Board of Directors
Executive Director
Shuhei Yoshida
Supervisory Directors
Mineo Uchiyama
Koichi Owada
Mika Okada
Unitholders' Meeting
General Administrator (Financial Agent)
MUFG Bank, Ltd. Sumitomo Mitsui Banking Corporation
(Note 1) When there is a gain on sales, NMF’s policy is, in principle, to set aside an amount equivalent to the gain that is not more than the amount of amortization of goodwill as retained earnings within the scope that will not be subject to income tax.
(Note 2) The amount is obtained by deducting underdepreciation, etc. (provision deduction items) attributable to the difference between depreciation in tax and accounting treatments from amortization of goodwill, etc. (provision addition items).
Net income(Statement of income)
Totaldistribution
Netincome
Netincome
Amortization of goodwill
Distributions in excess of earnings
Distribution ofearnings
Distributions in excess of earnings may be adjusted to retain cash of an amount equivalent to gain on sale of real estate to promote stable medium- to long-term management. (Note 1)
Netincome
excl.gain onsales
Reserve
Distribution in excess of earnings
Gain on sales
Gain on sales
Gain on sales
Internal reserves equivalent to gain on sale
Gain on sales is distributed, and a corresponding amount is deducted from distributions in excess of earnings
10
10
10
80
Amortization of goodwill
Net income(Statement of income)
Distribution policy
Breakdown ofdistributions
Netincome
excl.gain onsales
Netincome
excl.gain onsales
10
10
80
20
80
*Figures shown above are for illustrative purposes only
Financing Status PortfolioManagement Strategy ESG Measures Financial SectionMessage from the Management Investor Information
27 28Nomura Real Estate Master Fund, Inc. Nomura Real Estate Master Fund, Inc.
12月
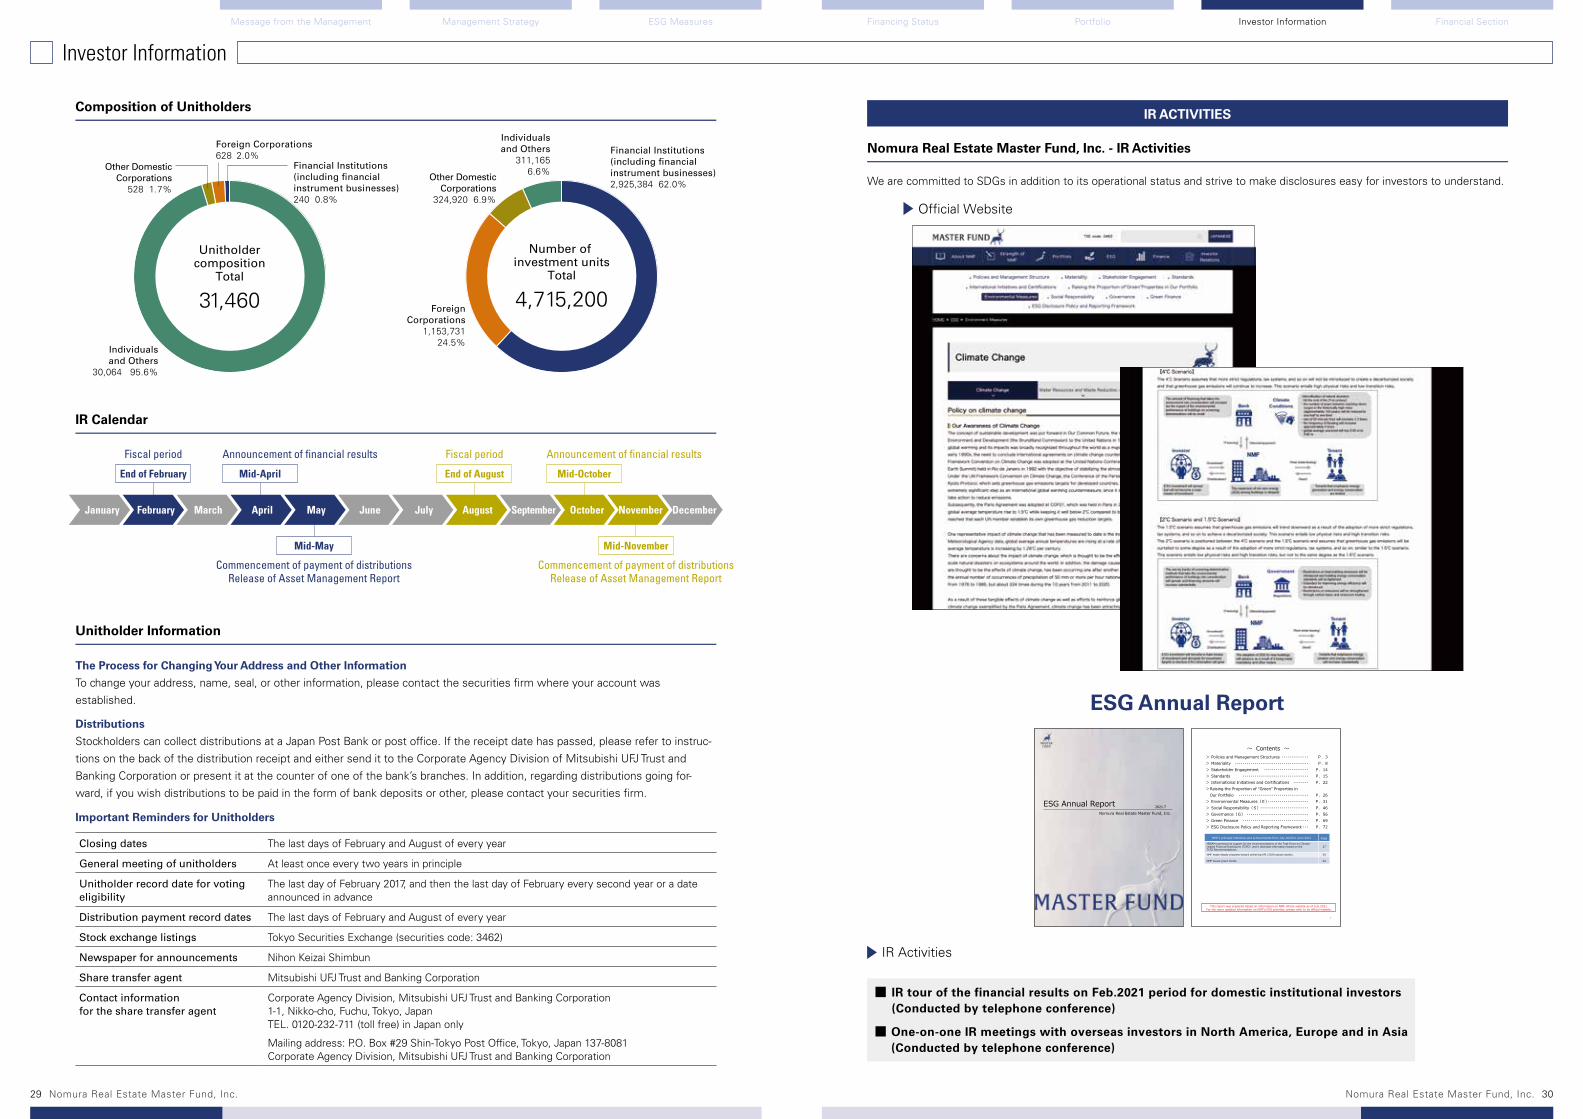
We are committed to SDGs in addition to its operational status and strive to make disclosures easy for investors to understand.
Number of investment units
Total
4,715,200
Unitholdercomposition
Total
31,460
Financial Institutions(including financialinstrument businesses)2,925,384 62.0%
Financial Institutions(including financialinstrument businesses)240 0.8%
ForeignCorporations
1,153,73124.5%
Foreign Corporations628 2.0%
Other DomesticCorporations
324,920 6.9%
Other DomesticCorporations
528 1.7%
Individualsand Others
311,1656.6%
Individualsand Others
30,064 95.6%
Composition of Unitholders
Nomura Real Estate Master Fund, Inc. - IR Activities
Official Website
IR ACTIVITIES
2021.7
~ ~>>>>>>Raising the Proportion of “Green” Properties in
> (E)> (S)> (G)>>
P.P.
P.P.P.
P.P.P.P.P.P.
・・・・・・・・・・・・・・・・・・・・・・・・・・・・・・・・・・・・・・・・・・・・・・・・・・・・
・・・・・・・・・・・・・・・・・・・・・・・・・・・・・・・・・・・・・・・・・・・・・・・・・・・・・・・・・
・・・・・・・・
・・・・・・・・・・・・・・・・・・・・・・・・・・・・・・・・・・・・・・・・・・・・・・・・・・・・・・・・・
・・・・・・・・・・・・・・・・・・・・・・・・・・・・・・・・・・・・・・・・・・・・・・・・・・・・・・・・・
・・・・・・・・・・・・・・・・・・・・・・・・・・・・・・・・・・・・・
NMF’s principal
2
For the more updated information on NMF’s ESG activities, please refer to its official website.
ESG Annual Report
Important Reminders for Unitholders
Unitholder Information
The Process for Changing Your Address and Other Information
To change your address, name, seal, or other information, please contact the securities firm where your account was
established.
Distributions
Stockholders can collect distributions at a Japan Post Bank or post office. If the receipt date has passed, please refer to instruc-
tions on the back of the distribution receipt and either send it to the Corporate Agency Division of Mitsubishi UFJ Trust and
Banking Corporation or present it at the counter of one of the bank’s branches. In addition, regarding distributions going for-
ward, if you wish distributions to be paid in the form of bank deposits or other, please contact your securities firm.
Closing dates The last days of February and August of every year
General meeting of unitholders At least once every two years in principle
Unitholder record date for voting eligibility
The last day of February 2017, and then the last day of February every second year or a date announced in advance
Distribution payment record dates The last days of February and August of every year
Stock exchange listings Tokyo Securities Exchange (securities code: 3462)
Newspaper for announcements Nihon Keizai Shimbun
Share transfer agent Mitsubishi UFJ Trust and Banking Corporation
Contact information for the share transfer agent
Corporate Agency Division, Mitsubishi UFJ Trust and Banking Corporation 1-1, Nikko-cho, Fuchu, Tokyo, JapanTEL. 0120-232-711 (toll free) in Japan only
Mailing address: P.O. Box #29 Shin-Tokyo Post Office, Tokyo, Japan 137-8081 Corporate Agency Division, Mitsubishi UFJ Trust and Banking Corporation
End of February
Fiscal period
Mid-April
Announcement of financial results
End of August
Fiscal period
Mid-October
Announcement of financial results
Mid-May
Commencement of payment of distributionsRelease of Asset Management Report
Mid-November
Commencement of payment of distributionsRelease of Asset Management Report
January DecemberMay August OctoberFebruary June NovemberMarch July SeptemberApril
IR Calendar
Investor Information
■ IR tour of the financial results on Feb.2021 period for domestic institutional investors (Conducted by telephone conference)
■ One-on-one IR meetings with overseas investors in North America, Europe and in Asia (Conducted by telephone conference)
IR Activities
Financing Status PortfolioManagement Strategy ESG Measures Financial SectionMessage from the Management Investor Information
29 30Nomura Real Estate Master Fund, Inc. Nomura Real Estate Master Fund, Inc.

Financing Status PortfolioManagement Strategy Investor InformationESG Measures Financial SectionMessage from the Management
31 32Nomura Real Estate Master Fund, Inc. Nomura Real Estate Master Fund, Inc.
BALANCE SHEET
Thousands of Yen
As of February 28, 2021 As of August 31, 2021
ASSETS
Current Assets:
Cash and bank deposits 63,840,679 63,111,539 Rental receivables 848,941 722,315 Other current assets 1,368,039 1,282,492Total current assets 66,057,659 65,116,347
Property and Equipment:
Land 733,890,292 736,068,822 Buildings and structures 360,001,455 362,880,018 Machinery and equipment 1,868,183 2,017,603 Tools, furniture and fixtures 1,573,678 1,658,047 Leased assets 4,752 4,752 Construction in progress 56,913 124,467 Subtotal 1,097,395,275 1,102,753,711 Less accumulated depreciation (57,435,192) (63,009,077)Net property and equipment 1,039,960,082 1,039,744,634
Investments and Other Assets:
Goodwill 77,720,251 75,098,009 Leasehold rights 8,957,761 8,957,374 Intangible assets 60,632 51,714 Long-term prepaid expenses 1,976,031 1,979,162 Long-term deposits 542,235 478,665 Security deposits 925,784 925,784 Derivative assets — 6,336 Deferred investment corporation bond issuance costs 157,524 149,540Total investments and other assets 90,340,222 87,646,588Total Assets 1,196,357,965 1,192,507,570
The accompanying notes to financial statements are an integral part of these statements.
Thousands of Yen
As of February 28, 2021 As of August 31, 2021
LIABILITIES
Current Liabilities:
Trade accounts payable 2,482,387 2,588,017 Current portion of long-term debt 58,760,600 55,090,600 Lease obligations 871 871 Other accounts payable 3,432,497 2,763,065 Accrued expenses 314,504 357,458 Accrued income taxes 1,028 1,125 Accrued consumption taxes 552,992 957,285 Rent received in advance 5,641,129 5,655,117 Unearned revenue 94,952 60,233 Provision for loss on disaster 31,000 30,450 Derivatives liabilities 106,143 61,671 Other current liabilities 18,807 11,188Total current liabilities 71,436,916 67,577,084
Long-term Liabilities:
Investment corporation bonds 32,000,000 32,000,000 Long-term debt 427,081,000 430,708,200 Lease obligations 2,904 2,468 Long-term advances received 34,401 14,854 Security deposits from tenants 42,542,701 42,161,565 Derivatives liabilities 245,210 141,998Total long-term liabilities 501,906,216 505,029,087
Total Liabilities 573,343,133 572,606,171
NET ASSETS
Unitholders’ Equity:
Unitholders’ capital 244,606,999 244,739,887 Surplus Capital surplus 394,012,959 394,012,959 Allowance for temporary difference adjustment (14,994,380) (16,624,976) Other deductions from capital surplus (13,763,038) (14,815,391) Total deductions from capital surplus (28,757,419) (31,440,368) Net capital surplus 365,255,539 362,572,590 Retained earnings 13,503,646 12,786,253 Total surplus 378,759,186 375,358,843Total unitholders’ equity 623,366,185 620,098,731
Valuation and Translation Adjustments:
Deferred gains or losses on hedges (351,354) (197,332)Total valuation and translation adjustments (351,354) (197,332)
Total Net Assets 623,014,831 619,901,398
Total Liabilities and Net Assets 1,196,357,965 1,192,507,570
The accompanying notes to financial statements are an integral part of these statements.

Financing Status PortfolioManagement Strategy Investor InformationESG Measures Financial SectionMessage from the Management
33 34Nomura Real Estate Master Fund, Inc. Nomura Real Estate Master Fund, Inc.
STATEMENT OF INCOME AND RETAINED EARNINGS
Thousands of Yen
For the periodfrom September 1, 2020
to February 28, 2021
For the periodfrom March 1, 2021to August 31, 2021
OPERATING REVENUES AND EXPENSES
Operating Revenues: Real estate rental revenues 38,064,606 37,519,267
38,064,606 37,519,267Operating Expenses: Real estate rental expenses 15,973,489 16,097,387 Asset management fees 3,441,901 3,394,277 Loss on sale of real estate 6,245 — Asset custody fees 57,100 57,154 Administrative service fees 173,243 178,250 Amortization of goodwill 2,622,242 2,622,242 Other operating expenses 419,470 428,539
22,693,693 22,777,851 Operating Income 15,370,912 14,741,415
NON-OPERATING REVENUES AND EXPENSES
Non-Operating Revenues: Interest income 326 328 Reversal of dividends payable 2,170 3,024 Interest on refund 230 — Other non-operating revenues 4 1,142
2,732 4,494Non-Operating Expenses: Interest expense 1,716,238 1,677,807 Interest expenses on investment corporation bonds 170,802 173,528 Amortization of investment corporation bonds issuance costs 7,984 7,984 Loan arrangement fees 425,105 446,432 Other non-operating expenses 4,824 4,824
2,324,955 2,310,577
Ordinary Income 13,048,689 12,435,333
Extraordinary Losses: Loss on disaster 31,000 —
31,000 — Income before Income Taxes 13,017,689 12,435,333
Income Taxes: Current 1,078 1,171
1,078 1,171 Net Income 13,016,610 12,434,161
Retained earnings brought forward 487,036 352,091
Retained Earnings at End of Period 13,503,646 12,786,253
The accompanying notes to financial statements are an integral part of these statements.
STATEMENT OF CHANGES IN NET ASSETS
For the period from September 1, 2020 to February 28, 2021 Thousands of Yen
Unitholders’ EquitySurplus
Capital surplusDeductions from capital surplus
UnitsUnitholders’
capitalCapital surplus
Allowance for temporary difference adjustment
Other deductions from capital surplus
Total deductions from capital surplus
Net capital surplus
Balance as of September 1, 2020 4, 715,200 244,307,911 394,012,959 (13,515,837) (12,398,315) (25,914,153) 368,098,805Distributions of retained earnings — — — — — — —Reversal of allowance for temporary difference
adjustments — 299,087 — 299,087 (299,087) — —Distributions in excess of net earnings from
allowance for temporary difference adjustments — — — (1,777,630) — (1,777,630) (1,777,630) Other distributions in excess of net earnings — — — — (1,065,635) (1,065,635) (1,065,635)Net income — — — — — — —Net changes of items other than unitholders' equity — — — — — — —Total changes of items during the period — 299,087 — (1,478,542) (1,364,723) (2,843,265) (2,843,265)
Balance as of February 28, 2021 4, 715,200 244,606,999 394,012,959 (14,994,380) (13,763,038) (28,757,419) 365,255,539
Thousands of YenUnitholders’ Equity Valuation and Translation Adjustments
Surplus Total unitholders’
equityDeferred gains or losses on hedges
Total valuation and translation
adjustmentsRetained earnings Total surplus Total net assetsBalance as of September 1, 2020 13,583,176 381,681,981 625,989,893 (484,242) (484,242) 625,505,650
Distributions of retained earnings (12,797,052) (12,797,052) (12,797,052) — — (12,797,052)Reversal of allowance for temporary difference
adjustments (299,087) (299,087) — — — —Distributions in excess of net earnings from
allowance for temporary difference adjustments — (1,777,630) (1,777,630) — — (1,777,630)Other distributions in excess of net earnings — (1,065,635) (1,065,635) — — (1,065,635)Net income 13,016,610 13,016,610 13,016,610 — — 13,016,610Net changes of items other than unitholders' equity — — — 132,888 132,888 132,888Total changes of items during the period (79,529) (2,922,795) (2,623,707) 132,888 132,888 (2,490,819)
Balance as of February 28, 2021 13,503,646 378,759,186 623,366,185 (351,354) (351,354) 623,014,831The accompanying notes to financial statements are an integral part of these statements.
For the period from March 1, 2021 to August 31, 2021 Thousands of Yen
Unitholders’ EquitySurplus
Capital surplusDeductions from capital surplus
UnitsUnitholders’
capitalCapitalsurplus
Allowance for temporary difference adjustment
Other deductions from capital surplus
Total deductions from capital surplus
Net capital surplus
Balance as of March 1, 2021 4,715,200 244,606,999 394,012,959 (14,994,380) (13,763,038) (28,757,419) 365,255,539Distributions of retained earnings — — — — — — —Reversal of allowance for temporary difference
adjustments — 132,888 — 132,888 (132,888) — —Distributions in excess of net earnings from
allowance for temporary difference adjustments — — — (1,763,484) — (1,763,484) (1,763,484) Other distributions in excess of net earnings — — — — (919,464) (919,464) (919,464)Net income — — — — — — —Net changes of items other than unitholders’ equity — — — — — — —Total changes of items during the period — 132,888 — (1,630,596) (1,052,352) (2,682,948) (2,682,948)
Balance as of August 31, 2021 4,715,200 244,739,887 394,012,959 (16,624,976) (14,815,391) (31,440,368) 362,572,590
Thousands of YenUnitholders’ Equity Valuation and Translation Adjustments
Surplus Total unitholders’
equityDeferred gains or losses on hedges
Total valuation and translation
adjustmentsRetained earnings Total surplus Total net assetsBalance as of March 1, 2021 13,503,646 378,759,186 623,366,185 (351,354) (351,354) 623,014,831
Distributions of retained earnings (13,018,667) (13,018,667) (13,018,667) — — (13,018,667)Reversal of allowance for temporary difference
adjustments (132,888) (132,888) — — — —Distributions in excess of net earnings from
allowance for temporary difference adjustments — (1,763,484) (1,763,484) — — (1,763,484)Other distributions in excess of net earnings — (919,464) (919,464) — — (919,464)Net income 12,434,161 12,434,161 12,434,161 — — 12,434,161Net changes of items other than unitholders’ equity — — — 154,021 154,021 154,021Total changes of items during the period (717,393) (3,400,342) (3,267,454) 154,021 154,021 (3,113,432)
Balance as of August 31, 2021 12,786,253 375,358,843 620,098,731 (197,332) (197,332) 619,901,398The accompanying notes to financial statements are an integral part of these statements.

Financing Status PortfolioManagement Strategy Investor InformationESG Measures Financial SectionMessage from the Management
35 36Nomura Real Estate Master Fund, Inc. Nomura Real Estate Master Fund, Inc.
STATEMENT OF CASH FLOWS
Thousands of Yen
For the periodfrom September 1, 2020
to February 28, 2021
For the periodfrom March 1, 2021to August 31, 2021
CASH FLOWS
Cash Flows from Operating Activities Income before income taxes 13,017,689 12,435,333 Depreciation 5,483,396 5,587,125 Amortization of goodwill 2,622,242 2,622,242 Amortization of investment corporation bonds issuance costs 7,984 7,984 Increase (Decrease) in provision for loss on disaster 27,189 (550) Interest income (326) (328) Interest expense 1,887,041 1,851,336 Loss on disposal of property and equipment 8,416 15,436 Decrease (Increase) in rental receivables 210,746 97,507 Decrease (Increase) in long-term prepaid expenses 113,980 (3,130) Decrease (Increase) in long-term deposits (14,761) 63,569 Increase (Decrease) in trade accounts payable (54,472) 105,630 Increase (Decrease) in other accounts payable 74,558 (108,257) Increase (Decrease) in accrued consumption taxes 418,287 404,292 Increase (Decrease) in rent received in advance 56,967 13,987 Decrease in property and equipment in trust due to sales 37,695 — Other 131,321 32,912 Subtotal 24,027,957 23,125,092 Interest received 326 328 Interest paid (1,967,252) (1,862,616) Income taxes paid (3,824) (1,074) Net cash provided by (used in) operating activities 22,057,206 21,261,729
Cash Flows from Investing Activities Payments for purchases of property and equipment (18,027,237) (5,922,923) Payments for purchases of leasehold rights and intangible assets (12,390) (17,636) Reimbursement of security deposits to tenants (980,430) (1,594,948) Proceeds from security deposits from tenants 1,307,669 1,284,481 Payments from security deposits (52) — Proceeds from security deposits 10,720 — Net cash provided by (used in) investing activities (17,701,720) (6,251,026)
Cash Flows from Financing Activities Proceeds from long-term debt 32,400,000 28,650,000 Repayments of long-term debt (32,442,800) (28,692,800) Distributions to unitholders (12,795,769) (13,014,277) D istributions in excess of net earnings from allowance for
temporary difference adjustments(1,777,350) (1,763,205)
Other distributions in excess of net earnings (1,065,245) (919,559) Net cash provided by (used in) financing activities (15,681,165) (15,739,842)
Net Increase (Decrease) in Cash and Cash Equivalents (11,325,679) (729,140)Cash and Cash Equivalents at Beginning of Period 75,166,359 63,840,679Cash and Cash Equivalents at End of Period 63,840,679 63,111,539
The accompanying notes to financial statements are an integral part of these statements.
NOTES TO FINANCIAL STATEMENTS
1. ORGANIZATIONNomura Real Estate Master Fund, Inc. (NMF) is a real estate investment corporation formed to own and invest primarily in office buildings, retail facilities, logistics and residential facilities. NMF is externally managed by a licensed asset management company, Nomura Real Estate Asset Management Co., Ltd. (“NREAM”). NREAM is a wholly-owned subsidiary of Nomura Real Estate Holdings, Inc. NMF was established on October 1, 2015 through the consolidation type merger involving the former Nomura Real Estate Master Fund, Inc. (hereinafter the “former NMF”), Nomura Real Estate Office Fund, Inc. (hereinafter “NOF”) and Nomura Real Estate Residential Fund, Inc. (hereinafter “NRF”), and listed its investment securities (TSE code: 3462) on the Real Estate Investment Trust Section of the Tokyo Stock Exchange on October 2 of the same year.
NMF adopts the basic policy of investing primarily in real estate and other assets to secure stable income and steady growth of assets under management over the medium to long term. In order to realize this basic policy, NMF adopts an investment strategy that centers on the Greater Tokyo area (Tokyo, Kanagawa, Chiba and Saitama prefectures), which has strong tenant demand, while also considering regional diversification through the three major metropolitan areas and cabinet-order desig-nated cities, etc. By combining the “diversified type strategy” in which investments are made in facilities of a variety of sectors such as office buildings, retail facilities, logistics and residential facilities with the “large-scale REIT strategy,” which pursues the effects of diversifying properties and tenants, to make the portfolio more stable as well as with the utilization of the “leasing value chain” with the Nomura Real Estate Group, the sponsor, NMF will aim to increase unitholder value by securing stable income and steady growth of assets under management over the medium to long term.
2. BASIS OF PRESENTATIONNMF maintains its accounting records and prepares its financial statements in accordance with accounting principles generally accepted in Japan (“Japanese GAAP”), including provisions set forth in the Investment Trust Act of Japan, the Companies Act of Japan, the Financial Instruments and Exchange Act of Japan and related regulations, which are different in certain respects as to the application and disclosure requirements of International Financial Reporting Standards.
The accompanying financial statements are a translation of the audited financial statements of NMF, which were prepared in accordance with Japanese GAAP and were presented in NMF’s Securities Report filed with the Kanto Local Finance Bureau. In preparing the accompanying financial statements, certain reclassifications and modifications have been made to the financial statements issued domestically in order to present them in a format that is more familiar to readers outside Japan. In addition, the notes to financial statements include certain information that might not be required under Japanese GAAP but is presented herein as additional information. Amounts have been rounded to the nearest thousand yen in the accompanying financial state-ments and the notes thereto, whereas amounts were truncated in the Japanese financial statements prepared in accordance with Japanese GAAP.
NMF’s fiscal period is a six-month period which ends at the end of February or August. NMF does not prepare consolidated financial statements because it has no subsidiaries.
3. SUMMARY OF SIGNIFICANT ACCOUNTING POLICIESCash and cash equivalentsCash and cash equivalents consist of cash on hand, deposits placed with banks and short-term investments that are highly liquid, readily convertible to cash, with an insignificant risk of market value fluctuation, and with a maturity of three months or less when purchased.
Property and equipmentProperty and equipment are stated at cost, which includes the purchase price and related costs for acquisition, less accumu-lated depreciation.
Depreciation is calculated by the straight-line method over the estimated useful lives of the fixed assets outlined below:
Buildings 3 - 70 yearsStructures 5 - 45 yearsMachinery and equipment 6 - 17 yearsTools, furniture and fixtures 3 - 20 years
Intangible assetsIntangible assets are amortized by the straight-line method.
Goodwill is amortized using the straight-line method over 20 years.
Long-term prepaid expensesLong-term prepaid expenses are amortized by the straight-line method.
NOTES TO FINANCIAL STATEMENTS
Financing Status PortfolioManagement Strategy Investor InformationESG Measures Financial SectionMessage from the Management
37 38Nomura Real Estate Master Fund, Inc. Nomura Real Estate Master Fund, Inc.
Impairment of fixed assetsNMF reviews fixed assets for impairment whenever events or changes in circumstances indicate that the carrying value of its fixed assets may not be recoverable. An impairment loss is recognized if the carrying value of an asset exceeds the aggregate estimated future cash flows. If a fixed asset is determined to be impaired, it is written down to its recoverable amount and the write-down is recorded as an impairment loss during the period in which it occurs.
Deferred investment corporation bond issuance costsDeferred investment corporation bond issuance costs are amortized by the straight-line method over the respective terms of the bonds.
Investment units issuance expensesThe entire amount is expensed as incurred.
Allowances and provisions(1) Allowance for doubtful accounts For allowance for doubtful accounts against possible losses arising from default on receivables, the uncollectable amount is
estimated and recorded by investigating collectability based on historical loan loss ratios for general receivables and on a case-by-case examination for doubtful and other specific receivables.
(2) Provision for loss on disaster The amount that is reasonably estimated at the end of the previous fiscal period under review is recorded to cover expendi-
tures for restoration etc. following the 2021 Fukushima Earthquake.
Accounting treatment of beneficial interests in real estateAll assets and liabilities held in trust, for which the real estate in possession of NMF was entrusted, and all related earnings and expenses incurred are reflected in the accompanying balance sheet and statement of income and retained earnings, respectively.
Revenue recognitionOperating revenues consist of rental revenues including base rents and common area charges, and other operating revenues including utility charge reimbursements, parking space rental revenues and other income. Rental revenues are generally recog-nized on an accrual basis over the life of each lease. Utility charge reimbursements are recognized when earned and their amounts are reasonably estimated.
Property related taxesProperty in Japan is subject to property taxes, urban planning taxes and depreciable property taxes on a calendar year basis. The taxes related to property are generally imposed based on the value of the relevant property and incurred for the fiscal period. The seller of a property is liable for property related taxes for the period from the purchase date through the end of that calen-dar year because taxes are imposed on the owner registered in the record as of January 1 for the entire year based on the assessment made by the local government. The amount applicable to the buyer of a property is usually settled between each party and capitalized as part of the acquisition cost of the property. The capitalized property related taxes amounted to ¥4,533 thousand for the fiscal period ended February 28, 2021 and are not applicable in the current fiscal period.
Income taxesDeferred tax assets and liabilities are computed based on the differences between the financial statements and income tax bases of assets and liabilities using the applicable statutory tax rates.
Consumption taxesConsumption taxes received and paid are not included in the accompanying statement of income and retained earnings.
Derivative financial instrumentsNMF utilizes interest-rate swap contracts as derivative financial instruments only for the purpose of hedging its exposure to changes in interest rates. NMF defers recognition of gains or losses resulting from changes in the fair value of interest-rate swap contracts which meet the criteria for deferral hedge accounting.
Although deferral hedge accounting is generally applied, NMF applies the special treatment to those interest-rate swap con-tracts that meet the criteria for such special treatment. Under the special treatment, interest-rate swaps are not remeasured at fair value; instead, the net amount paid or received under the interest-rate swap contract is recognized and included in interest expense or income.
(Accounting standards issued but not yet applied)“Accounting Standard for Revenue Recognition” (the Accounting Standards Board of Japan (ASBJ) Statement No. 29, issued by ASBJ on March 31, 2020)
“Implementation Guidance on Accounting Standard for Revenue Recognition” (ASBJ Guidance No. 30, issued by ASBJ on March 31, 2020)
(1) Overview Comprehensive accounting standards on revenue recognition were developed jointly by the International Accounting Standards Board (IASB) and the US Financial Accounting Standards Board (FASB), and were released publicly in May 2014 as “Revenue from Contracts with Customers” (IFRS 15 by the IASB, and Topic 606 by the FASB). In light of this, the ASBJ developed a comprehensive accounting standard on revenue recognition, and issued it together with implementation guidance.
The basic policy adopted by the ASBJ in developing the accounting standard was to start by incorporating the basic princi-ples of IFRS 15 from the perspective of comparability between financial statements, which is one of the benefits of main-taining consistency with IFRS 15. Then, where consideration should be given to practices used up to that time in Japan, the ASBJ added alternative treatments, to the extent they do not impair comparability.
(2) Scheduled date of application The accounting standard and guidance will be applied from the beginning of the fiscal period ending February 28, 2022.
(3) Impact of applying the new accounting standard. The impact of applying the accounting standard and implementation guidance on the financial statements is currently under evaluation.
“Accounting Standard for Fair Value Measurement” (ASBJ Statement No. 30, issued by ASBJ on July 4, 2019)
“Implementation Guidance on Accounting Standard for Fair Value Measurement (ASBJ Guidance No. 31, issued by ASBJ on July 4, 2019)
(1) OverviewThe IASB and the FASB have established detailed guidance on measuring fair value (IFRS 13 “Fair Value Measurement” issued by the IASB, and Topic 820 “Fair Value Measurement” issued by the FASB). In order to improve comparability with the provisions of these international accounting standards, the ASBJ gave extensive consideration primarily regarding guidance and disclosure concerning the fair value of financial instruments, following which it issued the Accounting Standard for Fair Value Measurement and the Implementation Guidance on Accounting Standard for Fair Value Measurement.
The basic policy adopted by the ASBJ in developing the accounting standard was to fundamentally incorporate all of the provisions of IFRS 13 from the perspective of improving comparability of financial statements between companies in Japan and overseas by using uniform methods of calculation. Then, taking account of practices used up to that time in Japan, the ASBJ established other treatment for individual items, to the extent it does not significantly impair comparability between financial statements.
(2) Scheduled date of application The accounting standard and guidance will be applied from the beginning of the fiscal period ending February 28, 2022.
(3) Impact of applying the new accounting standard. The impact of applying the accounting standard and implementation guidance on the financial statements is currently under evaluation.

NOTES TO FINANCIAL STATEMENTS
Financing Status PortfolioManagement Strategy Investor InformationESG Measures Financial SectionMessage from the Management
39 40Nomura Real Estate Master Fund, Inc. Nomura Real Estate Master Fund, Inc.
4. CASH AND CASH EQUIVALENTSCash and cash equivalents as of February 28, 2021 and August 31, 2021 consist of the following: Thousands of Yen
As of February 28, 2021 As of August 31, 2021
Cash and bank deposits 63,840,679 63,111,539Cash and cash equivalents 63,840,679 63,111,539
Important contents of the non-cash transactions:Not applicable.
5. ASSETS PLEDGED AS COLLATERAL AND SECURED LIABILITIESThe assets pledged as collateral are as follows: Thousands of Yen
As of February 28, 2021 As of August 31, 2021
Buildings in trust 3,274,450 3,239,960Land in trust 6,096,368 6,096,368Structures in trust 4,438 4,794Tools, furniture and fixtures in trust 4,095 3,710 Total 9,379,352 9,344,833
The secured liabilities are as follows: Thousands of Yen
As of February 28, 2021 As of August 31, 2021
Tenant leasehold and security deposits in trust 726,648 726,648 Total 726,648 726,648
6. SCHEDULE OF PROPERTY AND EQUIPMENTProperty and equipment as of February 28, 2021 and August 31, 2021 consist of the following: Thousands of Yen
As of February 28, 2021 As of August 31, 2021
Acquisition costs Book value Acquisition costs Book valueLand 311,019,052 311,019,052 313,197,582 313,197,582Buildings and structures 159,563,452 160,252,956 Accumulated depreciation (21,135,533) 138,427,919 (23,504,974) 136,747,981Machinery and equipment 986,902 1,049,441 Accumulated depreciation (563,469) 423,433 (594,655) 454,786Tools, furniture and fixtures 511,319 569,914 Accumulated depreciation (210,485) 300,833 (254,552) 315,361Land in trust 422,871,240 422,871,240 422,871,240 422,871,240Buildings and structures in trust 200,438,003 202,627,061 Accumulated depreciation (34,844,012) 165,593,990 (37,847,583) 164,779,478Machinery and equipment in trust 881,280 968,161 Accumulated depreciation (217,496) 663,784 (263,601) 704,560Tools, furniture and fixtures in trust 1,062,358 1,088,132 Accumulated depreciation (462,875) 599,483 (541,993) 546,139Lease assets in trust 4,752 4,752 Accumulated depreciation (1,320) 3,432 (1,716) 3,036Construction in progress 56,913 56,913 124,467 124,467 Total 1,039,960,082 1,039,960,082 1,039,744,634 1,039,744,634
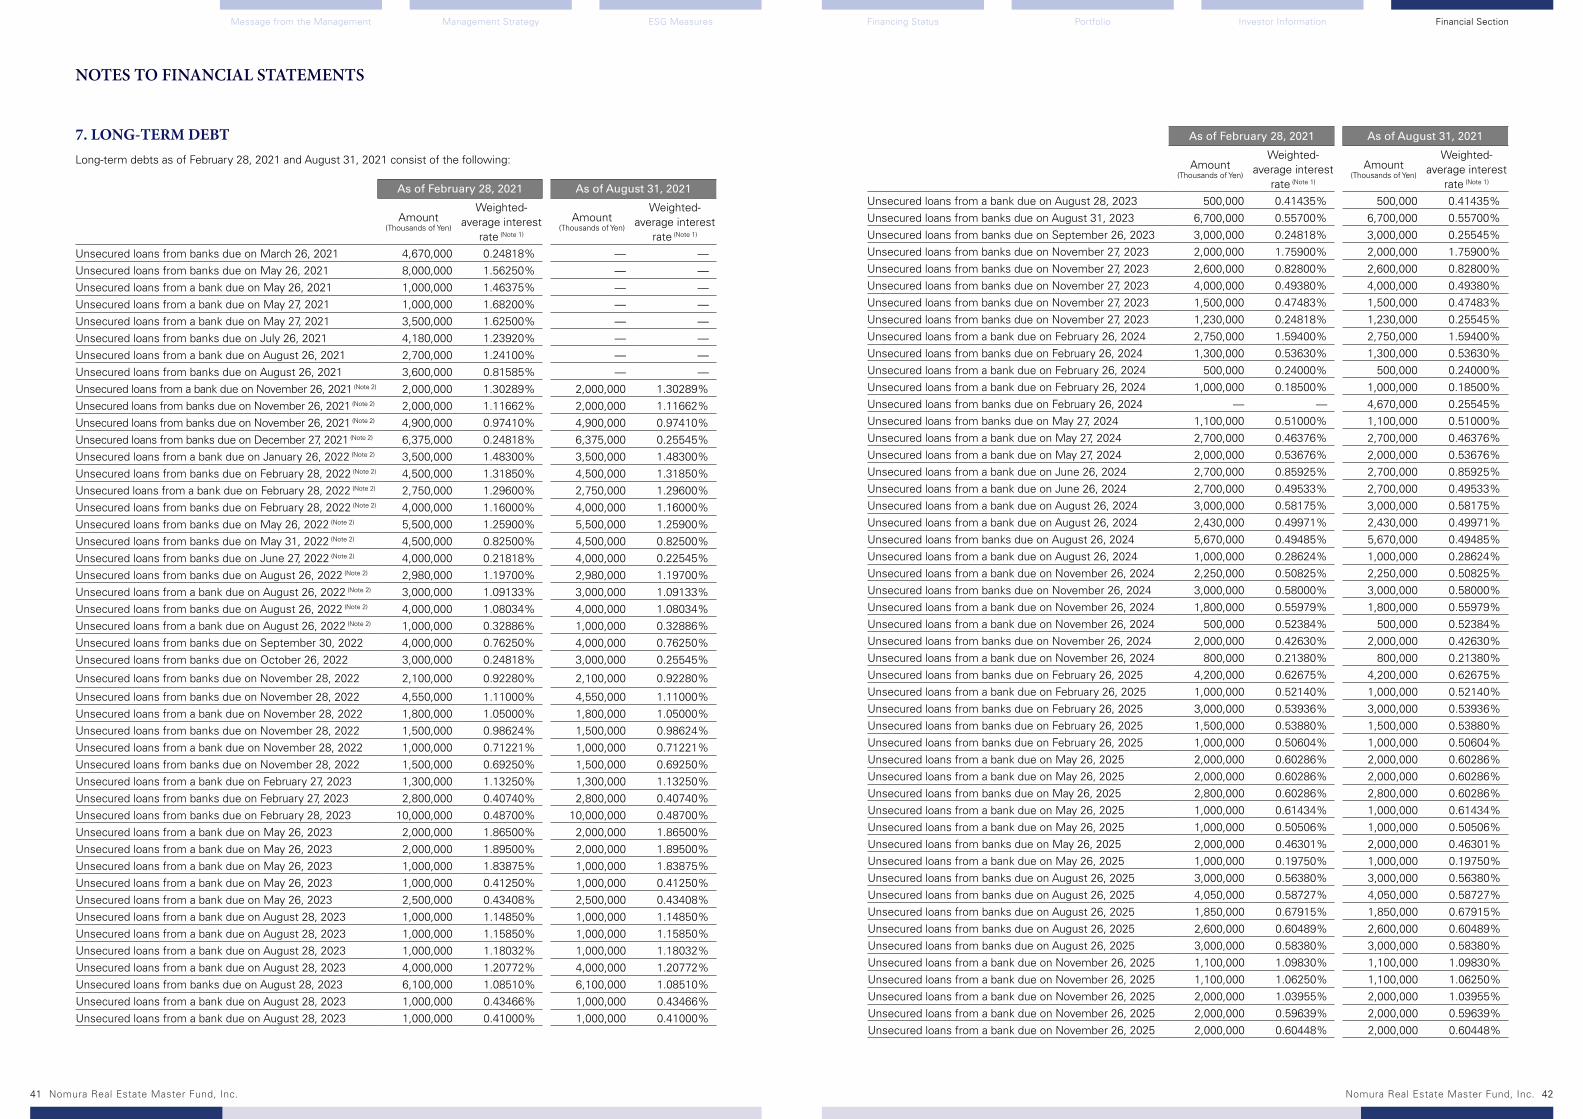
NOTES TO FINANCIAL STATEMENTS
Financing Status PortfolioManagement Strategy Investor InformationESG Measures Financial SectionMessage from the Management
41 42Nomura Real Estate Master Fund, Inc. Nomura Real Estate Master Fund, Inc.
7. LONG-TERM DEBTLong-term debts as of February 28, 2021 and August 31, 2021 consist of the following:
As of February 28, 2021 As of August 31, 2021
Amount (Thousands of Yen)
Weighted-average interest
rate (Note 1)
Amount (Thousands of Yen)
Weighted-average interest
rate (Note 1)
Unsecured loans from banks due on March 26, 2021 4,670,000 0.24818% — — Unsecured loans from banks due on May 26, 2021 8,000,000 1.56250% — — Unsecured loans from a bank due on May 26, 2021 1,000,000 1.46375% — — Unsecured loans from a bank due on May 27, 2021 1,000,000 1.68200% — — Unsecured loans from a bank due on May 27, 2021 3,500,000 1.62500% — — Unsecured loans from banks due on July 26, 2021 4,180,000 1.23920% — — Unsecured loans from a bank due on August 26, 2021 2,700,000 1.24100% — — Unsecured loans from banks due on August 26, 2021 3,600,000 0.81585% — — Unsecured loans from a bank due on November 26, 2021 (Note 2) 2,000,000 1.30289% 2,000,000 1.30289%Unsecured loans from banks due on November 26, 2021 (Note 2) 2,000,000 1.11662% 2,000,000 1.11662%Unsecured loans from banks due on November 26, 2021 (Note 2) 4,900,000 0.97410% 4,900,000 0.97410%Unsecured loans from banks due on December 27, 2021 (Note 2) 6,375,000 0.24818% 6,375,000 0.25545%Unsecured loans from a bank due on January 26, 2022 (Note 2) 3,500,000 1.48300% 3,500,000 1.48300%Unsecured loans from banks due on February 28, 2022 (Note 2) 4,500,000 1.31850% 4,500,000 1.31850%Unsecured loans from a bank due on February 28, 2022 (Note 2) 2,750,000 1.29600% 2,750,000 1.29600%Unsecured loans from banks due on February 28, 2022 (Note 2) 4,000,000 1.16000% 4,000,000 1.16000%Unsecured loans from banks due on May 26, 2022 (Note 2) 5,500,000 1.25900% 5,500,000 1.25900%Unsecured loans from banks due on May 31, 2022 (Note 2) 4,500,000 0.82500% 4,500,000 0.82500%Unsecured loans from banks due on June 27, 2022 (Note 2) 4,000,000 0.21818% 4,000,000 0.22545%Unsecured loans from banks due on August 26, 2022 (Note 2) 2,980,000 1.19700% 2,980,000 1.19700%Unsecured loans from a bank due on August 26, 2022 (Note 2) 3,000,000 1.09133% 3,000,000 1.09133%Unsecured loans from banks due on August 26, 2022 (Note 2) 4,000,000 1.08034% 4,000,000 1.08034%Unsecured loans from a bank due on August 26, 2022 (Note 2) 1,000,000 0.32886% 1,000,000 0.32886%Unsecured loans from banks due on September 30, 2022 4,000,000 0.76250% 4,000,000 0.76250%Unsecured loans from banks due on October 26, 2022 3,000,000 0.24818% 3,000,000 0.25545%
Unsecured loans from banks due on November 28, 2022 2,100,000 0.92280% 2,100,000 0.92280%
Unsecured loans from banks due on November 28, 2022 4,550,000 1.11000% 4,550,000 1.11000%Unsecured loans from a bank due on November 28, 2022 1,800,000 1.05000% 1,800,000 1.05000%Unsecured loans from banks due on November 28, 2022 1,500,000 0.98624% 1,500,000 0.98624%Unsecured loans from a bank due on November 28, 2022 1,000,000 0.71221% 1,000,000 0.71221%Unsecured loans from banks due on November 28, 2022 1,500,000 0.69250% 1,500,000 0.69250%Unsecured loans from a bank due on February 27, 2023 1,300,000 1.13250% 1,300,000 1.13250%Unsecured loans from banks due on February 27, 2023 2,800,000 0.40740% 2,800,000 0.40740%Unsecured loans from banks due on February 28, 2023 10,000,000 0.48700% 10,000,000 0.48700%Unsecured loans from a bank due on May 26, 2023 2,000,000 1.86500% 2,000,000 1.86500%Unsecured loans from a bank due on May 26, 2023 2,000,000 1.89500% 2,000,000 1.89500%Unsecured loans from a bank due on May 26, 2023 1,000,000 1.83875% 1,000,000 1.83875%Unsecured loans from a bank due on May 26, 2023 1,000,000 0.41250% 1,000,000 0.41250%Unsecured loans from a bank due on May 26, 2023 2,500,000 0.43408% 2,500,000 0.43408%Unsecured loans from a bank due on August 28, 2023 1,000,000 1.14850% 1,000,000 1.14850%Unsecured loans from a bank due on August 28, 2023 1,000,000 1.15850% 1,000,000 1.15850%Unsecured loans from a bank due on August 28, 2023 1,000,000 1.18032% 1,000,000 1.18032%Unsecured loans from a bank due on August 28, 2023 4,000,000 1.20772% 4,000,000 1.20772%Unsecured loans from banks due on August 28, 2023 6,100,000 1.08510% 6,100,000 1.08510%Unsecured loans from a bank due on August 28, 2023 1,000,000 0.43466% 1,000,000 0.43466%Unsecured loans from a bank due on August 28, 2023 1,000,000 0.41000% 1,000,000 0.41000%
As of February 28, 2021 As of August 31, 2021
Amount (Thousands of Yen)
Weighted-average interest
rate (Note 1)
Amount (Thousands of Yen)
Weighted-average interest
rate (Note 1)
Unsecured loans from a bank due on August 28, 2023 500,000 0.41435% 500,000 0.41435%Unsecured loans from banks due on August 31, 2023 6,700,000 0.55700% 6,700,000 0.55700%Unsecured loans from banks due on September 26, 2023 3,000,000 0.24818% 3,000,000 0.25545%Unsecured loans from banks due on November 27, 2023 2,000,000 1.75900% 2,000,000 1.75900%Unsecured loans from banks due on November 27, 2023 2,600,000 0.82800% 2,600,000 0.82800%Unsecured loans from banks due on November 27, 2023 4,000,000 0.49380% 4,000,000 0.49380%Unsecured loans from banks due on November 27, 2023 1,500,000 0.47483% 1,500,000 0.47483%Unsecured loans from banks due on November 27, 2023 1,230,000 0.24818% 1,230,000 0.25545%Unsecured loans from a bank due on February 26, 2024 2,750,000 1.59400% 2,750,000 1.59400%Unsecured loans from banks due on February 26, 2024 1,300,000 0.53630% 1,300,000 0.53630%Unsecured loans from a bank due on February 26, 2024 500,000 0.24000% 500,000 0.24000%Unsecured loans from a bank due on February 26, 2024 1,000,000 0.18500% 1,000,000 0.18500%Unsecured loans from banks due on February 26, 2024 — — 4,670,000 0.25545%Unsecured loans from banks due on May 27, 2024 1,100,000 0.51000% 1,100,000 0.51000%Unsecured loans from a bank due on May 27, 2024 2,700,000 0.46376% 2,700,000 0.46376%Unsecured loans from a bank due on May 27, 2024 2,000,000 0.53676% 2,000,000 0.53676%Unsecured loans from a bank due on June 26, 2024 2,700,000 0.85925% 2,700,000 0.85925%Unsecured loans from a bank due on June 26, 2024 2,700,000 0.49533% 2,700,000 0.49533%Unsecured loans from a bank due on August 26, 2024 3,000,000 0.58175% 3,000,000 0.58175%Unsecured loans from a bank due on August 26, 2024 2,430,000 0.49971% 2,430,000 0.49971%Unsecured loans from banks due on August 26, 2024 5,670,000 0.49485% 5,670,000 0.49485%Unsecured loans from a bank due on August 26, 2024 1,000,000 0.28624% 1,000,000 0.28624%Unsecured loans from a bank due on November 26, 2024 2,250,000 0.50825% 2,250,000 0.50825%Unsecured loans from banks due on November 26, 2024 3,000,000 0.58000% 3,000,000 0.58000%Unsecured loans from a bank due on November 26, 2024 1,800,000 0.55979% 1,800,000 0.55979%Unsecured loans from a bank due on November 26, 2024 500,000 0.52384% 500,000 0.52384%Unsecured loans from banks due on November 26, 2024 2,000,000 0.42630% 2,000,000 0.42630%Unsecured loans from a bank due on November 26, 2024 800,000 0.21380% 800,000 0.21380%Unsecured loans from banks due on February 26, 2025 4,200,000 0.62675% 4,200,000 0.62675%Unsecured loans from a bank due on February 26, 2025 1,000,000 0.52140% 1,000,000 0.52140%Unsecured loans from banks due on February 26, 2025 3,000,000 0.53936% 3,000,000 0.53936%Unsecured loans from banks due on February 26, 2025 1,500,000 0.53880% 1,500,000 0.53880%Unsecured loans from banks due on February 26, 2025 1,000,000 0.50604% 1,000,000 0.50604%Unsecured loans from a bank due on May 26, 2025 2,000,000 0.60286% 2,000,000 0.60286%Unsecured loans from a bank due on May 26, 2025 2,000,000 0.60286% 2,000,000 0.60286%Unsecured loans from banks due on May 26, 2025 2,800,000 0.60286% 2,800,000 0.60286%Unsecured loans from a bank due on May 26, 2025 1,000,000 0.61434% 1,000,000 0.61434%Unsecured loans from a bank due on May 26, 2025 1,000,000 0.50506% 1,000,000 0.50506%Unsecured loans from banks due on May 26, 2025 2,000,000 0.46301% 2,000,000 0.46301%Unsecured loans from a bank due on May 26, 2025 1,000,000 0.19750% 1,000,000 0.19750%Unsecured loans from banks due on August 26, 2025 3,000,000 0.56380% 3,000,000 0.56380%Unsecured loans from banks due on August 26, 2025 4,050,000 0.58727% 4,050,000 0.58727%Unsecured loans from banks due on August 26, 2025 1,850,000 0.67915% 1,850,000 0.67915%Unsecured loans from banks due on August 26, 2025 2,600,000 0.60489% 2,600,000 0.60489%Unsecured loans from banks due on August 26, 2025 3,000,000 0.58380% 3,000,000 0.58380%Unsecured loans from a bank due on November 26, 2025 1,100,000 1.09830% 1,100,000 1.09830%Unsecured loans from a bank due on November 26, 2025 1,100,000 1.06250% 1,100,000 1.06250%Unsecured loans from a bank due on November 26, 2025 2,000,000 1.03955% 2,000,000 1.03955%Unsecured loans from a bank due on November 26, 2025 2,000,000 0.59639% 2,000,000 0.59639%Unsecured loans from a bank due on November 26, 2025 2,000,000 0.60448% 2,000,000 0.60448%

NOTES TO FINANCIAL STATEMENTS
Financing Status PortfolioManagement Strategy Investor InformationESG Measures Financial SectionMessage from the Management
43 44Nomura Real Estate Master Fund, Inc. Nomura Real Estate Master Fund, Inc.
As of February 28, 2021 As of August 31, 2021
Amount (Thousands of Yen)
Weighted-average interest
rate (Note 1)
Amount (Thousands of Yen)
Weighted-average interest
rate (Note 1)
Unsecured loans from banks due on November 26, 2025 4,200,000 0.64616% 4,200,000 0.64616%Unsecured loans from a bank due on November 26, 2025 900,000 0.65123% 900,000 0.65123%Unsecured loans from a bank due on November 26, 2025 1,300,000 0.64278% 1,300,000 0.64278%Unsecured loans from a bank due on November 26, 2025 1,000,000 0.59499% 1,000,000 0.59499%Unsecured loans from a bank due on November 26, 2025 500,000 0.56311% 500,000 0.56311%Unsecured loans from banks due on February 26, 2026 4,000,000 0.74080% 4,000,000 0.74080%Unsecured loans from banks due on February 26, 2026 2,500,000 0.59592% 2,500,000 0.59592%Unsecured loans from banks due on February 26, 2026 800,000 0.37630% 800,000 0.37630%Unsecured loans from a bank due on February 26, 2026 500,000 0.39196% 500,000 0.39196%Unsecured loans from banks due on February 26, 2026 1,500,000 0.17136% 1,500,000 0.17136%Unsecured loans from a bank due on February 26, 2026 — — 500,000 0.21500%Unsecured loans from a bank due on May 26, 2026 2,500,000 0.63995% 2,500,000 0.63995%Unsecured loans from a bank due on May 26, 2026 1,100,000 0.65267% 1,100,000 0.65267%Unsecured loans from banks due on May 26, 2026 3,600,000 0.60880% 3,600,000 0.60880%Unsecured loans from a bank due on May 26, 2026 1,000,000 0.59614% 1,000,000 0.59614%Unsecured loans from a bank due on May 26, 2026 1,100,000 0.37000% 1,100,000 0.37000%Unsecured loans from a bank due on May 26, 2026 1,500,000 0.25873% 1,500,000 0.25873%Unsecured loans from a bank due on August 26, 2026 2,700,000 0.67591% 2,700,000 0.67591%Unsecured loans from a bank due on August 26, 2026 2,700,000 0.67591% 2,700,000 0.67591%Unsecured loans from banks due on August 26, 2026 3,000,000 0.77669% 3,000,000 0.77669%Unsecured loans from a bank due on August 26, 2026 1,000,000 0.70414% 1,000,000 0.70414%Unsecured loans from banks due on August 26, 2026 3,000,000 0.67483% 3,000,000 0.67483%Unsecured loans from a bank due on August 26, 2026 1,000,000 0.64500% 1,000,000 0.64500%Unsecured loans from a bank due on August 26, 2026 1,000,000 0.42118% 1,000,000 0.42118%Unsecured loans from a bank due on August 26, 2026 500,000 0.43627% 500,000 0.43627%Unsecured loans from banks due on August 26, 2026 1,500,000 0.20880% 1,500,000 0.20880%Unsecured loans from a bank due on August 26, 2026 1,000,000 0.30116% 1,000,000 0.30116%Unsecured loans from a bank due on November 26, 2026 2,000,000 0.76000% 2,000,000 0.76000%Unsecured loans from a bank due on November 26, 2026 2,000,000 0.74229% 2,000,000 0.74229%Unsecured loans from banks due on November 26, 2026 4,165,000 0.73506% 4,165,000 0.73506%Unsecured loans from banks due on November 26, 2026 4,000,000 0.69956% 4,000,000 0.69956%Unsecured loans from banks due on November 26, 2026 1,500,000 0.64999% 1,500,000 0.64999%Unsecured loans from banks due on November 26, 2026 2,000,000 0.60750% 2,000,000 0.60750%Unsecured loans from banks due on November 26, 2026 1,000,000 0.28000% 1,000,000 0.28000%Unsecured loans from banks due on November 26, 2026 1,200,000 0.30000% 1,200,000 0.30000%Unsecured loans from banks due on February 26, 2027 2,320,000 0.71500% 2,320,000 0.71500%Unsecured loans from banks due on February 26, 2027 1,500,000 0.46630% 1,500,000 0.46630%Unsecured loans from a bank due on February 26, 2027 500,000 0.44859% 500,000 0.44859%Unsecured loans from banks due on February 26, 2027 1,000,000 0.48144% 1,000,000 0.48144%Unsecured loans from a bank due on February 26, 2027 1,500,000 0.28500% 1,500,000 0.28500%Unsecured loans from a bank due on February 26, 2027 1,000,000 0.28500% 1,000,000 0.28500%Unsecured loans from a bank due on February 26, 2027 300,000 0.16205% 300,000 0.16205%Unsecured loans from a bank due on February 26, 2027 500,000 0.10094% 500,000 0.10094%Unsecured loans from a bank due on February 26, 2027 500,000 0.35139% 500,000 0.35139%Unsecured loans from a bank due on February 26, 2027 — — 500,000 0.24818%Unsecured loans from banks due on March 26, 2027 1,500,000 0.69068% 1,500,000 0.69068%Unsecured loans from banks due on May 26, 2027 3,060,000 0.78177% 3,060,000 0.78177%Unsecured loans from banks due on May 26, 2027 2,300,000 0.74736% 2,300,000 0.74736%Unsecured loans from a bank due on May 26, 2027 1,800,000 0.70250% 1,800,000 0.70250%
As of February 28, 2021 As of August 31, 2021
Amount (Thousands of Yen)
Weighted-average interest
rate (Note 1)
Amount (Thousands of Yen)
Weighted-average interest
rate (Note 1)
Unsecured loans from a bank due on May 26, 2027 1,400,000 0.32000% 1,400,000 0.32000%Unsecured loans from banks due on August 26, 2027 4,000,000 0.76843% 4,000,000 0.76843%Unsecured loans from banks due on August 26, 2027 2,600,000 0.76290% 2,600,000 0.76290%Unsecured loans from a bank due on August 26, 2027 1,000,000 0.74500% 1,000,000 0.74500%Unsecured loans from a bank due on August 26, 2027 1,000,000 0.51356% 1,000,000 0.51356%Unsecured loans from banks due on August 26, 2027 1,500,000 0.29000% 1,500,000 0.29000%Unsecured loans from a bank due on August 26, 2027 600,000 0.32630% 600,000 0.32630%Unsecured loans from a bank due on August 26, 2027 — — 1,700,000 0.27130%Unsecured loans from a bank due on November 26, 2027 2,000,000 0.89209% 2,000,000 0.89209%Unsecured loans from banks due on November 26, 2027 5,000,000 0.79571% 5,000,000 0.79571%Unsecured loans from a bank due on November 26, 2027 1,800,000 0.75050% 1,800,000 0.75050%Unsecured loans from banks due on November 26, 2027 1,700,000 0.70750% 1,700,000 0.70750%Unsecured loans from banks due on November 26, 2027 2,500,000 0.52234% 2,500,000 0.52234%Unsecured loans from banks due on November 26, 2027 1,000,000 0.31630% 1,000,000 0.31630%Unsecured loans from a bank due on November 26, 2027 750,000 0.29630% 750,000 0.29630%Unsecured loans from a bank due on February 28, 2028 1,000,000 0.82130% 1,000,000 0.82130%Unsecured loans from a bank due on February 28, 2028 2,355,000 0.76241% 2,355,000 0.76241%Unsecured loans from banks due on February 28, 2028 1,500,000 0.78296% 1,500,000 0.78296%Unsecured loans from a bank due on February 28, 2028 1,800,000 0.79642% 1,800,000 0.79642%Unsecured loans from a bank due on February 28, 2028 2,650,000 0.54205% 2,650,000 0.54205%Unsecured loans from banks due on February 28, 2028 1,500,000 0.57365% 1,500,000 0.57365%Unsecured loans from banks due on February 28, 2028 1,000,000 0.17813% 1,000,000 0.17813%Unsecured loans from a bank due on February 28, 2028 1,000,000 0.41000% 1,000,000 0.41000%Unsecured loans from a bank due on February 28, 2028 1,000,000 0.41000% 1,000,000 0.41000%Unsecured loans from a bank due on February 28, 2028 500,000 0.39000% 500,000 0.39000%Unsecured loans from a bank due on February 28, 2028 920,000 0.30000% 920,000 0.30000%Unsecured loans from banks due on May 26, 2028 5,000,000 0.79880% 5,000,000 0.79880%Unsecured loans from a bank due on May 26, 2028 2,000,000 0.75922% 2,000,000 0.75922%Unsecured loans from a bank due on May 26, 2028 1,550,000 0.55038% 1,550,000 0.55038%Unsecured loans from a bank due on May 26, 2028 500,000 0.54010% 500,000 0.54010%Unsecured loans from banks due on May 26, 2028 2,000,000 0.54750% 2,000,000 0.54750%Unsecured loans from a bank due on May 26, 2028 1,400,000 0.40500% 1,400,000 0.40500%Unsecured loans from banks due on August 28, 2028 3,600,000 0.84750% 3,600,000 0.84750%Unsecured loans from a bank due on August 28, 2028 500,000 0.61005% 500,000 0.61005%Unsecured loans from banks due on August 28, 2028 1,000,000 0.62163% 1,000,000 0.62163%Unsecured loans from a bank due on August 28, 2028 500,000 0.62025% 500,000 0.62025%Unsecured loans from a bank due on August 28, 2028 500,000 0.37500% 500,000 0.37500%Unsecured loans from a bank due on August 28, 2028 1,000,000 0.40380% 1,000,000 0.40380%Unsecured loans from a bank due on August 28, 2028 1,260,000 0.45375% 1,260,000 0.45375%Unsecured loans from banks due on November 27, 2028 2,000,000 0.81130% 2,000,000 0.81130%Unsecured loans from banks due on November 27, 2028 3,000,000 0.59375% 3,000,000 0.59375%Unsecured loans from a bank due on November 27, 2028 1,800,000 0.50880% 1,800,000 0.50880%Unsecured loans from a bank due on November 27, 2028 500,000 0.39380% 500,000 0.39380%Unsecured loans from banks due on February 26, 2029 2,500,000 0.65880% 2,500,000 0.65880%Unsecured loans from banks due on February 26, 2029 1,400,000 0.67098% 1,400,000 0.67098%Unsecured loans from a bank due on February 26, 2029 2,300,000 0.63692% 2,300,000 0.63692%Unsecured loans from a bank due on February 26, 2029 500,000 0.63692% 500,000 0.63692%Unsecured loans from a bank due on February 26, 2029 3,500,000 0.41815% 3,500,000 0.41815%Unsecured loans from a bank due on February 26, 2029 500,000 0.37000% 500,000 0.37000%Unsecured loans from a bank due on February 26, 2029 500,000 0.49750% 500,000 0.49750%
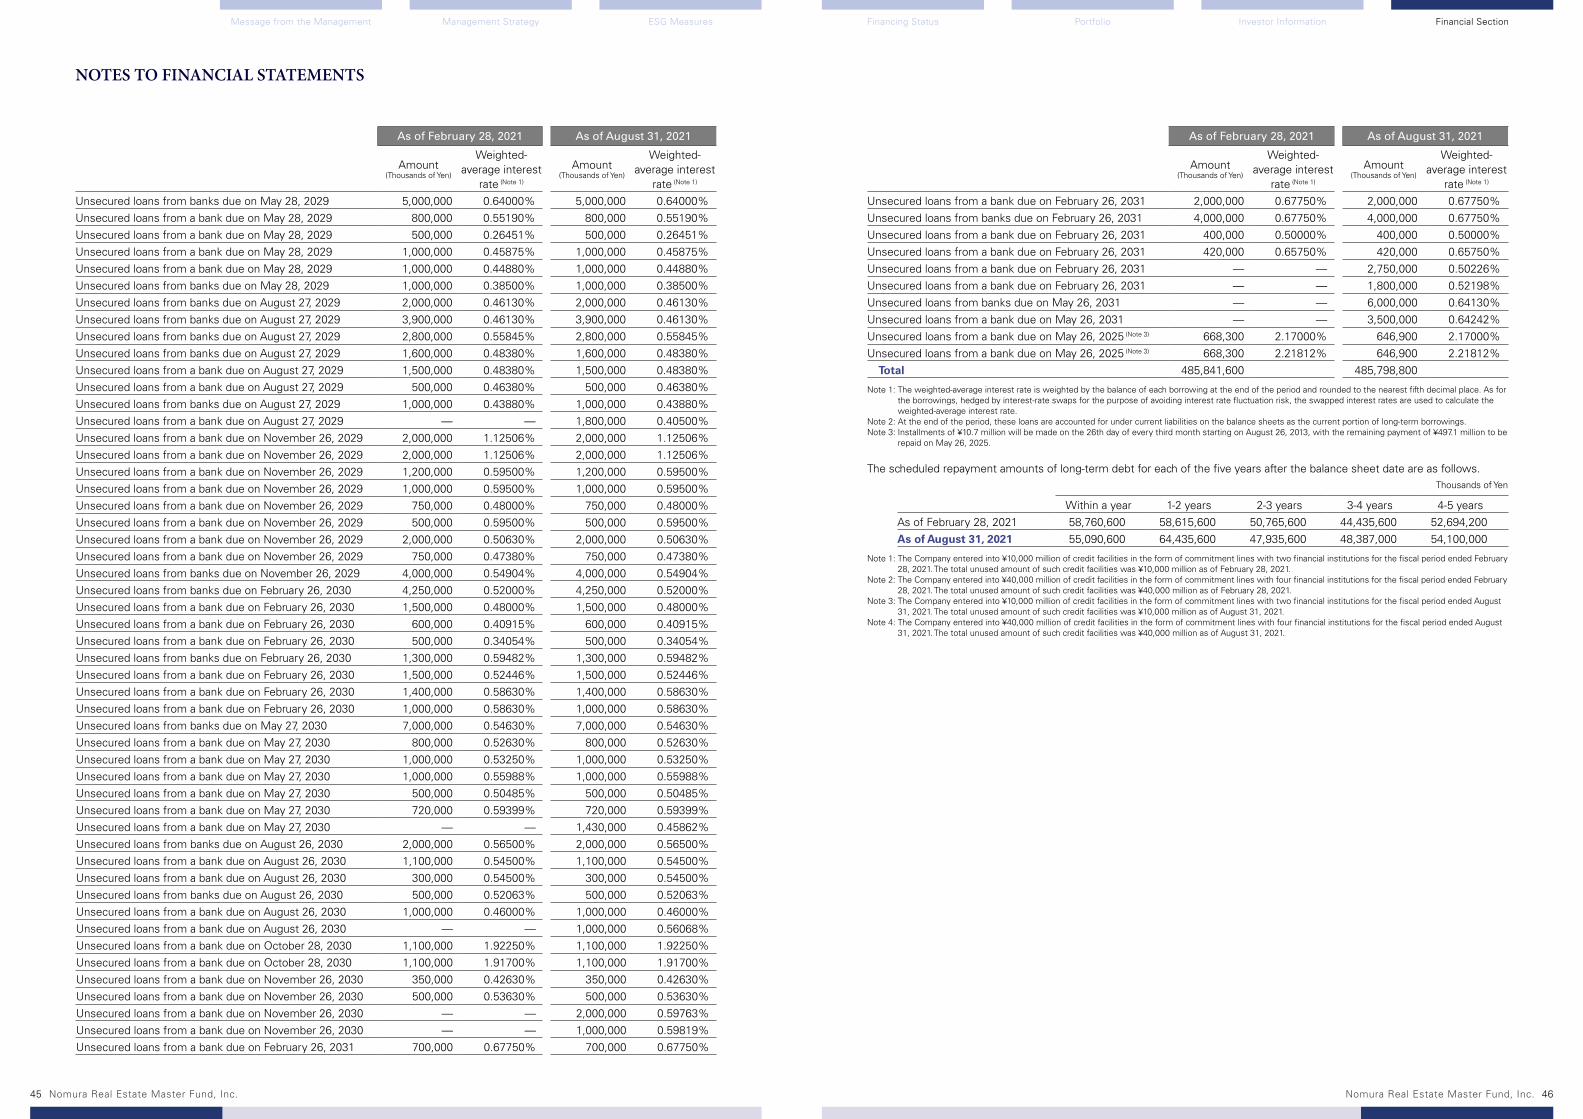
NOTES TO FINANCIAL STATEMENTS
Financing Status PortfolioManagement Strategy Investor InformationESG Measures Financial SectionMessage from the Management
45 46Nomura Real Estate Master Fund, Inc. Nomura Real Estate Master Fund, Inc.
As of February 28, 2021 As of August 31, 2021
Amount (Thousands of Yen)
Weighted-average interest
rate (Note 1)
Amount (Thousands of Yen)
Weighted-average interest
rate (Note 1)
Unsecured loans from banks due on May 28, 2029 5,000,000 0.64000% 5,000,000 0.64000%Unsecured loans from a bank due on May 28, 2029 800,000 0.55190% 800,000 0.55190%Unsecured loans from a bank due on May 28, 2029 500,000 0.26451% 500,000 0.26451%Unsecured loans from a bank due on May 28, 2029 1,000,000 0.45875% 1,000,000 0.45875%Unsecured loans from a bank due on May 28, 2029 1,000,000 0.44880% 1,000,000 0.44880%Unsecured loans from banks due on May 28, 2029 1,000,000 0.38500% 1,000,000 0.38500%Unsecured loans from banks due on August 27, 2029 2,000,000 0.46130% 2,000,000 0.46130%Unsecured loans from banks due on August 27, 2029 3,900,000 0.46130% 3,900,000 0.46130%Unsecured loans from banks due on August 27, 2029 2,800,000 0.55845% 2,800,000 0.55845%Unsecured loans from banks due on August 27, 2029 1,600,000 0.48380% 1,600,000 0.48380%Unsecured loans from a bank due on August 27, 2029 1,500,000 0.48380% 1,500,000 0.48380%Unsecured loans from a bank due on August 27, 2029 500,000 0.46380% 500,000 0.46380%Unsecured loans from banks due on August 27, 2029 1,000,000 0.43880% 1,000,000 0.43880%Unsecured loans from a bank due on August 27, 2029 — — 1,800,000 0.40500%Unsecured loans from a bank due on November 26, 2029 2,000,000 1.12506% 2,000,000 1.12506%Unsecured loans from a bank due on November 26, 2029 2,000,000 1.12506% 2,000,000 1.12506%Unsecured loans from a bank due on November 26, 2029 1,200,000 0.59500% 1,200,000 0.59500%Unsecured loans from a bank due on November 26, 2029 1,000,000 0.59500% 1,000,000 0.59500%Unsecured loans from a bank due on November 26, 2029 750,000 0.48000% 750,000 0.48000%Unsecured loans from a bank due on November 26, 2029 500,000 0.59500% 500,000 0.59500%Unsecured loans from a bank due on November 26, 2029 2,000,000 0.50630% 2,000,000 0.50630%Unsecured loans from a bank due on November 26, 2029 750,000 0.47380% 750,000 0.47380%Unsecured loans from banks due on November 26, 2029 4,000,000 0.54904% 4,000,000 0.54904%Unsecured loans from banks due on February 26, 2030 4,250,000 0.52000% 4,250,000 0.52000%Unsecured loans from a bank due on February 26, 2030 1,500,000 0.48000% 1,500,000 0.48000%Unsecured loans from a bank due on February 26, 2030 600,000 0.40915% 600,000 0.40915%Unsecured loans from a bank due on February 26, 2030 500,000 0.34054% 500,000 0.34054%Unsecured loans from banks due on February 26, 2030 1,300,000 0.59482% 1,300,000 0.59482%Unsecured loans from a bank due on February 26, 2030 1,500,000 0.52446% 1,500,000 0.52446%Unsecured loans from a bank due on February 26, 2030 1,400,000 0.58630% 1,400,000 0.58630%Unsecured loans from a bank due on February 26, 2030 1,000,000 0.58630% 1,000,000 0.58630%Unsecured loans from banks due on May 27, 2030 7,000,000 0.54630% 7,000,000 0.54630%Unsecured loans from a bank due on May 27, 2030 800,000 0.52630% 800,000 0.52630%Unsecured loans from a bank due on May 27, 2030 1,000,000 0.53250% 1,000,000 0.53250%Unsecured loans from a bank due on May 27, 2030 1,000,000 0.55988% 1,000,000 0.55988%Unsecured loans from a bank due on May 27, 2030 500,000 0.50485% 500,000 0.50485%Unsecured loans from a bank due on May 27, 2030 720,000 0.59399% 720,000 0.59399%Unsecured loans from a bank due on May 27, 2030 — — 1,430,000 0.45862%Unsecured loans from banks due on August 26, 2030 2,000,000 0.56500% 2,000,000 0.56500%Unsecured loans from a bank due on August 26, 2030 1,100,000 0.54500% 1,100,000 0.54500%Unsecured loans from a bank due on August 26, 2030 300,000 0.54500% 300,000 0.54500%Unsecured loans from banks due on August 26, 2030 500,000 0.52063% 500,000 0.52063%Unsecured loans from a bank due on August 26, 2030 1,000,000 0.46000% 1,000,000 0.46000%Unsecured loans from a bank due on August 26, 2030 — — 1,000,000 0.56068%Unsecured loans from a bank due on October 28, 2030 1,100,000 1.92250% 1,100,000 1.92250%Unsecured loans from a bank due on October 28, 2030 1,100,000 1.91700% 1,100,000 1.91700%Unsecured loans from a bank due on November 26, 2030 350,000 0.42630% 350,000 0.42630%Unsecured loans from a bank due on November 26, 2030 500,000 0.53630% 500,000 0.53630%Unsecured loans from a bank due on November 26, 2030 — — 2,000,000 0.59763%Unsecured loans from a bank due on November 26, 2030 — — 1,000,000 0.59819%Unsecured loans from a bank due on February 26, 2031 700,000 0.67750% 700,000 0.67750%
As of February 28, 2021 As of August 31, 2021
Amount (Thousands of Yen)
Weighted-average interest
rate (Note 1)
Amount (Thousands of Yen)
Weighted-average interest
rate (Note 1)
Unsecured loans from a bank due on February 26, 2031 2,000,000 0.67750% 2,000,000 0.67750%Unsecured loans from banks due on February 26, 2031 4,000,000 0.67750% 4,000,000 0.67750%Unsecured loans from a bank due on February 26, 2031 400,000 0.50000% 400,000 0.50000%Unsecured loans from a bank due on February 26, 2031 420,000 0.65750% 420,000 0.65750%Unsecured loans from a bank due on February 26, 2031 — — 2,750,000 0.50226%Unsecured loans from a bank due on February 26, 2031 — — 1,800,000 0.52198%Unsecured loans from banks due on May 26, 2031 — — 6,000,000 0.64130%Unsecured loans from a bank due on May 26, 2031 — — 3,500,000 0.64242%Unsecured loans from a bank due on May 26, 2025 (Note 3) 668,300 2.17000% 646,900 2.17000%Unsecured loans from a bank due on May 26, 2025 (Note 3) 668,300 2.21812% 646,900 2.21812% Total 485,841,600 485,798,800
Note 1: The weighted-average interest rate is weighted by the balance of each borrowing at the end of the period and rounded to the nearest fifth decimal place. As for the borrowings, hedged by interest-rate swaps for the purpose of avoiding interest rate fluctuation risk, the swapped interest rates are used to calculate the weighted-average interest rate.
Note 2: At the end of the period, these loans are accounted for under current liabilities on the balance sheets as the current portion of long-term borrowings.Note 3: Installments of ¥10.7 million will be made on the 26th day of every third month starting on August 26, 2013, with the remaining payment of ¥497.1 million to be
repaid on May 26, 2025.
The scheduled repayment amounts of long-term debt for each of the five years after the balance sheet date are as follows. Thousands of Yen
Within a year 1-2 years 2-3 years 3-4 years 4-5 yearsAs of February 28, 2021 58,760,600 58,615,600 50,765,600 44,435,600 52,694,200As of August 31, 2021 55,090,600 64,435,600 47,935,600 48,387,000 54,100,000
Note 1: The Company entered into ¥10,000 million of credit facilities in the form of commitment lines with two financial institutions for the fiscal period ended February 28, 2021. The total unused amount of such credit facilities was ¥10,000 million as of February 28, 2021.
Note 2: The Company entered into ¥40,000 million of credit facilities in the form of commitment lines with four financial institutions for the fiscal period ended February 28, 2021. The total unused amount of such credit facilities was ¥40,000 million as of February 28, 2021.
Note 3: The Company entered into ¥10,000 million of credit facilities in the form of commitment lines with two financial institutions for the fiscal period ended August 31, 2021. The total unused amount of such credit facilities was ¥10,000 million as of August 31, 2021.
Note 4: The Company entered into ¥40,000 million of credit facilities in the form of commitment lines with four financial institutions for the fiscal period ended August 31, 2021. The total unused amount of such credit facilities was ¥40,000 million as of August 31, 2021.

NOTES TO FINANCIAL STATEMENTS
Financing Status PortfolioManagement Strategy Investor InformationESG Measures Financial SectionMessage from the Management
47 48Nomura Real Estate Master Fund, Inc. Nomura Real Estate Master Fund, Inc.
8. INVESTMENT CORPORATION BONDSDetails of investment corporation bonds outstanding are summarized as follows.
As of February 28, 2021 As of August 31, 2021
Amount (Thousands of Yen)
Interest rate(Note 1)
Amount (Thousands of Yen)
Interest rate (Note 1)
Former NMF's 1st series of unsecured investment corpo-ration bonds due on October 30, 2024
3,000,000 0.87% 3,000,000 0.87%
NOF's 10th series of unsecured investment corporation bonds due on November 25, 2024
6,000,000 1.02% 6,000,000 1.02%
NMF's 2nd series of unsecured investment corporation bonds due on November 16, 2027
2,000,000 0.59% 2,000,000 0.59%
NOF's 7th series of unsecured investment corporation bonds due on March 17, 2028
4,500,000 2.90% 4,500,000 2.90%
NMF's 4th series of unsecured investment corporation bonds due on September 20, 2029 (green bonds)
3,000,000 0.53% 3,000,000 0.53%
NMF's 6th series of unsecured investment corporation bonds due on August 14, 2030 (green bonds)
7,000,000 0.54% 7,000,000 0.54%
NMF's 3rd series of unsecured investment corporation bonds due on May 21, 2038
1,500,000 1.03% 1,500,000 1.03%
NMF's 5th series of unsecured investment corporation bonds due on September 20, 2039
5,000,000 0.90% 5,000,000 0.90%
32,000,000 32,000,000
Note 1: The interest rate is rounded to the nearest second decimal place.
The scheduled redemption amounts of investment corporation bonds for each of the five years after the balance sheet date are as follows. Thousands of Yen
Within a year 1-2 years 2-3 years 3-4 years 4-5 yearsAs of February 28, 2021 — — — 9,000,000 —As of August 31, 2021 — — — 9,000,000 —
9. UNITHOLDERS’ EQUITYNMF issues only non-par value investment units in accordance with the Investment Trust Act. The entire amount of the issue price of new units is designated as stated capital. NMF is required to maintain net assets of at least ¥50,000 thousand as set forth in the Investment Trust Act.
10. ALLOWANCE FOR TEMPORARY DIFFERENCE ADJUSTMENTSThe movement in the allowance for temporary difference adjustments on the Balance Sheet was as follows:
For the period from September 1, 2020 to February 28, 2021
1. Reason, related assets and amounts Thousands of Yen
Related assets, etc. ReasonInitial
amount
Balance at the end of previous period
Allowance set aside
during period
Reversal during period
Balance at the end of
current period
Reason for reversal
GoodwillAmortization of goodwill
19,978,097 11,409,812 1,783,145 — 13,192,958 —
Land, buildings, etc. Merger expenses 4,029,135 1,322,694 (5,515) — 1,317,179 —
Deferred gains or losses on hedges
Loss on interest-rate swaps recognized at the end of the fiscal period
2,867,594 783,330 — (299,087) 484,242Changes in fair value of deriva-
tive transactions
Increase - subtotal — 13,515,837 1,777,630 (299,087) 14,994,380 — Total — 13,515,837 1,777,630 (299,087) 14,994,380 —
2. Method of reversal(1) Amortization of goodwill
In principle, amortization of goodwill is not reversed.
(2) Merger expenses
Item Method of reversalBuildings, etc. Upon depreciation and sale, etc., the corresponding amount is scheduled to be reversed.Land Upon sale, etc., the corresponding amount is scheduled to be reversed.Buildings in trust, etc. Upon depreciation or sale, etc., the corresponding amount is scheduled to be reversed.Land in trustLeasehold rightsLeasehold rights in trust
Upon sale, etc., the corresponding amount is scheduled to be reversed.
(3) Deferred gains or losses on hedgesBased on changes in the fair value of derivatives used as hedging instruments, the corresponding amount is scheduled to be reversed.
For the period from March 1, 2021 to August 31, 2021
1. Reason, related assets and amounts
Thousands of Yen
Related assets, etc. ReasonInitial
amount
Balance at the end of previous period
Allowance set aside
during period
Reversal during period
Balance at the end of
current period
Reason for reversal
GoodwillAmortization of goodwill
22,600,340 13,192,958 1,769,017 — 14,961,976 —
Land, buildings, etc. Merger expenses 4,029,135 1,317,179 (5,533) — 1,311,646 —
Deferred gains or losses on hedges
Loss on interest-rate swaps recognized at the end of the fiscal period
2,867,594 484,242 — (132,888) 351,354Changes in fair value of deriva-tive transactions
Increase - subtotal — 14,994,380 1,763,484 (132,888) 16,624,976 — Total — 14,994,380 1,763,484 (132,888) 16,624,976 —

NOTES TO FINANCIAL STATEMENTS
Financing Status PortfolioManagement Strategy Investor InformationESG Measures Financial SectionMessage from the Management
49 50Nomura Real Estate Master Fund, Inc. Nomura Real Estate Master Fund, Inc.
2. Method of reversal(1) Amortization of goodwill
In principle, amortization of goodwill is not reversed.
(2) Merger expenses
Item Method of reversalBuildings, etc. Upon depreciation and sale, etc., the corresponding amount is scheduled to be reversed.Land Upon sale, etc., the corresponding amount is scheduled to be reversed.Buildings in trust, etc. Upon depreciation or sale, etc., the corresponding amount is scheduled to be reversed.Land in trustLeasehold rightsLeasehold rights in trust
Upon sale, etc., the corresponding amount is scheduled to be reversed.
(3) Deferred gains or losses on hedgesBased on changes in the fair value of derivatives used as hedging instruments, the corresponding amount is scheduled to be reversed.
11. PER UNIT INFORMATIONThe net asset values per unit and the net income per unit as of February 28, 2021 and August 31, 2021 were as follows:
For the periodfrom September 1, 2020
to February 28, 2021
For the periodfrom March 1, 2021to August 31, 2021
Net assets per unit 132,129 131,468Net income per unit 2,760 2,637
Note 1: The net income per unit is calculated by dividing net income by the weighted-average number of units outstanding.Note 2: The basis for calculating net income per unit is as follows.
For the periodfrom September 1, 2020
to February 28, 2021
For the periodfrom March 1, 2021to August 31, 2021
Net income (Thousands of Yen) 13,016,610 12,434,161Amount not available to ordinary unitholders (Thousands of Yen) — —Net income available to ordinary unitholders (Thousands of Yen) 13,016,610 12,434,161Average number of units during the period (Units) 4,715,200 4,715,200
12. RELATED PARTY TRANSACTIONSFor the periods from September 1, 2020 to February 28, 2021 and from March 1, 2021 to August 31, 2021
Parent Company and major corporate unitholdersNot applicable
Subsidiaries and affiliatesNot applicable
Fellow subsidiary companiesNot applicable
Directors and major individual unitholdersNot applicable
13. INCOME TAXESThe Company, as an investment corporation, is subject to corporate income taxes at a statutory tax rate of approximately 31.46% for the fiscal period ended August 31, 2021. However, the Company may deduct dividend distributions paid to its unitholders from its taxable income amounts, provided such distributions meet the requirements under the Act on Special Measures Concerning Taxation of Japan. Under this act, an investment corporation must meet a number of tax requirements, including a requirement to distribute in excess of 90% of its distributable income for the fiscal period, in order to deduct such amounts. If the investment corporation does not satisfy all of the requirements, the entire taxable income of the investment corporation will be subject to regular corporate income taxes.
Since the Company distributed in excess of 90% of its distributable income in the form of cash distributions totaling ¥15,503,577 thousand for the fiscal period ended August 31, 2021 such distributions were treated as deductible distributions for purposes of corporate income taxes.
The following summarizes breakdown of deferred tax assets and liabilities: Thousands of Yen
For the periodfrom September 1, 2020
to February 28, 2021
For the periodfrom March 1, 2021to August 31, 2021
Deferred tax asset: Valuation difference on other assets acquired by merger 19,717,747 19,486,187 Deferred gains or losses on hedges 110,536 62,081 Unearned revenue 40,685 23,623 Write-offs for long-term prepaid expenses 3,237 991 Depreciation costs of trust leasehold rights 1,702 1,824 Non-deductible accrued enterprise tax 22 27 Subtotal 19,873,932 19,574,735 Valuation allowance (19,873,932) (19,574,735) Total non-current deferred tax assets — — Total deferred tax assets — —Net deferred tax assets — —
The following summarizes the significant differences between the statutory tax rate and the effective tax rate.
For the periodfrom September 1, 2020
to February 28, 2021
For the periodfrom March 1, 2021to August 31, 2021
Statutory tax rate 31.46% 31.46%Deductible cash distributions (35.72%) (36.07%)Valuation of allowance (2.07%) (2.02%)Amortization of goodwill 6.34% 6.63%Other 0.00% 0.00%Effective tax rate 0.01% 0.01%
14. FINANCIAL INSTRUMENTSOverview(1) Policy for Financial Instruments
Upon acquisition of property-related assets, the Company may raise funds through certain financing methods including borrowings, issuance of investment corporation bonds and issuance of investment units. In financing through interest-bear-ing debt, to secure stable financing capability and reduce future risks of rising interest rates, the Company’s investment policy is to secure longer-term, fixed-rate borrowings with well-diversified maturities.
The Company enters into derivative transactions only for the purpose of reducing risk of future interest rate fluctuations and does not engage in speculative transactions.
(2) Type and Risk of Financial Instruments and Related Risk ManagementBorrowings and investment corporation bonds are primarily used to fund the acquisition of property-related assets as well as the repayment of debts and redemption of investment corporation bonds. The Company is exposed to liquidity risk of being
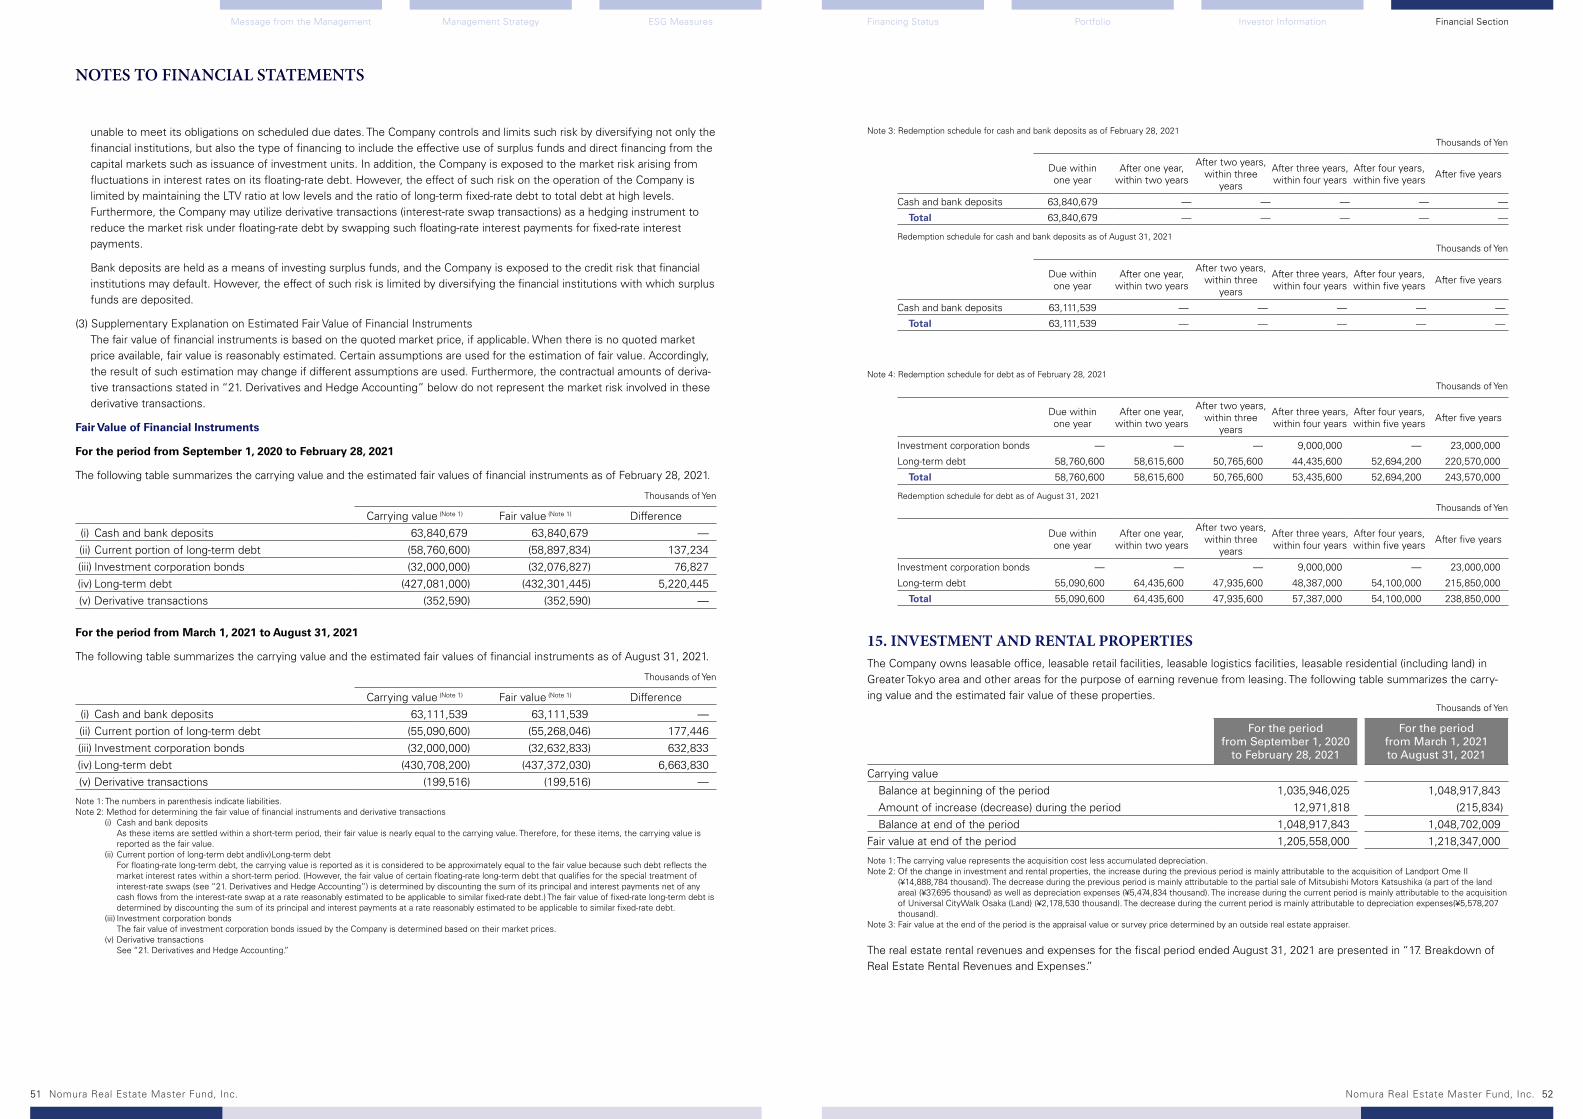
NOTES TO FINANCIAL STATEMENTS
Financing Status PortfolioManagement Strategy Investor InformationESG Measures Financial SectionMessage from the Management
51 52Nomura Real Estate Master Fund, Inc. Nomura Real Estate Master Fund, Inc.
unable to meet its obligations on scheduled due dates. The Company controls and limits such risk by diversifying not only the financial institutions, but also the type of financing to include the effective use of surplus funds and direct financing from the capital markets such as issuance of investment units. In addition, the Company is exposed to the market risk arising from fluctuations in interest rates on its floating-rate debt. However, the effect of such risk on the operation of the Company is limited by maintaining the LTV ratio at low levels and the ratio of long-term fixed-rate debt to total debt at high levels. Furthermore, the Company may utilize derivative transactions (interest-rate swap transactions) as a hedging instrument to reduce the market risk under floating-rate debt by swapping such floating-rate interest payments for fixed-rate interest payments.
Bank deposits are held as a means of investing surplus funds, and the Company is exposed to the credit risk that financial institutions may default. However, the effect of such risk is limited by diversifying the financial institutions with which surplus funds are deposited.
(3) Supplementary Explanation on Estimated Fair Value of Financial InstrumentsThe fair value of financial instruments is based on the quoted market price, if applicable. When there is no quoted market price available, fair value is reasonably estimated. Certain assumptions are used for the estimation of fair value. Accordingly, the result of such estimation may change if different assumptions are used. Furthermore, the contractual amounts of deriva-tive transactions stated in “21. Derivatives and Hedge Accounting” below do not represent the market risk involved in these derivative transactions.
Fair Value of Financial Instruments
For the period from September 1, 2020 to February 28, 2021
The following table summarizes the carrying value and the estimated fair values of financial instruments as of February 28, 2021.
Thousands of Yen
Carrying value (Note 1) Fair value (Note 1) Difference(i) Cash and bank deposits 63,840,679 63,840,679 —(ii) Current portion of long-term debt (58,760,600) (58,897,834) 137,234(iii) Investment corporation bonds (32,000,000) (32,076,827) 76,827(iv) Long-term debt (427,081,000) (432,301,445) 5,220,445(v) Derivative transactions (352,590) (352,590) —
For the period from March 1, 2021 to August 31, 2021
The following table summarizes the carrying value and the estimated fair values of financial instruments as of August 31, 2021.
Thousands of Yen
Carrying value (Note 1) Fair value (Note 1) Difference(i) Cash and bank deposits 63,111,539 63,111,539 —(ii) Current portion of long-term debt (55,090,600) (55,268,046) 177,446(iii) Investment corporation bonds (32,000,000) (32,632,833) 632,833(iv) Long-term debt (430,708,200) (437,372,030) 6,663,830(v) Derivative transactions (199,516) (199,516) —
Note 1: The numbers in parenthesis indicate liabilities.Note 2: Method for determining the fair value of financial instruments and derivative transactions (i) Cash and bank deposits As these items are settled within a short-term period, their fair value is nearly equal to the carrying value. Therefore, for these items, the carrying value is
reported as the fair value. (ii) Current portion of long-term debt and(iv)Long-term debt For floating-rate long-term debt, the carrying value is reported as it is considered to be approximately equal to the fair value because such debt reflects the
market interest rates within a short-term period. (However, the fair value of certain floating-rate long-term debt that qualifies for the special treatment of interest-rate swaps (see “21. Derivatives and Hedge Accounting”) is determined by discounting the sum of its principal and interest payments net of any cash flows from the interest-rate swap at a rate reasonably estimated to be applicable to similar fixed-rate debt.) The fair value of fixed-rate long-term debt is determined by discounting the sum of its principal and interest payments at a rate reasonably estimated to be applicable to similar fixed-rate debt.
(iii) Investment corporation bonds The fair value of investment corporation bonds issued by the Company is determined based on their market prices. (v) Derivative transactions See “21. Derivatives and Hedge Accounting.”
Note 3: Redemption schedule for cash and bank deposits as of February 28, 2021 Thousands of Yen
Due within one year
After one year, within two years
After two years, within three
years
After three years, within four years
After four years, within five years After five years
Cash and bank deposits 63,840,679 — — — — —
Total 63,840,679 — — — — —
Redemption schedule for cash and bank deposits as of August 31, 2021 Thousands of Yen
Due within one year
After one year, within two years
After two years, within three
years
After three years, within four years
After four years, within five years After five years
Cash and bank deposits 63,111,539 — — — — —
Total 63,111,539 — — — — —
Note 4: Redemption schedule for debt as of February 28, 2021 Thousands of Yen
Due within one year
After one year, within two years
After two years, within three
years
After three years, within four years
After four years, within five years After five years
Investment corporation bonds — — — 9,000,000 — 23,000,000
Long-term debt 58,760,600 58,615,600 50,765,600 44,435,600 52,694,200 220,570,000
Total 58,760,600 58,615,600 50,765,600 53,435,600 52,694,200 243,570,000
Redemption schedule for debt as of August 31, 2021 Thousands of Yen
Due within one year
After one year, within two years
After two years, within three
years
After three years, within four years
After four years, within five years After five years
Investment corporation bonds — — — 9,000,000 — 23,000,000
Long-term debt 55,090,600 64,435,600 47,935,600 48,387,000 54,100,000 215,850,000
Total 55,090,600 64,435,600 47,935,600 57,387,000 54,100,000 238,850,000
15. INVESTMENT AND RENTAL PROPERTIESThe Company owns leasable office, leasable retail facilities, leasable logistics facilities, leasable residential (including land) in Greater Tokyo area and other areas for the purpose of earning revenue from leasing. The following table summarizes the carry-ing value and the estimated fair value of these properties. Thousands of Yen
For the periodfrom September 1, 2020
to February 28, 2021
For the periodfrom March 1, 2021to August 31, 2021
Carrying value Balance at beginning of the period 1,035,946,025 1,048,917,843 Amount of increase (decrease) during the period 12,971,818 (215,834) Balance at end of the period 1,048,917,843 1,048,702,009Fair value at end of the period 1,205,558,000 1,218,347,000
Note 1: The carrying value represents the acquisition cost less accumulated depreciation.Note 2: Of the change in investment and rental properties, the increase during the previous period is mainly attributable to the acquisition of Landport Ome II
(¥14,888,784 thousand). The decrease during the previous period is mainly attributable to the partial sale of Mitsubishi Motors Katsushika (a part of the land area) (¥37,695 thousand) as well as depreciation expenses (¥5,474,834 thousand). The increase during the current period is mainly attributable to the acquisition of Universal CityWalk Osaka (Land) (¥2,178,530 thousand). The decrease during the current period is mainly attributable to depreciation expenses(¥5,578,207 thousand).
Note 3: Fair value at the end of the period is the appraisal value or survey price determined by an outside real estate appraiser.
The real estate rental revenues and expenses for the fiscal period ended August 31, 2021 are presented in “17. Breakdown of Real Estate Rental Revenues and Expenses.”
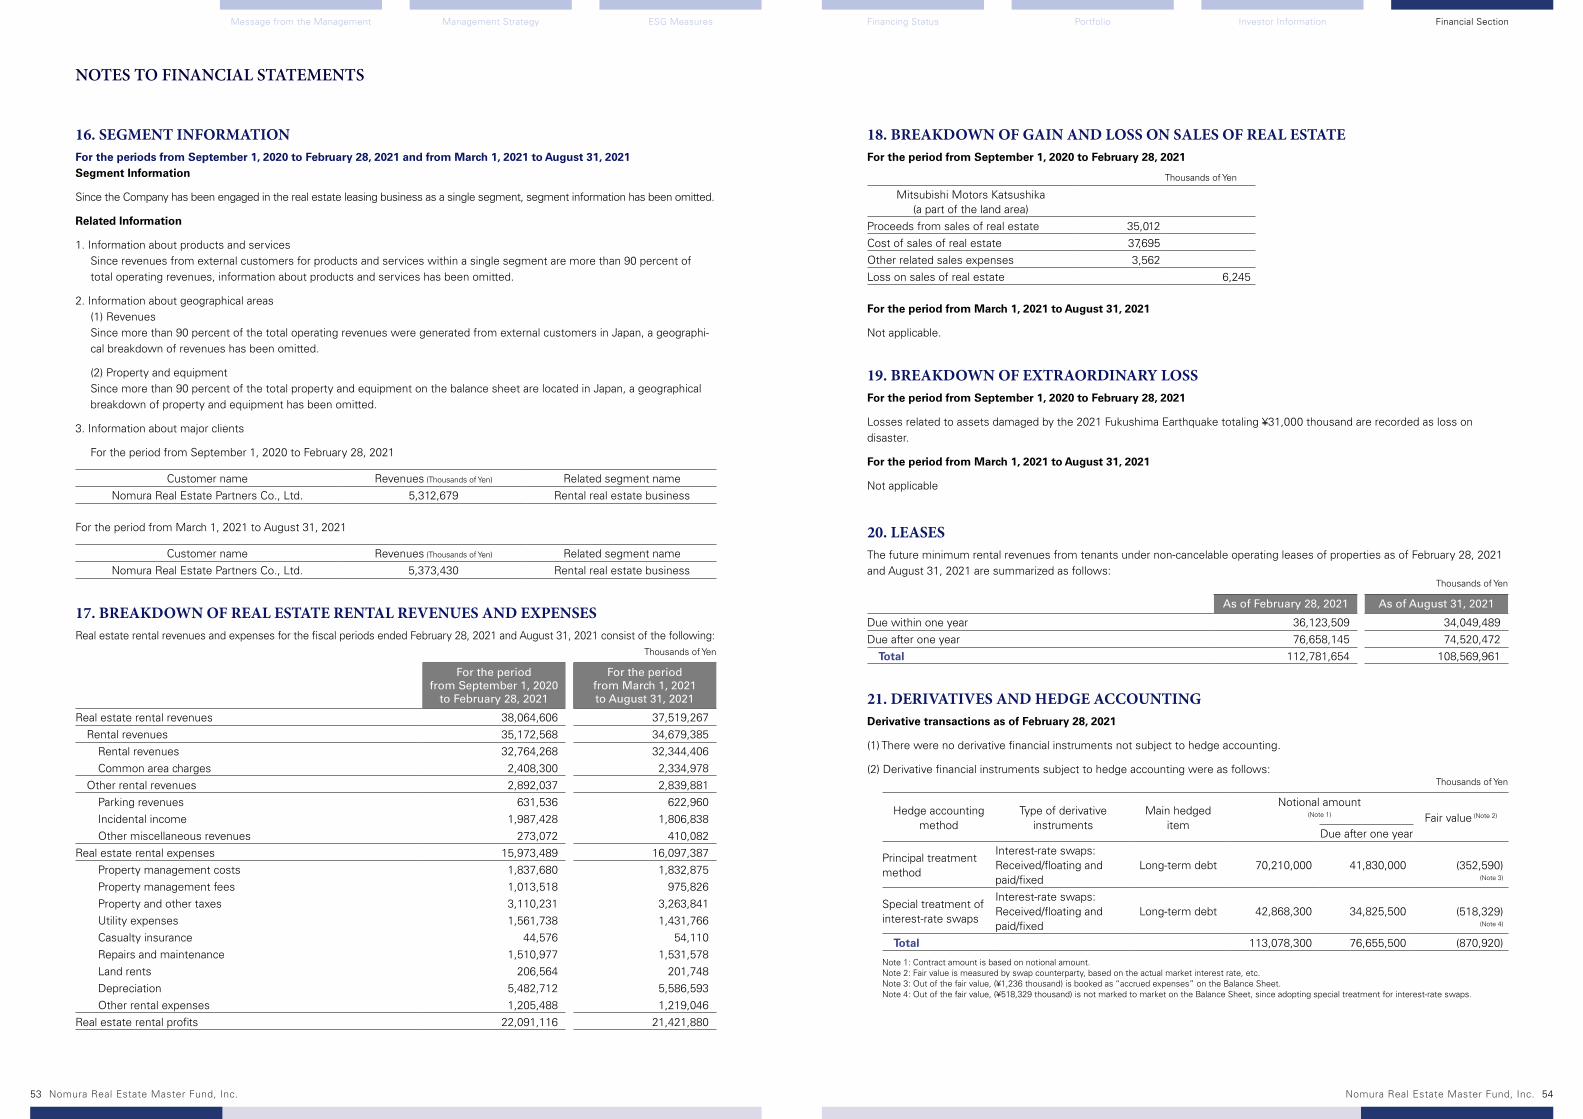
NOTES TO FINANCIAL STATEMENTS
Financing Status PortfolioManagement Strategy Investor InformationESG Measures Financial SectionMessage from the Management
53 54Nomura Real Estate Master Fund, Inc. Nomura Real Estate Master Fund, Inc.
16. SEGMENT INFORMATIONFor the periods from September 1, 2020 to February 28, 2021 and from March 1, 2021 to August 31, 2021 Segment Information
Since the Company has been engaged in the real estate leasing business as a single segment, segment information has been omitted.
Related Information
1. Information about products and servicesSince revenues from external customers for products and services within a single segment are more than 90 percent of total operating revenues, information about products and services has been omitted.
2. Information about geographical areas(1) RevenuesSince more than 90 percent of the total operating revenues were generated from external customers in Japan, a geographi-cal breakdown of revenues has been omitted.
(2) Property and equipmentSince more than 90 percent of the total property and equipment on the balance sheet are located in Japan, a geographical breakdown of property and equipment has been omitted.
3. Information about major clients
For the period from September 1, 2020 to February 28, 2021
Customer name Revenues (Thousands of Yen) Related segment nameNomura Real Estate Partners Co., Ltd. 5,312,679 Rental real estate business
For the period from March 1, 2021 to August 31, 2021
Customer name Revenues (Thousands of Yen) Related segment nameNomura Real Estate Partners Co., Ltd. 5,373,430 Rental real estate business
17. BREAKDOWN OF REAL ESTATE RENTAL REVENUES AND EXPENSESReal estate rental revenues and expenses for the fiscal periods ended February 28, 2021 and August 31, 2021 consist of the following: Thousands of Yen
For the periodfrom September 1, 2020
to February 28, 2021
For the periodfrom March 1, 2021to August 31, 2021
Real estate rental revenues 38,064,606 37,519,267 Rental revenues 35,172,568 34,679,385 Rental revenues 32,764,268 32,344,406 Common area charges 2,408,300 2,334,978 Other rental revenues 2,892,037 2,839,881 Parking revenues 631,536 622,960 Incidental income 1,987,428 1,806,838 Other miscellaneous revenues 273,072 410,082Real estate rental expenses 15,973,489 16,097,387 Property management costs 1,837,680 1,832,875 Property management fees 1,013,518 975,826 Property and other taxes 3,110,231 3,263,841 Utility expenses 1,561,738 1,431,766 Casualty insurance 44,576 54,110 Repairs and maintenance 1,510,977 1,531,578 Land rents 206,564 201,748 Depreciation 5,482,712 5,586,593 Other rental expenses 1,205,488 1,219,046Real estate rental profits 22,091,116 21,421,880
18. BREAKDOWN OF GAIN AND LOSS ON SALES OF REAL ESTATEFor the period from September 1, 2020 to February 28, 2021
Thousands of Yen
Mitsubishi Motors Katsushika(a part of the land area)
Proceeds from sales of real estate 35,012Cost of sales of real estate 37,695Other related sales expenses 3,562Loss on sales of real estate 6,245
For the period from March 1, 2021 to August 31, 2021
Not applicable.
19. BREAKDOWN OF EXTRAORDINARY LOSSFor the period from September 1, 2020 to February 28, 2021
Losses related to assets damaged by the 2021 Fukushima Earthquake totaling ¥31,000 thousand are recorded as loss on disaster.
For the period from March 1, 2021 to August 31, 2021
Not applicable
20. LEASESThe future minimum rental revenues from tenants under non-cancelable operating leases of properties as of February 28, 2021 and August 31, 2021 are summarized as follows: Thousands of Yen
As of February 28, 2021 As of August 31, 2021
Due within one year 36,123,509 34,049,489Due after one year 76,658,145 74,520,472 Total 112,781,654 108,569,961
21. DERIVATIVES AND HEDGE ACCOUNTINGDerivative transactions as of February 28, 2021
(1) There were no derivative financial instruments not subject to hedge accounting.
(2) Derivative financial instruments subject to hedge accounting were as follows: Thousands of Yen
Hedge accounting method
Type of derivative instruments
Main hedged item
Notional amount (Note 1) Fair value (Note 2)
Due after one year
Principal treatment method
Interest-rate swaps: Received/floating and paid/fixed
Long-term debt 70,210,000 41,830,000 (352,590) (Note 3)
Special treatment of interest-rate swaps
Interest-rate swaps: Received/floating and paid/fixed
Long-term debt 42,868,300 34,825,500 (518,329) (Note 4)
Total 113,078,300 76,655,500 (870,920)
Note 1: Contract amount is based on notional amount.Note 2: Fair value is measured by swap counterparty, based on the actual market interest rate, etc.Note 3: Out of the fair value, (¥1,236 thousand) is booked as “accrued expenses” on the Balance Sheet.Note 4: Out of the fair value, (¥518,329 thousand) is not marked to market on the Balance Sheet, since adopting special treatment for interest-rate swaps.

NOTES TO FINANCIAL STATEMENTS
Financing Status PortfolioManagement Strategy Investor InformationESG Measures Financial SectionMessage from the Management
55 56Nomura Real Estate Master Fund, Inc. Nomura Real Estate Master Fund, Inc.
Derivative transactions as of August 31, 2021
(1) There were no derivative financial instruments not subject to hedge accounting.
(2) Derivative financial instruments subject to hedge accounting were as follows: Thousands of Yen
Hedge accounting method
Type of derivative instruments
Main hedged item
Notional amount (Note 1) Fair value (Note 2)
Due after one year
Principal treatment method
Interest-rate swaps: Received/floating and paid/fixed
Long-term debt 58,730,000 34,350,000 (199,516)
(Note 3)
Special treatment of interest-rate swaps
Interest-rate swaps: Received/floating and paid/fixed
Long-term debt 34,846,900 29,304,100 (531,285) (Note 4)
Total 93,576,900 63,654,100 (730,802)
Note 1: Contract amount is based on notional amount.Note 2: Fair value is measured by swap counterparty, based on the actual market interest rate, etc.Note 3: Out of the fair value, (¥2,184 thousand) is booked as “accrued expenses” on the Balance Sheet.Note 4: Out of the fair value, (¥531,285 thousand) is not marked to market on the Balance Sheet, since adopting special treatment for interest-rate swaps.
22. CASH DISTRIBUTIONS Yen
For the periodfrom September 1, 2020
to February 28, 2021
For the periodfrom March 1, 2021to August 31, 2021
1. Retained earnings at end of period 13,503,646,955 12,786,253,162
2. Distributions in excess of retained earnings 2,682,948,800 3,069,595,200 Of which, allowance for temporary difference adjustment 1,763,484,800 1,824,782,400 Of which, other distributions in excess of net income 919,464,000 1,244,812,800
3. Incorporation into unitholders’ capital 132,888,372 154,021,761 Of which, reversal of allowance for temporary difference adjustments 132,888,372 154,021,761
4. Distributions 15,701,616,000 15,503,577,600 [Distributions (per unit)] (3,330) (3,288) Of which, distributions of earnings 13,018,667,200 12,433,982,400 [Of which, distributions of earnings (per unit)] (2,761) (2,637) Of which, allowance for temporary difference adjustments 1,763,484,800 1,824,782,400 [Of which, allowance for temporary difference adjustments (per unit)] (374) (387) Of which, other distributions in excess of net income 919,464,000 1,244,812,800 [Of which, other distributions in excess of net income (per unit)] (195) (264)
5. Retained earnings carried forward 352,091,383 198,249,001
Calculation method of distribution amount
NMF calculates distributions in accordance with the cash distribution policies as specified in Article 36, Paragraphs 1 and 2 of NMF’s Articles of Incorporation.
For the fiscal period under review, NMF decided to implement a total of ¥15,503,577,600 in distributions (¥3,288 per investment unit). This figure was arrived at by adding to ¥12,434,161,779 in net income after taxes ¥2,622,242,820 in amortization of good-will, and by adding ¥447,173,001 in consideration of temporary decrease in operating revenues due to the impact of COVID-19 pandemic on per-unit distribution.
Total distributions comprise distribution of earnings and distribution in excess of net income. Distribution of earnings as stipu-lated in Article 136, Paragraph 1 of the Investment Trusts Act came to ¥12,433,982,400 (¥2,637 per investment unit). Distribution in excess of net income comprises a distribution of ¥1,824,782,400 (¥387 per investment unit) as allowance for temporary difference adjustment and ¥1,244,812,800 (¥264 per investment unit) in other distribution in excess of net income.
23. INFORMATION ON ALLOWANCE FOR TEMPORARY DIFFERENCE ADJUSTMENTSFor the period from September 1, 2020 to February 28, 2021
1. Reason for provision, related assets and amounts Thousands of Yen
Related assets, etc. Reason for provisionProvision of allowance
for temporary difference adjustments
Goodwill Amortization of goodwill 2,622,242Long-term deposits Shortfall of reserve for repairs 6,013Increase-subtotal 2,628,256Buildings, facilities, etc. Depreciation deficiency equivalent (792,086)Unearned revenue Write-down of loss on interest-rate swap due to merger (57,573)Land Cost of sales of land (134)Others — (14,976)Decrease-subtotal (864,771) Total 1,763,484
2. Reason for reversal, related assets and amounts Thousands of Yen
Related assets, etc. Reason for reversalProvision of allowance
for temporary difference adjustments
Land, buildings, etc.Sale and depreciation of properties for which merger expenses were recorded
—(Note 1)
Deferred gains or losses on hedges Changes in fair value of derivatives (132,888) Total (132,888)
Note 1: The amount of reversal during the current fiscal period (¥5,533 thousand) is included in “Depreciation deficiency equivalent” on “1. Reasons for provision, related assets and amounts.”
3. Method of reversal(1) Amortization of goodwill In principle, amortization of goodwill is not reversed.
(2) Merger expenses
Item Method of reversalBuildings, etc. Upon depreciation or sale, the corresponding amount is scheduled to be reversed.Land Upon sale, the corresponding amount is scheduled to be reversed.Buildings in trust, etc. Upon depreciation or sale, the corresponding amount is scheduled to be reversed.Land in trust, etc.
Upon sale, the corresponding amount is scheduled to be reversed.LeaseholdLeasehold in trust
(3) Long-term deposits In principle, long-term deposits are not reserved.
(4) Deferred gains or losses on hedgesThe amount corresponding to changes in the fair value of derivatives used as hedging instruments is scheduled to be reversed.

NOTES TO FINANCIAL STATEMENTS
Financing Status PortfolioManagement Strategy Investor InformationESG Measures Financial SectionMessage from the Management
57 58Nomura Real Estate Master Fund, Inc. Nomura Real Estate Master Fund, Inc.
For the period from March 1, 2021 to August 31, 2021
1. Reason for provision, related assets and amounts Thousands of Yen
Related assets, etc. Reason for provisionProvision of allowance
for temporary difference adjustments
Goodwill Amortization of goodwill 2,622,242Long-term deposits Shortfall of reserve for repairs 7,161Increase-subtotal 2,629,404Buildings, facilities, etc. Depreciation deficiency equivalent (741,188)
Unearned revenue Write-down of loss on interest-rate swap due to merger (54,234)
Others — (9,199)Decrease-subtotal (804,622) Total 1,824,782
2. Reason for reversal, related assets and amounts Thousands of Yen
Related assets, etc. Reason for reversalProvision of allowance
for temporary difference adjustments
Land, Buildings, etc.Sale and depreciation of properties for which merger expenses were recorded
—(Note 1)
Deferred gains or losses on hedges Changes in fair value of derivatives (154,021) Total (154,021)
Note 1: The amount of reversal during the current fiscal period (¥5,440 thousand) is included in “Depreciation deficiency equivalent” on “1. Reasons for provision, related assets and amounts.”
3. Method of reversal(1) Amortization of goodwill In principle, amortization of goodwill is not reversed.
(2) Merger expenses
Item Method of reversalBuildings, etc. Upon depreciation or sale, the corresponding amount is scheduled to be reversed.Land Upon sale, the corresponding amount is scheduled to be reversed.Buildings in trust, etc. Upon depreciation or sale, the corresponding amount is scheduled to be reversed.Land in trust, etc.
Upon sale, the corresponding amount is scheduled to be reversedLeaseholdLeasehold in trust
(3) Long-term deposits In principle, long-term deposits are not reserved.
(4) Deferred gains or losses on hedges The amount corresponding to changes in the fair value of derivatives used as hedging instruments is scheduled to be reversed.
24. SIGNIFICANT SUBSEQUENT EVENTSAsset Sales
NMF sold the following asset subsequent to the 12th fiscal period (August 31, 2021).
(1) NMF Utsunomiya Building Type of asset Trust beneficiary interest in mainly real estate Use: Office Scheduled contract date: October 14, 2021 Scheduled transfer date: October 29, 2021 Scheduled transfer price: ¥2,720 million Buyer: A domestic corporation Impact on 13th fiscal period earnings (Scheduled): ¥162 million
The impact of (1), above, on earnings for the 13th fiscal period (September 1, 2021 to February 28, 2022) will be recorded as gain on sales of real estate under operating revenues.
Financing Status PortfolioManagement Strategy Investor InformationESG Measures Financial SectionMessage from the Management
59 60Nomura Real Estate Master Fund, Inc. Nomura Real Estate Master Fund, Inc.
INDEPENDENT AUDITOR’S REPORT

Financing Status PortfolioManagement Strategy Investor InformationESG Measures Financial SectionMessage from the Management
61 62Nomura Real Estate Master Fund, Inc. Nomura Real Estate Master Fund, Inc.
INDEPENDENT AUDITOR’S REPORT