Embed Size (px)
Citation preview
13 - 1©2003 Prentice Hall Business Publishing, Cost Accounting 11/e, Horngren/Datar/Foster
Strategy, Balanced Scorecard, and
Strategic Profitability Analysis
Strategy, Balanced Scorecard, and
Strategic Profitability AnalysisChapter 13
13 - 2©2003 Prentice Hall Business Publishing, Cost Accounting 11/e, Horngren/Datar/Foster
Learning Objective 1Learning Objective 1
Recognize which of two generic
strategies a company is using.
13 - 3©2003 Prentice Hall Business Publishing, Cost Accounting 11/e, Horngren/Datar/Foster
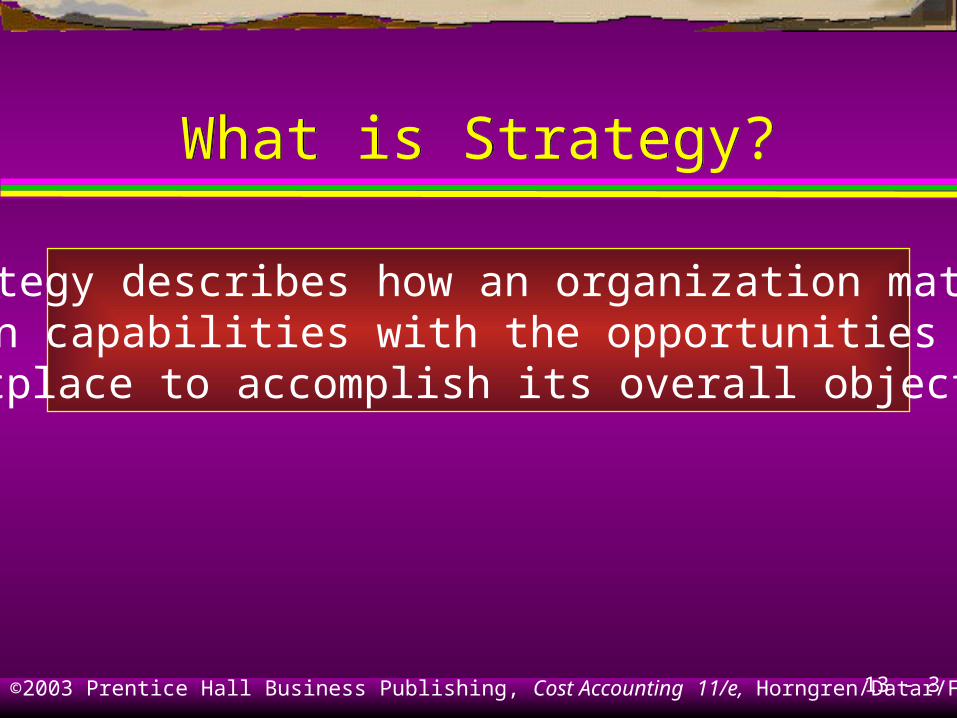
What is Strategy?What is Strategy?
Strategy describes how an organization matchesits own capabilities with the opportunities in themarketplace to accomplish its overall objectives.
13 - 4©2003 Prentice Hall Business Publishing, Cost Accounting 11/e, Horngren/Datar/Foster
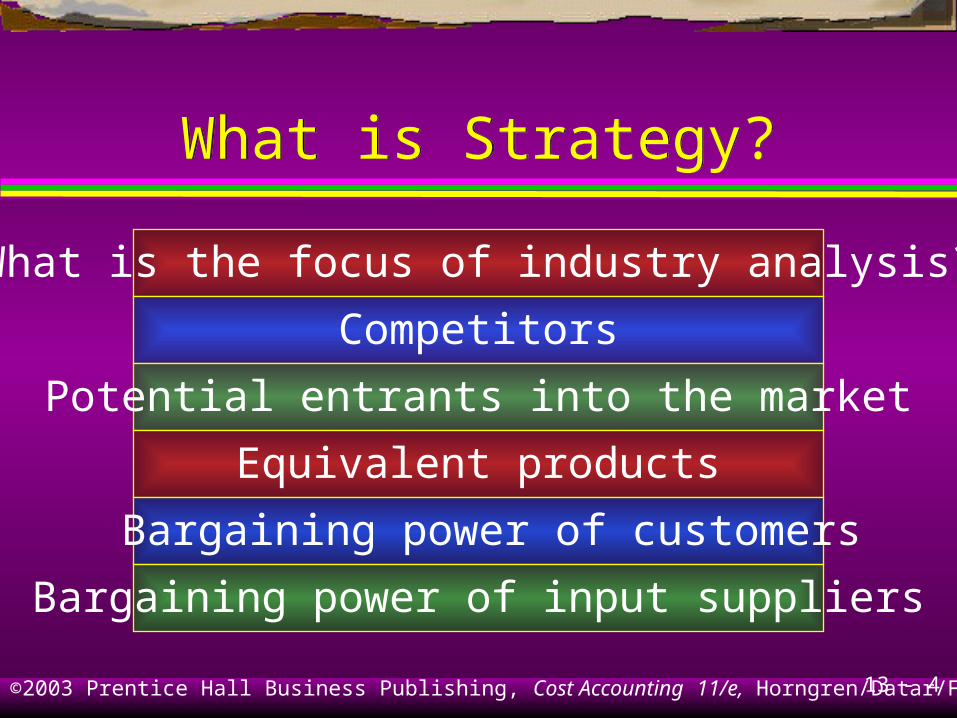
What is Strategy?What is Strategy?
What is the focus of industry analysis?
Competitors
Potential entrants into the market
Equivalent products
Bargaining power of customers
Bargaining power of input suppliers
13 - 5©2003 Prentice Hall Business Publishing, Cost Accounting 11/e, Horngren/Datar/Foster
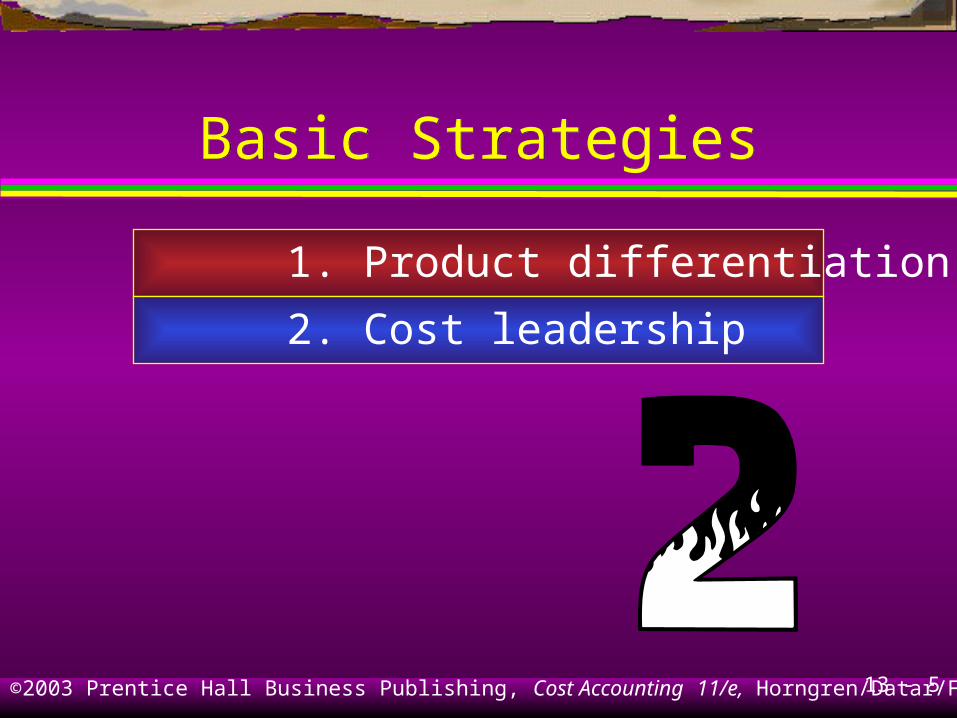
Basic StrategiesBasic Strategies
1. Product differentiation
2. Cost leadership
13 - 6©2003 Prentice Hall Business Publishing, Cost Accounting 11/e, Horngren/Datar/Foster
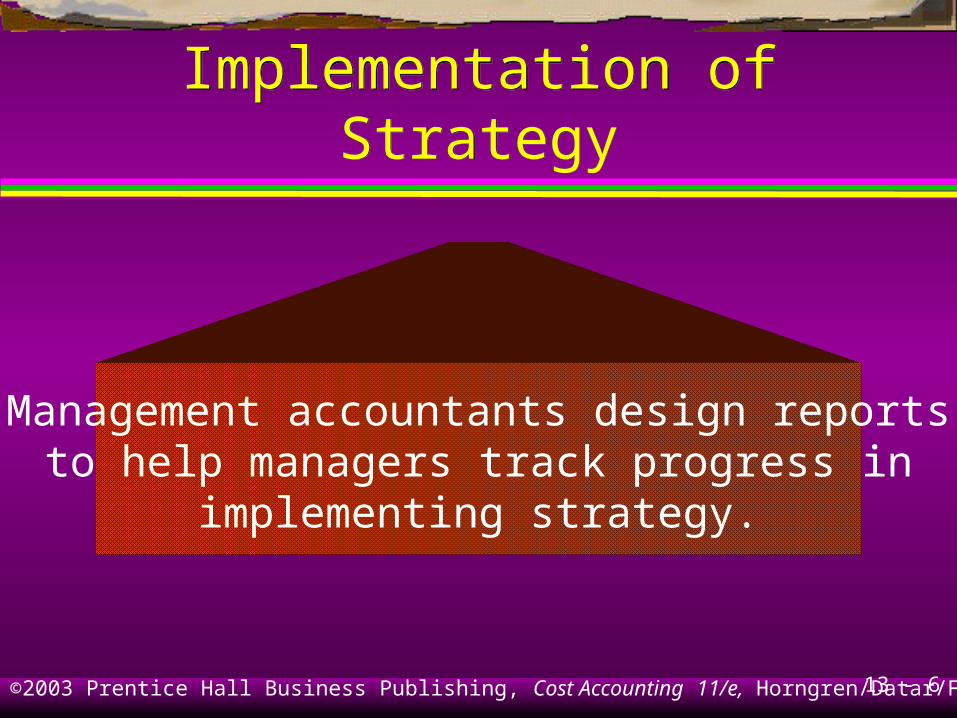
Implementation of StrategyImplementation of Strategy
Management accountants design reportsto help managers track progress in
implementing strategy.
13 - 7©2003 Prentice Hall Business Publishing, Cost Accounting 11/e, Horngren/Datar/Foster
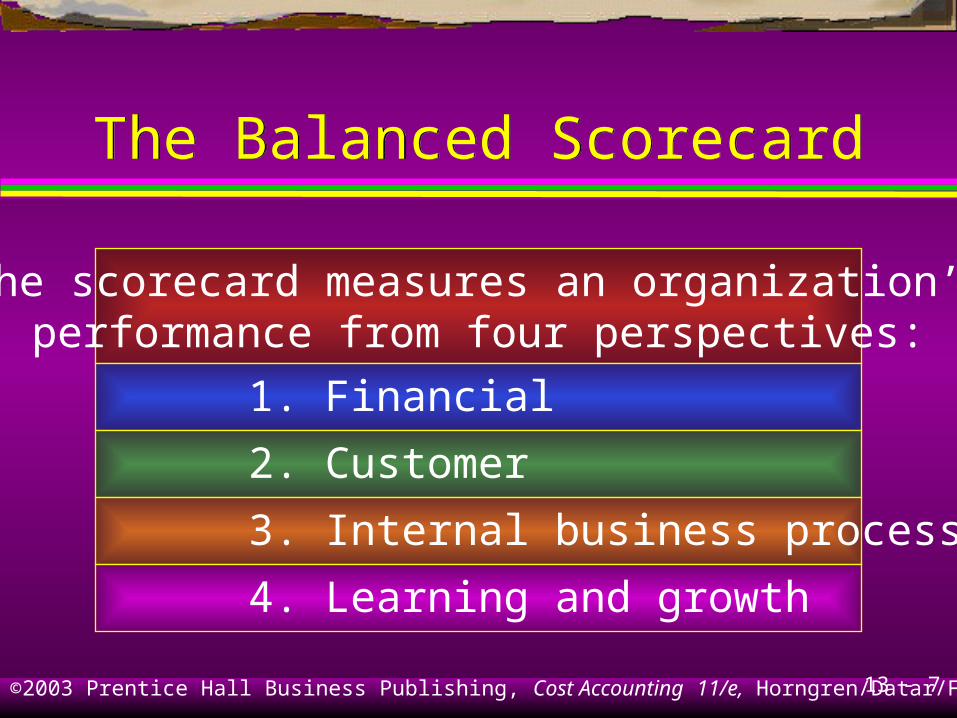
The Balanced ScorecardThe Balanced Scorecard
The scorecard measures an organization’sperformance from four perspectives:
1. Financial
2. Customer
3. Internal business processes
4. Learning and growth
13 - 8©2003 Prentice Hall Business Publishing, Cost Accounting 11/e, Horngren/Datar/Foster
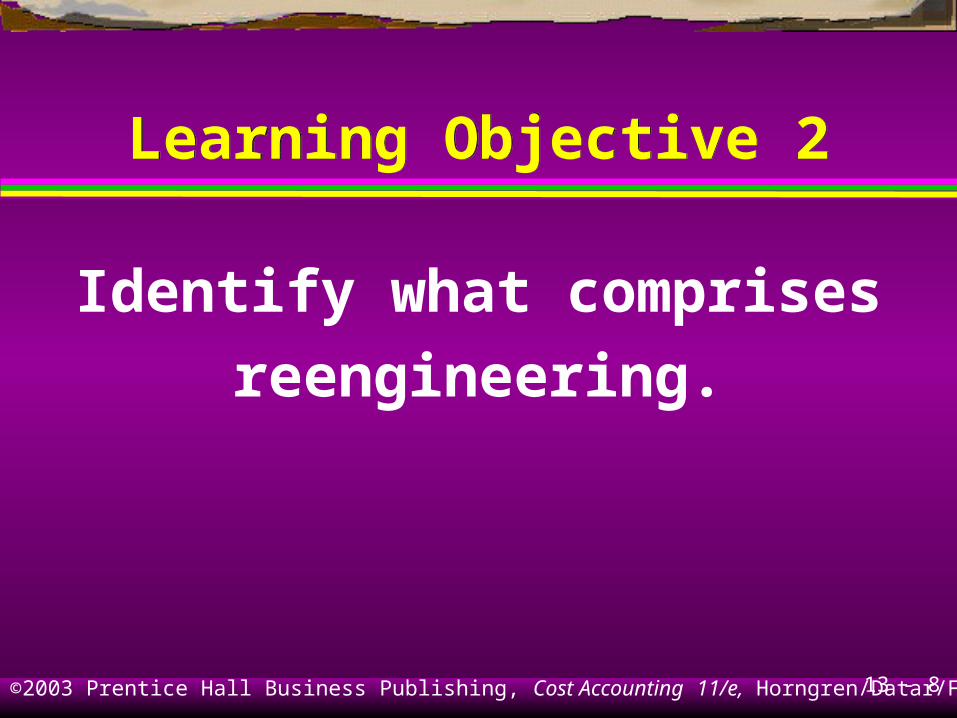
Learning Objective 2Learning Objective 2
Identify what comprises
reengineering.
13 - 9©2003 Prentice Hall Business Publishing, Cost Accounting 11/e, Horngren/Datar/Foster
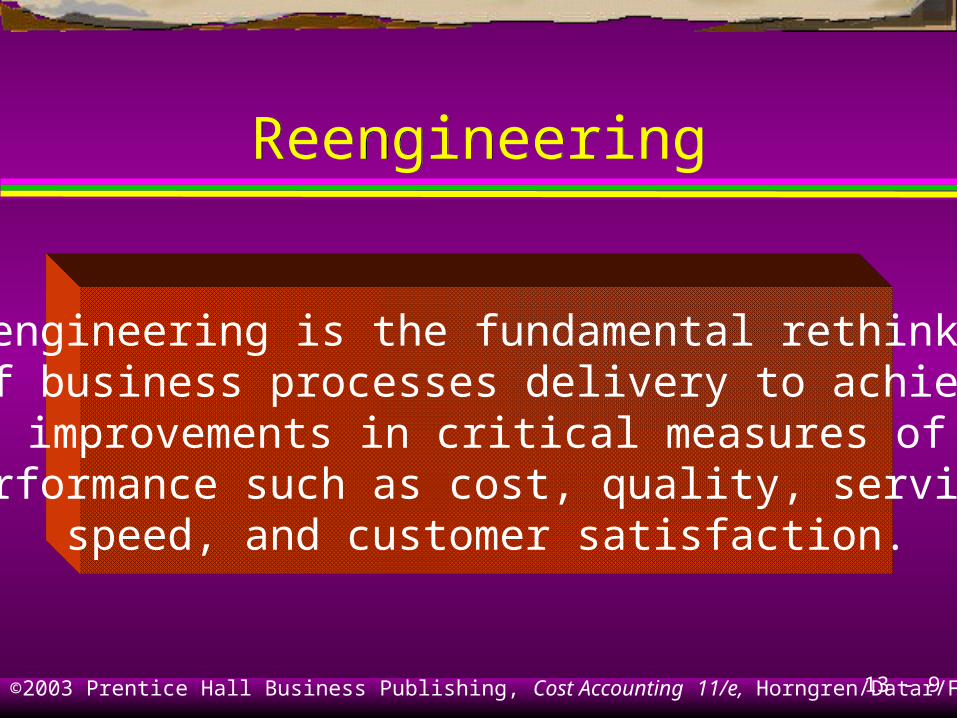
ReengineeringReengineering
Reengineering is the fundamental rethinkingof business processes delivery to achieve
improvements in critical measures ofperformance such as cost, quality, service,
speed, and customer satisfaction.
13 - 10©2003 Prentice Hall Business Publishing, Cost Accounting 11/e, Horngren/Datar/Foster
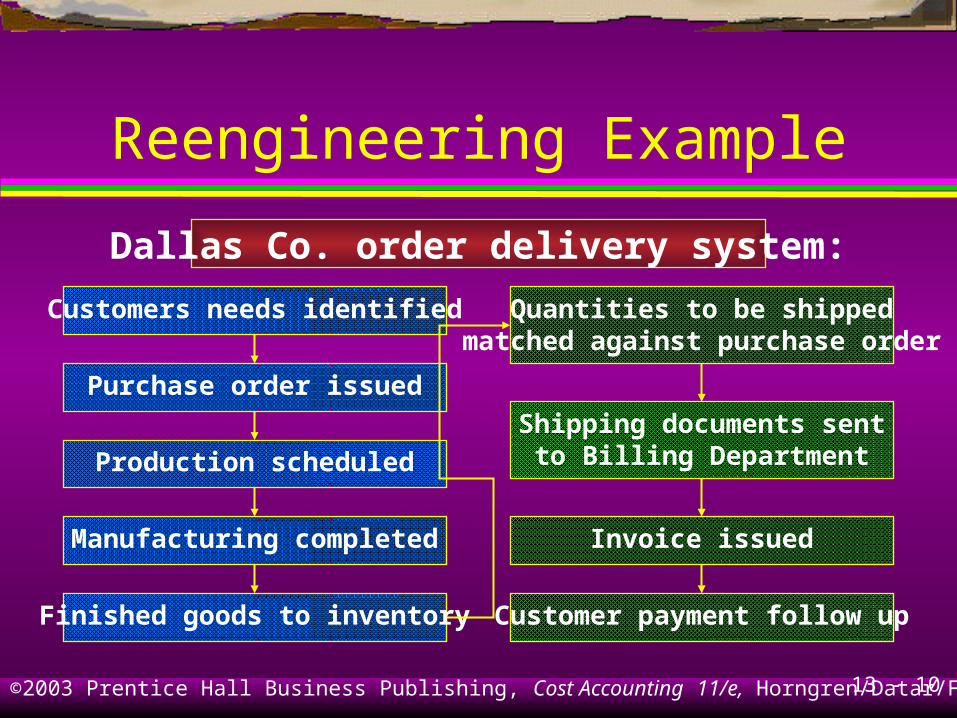
Reengineering ExampleReengineering Example
Customers needs identified
Purchase order issued
Production scheduled
Manufacturing completed
Finished goods to inventory
Quantities to be shippedmatched against purchase order
Shipping documents sentto Billing Department
Invoice issued
Customer payment follow up
Dallas Co. order delivery system:

13 - 11©2003 Prentice Hall Business Publishing, Cost Accounting 11/e, Horngren/Datar/Foster
Reengineering ExampleReengineering Example
The following was determined:
Frequently, there is a long waiting time beforeproduction begins in the manufacturing department.
Sometimes items are held in inventory untila truck is available for shipment.
13 - 12©2003 Prentice Hall Business Publishing, Cost Accounting 11/e, Horngren/Datar/Foster
Reengineering ExampleReengineering Example
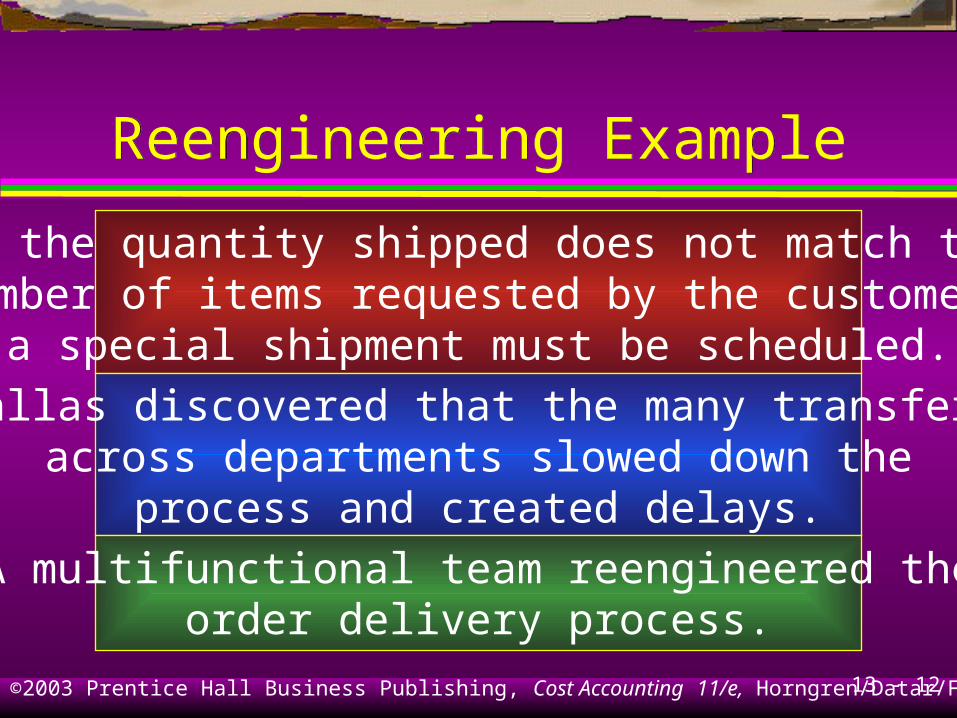
If the quantity shipped does not match thenumber of items requested by the customer,
a special shipment must be scheduled.
Dallas discovered that the many transfersacross departments slowed down the
process and created delays.
A multifunctional team reengineered theorder delivery process.
13 - 13©2003 Prentice Hall Business Publishing, Cost Accounting 11/e, Horngren/Datar/Foster
Reengineering ExampleReengineering Example
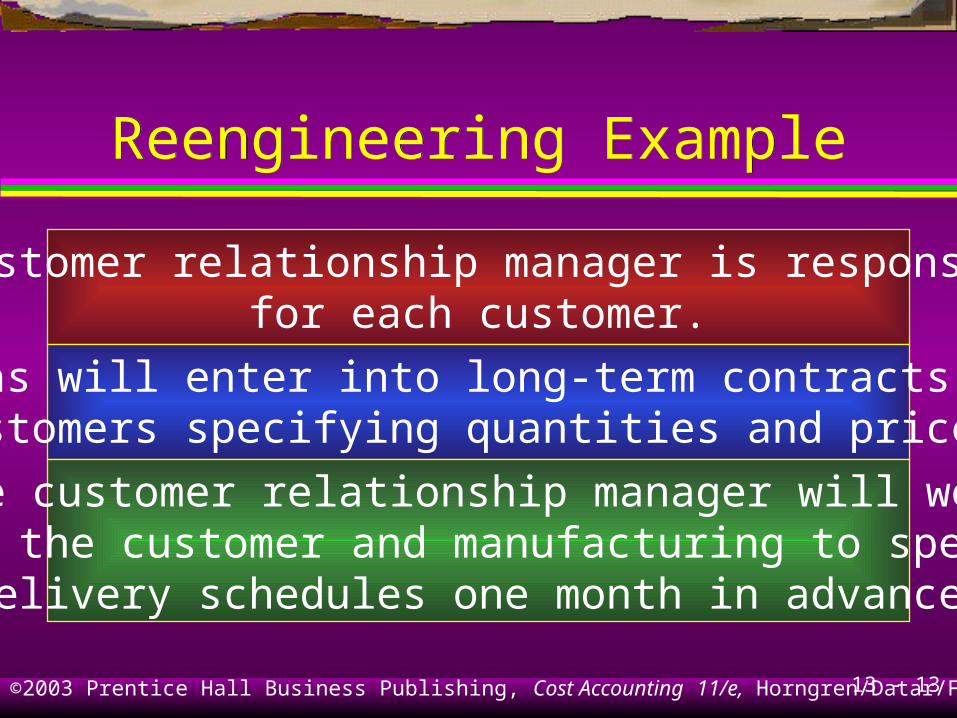
A customer relationship manager is responsiblefor each customer.
Dallas will enter into long-term contracts withcustomers specifying quantities and prices.
The customer relationship manager will workwith the customer and manufacturing to specify
delivery schedules one month in advance.
13 - 14©2003 Prentice Hall Business Publishing, Cost Accounting 11/e, Horngren/Datar/Foster
Reengineering ExampleReengineering Example
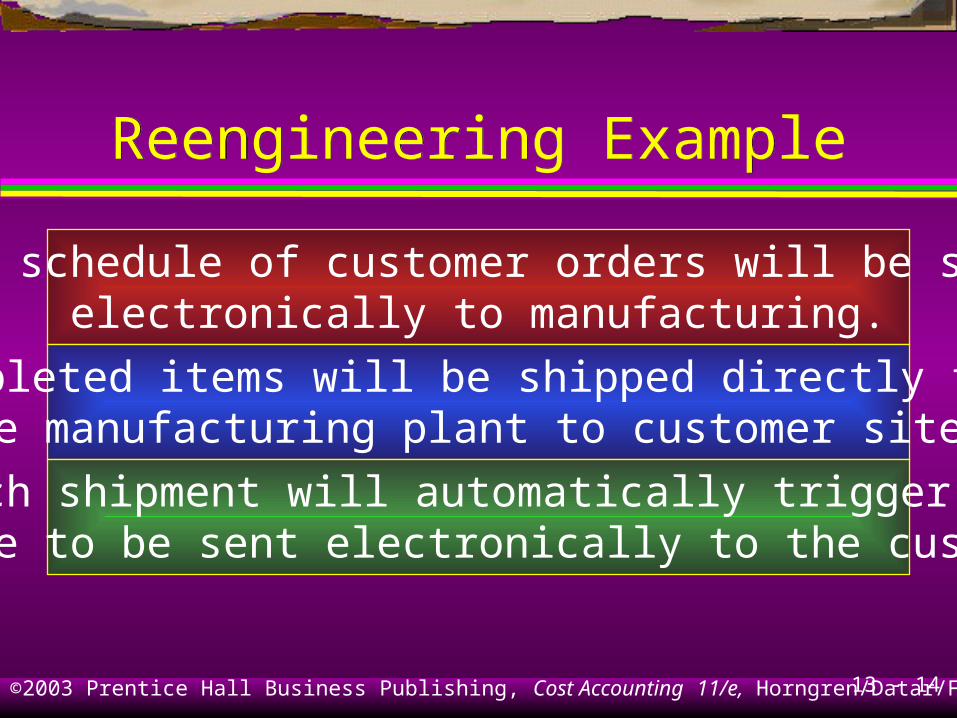
The schedule of customer orders will be sentelectronically to manufacturing.
Completed items will be shipped directly fromthe manufacturing plant to customer sites.
Each shipment will automatically trigger aninvoice to be sent electronically to the customer.

13 - 15©2003 Prentice Hall Business Publishing, Cost Accounting 11/e, Horngren/Datar/Foster
Learning Objective 3Learning Objective 3
Present the four perspectives
of the balanced scorecard.

13 - 16©2003 Prentice Hall Business Publishing, Cost Accounting 11/e, Horngren/Datar/Foster
Perspectives of PerformancePerspectives of Performance
1. Financial
2. Customer
3. Internal business process
4. Learning and growth
13 - 17©2003 Prentice Hall Business Publishing, Cost Accounting 11/e, Horngren/Datar/Foster
Financial PerspectiveFinancial Perspective
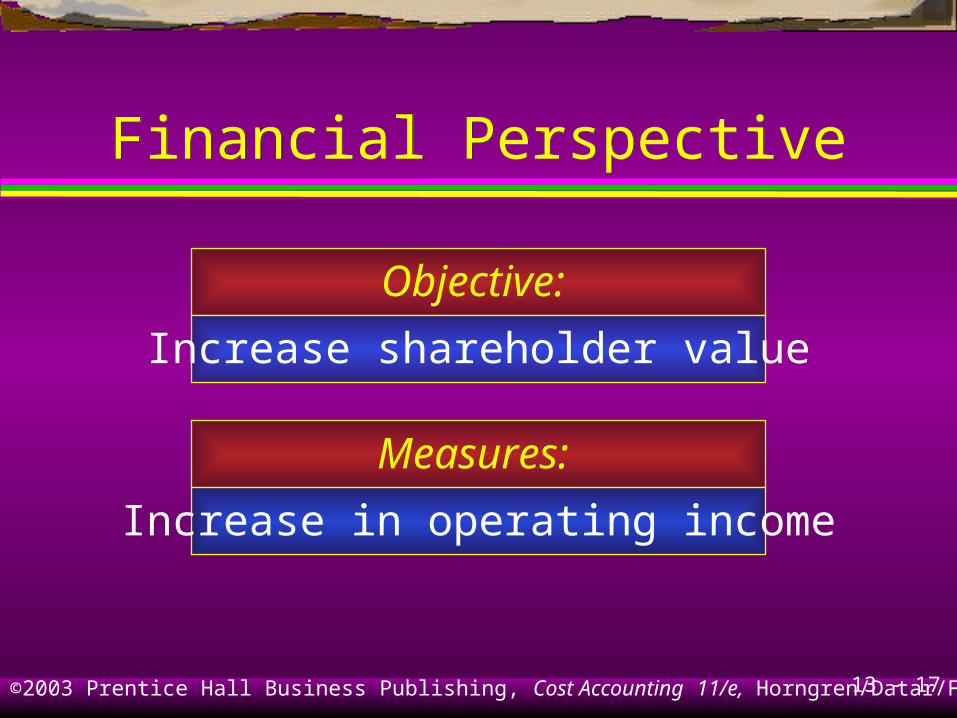
Objective:
Increase shareholder value
Measures:
Increase in operating income
13 - 18©2003 Prentice Hall Business Publishing, Cost Accounting 11/e, Horngren/Datar/Foster
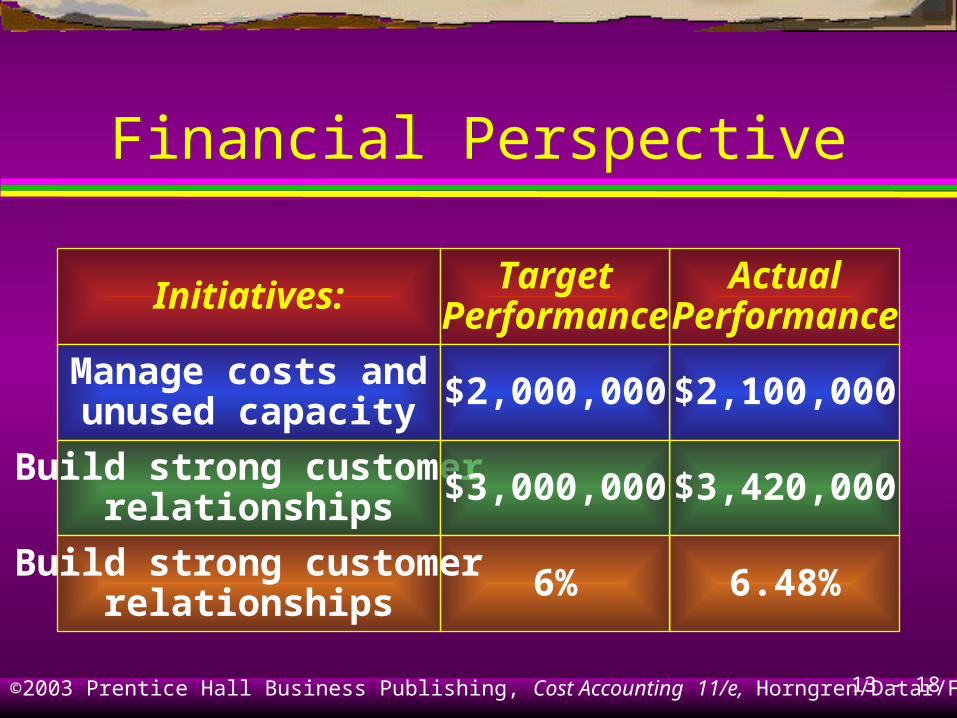
Financial PerspectiveFinancial Perspective
Initiatives: TargetPerformance
ActualPerformance
Manage costs andunused capacity
Build strong customerrelationships
$2,000,000
$3,000,000
6%Build strong customerrelationships
$2,100,000
$3,420,000
6.48%
13 - 19©2003 Prentice Hall Business Publishing, Cost Accounting 11/e, Horngren/Datar/Foster
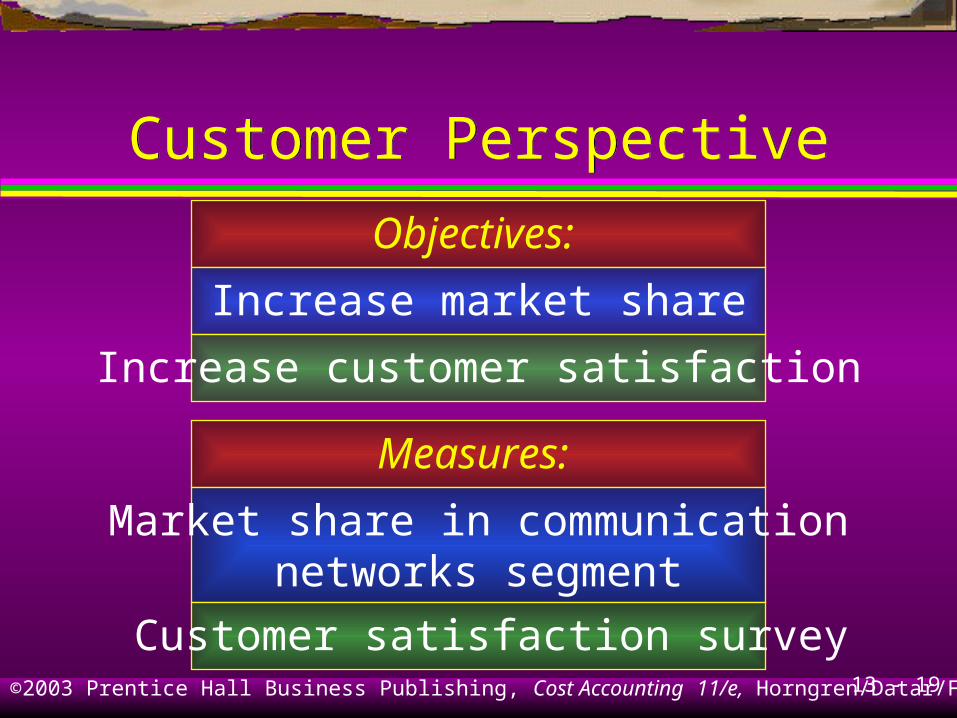
Customer PerspectiveCustomer Perspective
Objectives:
Increase market share
Measures:
Market share in communicationnetworks segment
Customer satisfaction survey
Increase customer satisfaction
13 - 20©2003 Prentice Hall Business Publishing, Cost Accounting 11/e, Horngren/Datar/Foster
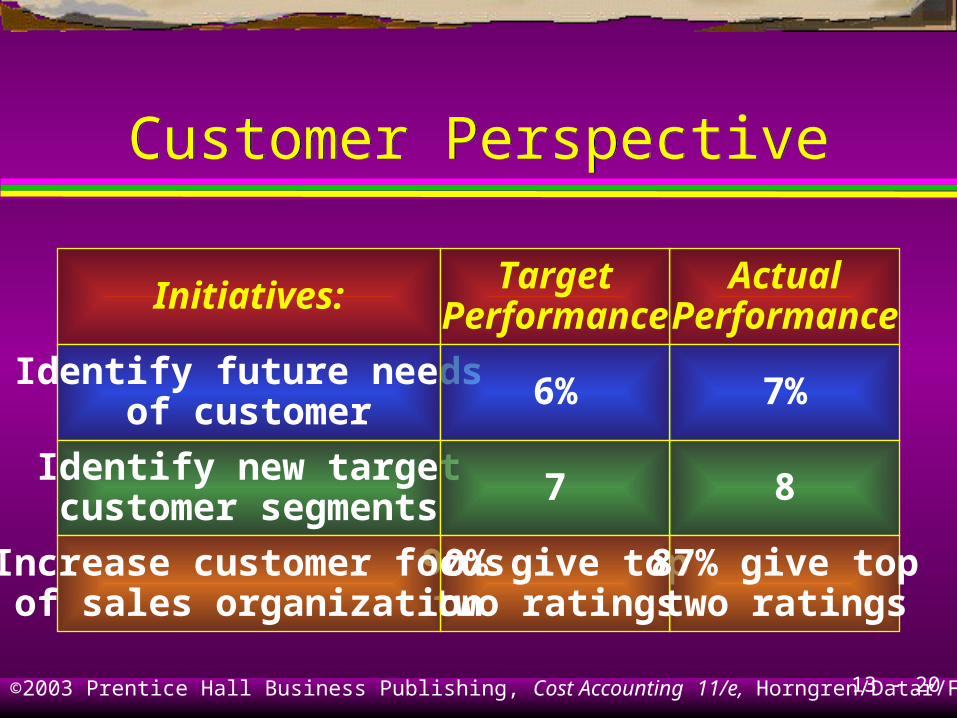
Customer PerspectiveCustomer Perspective
Initiatives: TargetPerformance
ActualPerformance
Identify future needsof customer
Identify new targetcustomer segments
6%
7
90% give toptwo ratings
Increase customer focusof sales organization
7%
8
87% give toptwo ratings
13 - 21©2003 Prentice Hall Business Publishing, Cost Accounting 11/e, Horngren/Datar/Foster
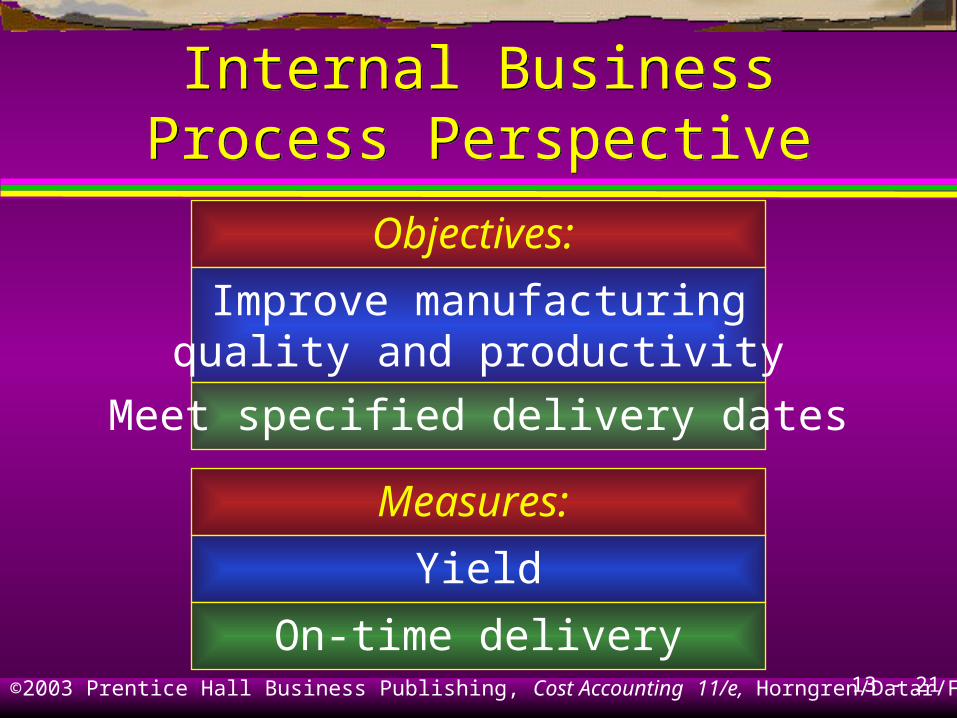
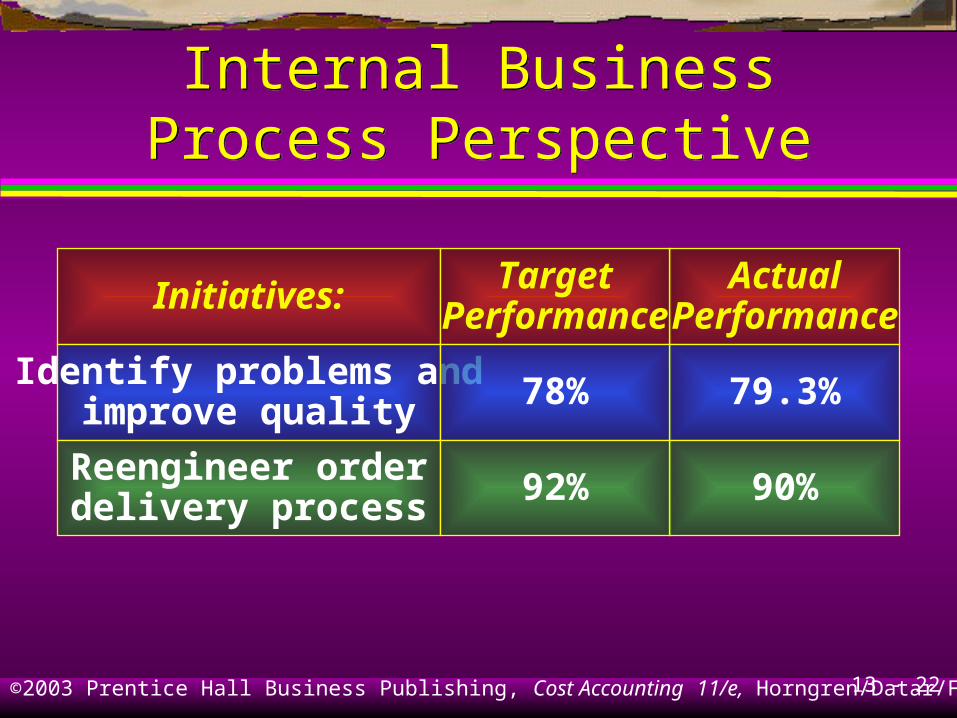
Internal BusinessProcess PerspectiveInternal Business
Process Perspective
Objectives:
Improve manufacturingquality and productivity
Measures:
Yield
On-time delivery
Meet specified delivery dates
13 - 22©2003 Prentice Hall Business Publishing, Cost Accounting 11/e, Horngren/Datar/Foster
Internal BusinessProcess PerspectiveInternal Business
Process Perspective
Initiatives: TargetPerformance
ActualPerformance
Identify problems andimprove quality
Reengineer orderdelivery process
78%
92%
79.3%
90%
13 - 23©2003 Prentice Hall Business Publishing, Cost Accounting 11/e, Horngren/Datar/Foster
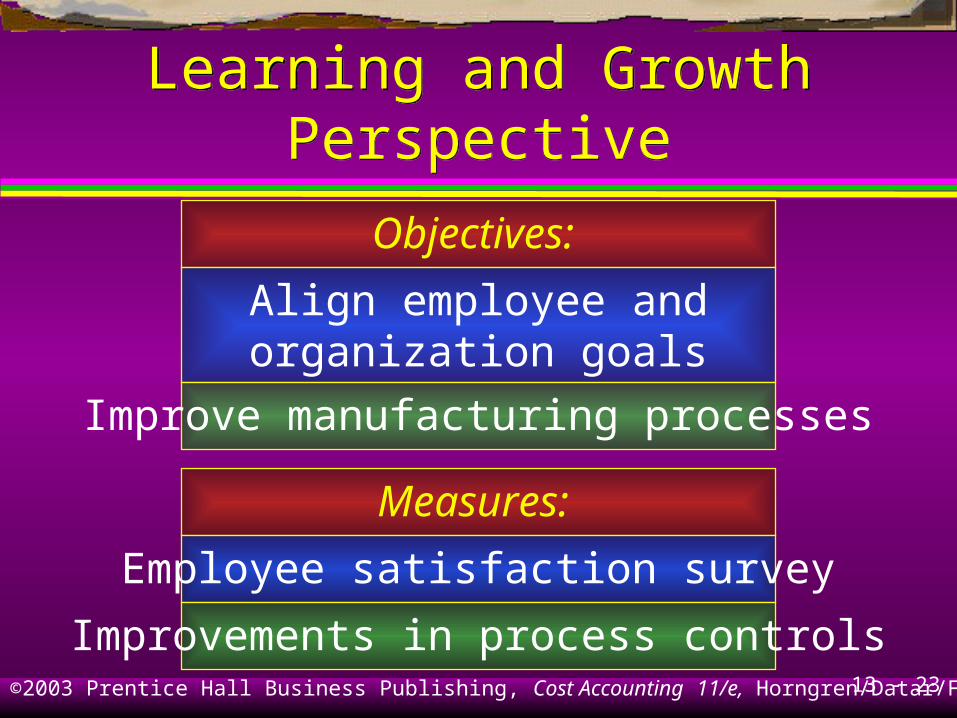
Learning and Growth PerspectiveLearning and Growth Perspective
Objectives:
Align employee andorganization goals
Measures:
Employee satisfaction survey
Improvements in process controls
Improve manufacturing processes
13 - 24©2003 Prentice Hall Business Publishing, Cost Accounting 11/e, Horngren/Datar/Foster
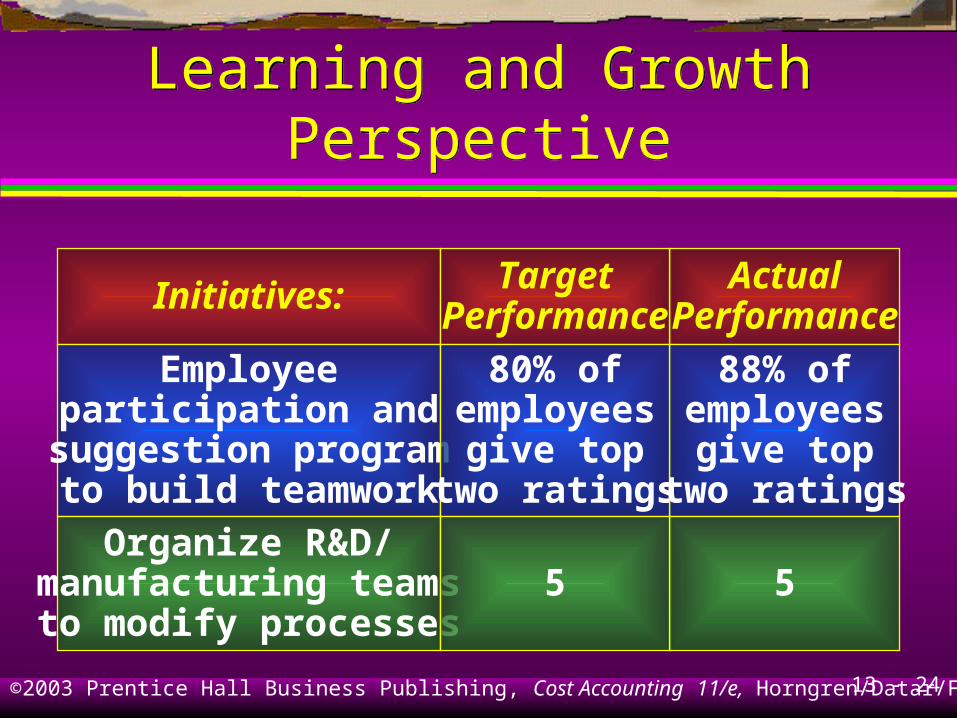
Learning and Growth PerspectiveLearning and Growth Perspective
Initiatives: TargetPerformance
ActualPerformance
Employeeparticipation and
suggestion programto build teamwork
Organize R&D/manufacturing teamsto modify processes
80% ofemployees
give toptwo ratings
5
88% ofemployees
give toptwo ratings
5

13 - 25©2003 Prentice Hall Business Publishing, Cost Accounting 11/e, Horngren/Datar/Foster
Aligning the BalancedScorecard to StrategyAligning the BalancedScorecard to Strategy
Different strategies call for different scorecards.
What are some of the financialperspective measures?
Operating income
Revenue growth
Cost reduction is some areas
Return on investment
13 - 26©2003 Prentice Hall Business Publishing, Cost Accounting 11/e, Horngren/Datar/Foster
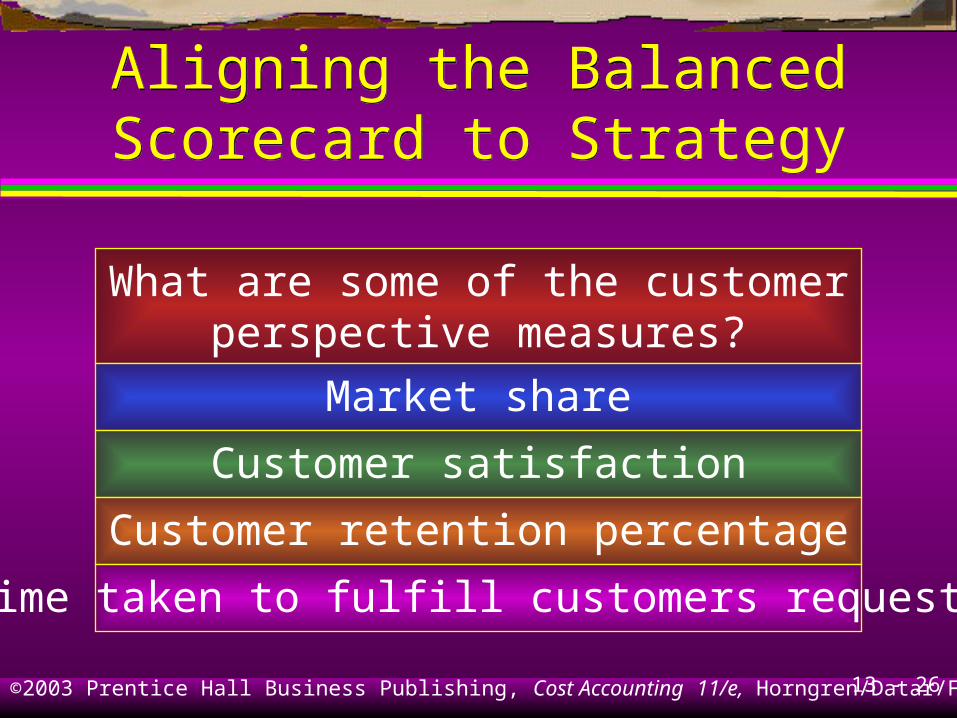
Aligning the BalancedScorecard to StrategyAligning the BalancedScorecard to Strategy
What are some of the customerperspective measures?
Market share
Customer satisfaction
Customer retention percentage
Time taken to fulfill customers requests
13 - 27©2003 Prentice Hall Business Publishing, Cost Accounting 11/e, Horngren/Datar/Foster
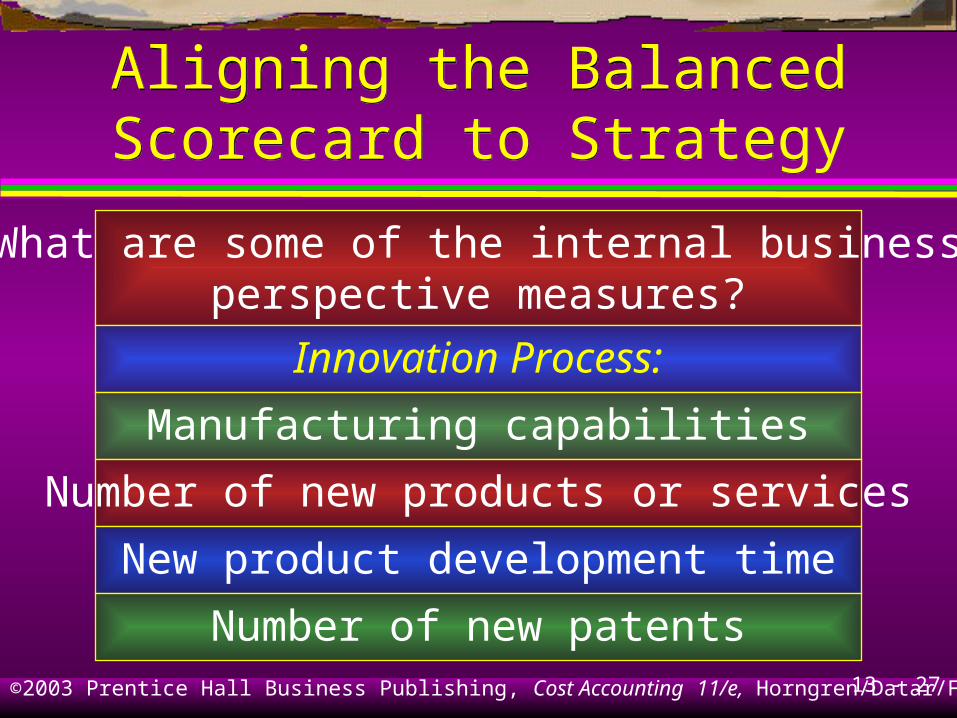
Aligning the BalancedScorecard to StrategyAligning the BalancedScorecard to Strategy
What are some of the internal businessperspective measures?
Innovation Process:
Manufacturing capabilities
Number of new products or services
New product development time
Number of new patents
13 - 28©2003 Prentice Hall Business Publishing, Cost Accounting 11/e, Horngren/Datar/Foster
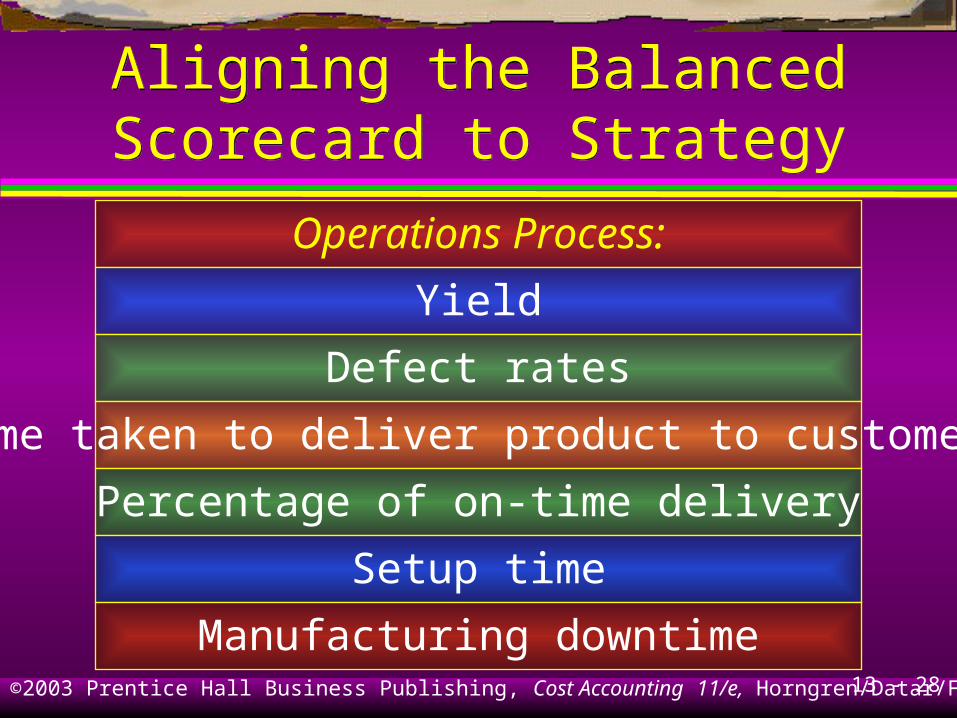
Aligning the BalancedScorecard to StrategyAligning the BalancedScorecard to Strategy
Operations Process:
Yield
Defect rates
Time taken to deliver product to customers
Percentage of on-time delivery
Setup time
Manufacturing downtime
13 - 29©2003 Prentice Hall Business Publishing, Cost Accounting 11/e, Horngren/Datar/Foster
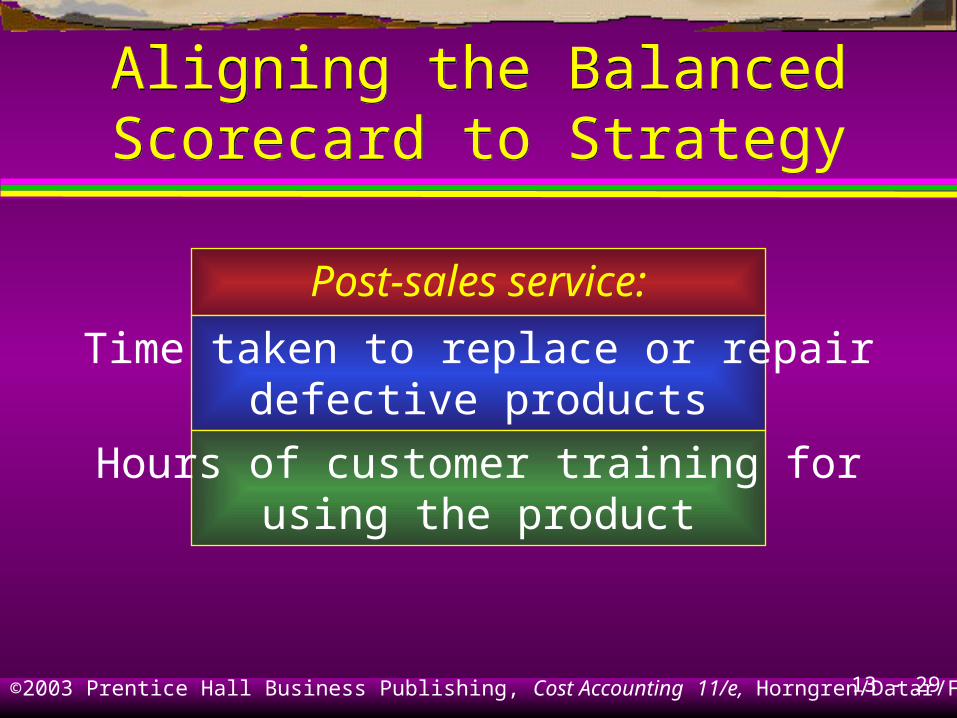
Aligning the BalancedScorecard to StrategyAligning the BalancedScorecard to Strategy
Post-sales service:
Time taken to replace or repairdefective products
Hours of customer training forusing the product

13 - 30©2003 Prentice Hall Business Publishing, Cost Accounting 11/e, Horngren/Datar/Foster
Aligning the BalancedScorecard to StrategyAligning the BalancedScorecard to Strategy
What are some of the learning and growthperspective measures?
Employee education and skill level
Employee satisfaction scores
Employee turnover rates
Information system availability
Percentage of processes with advanced controls
13 - 31©2003 Prentice Hall Business Publishing, Cost Accounting 11/e, Horngren/Datar/Foster
Pitfalls When Implementinga Balanced Scorecard
Pitfalls When Implementinga Balanced Scorecard
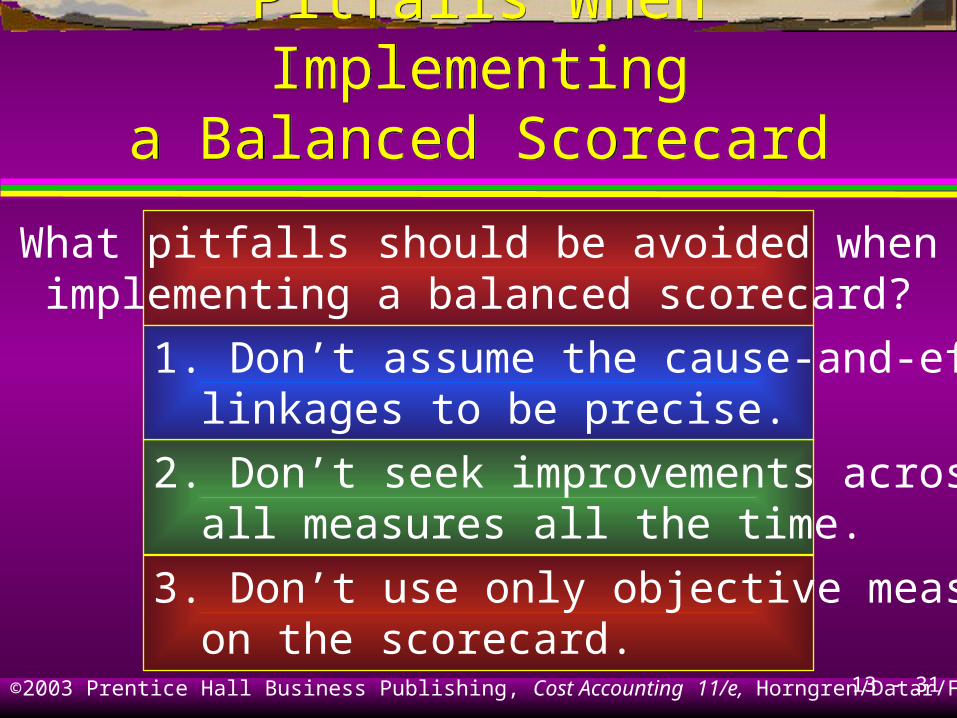
What pitfalls should be avoided whenimplementing a balanced scorecard?
1. Don’t assume the cause-and-effectlinkages to be precise.
2. Don’t seek improvements acrossall measures all the time.
3. Don’t use only objective measureson the scorecard.

13 - 32©2003 Prentice Hall Business Publishing, Cost Accounting 11/e, Horngren/Datar/Foster
Pitfalls When Implementinga Balanced Scorecard
Pitfalls When Implementinga Balanced Scorecard
4. Don’t fail to consider both costs and benefitsof initiatives such as spending on informationtechnology and research and development.
5. Don’t ignore nonfinancial measures whenevaluating managers and employees.
6. Don’t use too many measures.

13 - 33©2003 Prentice Hall Business Publishing, Cost Accounting 11/e, Horngren/Datar/Foster
Learning Objective 4Learning Objective 4
Analyze changes in operating
income to evaluate strategy.
13 - 34©2003 Prentice Hall Business Publishing, Cost Accounting 11/e, Horngren/Datar/Foster
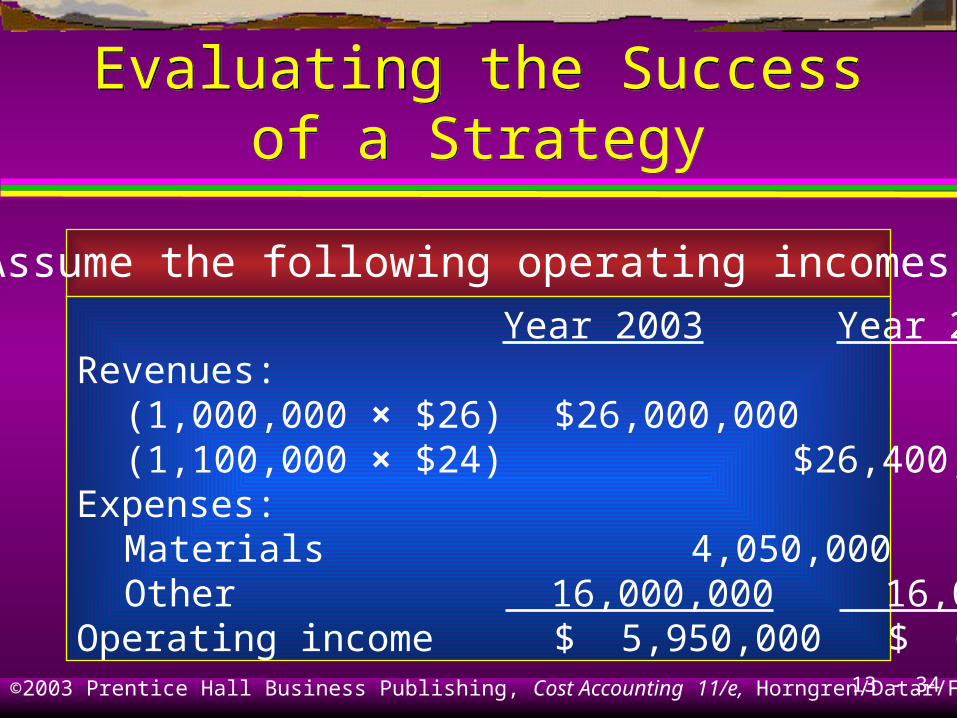
Evaluating the Successof a Strategy
Evaluating the Successof a Strategy
Assume the following operating incomes:
Year 2003 Year 2004Revenues:
(1,000,000 × $26) $26,000,000(1,100,000 × $24) $26,400,000
Expenses:Materials 4,050,000 3,631,320Other 16,000,000 16,000,000
Operating income $ 5,950,000 $ 6,768,680

13 - 35©2003 Prentice Hall Business Publishing, Cost Accounting 11/e, Horngren/Datar/Foster
Evaluating the Successof a Strategy
Evaluating the Successof a Strategy
How can the increase in operatingincome of $818,680 be evaluated?
Growth
Price recovery
Productivity
13 - 36©2003 Prentice Hall Business Publishing, Cost Accounting 11/e, Horngren/Datar/Foster
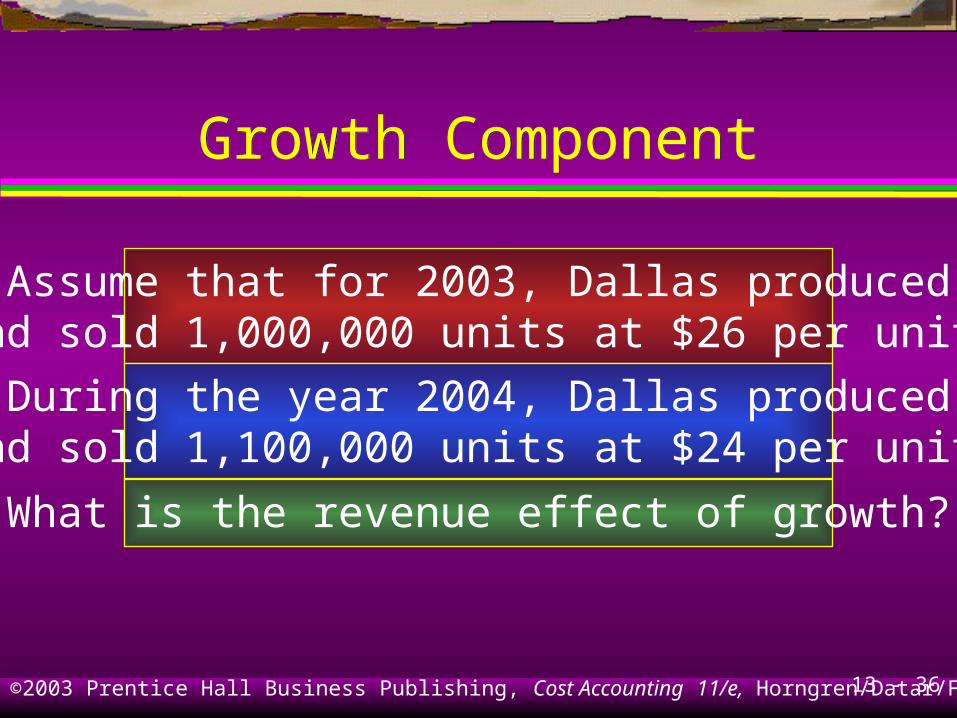
Growth ComponentGrowth Component
Assume that for 2003, Dallas producedand sold 1,000,000 units at $26 per unit.
During the year 2004, Dallas producedand sold 1,100,000 units at $24 per unit.
What is the revenue effect of growth?
13 - 37©2003 Prentice Hall Business Publishing, Cost Accounting 11/e, Horngren/Datar/Foster
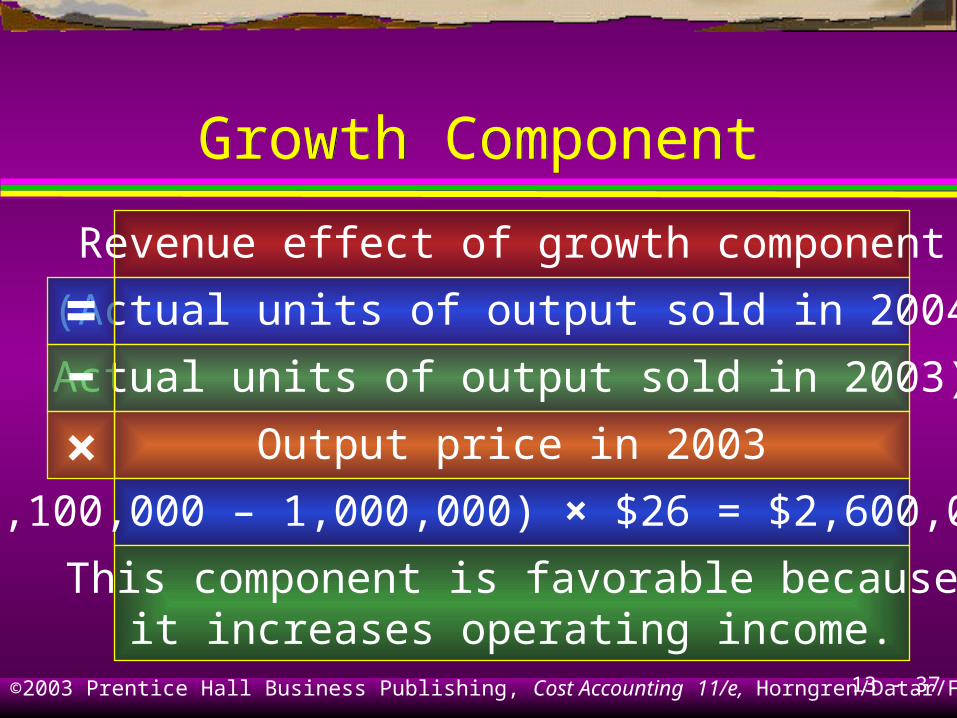
Growth ComponentGrowth Component
Revenue effect of growth component
(Actual units of output sold in 2004
Actual units of output sold in 2003)
Output price in 2003
(1,100,000 – 1,000,000) × $26 = $2,600,000 F
This component is favorable becauseit increases operating income.
=–×
13 - 38©2003 Prentice Hall Business Publishing, Cost Accounting 11/e, Horngren/Datar/Foster
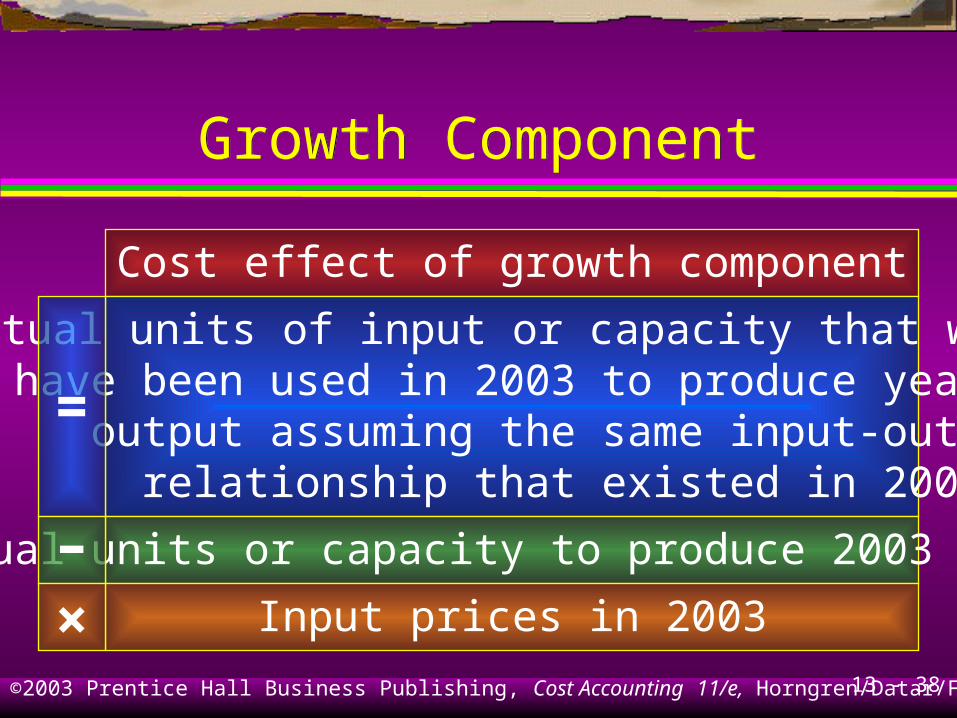
Growth ComponentGrowth Component
Cost effect of growth component
Actual units of input or capacity that would have been used in 2003 to produce year 2004
output assuming the same input-output relationship that existed in 2003
Actual units or capacity to produce 2003 output
Input prices in 2003
=
–×
13 - 39©2003 Prentice Hall Business Publishing, Cost Accounting 11/e, Horngren/Datar/Foster
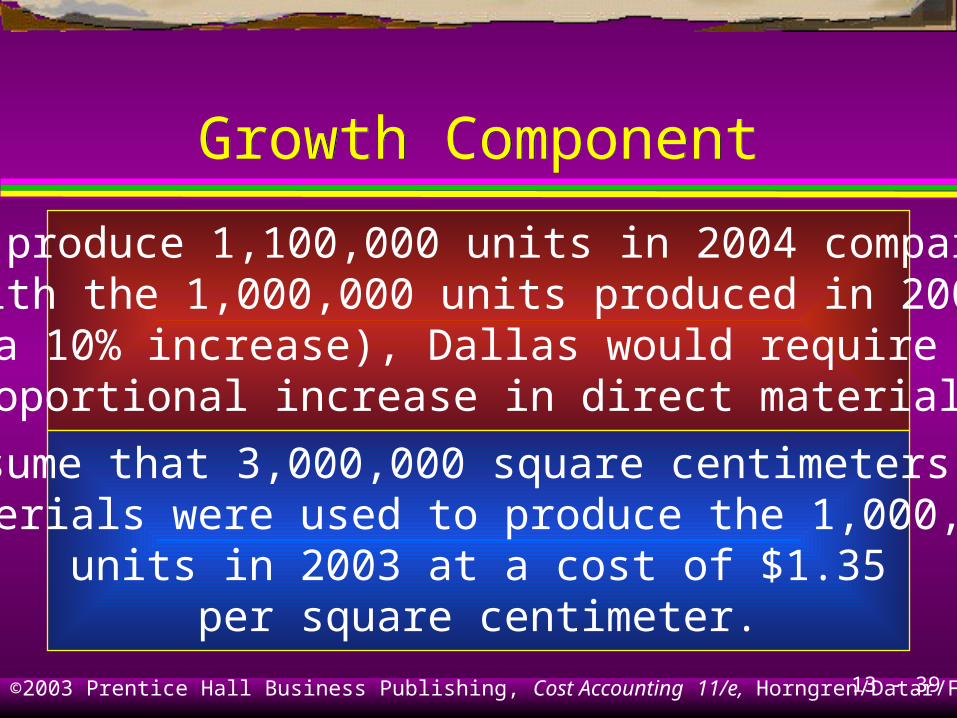
Growth ComponentGrowth Component
To produce 1,100,000 units in 2004 comparedwith the 1,000,000 units produced in 2003(a 10% increase), Dallas would require aproportional increase in direct materials.
Assume that 3,000,000 square centimeters ofmaterials were used to produce the 1,000,000
units in 2003 at a cost of $1.35per square centimeter.
13 - 40©2003 Prentice Hall Business Publishing, Cost Accounting 11/e, Horngren/Datar/Foster
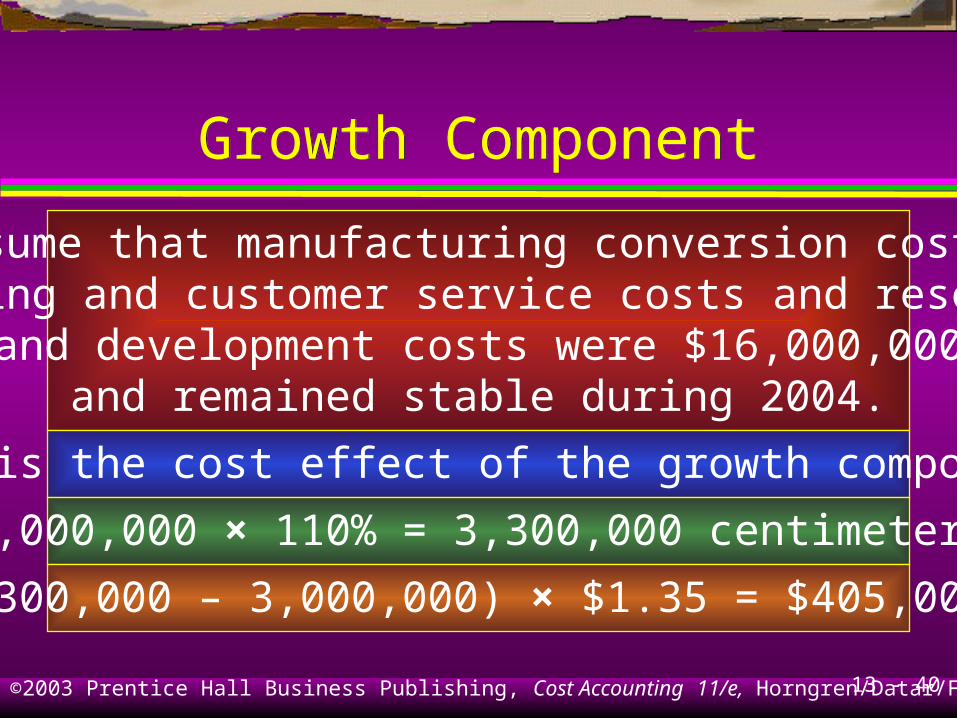
Growth ComponentGrowth Component
Assume that manufacturing conversion costs,selling and customer service costs and research
and development costs were $16,000,000and remained stable during 2004.
What is the cost effect of the growth component?
3,000,000 × 110% = 3,300,000 centimeters
(3,300,000 – 3,000,000) × $1.35 = $405,000 U
13 - 41©2003 Prentice Hall Business Publishing, Cost Accounting 11/e, Horngren/Datar/Foster
Operating Income and GrowthOperating Income and Growth
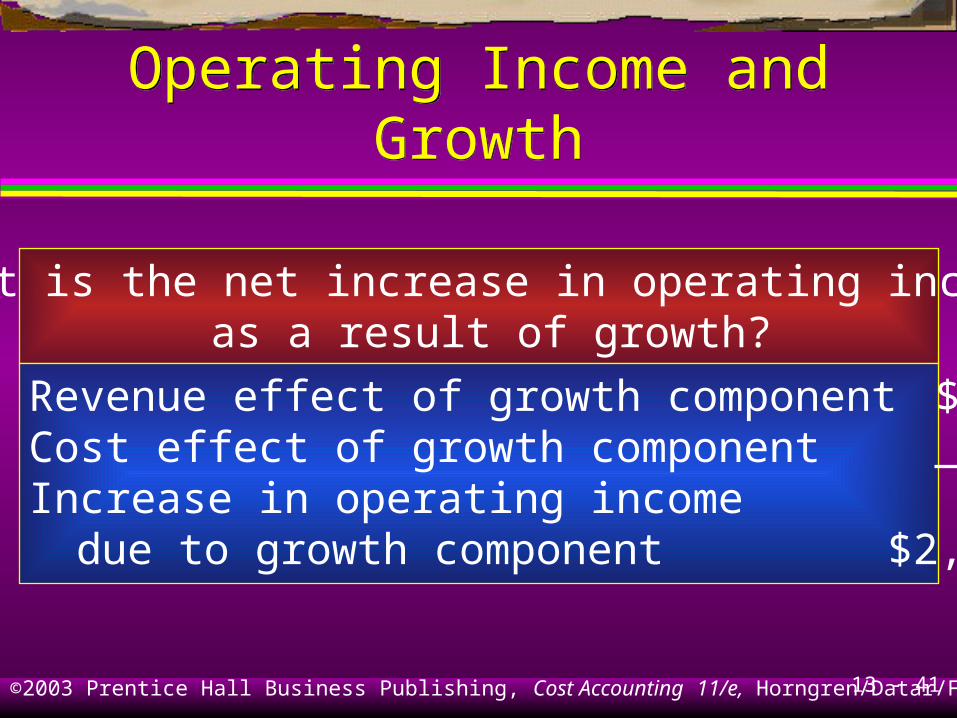
What is the net increase in operating income as a result of growth?
Revenue effect of growth component $2,600,000 FCost effect of growth component 405,000 UIncrease in operating income
due to growth component $2,195,000 F
13 - 42©2003 Prentice Hall Business Publishing, Cost Accounting 11/e, Horngren/Datar/Foster
Price-Recovery ComponentPrice-Recovery Component
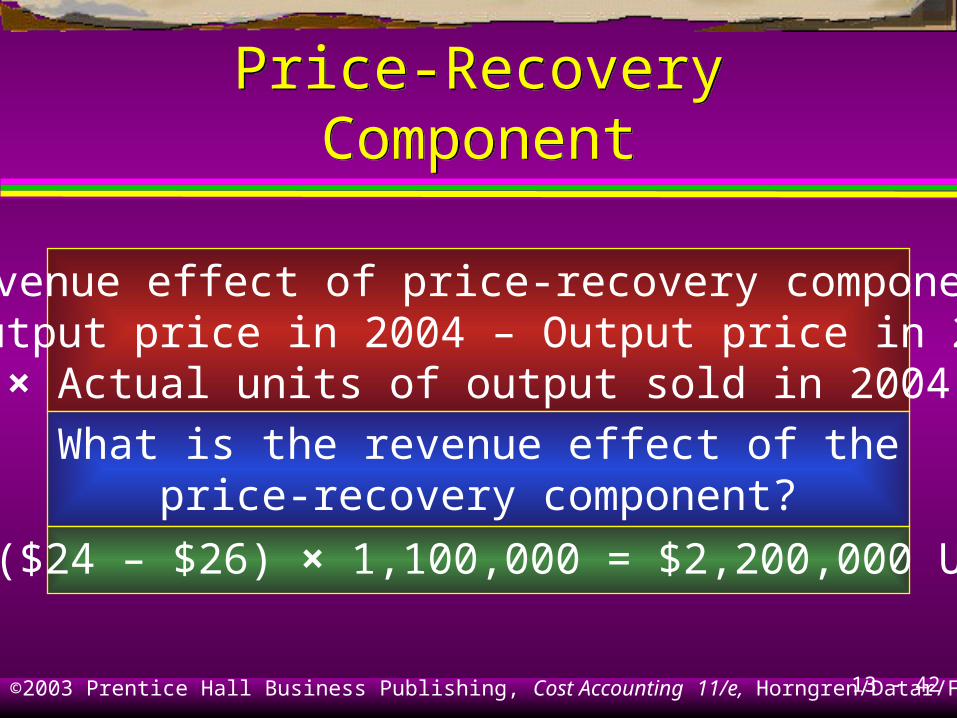
Revenue effect of price-recovery component= (Output price in 2004 – Output price in 2003)
× Actual units of output sold in 2004
What is the revenue effect of theprice-recovery component?
($24 – $26) × 1,100,000 = $2,200,000 U
13 - 43©2003 Prentice Hall Business Publishing, Cost Accounting 11/e, Horngren/Datar/Foster
Price-Recovery ComponentPrice-Recovery Component
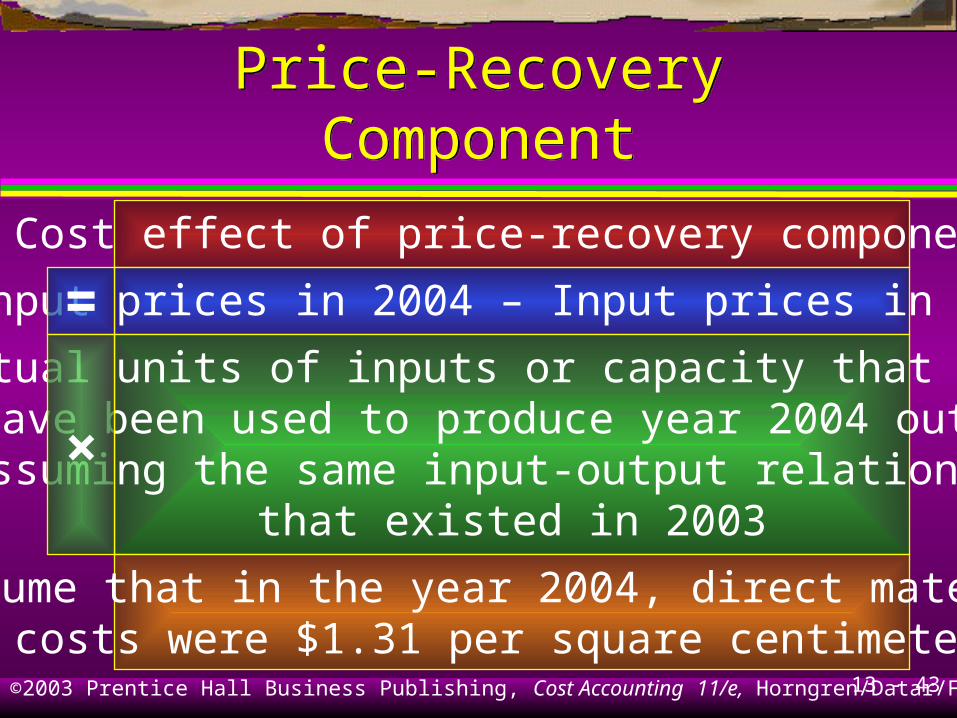
Cost effect of price-recovery component
(Input prices in 2004 – Input prices in 2003)
Actual units of inputs or capacity that wouldhave been used to produce year 2004 outputassuming the same input-output relationship
that existed in 2003
Assume that in the year 2004, direct materialscosts were $1.31 per square centimeter.
=
×
13 - 44©2003 Prentice Hall Business Publishing, Cost Accounting 11/e, Horngren/Datar/Foster
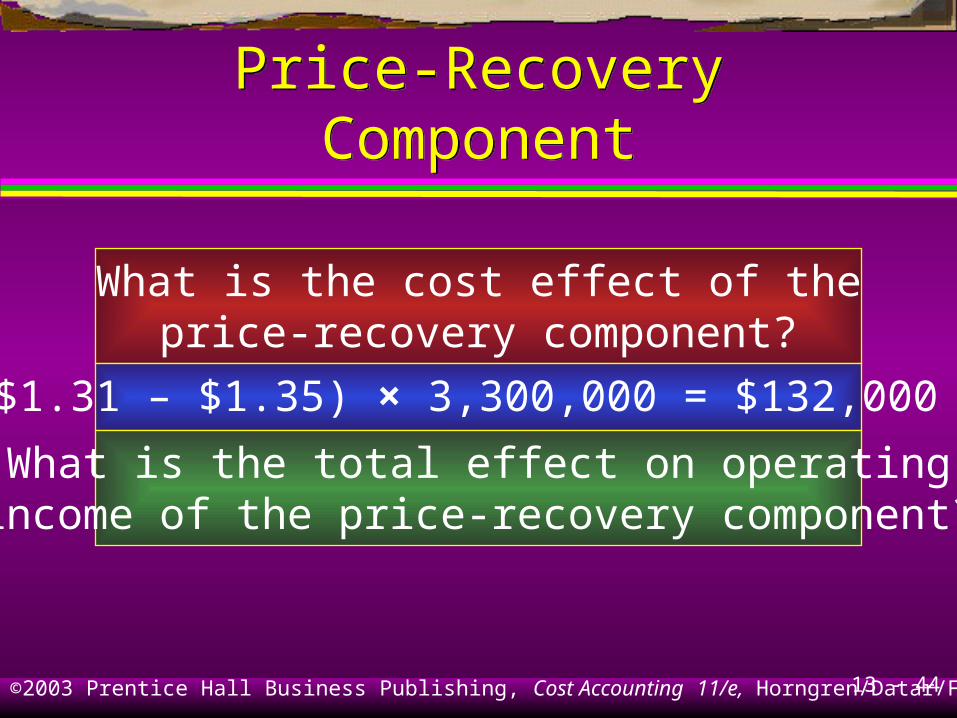
Price-Recovery ComponentPrice-Recovery Component
What is the cost effect of theprice-recovery component?
($1.31 – $1.35) × 3,300,000 = $132,000 F
What is the total effect on operatingincome of the price-recovery component?

13 - 45©2003 Prentice Hall Business Publishing, Cost Accounting 11/e, Horngren/Datar/Foster
Operating Income andPrice-Recovery Component
Operating Income andPrice-Recovery Component
Revenue effect of price-recovery component $2,200,000 UCost effect of price-recovery component 132,000 FDecrease in operating income due to price-recovery component $2,068,000 U
13 - 46©2003 Prentice Hall Business Publishing, Cost Accounting 11/e, Horngren/Datar/Foster
Productivity ComponentProductivity Component
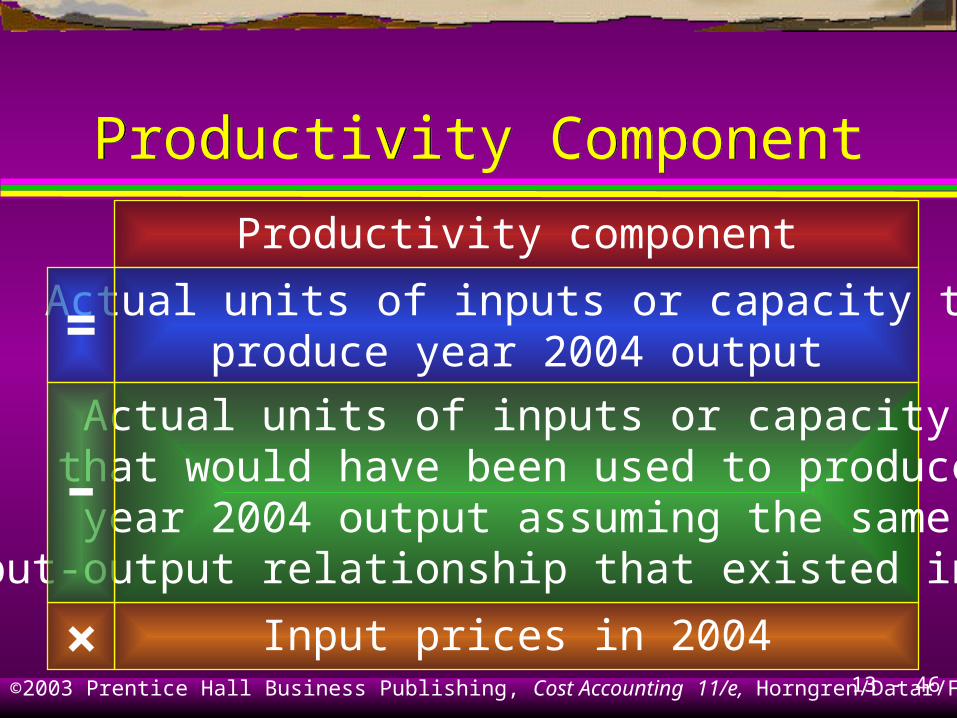
Productivity component
Actual units of inputs or capacity toproduce year 2004 output
Input prices in 2004
=
×
Actual units of inputs or capacitythat would have been used to produceyear 2004 output assuming the same
input-output relationship that existed in 2003
–
13 - 47©2003 Prentice Hall Business Publishing, Cost Accounting 11/e, Horngren/Datar/Foster
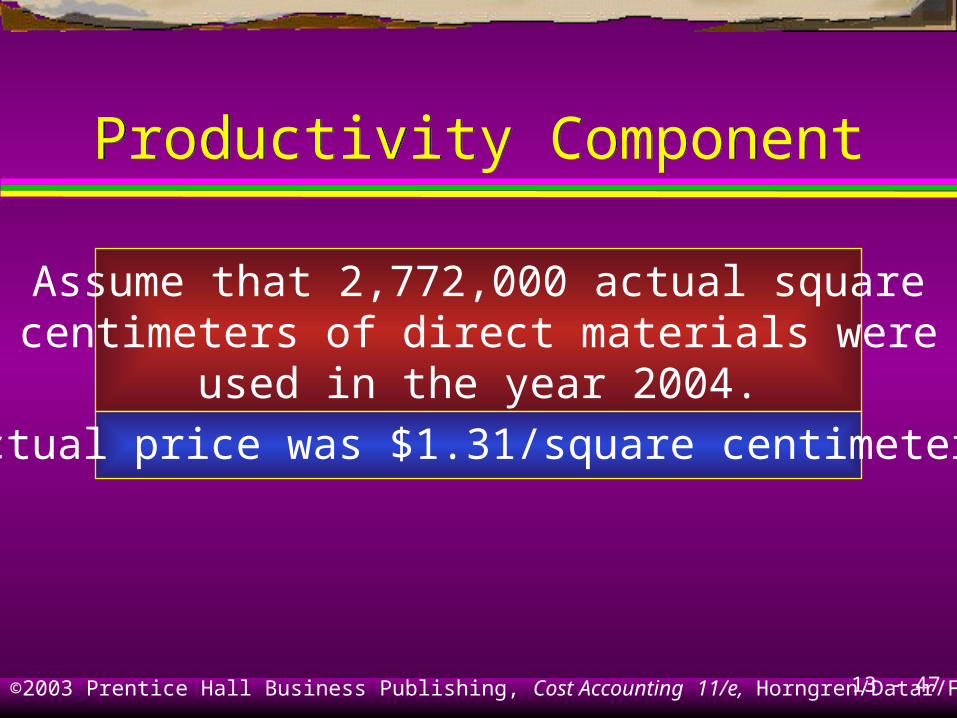
Productivity ComponentProductivity Component
Assume that 2,772,000 actual squarecentimeters of direct materials were
used in the year 2004.
Actual price was $1.31/square centimeter.
13 - 48©2003 Prentice Hall Business Publishing, Cost Accounting 11/e, Horngren/Datar/Foster
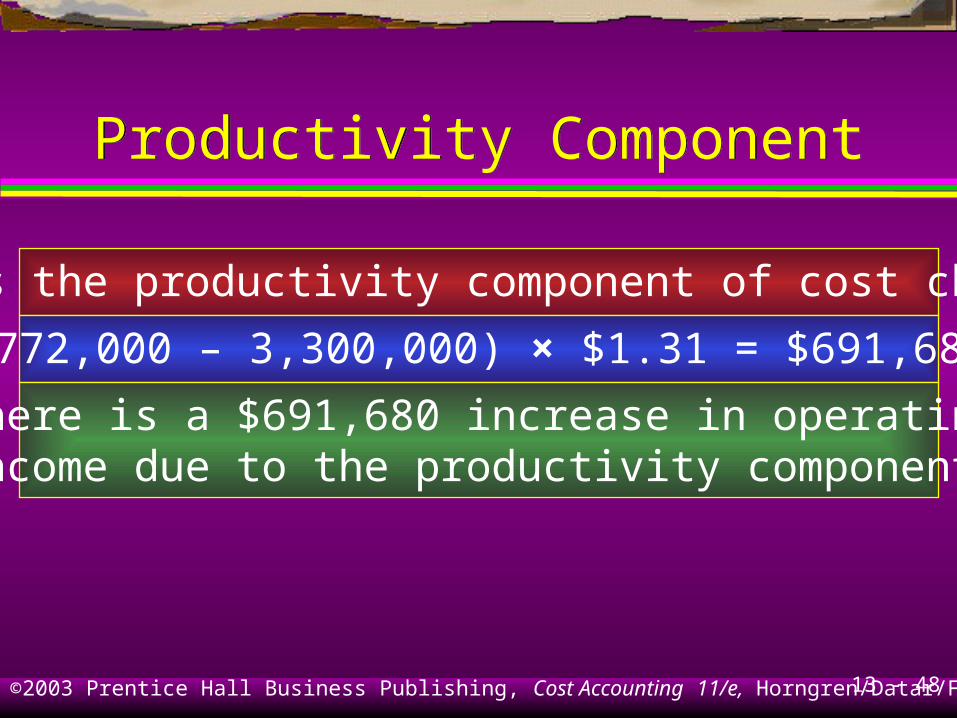
Productivity ComponentProductivity Component
What is the productivity component of cost changes?
(2,772,000 – 3,300,000) × $1.31 = $691,680 F
There is a $691,680 increase in operatingincome due to the productivity component.
13 - 49©2003 Prentice Hall Business Publishing, Cost Accounting 11/e, Horngren/Datar/Foster
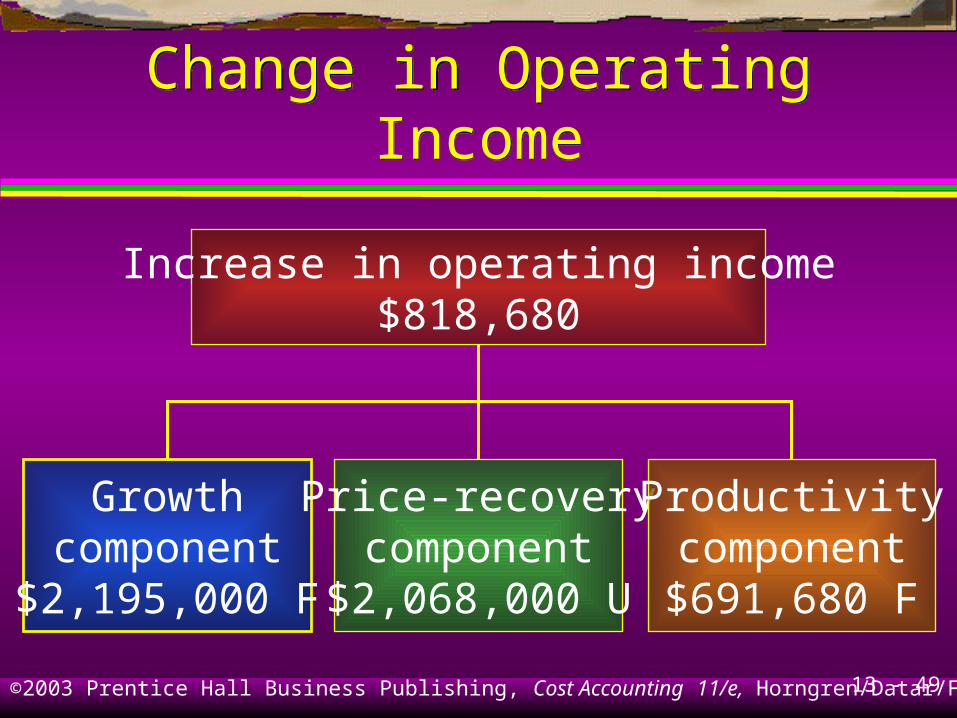
Change in Operating IncomeChange in Operating Income
Increase in operating income$818,680
Growthcomponent
$2,195,000 F
Price-recoverycomponent
$2,068,000 U
Productivitycomponent$691,680 F
13 - 50©2003 Prentice Hall Business Publishing, Cost Accounting 11/e, Horngren/Datar/Foster
Learning Objective 5Learning Objective 5
Distinguish between engineered
and discretionary costs.
13 - 51©2003 Prentice Hall Business Publishing, Cost Accounting 11/e, Horngren/Datar/Foster
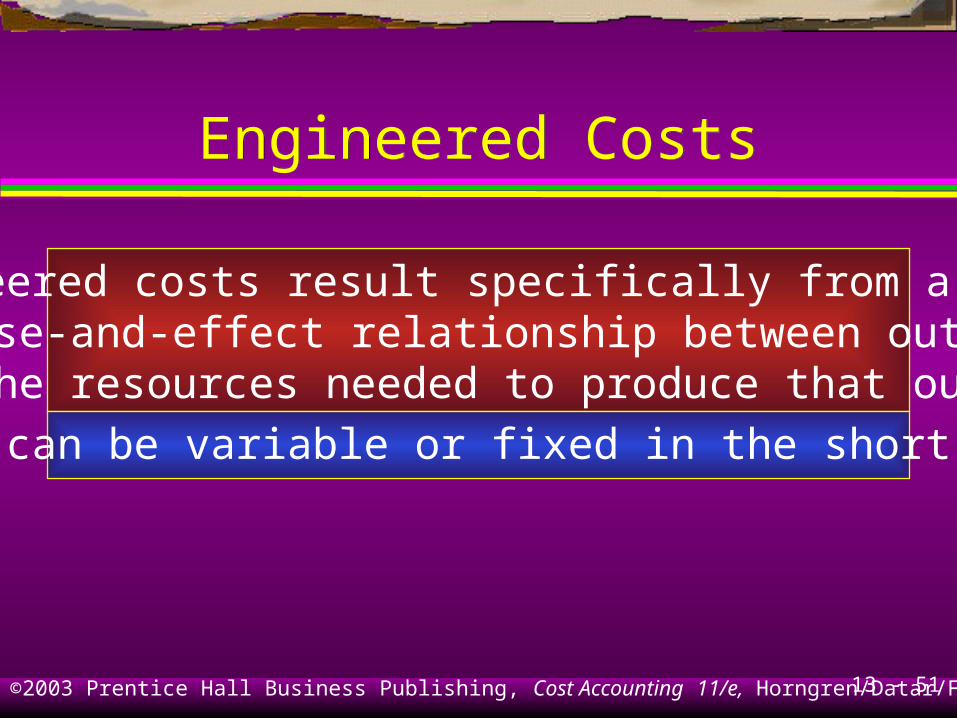
Engineered CostsEngineered Costs
Engineered costs result specifically from a clearcause-and-effect relationship between output
and the resources needed to produce that output.
They can be variable or fixed in the short run.
13 - 52©2003 Prentice Hall Business Publishing, Cost Accounting 11/e, Horngren/Datar/Foster
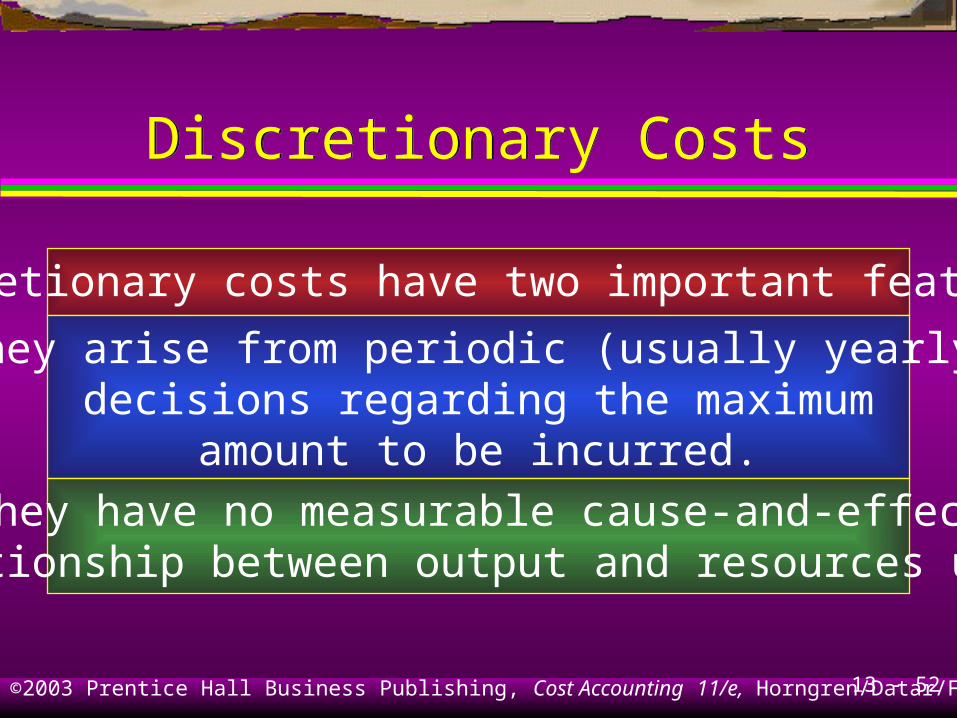
Discretionary CostsDiscretionary Costs
Discretionary costs have two important features.
They arise from periodic (usually yearly)decisions regarding the maximum
amount to be incurred.
They have no measurable cause-and-effectrelationship between output and resources used.
13 - 53©2003 Prentice Hall Business Publishing, Cost Accounting 11/e, Horngren/Datar/Foster
Relationships BetweenInputs and Outputs
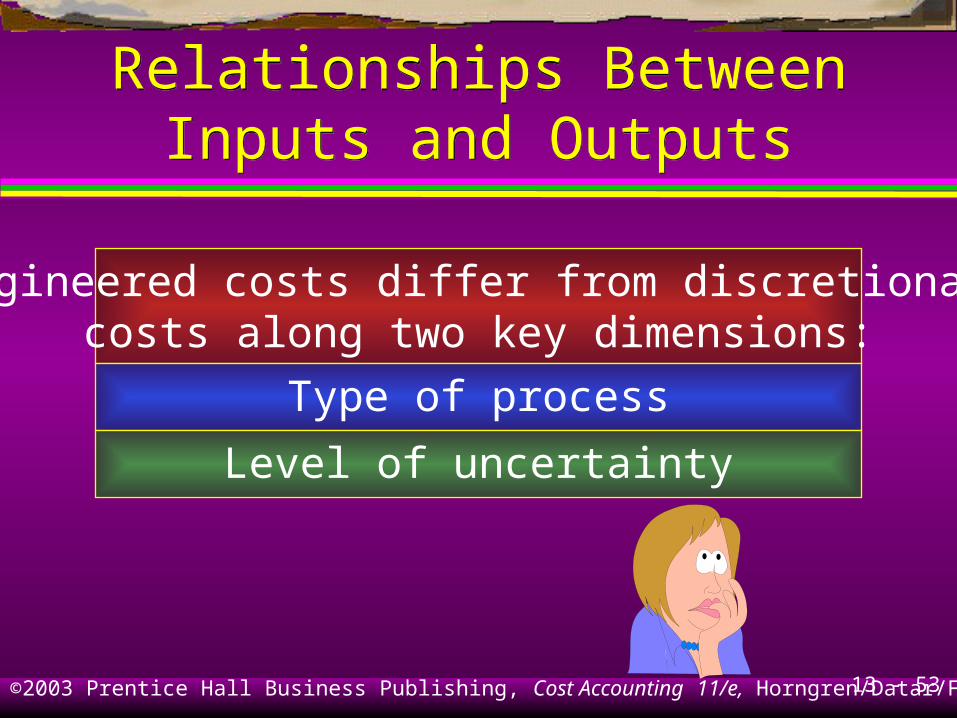
Relationships BetweenInputs and Outputs
Engineered costs differ from discretionarycosts along two key dimensions:
Type of process
Level of uncertainty
13 - 54©2003 Prentice Hall Business Publishing, Cost Accounting 11/e, Horngren/Datar/Foster
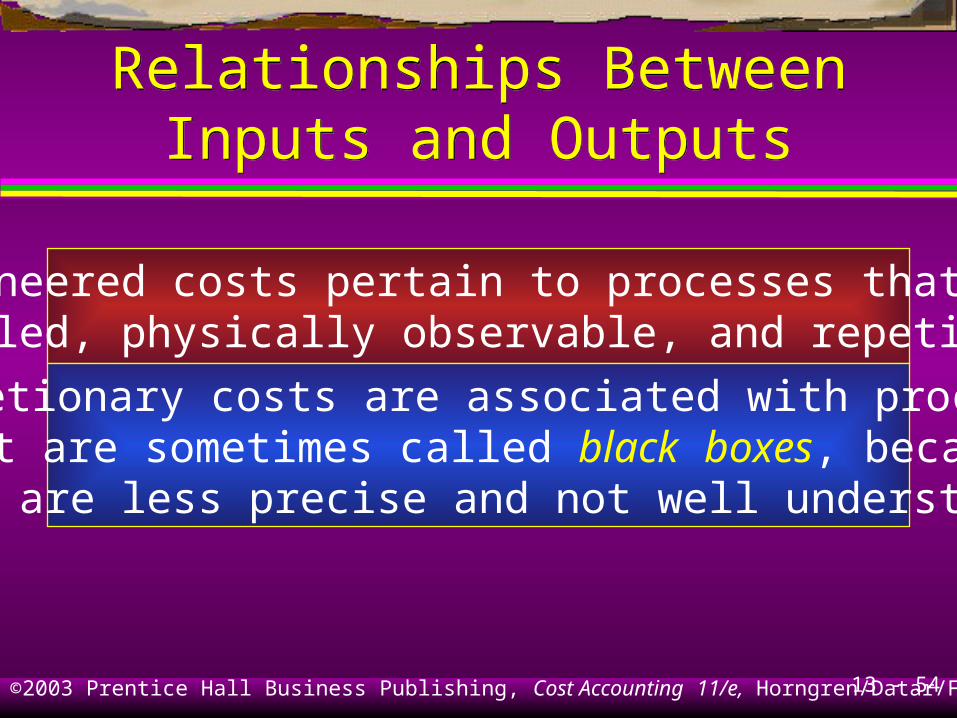
Relationships BetweenInputs and Outputs
Relationships BetweenInputs and Outputs
Engineered costs pertain to processes that aredetailed, physically observable, and repetitive.
Discretionary costs are associated with processesthat are sometimes called black boxes, becausethey are less precise and not well understood.
13 - 55©2003 Prentice Hall Business Publishing, Cost Accounting 11/e, Horngren/Datar/Foster
Learning Objective 6Learning Objective 6
Identify unused capacity
and how to manage it.
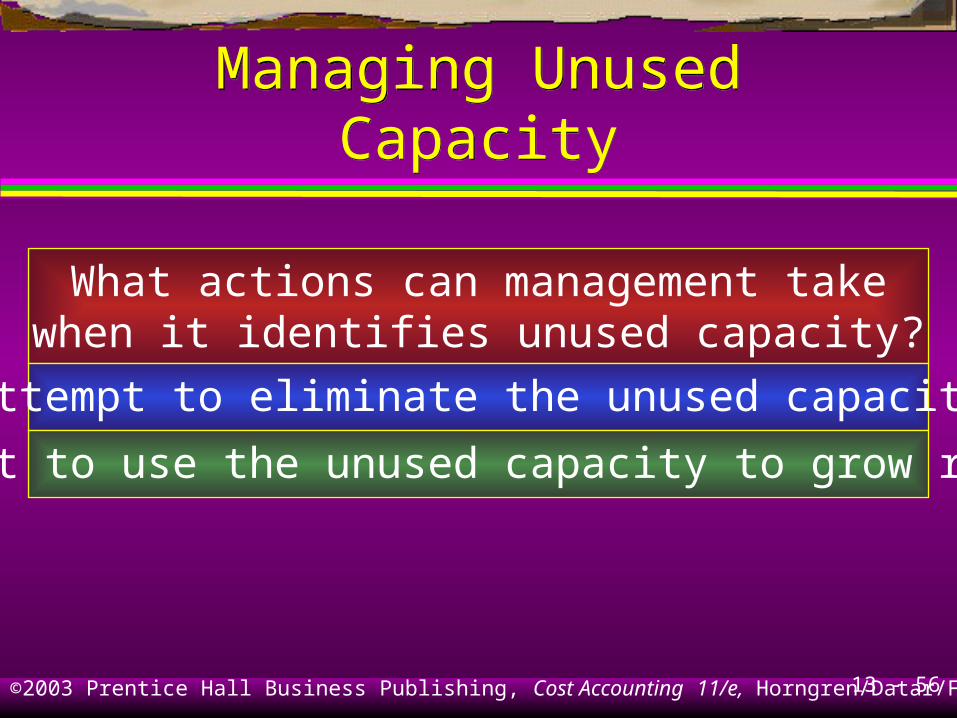
13 - 56©2003 Prentice Hall Business Publishing, Cost Accounting 11/e, Horngren/Datar/Foster
Managing Unused CapacityManaging Unused Capacity
What actions can management takewhen it identifies unused capacity?
Attempt to eliminate the unused capacity
Attempt to use the unused capacity to grow revenue

13 - 57©2003 Prentice Hall Business Publishing, Cost Accounting 11/e, Horngren/Datar/Foster
End of Chapter 13End of Chapter 13