Embed Size (px)
Citation preview

13-1
Surface Analysis
• Surface interface controls many aspects of chemistry Catalysts Corrosion Thin films
• Surfaces• Methods

13-2
Surface• Boundary between solid and other phase
Gas, vacuum, liquid• Surface differs from solid bulk
Decarburised surface layer on the seal rim. Preferential grain boundary oxidation evident

13-3
Spectroscopic Surface Methods
• Incident beam and secondary beam Photons, electrons
Incident particle not same as secondary

13-4
X-ray photoelectron spectroscopy
• Examination of surface with x-rays and measurement of electrons Evaluation of elements on
surface by x-rays and Auger A+->A+*+e-
Electron energy (Ek) is measured
* Eb=Ek-w
w is work function

13-5
XPS
• The momentum p of the outgoing electron is determined from the kinetic energy

13-6
XPS spectra
• Chemical shifts can be observed Variation with
oxidation state Substituant groups

13-7
Auger Electron Spectroscopy
• A+e1-->A+*+e1
-’+eA-
Relaxation can occur in two ways A+* => A++ + eA-
* eA- = Auger electron• A+* => A+ + f
Auger emission types KLL LMM MNN
Removal, transition to removed state, ejection of electron
• favored by low atomic number elements
hf => fluorescence photon

13-8
Auger Electron Spectroscopy

13-9
Ceramic Synthesis
Precipitate-acetone mix from Zr, Th, U salts with NH4OH
≈5 g total salt
Dried at 90°C
Final Product•Calcination, Reduction, Sintering
Similar to other procedures for fuel preparation

13-10
Ceramic Synthesis Parameters• Use of H2 and reduction step examined
Calcination Performed in air at 750 oC for one hour
Reduction One hour at 600 oC under Ar/4% H2
• Powders placed in 5 mm die and cold pressed at 55 MPa for 1-2 minutes Low pressure, higher surface area
Not to standard fuel surface areas• Sintering
Performed in air or Ar/4% H2(g) at 1500 oC for 4 hours

13-11
Ceramic Characterization
• EDX (Energy Dispersive X-ray) (e-) Emission of characteristic X-rays
• XRD (X-ray diffraction) ()
• EELS (Electron Energy Loss Spectroscopy) (e-) Loss of energy by monoenergetic e-
Can be used to determine oxidation state
3d3/2 -> 5f5/2 (M4) and 3d5/2 -> 5f7/2 (M5) ratio
* Based on lanthanides
• XANES/EXAFS () Oxidation state and near neighbor chemistry

13-12
0.5m 0.5m
TEM Picture Th Zr U Mg
0.5m0.5m 0.5m
• Two phases found
• Low mutual solubility of Zr and Th Zr rich and Th rich phase Little solubility of Th in Zr
• U and Mg distributed throughout the ceramic
EDX ResultsElement bright in EDX mapping

13-13
XRD Results: Standards
ThO2
UO2
U3O8

13-14 No effect on the inclusion of reduction step: U as U(IV)
Influence of synthesis conditions
Zr6Th3UO20
Calcined in air/No reduction
Calcined in air/Reduction

13-15
XRD Results• U is reduced to the tetravalent state in Zr-Th-U ceramic
Th and Zr stabilize tetravalent U Calcine in air, no reduction step, sinter under
Ar/4% H2
• Zr-U ceramic requires reduction step• Calcination performed under reducing conditions
more U incorporated into the ZrO2 lattice structure• Unit Cell Measured for Th3UO8
5.57+0.01 Å

13-16
Th-U solid solution cell parameters
0,0 0,2 0,4 0,6 0,8 1,0
5,46
5,48
5,50
5,52
5,54
5,56
5,58
5,60
5,62
a (Å) = 5.598(4) - 0.124(6) x (U)
Uni
t ce
ll p
aram
eter
(Å
)
Substitution ratio (x)
Black points from Hubert et al (2001)

13-17
EELS Spectra
0
500
1000
1500
2000
3400 3500 3600 3700 3800 3900
Th rich phaseZr rich phase
Co
un
ts
Energy Loss (eV)
Th M4 Edge
Th M5 Edge
U M5 Edge
U M4 Edge
ZrTh3UO10

13-18
EELS analysis• Evaluation of U oxidation state
Multiple analysis of samples Evaluation of M4/M5 ratio for U
UO2: 0.41±0.03
U3O8: 0.48±0.04
Th3UO8: 0.40±0.03
ZrTh3UO10: 0.40±0.03
* Tetravalent U for above samples
• U oxidation with higher Zr is noted in some samples Air ingress into furnace

13-19
X-ray Absorption Spectroscopy
• Utilizes x-rays from synchrotron source to probe local structure High intensity, broad spectral range
• Spectra can be separated into regions containing different information
• Global technique yields average structure of sample

13-20
XAS setup

13-21
XAS spectrum

13-22
XANES Spectroscopy
• X-Ray Absorption Near Edge Structure
• Region between absorption edge and start of EXAFS oscillations, up to 40 eV above edge
• Absolute position of edge contains information on oxidation state
• Also contains information on vacant orbitals, electronic configuration, and site symmetry

13-23
EXAFS Spectroscopy
• X-ray Absorption Fine Structure• Above absorption edge, photoelectrons created by
absorption of x-ray• Backscattering photoelectrons effect x-ray absorption
Oscillations in absorption above edge Oscillations used to determine
atomic number Distance coordination number of nearest neighbors

13-24
XAS Procedure
• Scanned U, Th, and Zr separately Th L 3 edge to k = 13 U L 3 edge to k = 14 Zr K edge to k = 14 U L 2 edge also scanned
• Th EXAFS interference in U spectra due to proximity of edges

13-25
Th and U Edges

13-2617160 17190 17220 172501.0
1.5
2.0
2.5
3.0
3.5
4.0
4.5
5.0
5.5
6.0
6.5
No
rma
lize
d A
bso
rba
nce
eV
UO2 Std
Th3UO
8
ZrUO2
ZrTh3UO
xx
ZrTh3UO
xx+ Mg
Zr3Th
3UO
xx
Zr3Th
3UO
xx+ Mg
Zr6Th
3UO
xx
Zr6Th
3UO
xx+ Mg
Uranyl Std
U3O
8 std
Uranium XANES
• Tetravalent U for Zr=0 or 1
• U oxidation evident with higher Zr Agrees with
EELS
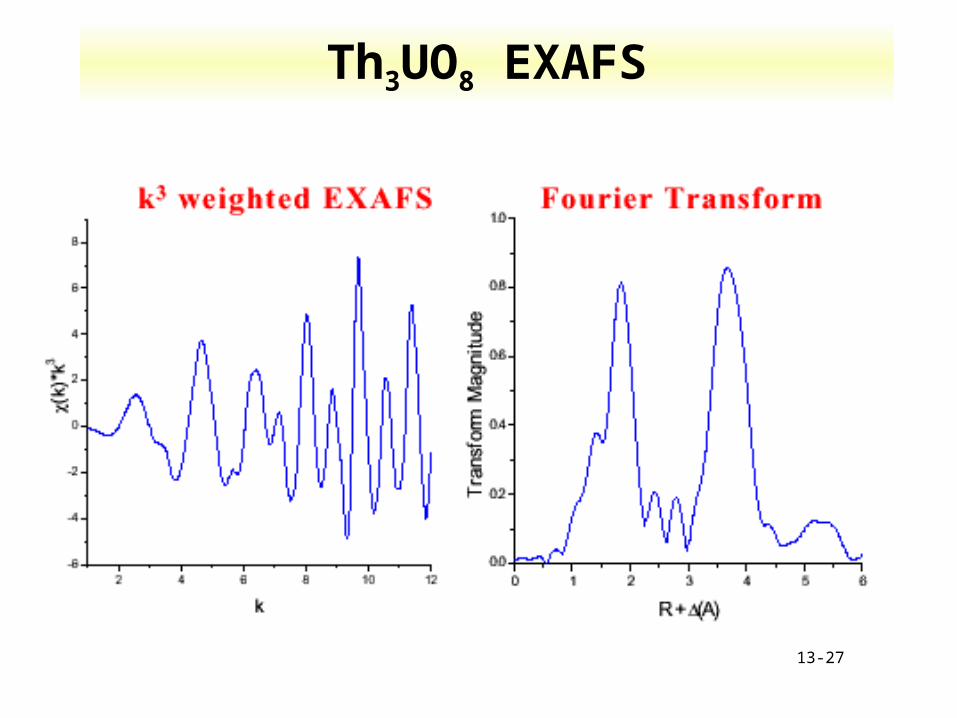
13-27
Th3UO8 EXAFS

13-28
EXAFS Analysis
• EXAFS equation
• Phase(k) and Amp(k) calculated from theory• Fit data to determine:
N coordination number
R bond length
Debye-Waller term

13-29
EXAFS• Zr and U interchangeability limited
Mg affects U solubility Increase in Mg decrease in U solubility
• ThO2 structure
U and Th completely interchangeable in latticeTh-Th(U): 3.941 + 0.010ÅTh-O: 2.402 + 0.005 Å

13-30
Th-Th(U) and Th-O distance

13-31
Characterization Results
• Two phases Th rich and Zr rich
• Tetravalent U in ZrTh3UO10 and Th3UO8
Identified by EELS and XANES• Unit Cell Parameter and Th interatomic distances agree
with other work
• Solubility Experiments pH 4, 7, and 10 under Ar, pH 4, 5.25, 6.5 under
Ar/10% CO2
Collect samples up to 5 months