Embed Size (px)
Citation preview
IMPORTANT. Please refer to keplercheuvreux.com\disclaimer for “Important disclosures” and analyst certification(s).
keplercheuvreux.com This research is the product of Kepler Cheuvreux, which is authorized and regulated by the Autorité des Marchés Financiers in France.
.Kepler Cheuvreux and the issuer have agreed that Kepler Cheuvreux will produce and disseminate investment research on the said issuer as a service to the issuer.
Release date: 13 April 2021 Market data as of: 12 April 2021
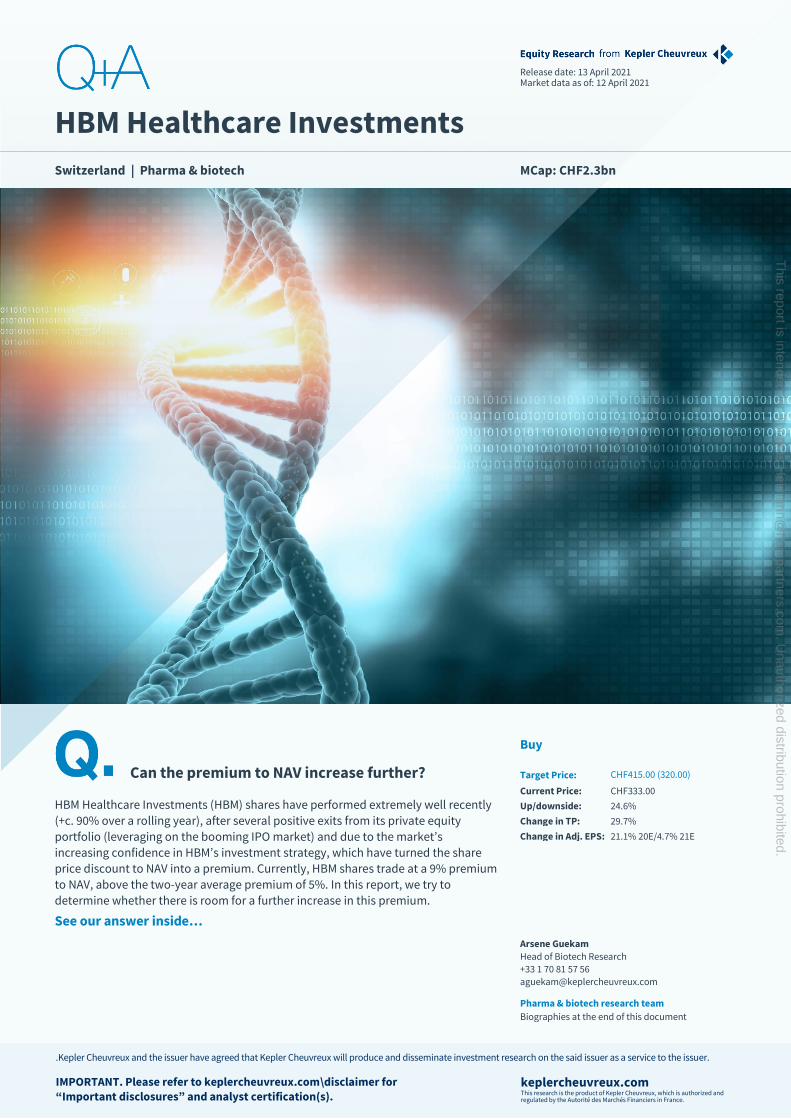
HBM Healthcare Investments
Switzerland | Pharma & biotech MCap: CHF2.3bn
Can the premium to NAV increase further?
Buy Target Price: CHF415.00 (320.00)
Current Price:
CHF333.00
HBM Healthcare Investments (HBM) shares have performed extremely well recently
(+c. 90% over a rolling year), after several positive exits from its private equity
portfolio (leveraging on the booming IPO market) and due to the market’s
increasing confidence in HBM’s investment strategy, which have turned the share
price discount to NAV into a premium. Currently, HBM shares trade at a 9% premium
to NAV, above the two-year average premium of 5%. In this report, we try to
determine whether there is room for a further increase in this premium.
See our answer inside…
Up/downside: 24.6%
Change in TP: 29.7%
Change in Adj. EPS: 21.1% 20E/4.7% 21E
Arsene Guekam
Head of Biotech Research
+33 1 70 81 57 56
Pharma & biotech research team
Biographies at the end of this document
This report is intended for T
homas.H
eimann@
hbmpartners.com
. Unauthorized distribution prohibited.

HBM Healthcare Investments Buy | Target Price: CHF415.00TP_H$
keplercheuvreux.com 2
Q+A in 1 minute
Change in Sales: down nm 20E/down nm
21E Change in Adj EBIT: none/
While we see little room for a further improvement in the premium to NAV, there is still hidden value
Bloomberg: HBMN SW Reuters: HBMN.S
Free float 100.0%
Avg. daily volume (CHFm) 0.4
YTD abs performance 9.2%
52-week high/low (CHF) 351.00/201.00
Solid track record: HBM has a well-balanced portfolio of investments in public and
private companies, and a successful long-term exit strategy (IPO or trade sale).
Shareholders also benefit from an attractive return (a dividend in the range of 5%
per year and share buyback), which has led to sustainable performance of +132%
over the last three years (including dividends) ‒ one of the best among its peers,
strengthening HBM Healthcare’s credibility with new investors.
Successful exit strategy: HBM focuses mainly on investments in small-cap
companies with innovative platforms and original drug candidates. After HBM’s
investment team carries out rigorous due diligence, subsequent rounds of
financing are possible if they see further value creation potential. While HBM is a
long-only investor, it remains firmly focused on its exit strategy. Over the last
decade, the company has carried out more than 60 trade sales and IPOs. Since
2017, the average ROI of the assets exiting the private portfolio has been over 100%.
Strong fundamentals: In the OECD countries, annual expenditure in the healthcare
industry amounts to c. 9% of a country’s GDP, on average. Global demand for
prescription drugs will sustain this strong trend over the next decade, thanks to
robust fundamentals including ageing populations, lifestyle changes and the
innovation cycle in the pharma/biotech sector. Innovation is the most important
driver for biotech companies, which are the main investment target for HBM.
Hidden value: While we see little room for further improvement in the premium to
NAV, we believe that the full potential of HBM’s investments is not yet fully priced in
at current valuation levels. Hence, we update our valuation model to factor in the
positive development of the portfolio, including higher target prices for companies
in the portfolio and a 10% premium to NAV compared to 5% previously. We raise
our TP to CHF415, implying 24% upside, and reiterate our Buy rating.
FY to 31/03 (CHF) 03/21E 03/22E 03/23E
Sales (m) 0.0 0.0 0.0
EBITDA adj (m) 0.0 0.0 0.0
EBIT adj (m) 0.0 0.0 0.0
Net profit adj (m) 753.1 190.0 215.7
Net financial debt (m) -579.8 -580.7 -676.9
FCF (m) 703.3 52.1 157.0
EPS adj. and ful. dil. 108.25 27.31 31.00
Consensus EPS 99.24 24.63 40.01
Net dividend 8.07 8.39 8.73
FY to 31/03 03/21E 03/22E 03/23E
P/E adj and ful. dil. 3.1 12.2 10.7
EV/EBITDA na na na
EV/EBIT na na na
FCF yield 30.4% 2.2% 6.8%
Dividend yield 2.4% 2.5% 2.6%
ND(F+IFRS16)/EBITDA na na na
Gearing -20.7% -19.0% -19.7%
ROIC na na na
EV/IC na na na
Research Framework
Investment case
Pharma trends and dynamics remain solid, and HBM has
demonstrated its ability to identify the value of promising
biotechs early on. HBM has a well-balanced portfolio of
public and private companies, and a successful long-term
exit strategy (IPO or trade sale).
Shareholders benefit from an attractive return (a dividend
in the range of 5% per year and a share buyback), leading
to sustainable performance. As a result, HBM’s shares
posted one of the best five-year performances among its
peers.
Lastly, the non-listed investments could hide interesting
value, as they are valued at their acquisition cost in our
model.
Catalysts
Any exit coming from the private portfolio (IPO or trade
sale).
Increase M&A activity from large pharma companies
Positive clinical trials in the public portfolio.
Valuation methodology
Our valuation is based on the NAV of all investments, plus a
10% premium to NAV.
We expect the NAV of HBM’s public company portfolio to
reach the value implied by analysts’ and consensus’s target
prices, while the valuation of investments in private
companies are included at their acquisition costs or the
price of the last round of financing.
Our valuation points to a target price of CHF415.
Risks to our rating
Failure in clinical trials.
Sales ramp-up of revenue-generating companies of the
portfolio.
Loss of confidence in HBM's investment team is likely to
lead to a decrease of the premium to NAV.
HBM Healthcare Investments Buy | Target Price: CHF415.00
keplercheuvreux.com 3
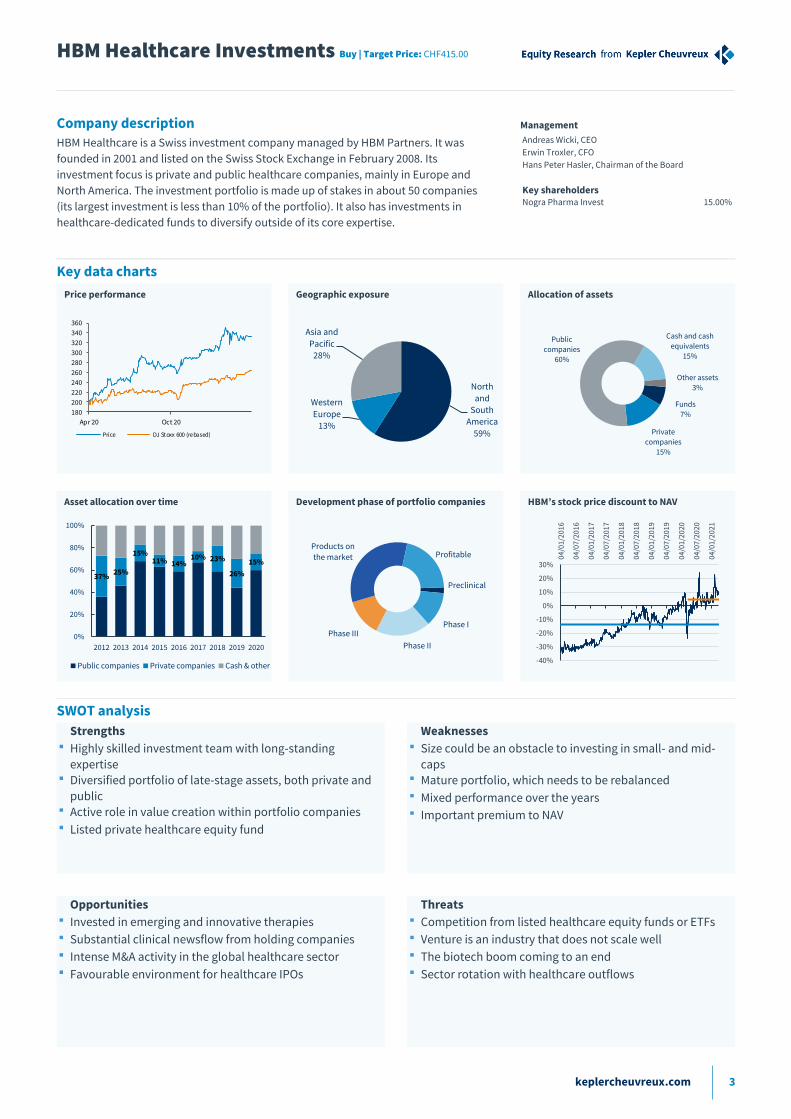
Company description Management
HBM Healthcare is a Swiss investment company managed by HBM Partners. It was
founded in 2001 and listed on the Swiss Stock Exchange in February 2008. Its
investment focus is private and public healthcare companies, mainly in Europe and
North America. The investment portfolio is made up of stakes in about 50 companies
(its largest investment is less than 10% of the portfolio). It also has investments in
healthcare-dedicated funds to diversify outside of its core expertise.
Andreas Wicki, CEO
Erwin Troxler, CFO
Hans Peter Hasler, Chairman of the Board
Key shareholders
Nogra Pharma Invest 15.00%
Key data charts
Price performance Geographic exposure Allocation of assets
Asset allocation over time Development phase of portfolio companies HBM’s stock price discount to NAV
Price performance Sale s split by regionSal es split by divi sionFCFSales a nd EBI TD A marginFCF a nd Capex to sales
SWOT analysis Strengths
Highly skilled investment team with long-standing
expertise Diversified portfolio of late-stage assets, both private and
public Active role in value creation within portfolio companies
Listed private healthcare equity fund
Weaknesses
Size could be an obstacle to investing in small- and mid-
caps Mature portfolio, which needs to be rebalanced
Mixed performance over the years Important premium to NAV
Opportunities
Invested in emerging and innovative therapies
Substantial clinical newsflow from holding companies
Intense M&A activity in the global healthcare sector
Favourable environment for healthcare IPOs
Threats
Competition from listed healthcare equity funds or ETFs
Venture is an industry that does not scale well
The biotech boom coming to an end
Sector rotation with healthcare outflows
180
200
220
240
260
280
300
320
340
360
Apr 20 Oct 20
Price DJ Stoxx 600 (rebased)
North
and
South
America
59%
Western
Europe
13%
Asia and
Pacific
28%
Funds
7%
Private
companies
15%
Public
companies
60%
Cash and cash
equivalents
15%
Other assets
3%
37%25%
15%11% 14%
10% 23%
26%
15%
0%
20%
40%
60%
80%
100%
2012 2013 2014 2015 2016 2017 2018 2019 2020
Public companies Private companies Cash & other
Preclinical
Phase I
Phase II
Phase III
Products on
the market Profitable
-40%
-30%
-20%
-10%
0%
10%
20%
30%04
/01
/20
16
04/0
7/2
016
04/0
1/2
017
04/0
7/2
017
04/0
1/2
018
04/0
7/2
018
04/0
1/2
019
04/0
7/2
019
04/0
1/2
020
04/0
7/2
020
04/0
1/20
21
HBM Healthcare Investments Buy | Target Price: CHF415.00
keplercheuvreux.com 4
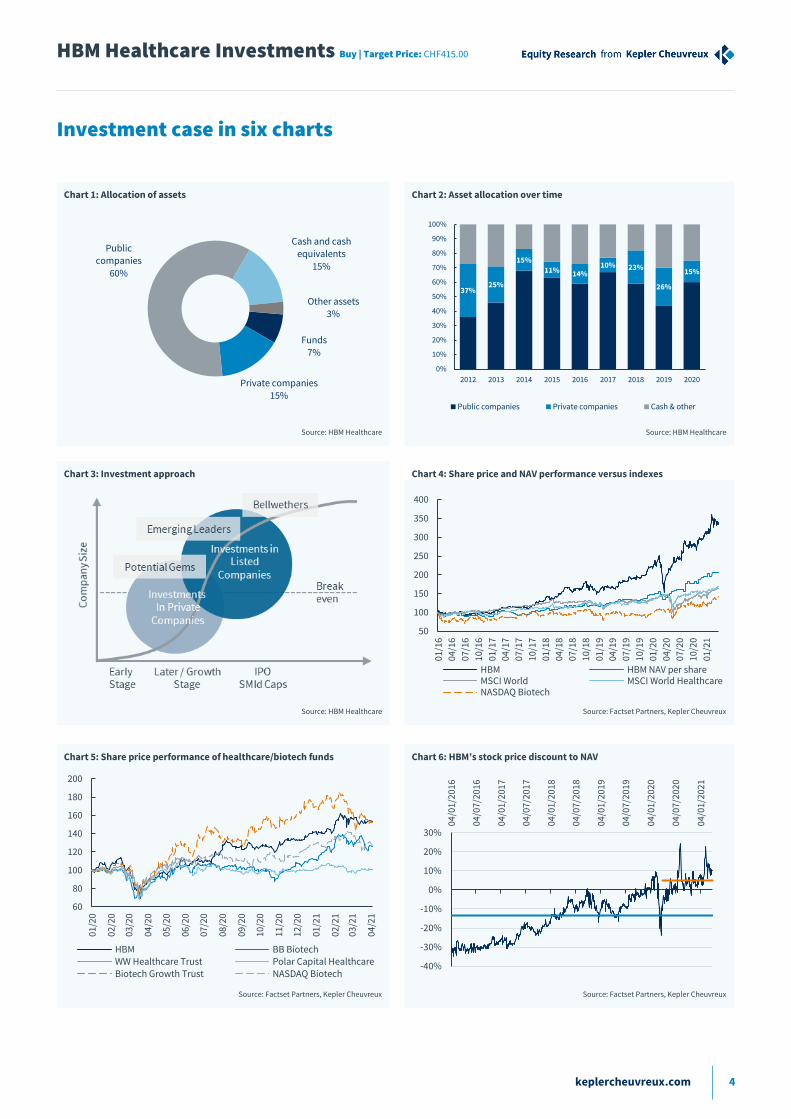
Investment case in six charts
Chart 1: Allocation of assets Chart 2: Asset allocation over time
Source: HBM Healthcare Source: HBM Healthcare
Chart 3: Investment approach Chart 4: Share price and NAV performance versus indexes
Source: HBM Healthcare Source: Factset Partners, Kepler Cheuvreux
Chart 5: Share price performance of healthcare/biotech funds Chart 6: HBM’s stock price discount to NAV
Source: Factset Partners, Kepler Cheuvreux Source: Factset Partners, Kepler Cheuvreux
Funds 7%
Private companies 15%
Public companies
60%
Cash and cash equivalents
15%
Other assets 3%
37%25%
15%
11% 14%10% 23%
26%
15%
0%
10%
20%
30%
40%
50%
60%
70%
80%
90%
100%
2012 2013 2014 2015 2016 2017 2018 2019 2020
Public companies Private companies Cash & other
50
100
150
200
250
300
350
400
01/1
6
04/1
6
07/1
6
10/1
6
01/1
7
04/1
7
07/1
7
10/1
7
01/1
8
04/1
8
07/1
8
10/1
8
01/1
9
04/1
9
07/1
9
10/1
9
01/2
0
04/2
0
07/2
0
10/2
0
01/2
1
HBM HBM NAV per shareMSCI World MSCI World HealthcareNASDAQ Biotech
60
80
100
120
140
160
180
200
01/2
0
02/2
0
03/2
0
04/2
0
05/2
0
06/2
0
07/2
0
08/2
0
09/2
0
10/2
0
11/2
0
12/2
0
01/2
1
02/2
1
03/2
1
04/2
1
HBM BB BiotechWW Healthcare Trust Polar Capital HealthcareBiotech Growth Trust NASDAQ Biotech
-40%
-30%
-20%
-10%
0%
10%
20%
30%
04/0
1/20
16
04/0
7/20
16
04/0
1/20
17
04/0
7/20
17
04/0
1/20
18
04/0
7/20
18
04/0
1/20
19
04/0
7/20
19
04/0
1/20
20
04/0
7/20
20
04/0
1/20
21
HBM Healthcare Investments Buy | Target Price: CHF415.00
Contents
Q+A in 1 minute 2
Investment case in six charts 4
Can the current premium to NAV increase further? 6
Discount to NAV has turned into a premium 6
Solid track record underpinned by a rigorous investment process 8
A successful exit strategy 8
A rigorous investment process 9
Strong fundamentals and underlying trends 12
Strong fundamentals primarily drive spending growth 12
Biotech is leading the drive for innovation in the pharma industry 15
Funding is not an issue 16
Investment conclusion 20
Buy, TP up from CHF320 to CHF415 20
Valuation table 24
Income statement 25
Cash flow statement 26
Balance sheet 27
Research ratings and important disclosures 28
Legal and disclosure information 30

HBM Healthcare Investments Buy | Target Price: CHF415.00
keplercheuvreux.com 6
Can the current premium to NAV increase further?
HBM Healthcare invests in promising private and listed biotech companies. Part of the recent
positive share price performance (+88% over a rolling year) has been driven by the street’s
growing awareness of HBM’s expertise in picking healthcare stocks (its investment strategy
focuses on innovative platforms that have been subjected to stringent due diligence). This
solid performance can also be attributed to several successful exits (via IPOs or trade sales)
from the private portfolio.
Historically, the long-term average share price discount to NAV was at 14%. However, the
discount to NAV has steadily decreased over time and has turned into a premium now. HBM
shares currently trade at a 9% premium to NAV, the highest level ever reached by the share, while
the two-year average premium is 5%. While we consider this premium sustainable due to the
company’s successful investment strategy, we wonder if there is room for further improvement
given the limited information available on the companies in the private portfolio.
Discount to NAV has turned into a premium While HBM Healthcare has less exposure to the US market than its peers, its long-term
performance (three to five years) is among the best in its peer group.
Accordingly (thanks to investors’ increasing confidence in HBM’s investment strategy over the last
two years), its NAV has increased by +44%, while its share price has increased by 102%, surpassing
both the MSCI World (+31%) and the MSCI World Healthcare indexes (+35%).
Chart 7: Share price and NAV performance versus indexes
Source: Factset Partners, Kepler Cheuvreux
Hence, in recent years, the share price discount to NAV has decreased significantly. Now HBM is
trading at a premium of 9%, well above its average historical level (a discount of 14%) and slightly
above the average premium for the last two years (+5%). This is a result of the increasing
recognition on the street of HBM Healthcare’s ability to pick winning healthcare stocks which has
allowed it to regularly outperform the market.
We believe that part of this recent outperformance was also due to HBM’s exposure to the private
healthcare market. Companies in the private portfolio (15% of HBM’s total investments) are
included in the NAV at a fair value equal to their acquisition price or the value established during
the last financing round. In recent years, HBM has successfully exited from several companies in
its private portfolio achieving investment returns of over 50% on average.
50
100
150
200
250
300
350
400
01/1
6
04/1
6
07/1
6
10/1
6
01/1
7
04/1
7
07/1
7
10/1
7
01/1
8
04/1
8
07/1
8
10/1
8
01/1
9
04/1
9
07/1
9
10/1
9
01/2
0
04/2
0
07/2
0
10/2
0
01/2
1
HBM HBM NAV per share MSCI World
MSCI World Healthcare NASDAQ Biotech

HBM Healthcare Investments Buy | Target Price: CHF415.00
keplercheuvreux.com 7
Chart 8: HBM’s stock price premium/discount to NAV (average historical level: -14%, average two years: +5%)
Source: Factset Partners, Kepler Cheuvreux
Investors’ increasing confidence in HBM’s ability to pick stocks and reap value from its private
portfolio have presumably contributed to this change in the market perception and the gradual
reduction of the discount to NAV.
However, considering the current premium to NAV (above historical levels), the recent bull market
for biotechs and the limited information available on the companies in the private portfolio, we
wonder if the premium to NAV could improve further.
-40%
-30%
-20%
-10%
0%
10%
20%
30%
04/0
1/20
16
04/0
7/20
16
04/0
1/20
17
04/0
7/20
17
04/0
1/20
18
04/0
7/20
18
04/0
1/20
19
04/0
7/20
19
04/0
1/20
20
04/0
7/20
20
04/0
1/20
21
HBM Healthcare Investments Buy | Target Price: CHF415.00
keplercheuvreux.com 8
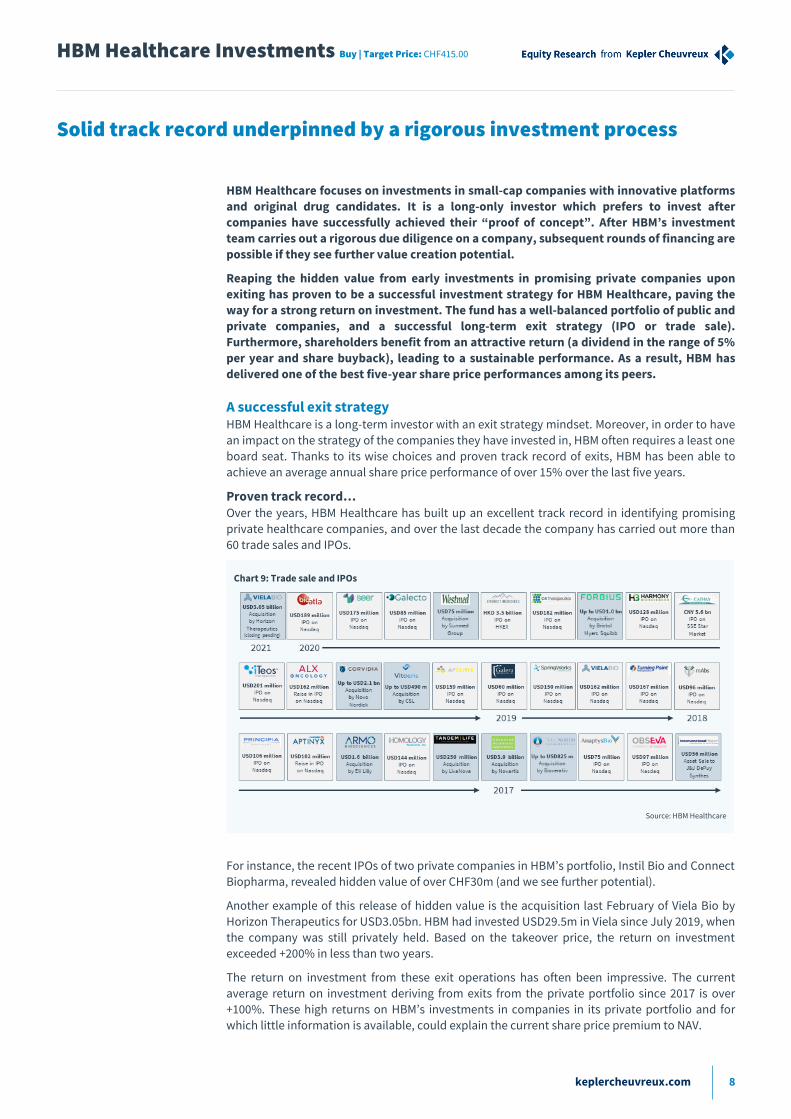
Solid track record underpinned by a rigorous investment process
HBM Healthcare focuses on investments in small-cap companies with innovative platforms
and original drug candidates. It is a long-only investor which prefers to invest after
companies have successfully achieved their “proof of concept”. After HBM’s investment
team carries out a rigorous due diligence on a company, subsequent rounds of financing are
possible if they see further value creation potential.
Reaping the hidden value from early investments in promising private companies upon
exiting has proven to be a successful investment strategy for HBM Healthcare, paving the
way for a strong return on investment. The fund has a well-balanced portfolio of public and
private companies, and a successful long-term exit strategy (IPO or trade sale).
Furthermore, shareholders benefit from an attractive return (a dividend in the range of 5%
per year and share buyback), leading to a sustainable performance. As a result, HBM has
delivered one of the best five-year share price performances among its peers.
A successful exit strategy HBM Healthcare is a long-term investor with an exit strategy mindset. Moreover, in order to have
an impact on the strategy of the companies they have invested in, HBM often requires a least one
board seat. Thanks to its wise choices and proven track record of exits, HBM has been able to
achieve an average annual share price performance of over 15% over the last five years.
Proven track record… Over the years, HBM Healthcare has built up an excellent track record in identifying promising
private healthcare companies, and over the last decade the company has carried out more than
60 trade sales and IPOs.
Chart 9: Trade sale and IPOs
Source: HBM Healthcare
For instance, the recent IPOs of two private companies in HBM’s portfolio, Instil Bio and Connect
Biopharma, revealed hidden value of over CHF30m (and we see further potential).
Another example of this release of hidden value is the acquisition last February of Viela Bio by
Horizon Therapeutics for USD3.05bn. HBM had invested USD29.5m in Viela since July 2019, when
the company was still privately held. Based on the takeover price, the return on investment
exceeded +200% in less than two years.
The return on investment from these exit operations has often been impressive. The current
average return on investment deriving from exits from the private portfolio since 2017 is over
+100%. These high returns on HBM’s investments in companies in its private portfolio and for
which little information is available, could explain the current share price premium to NAV.

HBM Healthcare Investments Buy | Target Price: CHF415.00
keplercheuvreux.com 9
...leading to a strong outperformance Thanks to its active board membership in invested companies and focus on valuable exits, HBM
has gradually built up a solid investment track record. It has successfully surpassed its target to
deliver an annual return of at least 5% on the net assets (+288% over the last five years
corresponding to +31% per year).
Chart 10: A solid and consistent performance
Source: Bloomberg, data as of 31 March 2021 (including dividends)
The performance of the fund has been boosted recently by several successful exits (via IPOs and
trade sales) from the private portfolio (BioAlta, C4 Therapeutics, Cathay Biotech, etc.). This regular
outperformance versus the main indexes (MSCI World Healthcare or Nasdaq Biotech Index, NBI)
provides a clear demonstration of the company’s stock-picking expertise.
Table 1: Comparative performance
Country Perf. 1M Perf. 1Y Perf. 3Y Perf. 5Y Price (Ic) NAV/share Price to NAV
BB Biotech CH 0.2% 68.8% 45.9% 124.8% 84.2 70.8 19%
Biotech growth trust UK 2.7% 94.2% 118.0% 128.1% 19.1 18.3 5% BlackRock Health Sciences US 6.2% 40.5% 57.3% 73.6% 43.8 42.7 3%
HBM Healthcare CH -1.8% 78.9% 132.3% 241.5% 334.5 308.2 9%
International Biotechnology Trust UK 0.2% 45.4% 57.4% 102.5% 9.9 9.7 2% Polar Capital Global Healthcare UK 4.0% 34.6% 35.9% 51.9% 3.1 3.6 -12%
Tekla Healthcare Investors US 5.8% 52.5% 47.2% 51.9% 23.3 23.5 -1% Tekla Healthcare Opportunities US 7.8% 53.7% 64.1% nd 20.7 21.2 -2%
Worldwide Healthcare Trust UK 4.2% 45.8% 55.6% 110.0% 48.8 47.1 4% HBM Healthcare ranking vs peers 9 2 1 1 2
Source: Kepler Cheuvreux
In terms of its annual performance, HBM is the leader in its peer group based on its one-, three-
and five-year performances, while the premium to NAV is among the highest in the sector, only
below BB Biotech, which has benefited from its investment in Moderna and the validation of its
mRNA vaccine technology.
A rigorous investment process HBM Healthcare is a long-only investor which is able to invest in suppliers or manufacturers along
the healthcare value chain. The portfolio is managed by a seasoned investment team whose
members all have a strong professional background in life sciences. The investment focus is on
private and small-cap public biotechnology or medical device companies that have a competitive
edge over their peers.
Essentially, HBM Healthcare’s investment strategy relies on solid due diligence, broad
diversification of the portfolio, and active lead investors in private companies.
50
100
150
200
250
300
350
400
01/16 04/16 07/16 10/16 01/17 04/17 07/17 10/17 01/18 04/18 07/18 10/18 01/19 04/19 07/19 10/19 01/20 04/20 07/20 10/20 01/21
HBM MSCI World MSCI World Healthcare NASDAQ Biotech
HBM Healthcare Investments Buy | Target Price: CHF415.00
keplercheuvreux.com 10
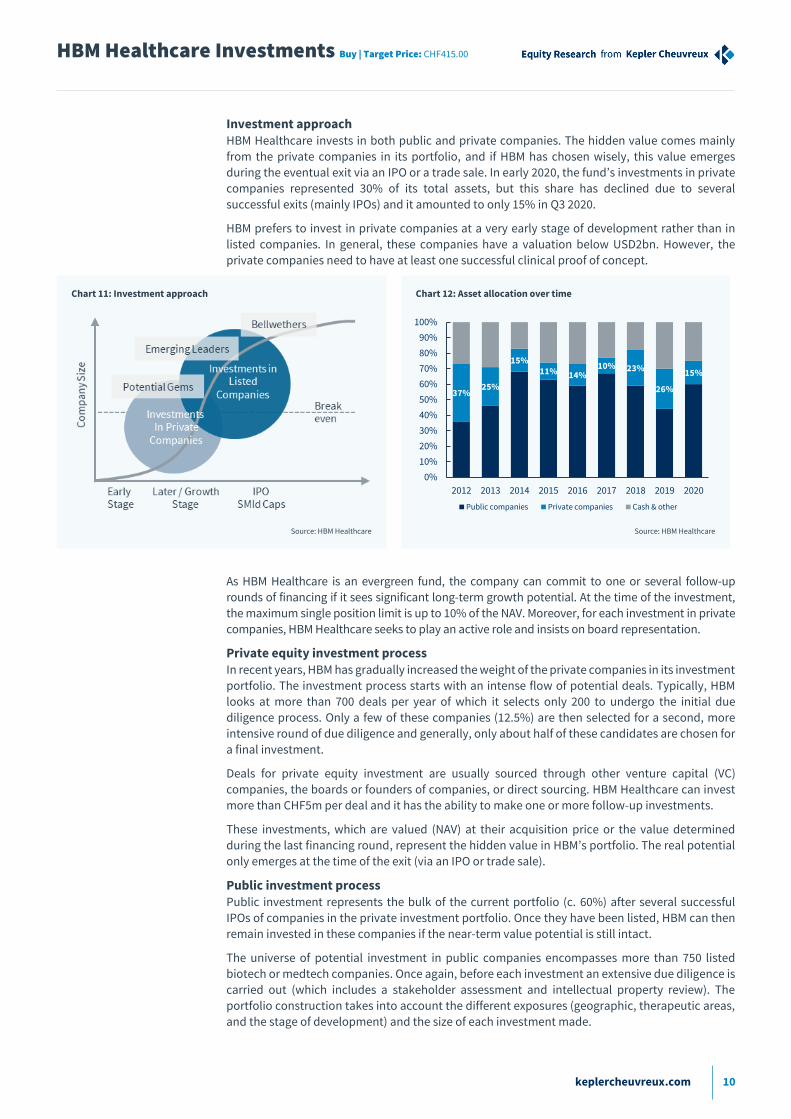
Investment approach HBM Healthcare invests in both public and private companies. The hidden value comes mainly
from the private companies in its portfolio, and if HBM has chosen wisely, this value emerges
during the eventual exit via an IPO or a trade sale. In early 2020, the fund’s investments in private
companies represented 30% of its total assets, but this share has declined due to several
successful exits (mainly IPOs) and it amounted to only 15% in Q3 2020.
HBM prefers to invest in private companies at a very early stage of development rather than in
listed companies. In general, these companies have a valuation below USD2bn. However, the
private companies need to have at least one successful clinical proof of concept.
Chart 11: Investment approach Chart 12: Asset allocation over time
Source: HBM Healthcare Source: HBM Healthcare
As HBM Healthcare is an evergreen fund, the company can commit to one or several follow-up
rounds of financing if it sees significant long-term growth potential. At the time of the investment,
the maximum single position limit is up to 10% of the NAV. Moreover, for each investment in private
companies, HBM Healthcare seeks to play an active role and insists on board representation.
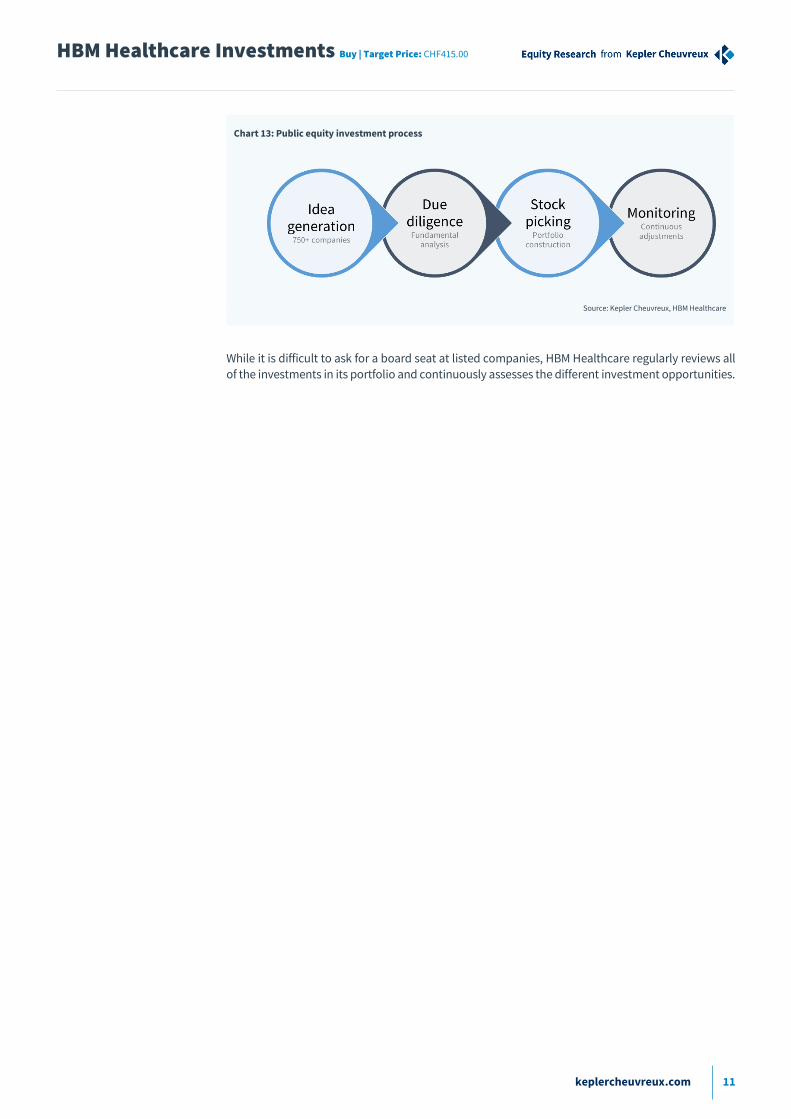
Private equity investment process In recent years, HBM has gradually increased the weight of the private companies in its investment
portfolio. The investment process starts with an intense flow of potential deals. Typically, HBM
looks at more than 700 deals per year of which it selects only 200 to undergo the initial due
diligence process. Only a few of these companies (12.5%) are then selected for a second, more
intensive round of due diligence and generally, only about half of these candidates are chosen for
a final investment.
Deals for private equity investment are usually sourced through other venture capital (VC)
companies, the boards or founders of companies, or direct sourcing. HBM Healthcare can invest
more than CHF5m per deal and it has the ability to make one or more follow-up investments.
These investments, which are valued (NAV) at their acquisition price or the value determined
during the last financing round, represent the hidden value in HBM’s portfolio. The real potential
only emerges at the time of the exit (via an IPO or trade sale).
Public investment process Public investment represents the bulk of the current portfolio (c. 60%) after several successful
IPOs of companies in the private investment portfolio. Once they have been listed, HBM can then
remain invested in these companies if the near-term value potential is still intact.
The universe of potential investment in public companies encompasses more than 750 listed
biotech or medtech companies. Once again, before each investment an extensive due diligence is
carried out (which includes a stakeholder assessment and intellectual property review). The
portfolio construction takes into account the different exposures (geographic, therapeutic areas,
and the stage of development) and the size of each investment made.
37%25%
15%11% 14%
10% 23%
26%
15%
0%
10%
20%
30%
40%
50%
60%
70%
80%
90%
100%
2012 2013 2014 2015 2016 2017 2018 2019 2020
Public companies Private companies Cash & other
HBM Healthcare Investments Buy | Target Price: CHF415.00
keplercheuvreux.com 11
Chart 13: Public equity investment process
Source: Kepler Cheuvreux, HBM Healthcare
While it is difficult to ask for a board seat at listed companies, HBM Healthcare regularly reviews all
of the investments in its portfolio and continuously assesses the different investment opportunities.
HBM Healthcare Investments Buy | Target Price: CHF415.00
keplercheuvreux.com 12
Strong fundamentals and underlying trends
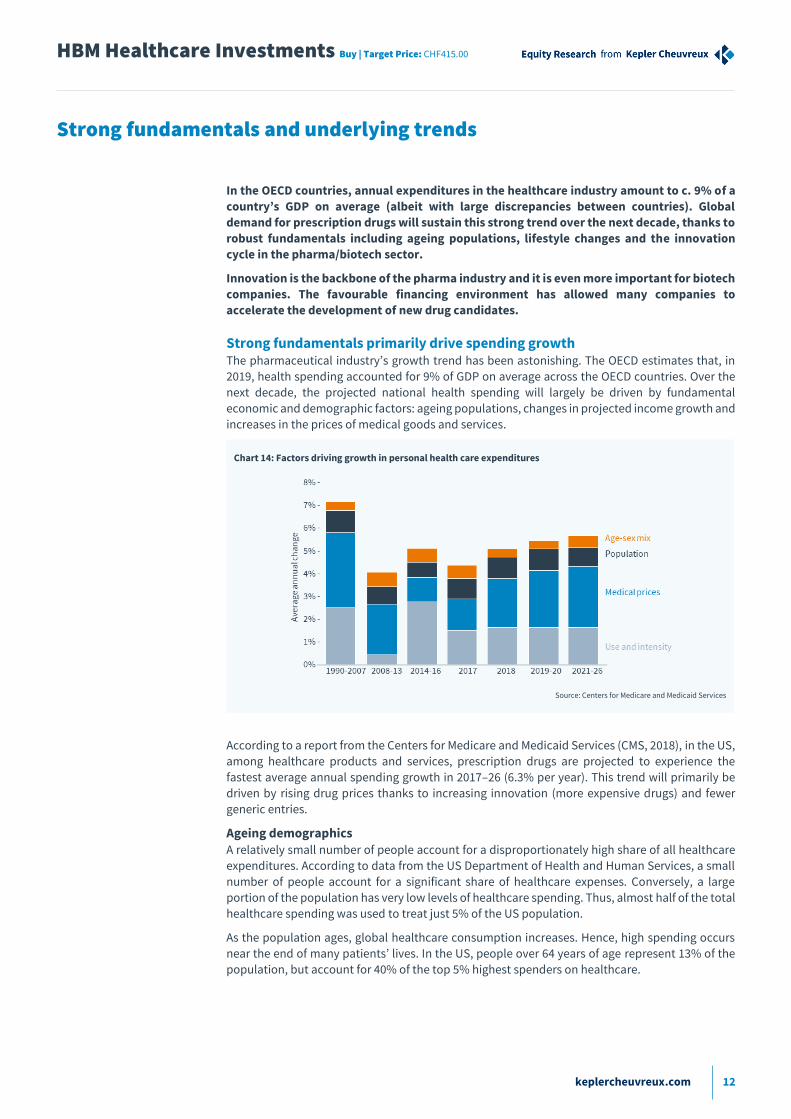
In the OECD countries, annual expenditures in the healthcare industry amount to c. 9% of a
country’s GDP on average (albeit with large discrepancies between countries). Global
demand for prescription drugs will sustain this strong trend over the next decade, thanks to
robust fundamentals including ageing populations, lifestyle changes and the innovation
cycle in the pharma/biotech sector.
Innovation is the backbone of the pharma industry and it is even more important for biotech
companies. The favourable financing environment has allowed many companies to
accelerate the development of new drug candidates.
Strong fundamentals primarily drive spending growth The pharmaceutical industry’s growth trend has been astonishing. The OECD estimates that, in
2019, health spending accounted for 9% of GDP on average across the OECD countries. Over the
next decade, the projected national health spending will largely be driven by fundamental
economic and demographic factors: ageing populations, changes in projected income growth and
increases in the prices of medical goods and services.
Chart 14: Factors driving growth in personal health care expenditures
Source: Centers for Medicare and Medicaid Services
According to a report from the Centers for Medicare and Medicaid Services (CMS, 2018), in the US,
among healthcare products and services, prescription drugs are projected to experience the
fastest average annual spending growth in 2017–26 (6.3% per year). This trend will primarily be
driven by rising drug prices thanks to increasing innovation (more expensive drugs) and fewer
generic entries.
Ageing demographics A relatively small number of people account for a disproportionately high share of all healthcare
expenditures. According to data from the US Department of Health and Human Services, a small
number of people account for a significant share of healthcare expenses. Conversely, a large
portion of the population has very low levels of healthcare spending. Thus, almost half of the total
healthcare spending was used to treat just 5% of the US population.
As the population ages, global healthcare consumption increases. Hence, high spending occurs
near the end of many patients’ lives. In the US, people over 64 years of age represent 13% of the
population, but account for 40% of the top 5% highest spenders on healthcare.
HBM Healthcare Investments Buy | Target Price: CHF415.00
keplercheuvreux.com 13
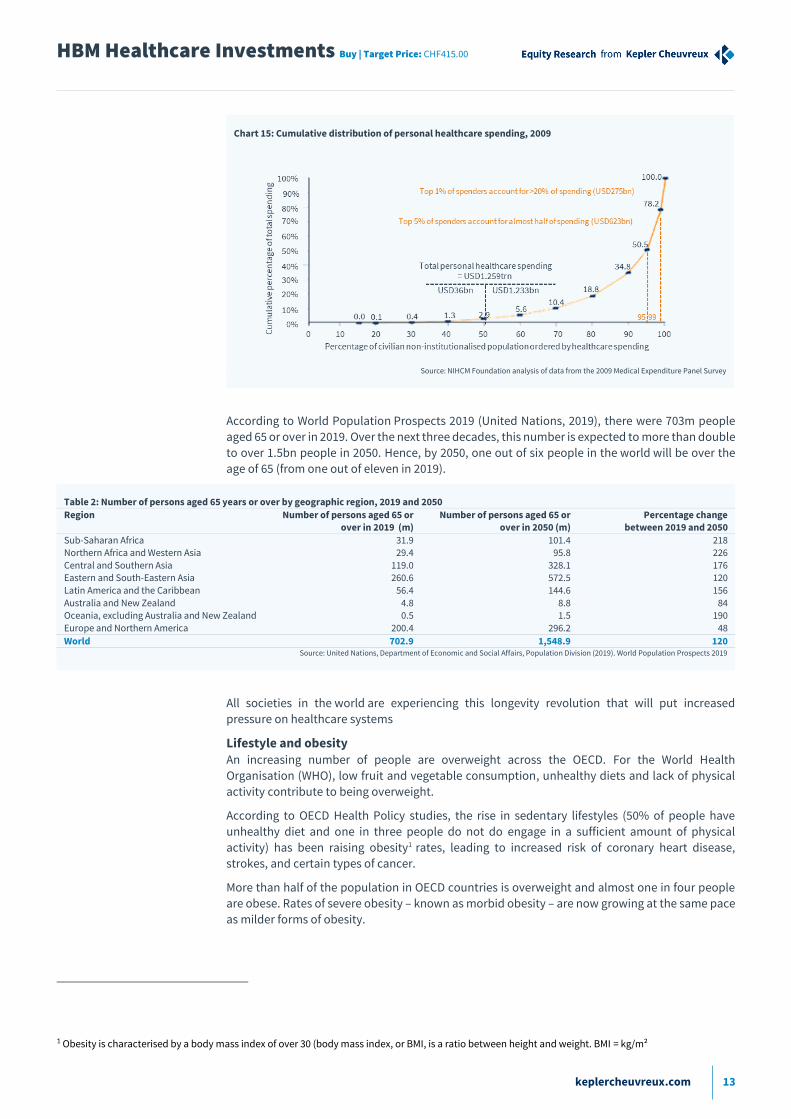
Chart 15: Cumulative distribution of personal healthcare spending, 2009
Source: NIHCM Foundation analysis of data from the 2009 Medical Expenditure Panel Survey
According to World Population Prospects 2019 (United Nations, 2019), there were 703m people
aged 65 or over in 2019. Over the next three decades, this number is expected to more than double
to over 1.5bn people in 2050. Hence, by 2050, one out of six people in the world will be over the
age of 65 (from one out of eleven in 2019).
Table 2: Number of persons aged 65 years or over by geographic region, 2019 and 2050
Region Number of persons aged 65 or over in 2019 (m)
Number of persons aged 65 or over in 2050 (m)
Percentage change between 2019 and 2050
Sub-Saharan Africa 31.9 101.4 218 Northern Africa and Western Asia 29.4 95.8 226
Central and Southern Asia 119.0 328.1 176 Eastern and South-Eastern Asia 260.6 572.5 120
Latin America and the Caribbean 56.4 144.6 156
Australia and New Zealand 4.8 8.8 84 Oceania, excluding Australia and New Zealand 0.5 1.5 190
Europe and Northern America 200.4 296.2 48
World 702.9 1,548.9 120 Source: United Nations, Department of Economic and Social Affairs, Population Division (2019). World Population Prospects 2019
All societies in the world are experiencing this longevity revolution that will put increased
pressure on healthcare systems
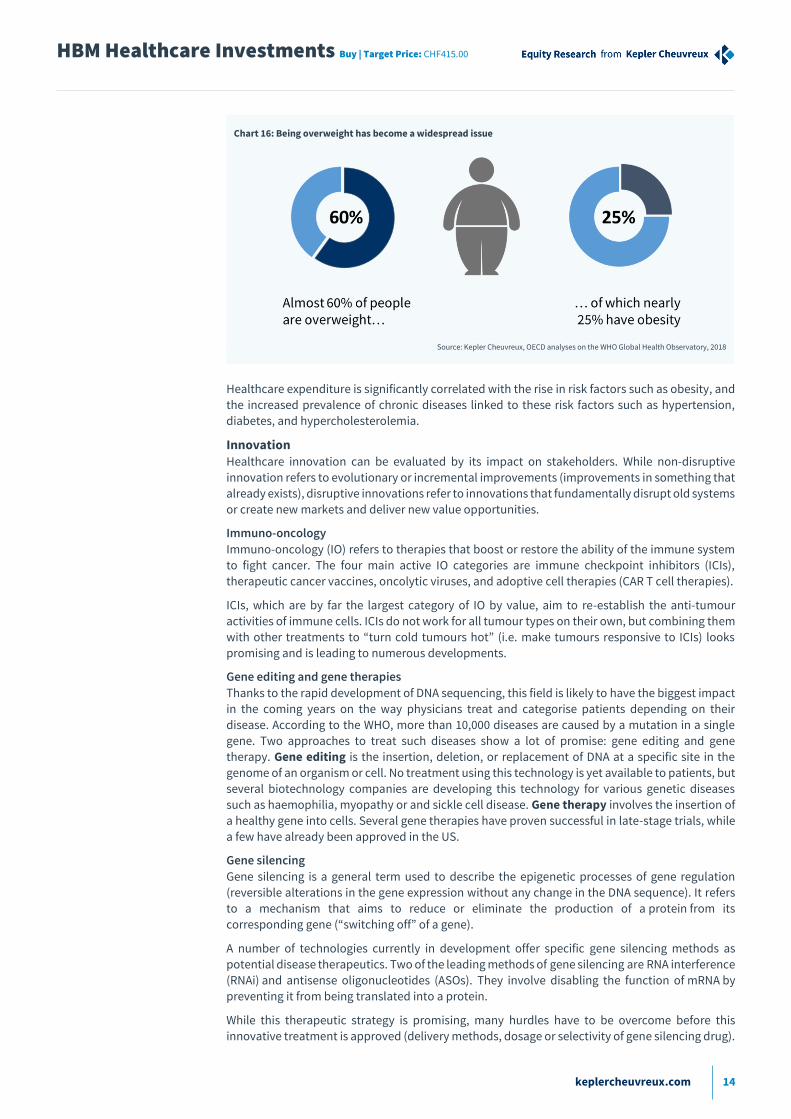
Lifestyle and obesity An increasing number of people are overweight across the OECD. For the World Health
Organisation (WHO), low fruit and vegetable consumption, unhealthy diets and lack of physical
activity contribute to being overweight.
According to OECD Health Policy studies, the rise in sedentary lifestyles (50% of people have
unhealthy diet and one in three people do not do engage in a sufficient amount of physical
activity) has been raising obesity1 rates, leading to increased risk of coronary heart disease,
strokes, and certain types of cancer.
More than half of the population in OECD countries is overweight and almost one in four people
are obese. Rates of severe obesity – known as morbid obesity – are now growing at the same pace
as milder forms of obesity.
1 Obesity is characterised by a body mass index of over 30 (body mass index, or BMI, is a ratio between height and weight. BMI = kg/m²
HBM Healthcare Investments Buy | Target Price: CHF415.00
keplercheuvreux.com 14
Chart 16: Being overweight has become a widespread issue
Source: Kepler Cheuvreux, OECD analyses on the WHO Global Health Observatory, 2018
Healthcare expenditure is significantly correlated with the rise in risk factors such as obesity, and
the increased prevalence of chronic diseases linked to these risk factors such as hypertension,
diabetes, and hypercholesterolemia.
Innovation Healthcare innovation can be evaluated by its impact on stakeholders. While non-disruptive
innovation refers to evolutionary or incremental improvements (improvements in something that
already exists), disruptive innovations refer to innovations that fundamentally disrupt old systems
or create new markets and deliver new value opportunities.
Immuno-oncology
Immuno-oncology (IO) refers to therapies that boost or restore the ability of the immune system
to fight cancer. The four main active IO categories are immune checkpoint inhibitors (ICIs),
therapeutic cancer vaccines, oncolytic viruses, and adoptive cell therapies (CAR T cell therapies).
ICIs, which are by far the largest category of IO by value, aim to re-establish the anti-tumour
activities of immune cells. ICIs do not work for all tumour types on their own, but combining them
with other treatments to “turn cold tumours hot” (i.e. make tumours responsive to ICIs) looks
promising and is leading to numerous developments.
Gene editing and gene therapies
Thanks to the rapid development of DNA sequencing, this field is likely to have the biggest impact
in the coming years on the way physicians treat and categorise patients depending on their
disease. According to the WHO, more than 10,000 diseases are caused by a mutation in a single
gene. Two approaches to treat such diseases show a lot of promise: gene editing and gene
therapy. Gene editing is the insertion, deletion, or replacement of DNA at a specific site in the
genome of an organism or cell. No treatment using this technology is yet available to patients, but
several biotechnology companies are developing this technology for various genetic diseases
such as haemophilia, myopathy or and sickle cell disease. Gene therapy involves the insertion of
a healthy gene into cells. Several gene therapies have proven successful in late-stage trials, while
a few have already been approved in the US.
Gene silencing
Gene silencing is a general term used to describe the epigenetic processes of gene regulation
(reversible alterations in the gene expression without any change in the DNA sequence). It refers
to a mechanism that aims to reduce or eliminate the production of a protein from its
corresponding gene (“switching off” of a gene).
A number of technologies currently in development offer specific gene silencing methods as
potential disease therapeutics. Two of the leading methods of gene silencing are RNA interference
(RNAi) and antisense oligonucleotides (ASOs). They involve disabling the function of mRNA by
preventing it from being translated into a protein.
While this therapeutic strategy is promising, many hurdles have to be overcome before this
innovative treatment is approved (delivery methods, dosage or selectivity of gene silencing drug).
HBM Healthcare Investments Buy | Target Price: CHF415.00
keplercheuvreux.com 15
Immunology and inflammation
Autoimmune disorders and chronic inflammation remain one of the leading causes of disease.
The immune system plays a key role in fighting infection but it is also involved in unwanted
responses such as allergies or excessive chronic inflammation following clearance of pathogens.
Over the past year monoclonal antibodies (mAbs) have been proven to be safe and effective for
the treatment of immune-mediated inflammatory disease (IMID). However, small molecule
immunotherapy is of interest as immunosuppressive mechanisms similar to mAbs can be
targeted, and they are also able to stimulate intracellular pathways.
Biotech is leading the drive for innovation in the pharma industry Biotech is innovating at an increasing speed with many drugs in clinical development by biotech
companies. Due to the externalisation of innovation and R&D from big pharmas, biotech
companies have become the innovation backbone of pharma industry.
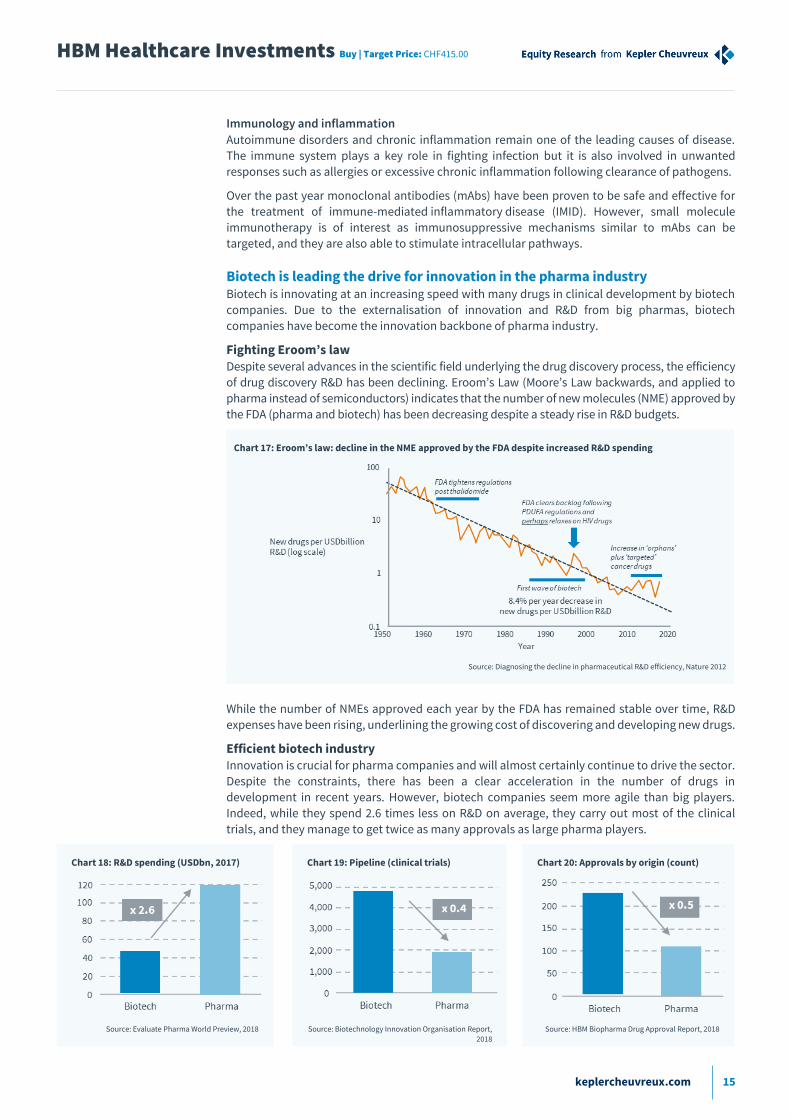
Fighting Eroom’s law Despite several advances in the scientific field underlying the drug discovery process, the efficiency
of drug discovery R&D has been declining. Eroom’s Law (Moore’s Law backwards, and applied to
pharma instead of semiconductors) indicates that the number of new molecules (NME) approved by
the FDA (pharma and biotech) has been decreasing despite a steady rise in R&D budgets.
Chart 17: Eroom’s law: decline in the NME approved by the FDA despite increased R&D spending
Source: Diagnosing the decline in pharmaceutical R&D efficiency, Nature 2012
While the number of NMEs approved each year by the FDA has remained stable over time, R&D
expenses have been rising, underlining the growing cost of discovering and developing new drugs.
Efficient biotech industry Innovation is crucial for pharma companies and will almost certainly continue to drive the sector.
Despite the constraints, there has been a clear acceleration in the number of drugs in
development in recent years. However, biotech companies seem more agile than big players.
Indeed, while they spend 2.6 times less on R&D on average, they carry out most of the clinical
trials, and they manage to get twice as many approvals as large pharma players.
Chart 18: R&D spending (USDbn, 2017) Chart 19: Pipeline (clinical trials) Chart 20: Approvals by origin (count)
Source: Evaluate Pharma World Preview, 2018 Source: Biotechnology Innovation Organisation Report,
2018
Source: HBM Biopharma Drug Approval Report, 2018
HBM Healthcare Investments Buy | Target Price: CHF415.00
keplercheuvreux.com 16
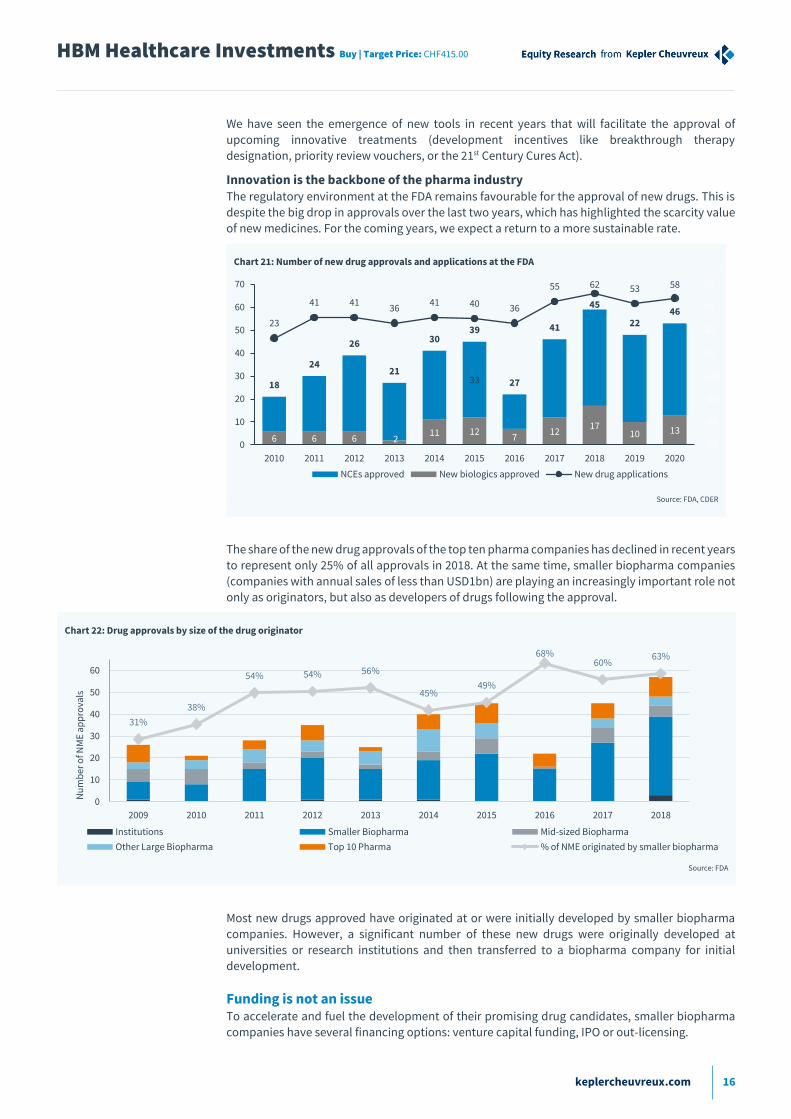
We have seen the emergence of new tools in recent years that will facilitate the approval of
upcoming innovative treatments (development incentives like breakthrough therapy
designation, priority review vouchers, or the 21st Century Cures Act).
Innovation is the backbone of the pharma industry The regulatory environment at the FDA remains favourable for the approval of new drugs. This is
despite the big drop in approvals over the last two years, which has highlighted the scarcity value
of new medicines. For the coming years, we expect a return to a more sustainable rate.
Chart 21: Number of new drug approvals and applications at the FDA
Source: FDA, CDER
The share of the new drug approvals of the top ten pharma companies has declined in recent years
to represent only 25% of all approvals in 2018. At the same time, smaller biopharma companies
(companies with annual sales of less than USD1bn) are playing an increasingly important role not
only as originators, but also as developers of drugs following the approval.
Chart 22: Drug approvals by size of the drug originator
Source: FDA
Most new drugs approved have originated at or were initially developed by smaller biopharma
companies. However, a significant number of these new drugs were originally developed at
universities or research institutions and then transferred to a biopharma company for initial
development.
Funding is not an issue To accelerate and fuel the development of their promising drug candidates, smaller biopharma
companies have several financing options: venture capital funding, IPO or out-licensing.
6 6 6 211 12
712
1710 13
3318
24
26
21
3039
27
41
45
2246
23
41 4136
41 40 36
55 62 53 58
-70
-50
-30
-10
10
30
50
70
0
10
20
30
40
50
60
70
2010 2011 2012 2013 2014 2015 2016 2017 2018 2019 2020
NCEs approved New biologics approved New drug applications
31%
38%
54% 54% 56%
45%49%
68%60%
63%
0
10
20
30
40
50
60
2009 2010 2011 2012 2013 2014 2015 2016 2017 2018
Nu
mb
er o
f NM
E a
pp
rova
ls
Institutions Smaller Biopharma Mid-sized Biopharma
Other Large Biopharma Top 10 Pharma % of NME originated by smaller biopharma
HBM Healthcare Investments Buy | Target Price: CHF415.00
keplercheuvreux.com 17
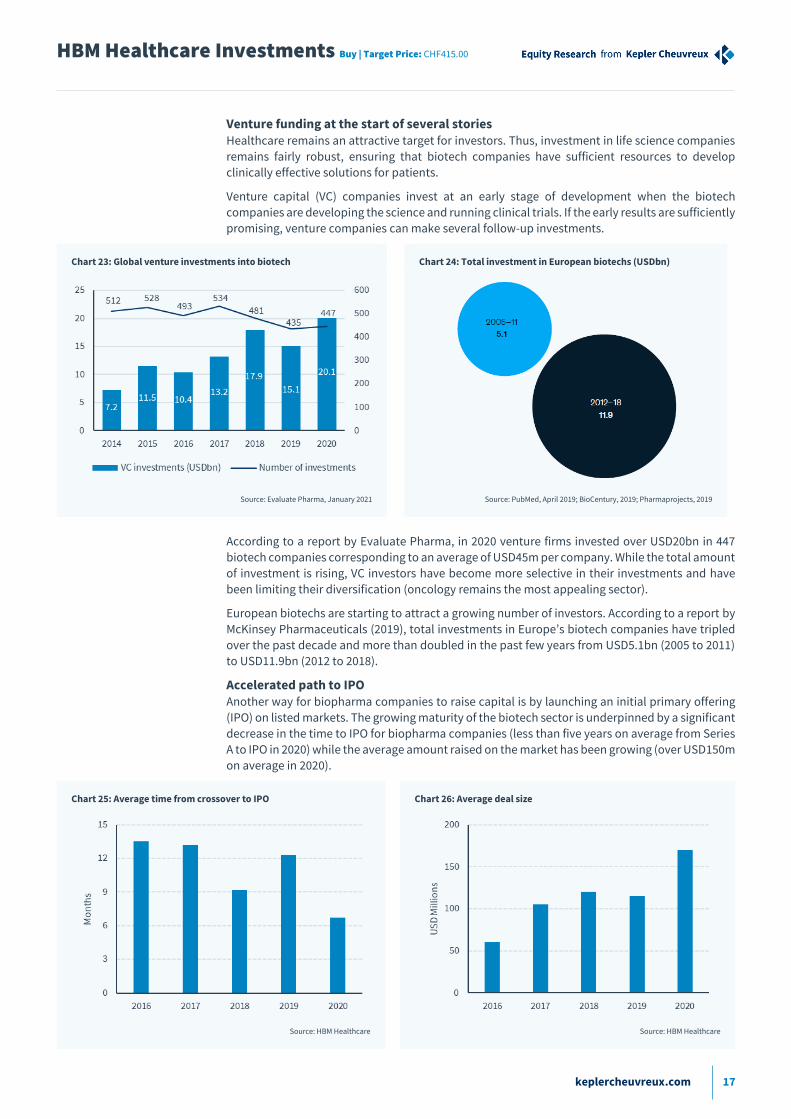
Venture funding at the start of several stories Healthcare remains an attractive target for investors. Thus, investment in life science companies
remains fairly robust, ensuring that biotech companies have sufficient resources to develop
clinically effective solutions for patients.
Venture capital (VC) companies invest at an early stage of development when the biotech
companies are developing the science and running clinical trials. If the early results are sufficiently
promising, venture companies can make several follow-up investments.
Chart 23: Global venture investments into biotech Chart 24: Total investment in European biotechs (USDbn)
Source: Evaluate Pharma, January 2021 Source: PubMed, April 2019; BioCentury, 2019; Pharmaprojects, 2019
According to a report by Evaluate Pharma, in 2020 venture firms invested over USD20bn in 447
biotech companies corresponding to an average of USD45m per company. While the total amount
of investment is rising, VC investors have become more selective in their investments and have
been limiting their diversification (oncology remains the most appealing sector).
European biotechs are starting to attract a growing number of investors. According to a report by
McKinsey Pharmaceuticals (2019), total investments in Europe’s biotech companies have tripled
over the past decade and more than doubled in the past few years from USD5.1bn (2005 to 2011)
to USD11.9bn (2012 to 2018).
Accelerated path to IPO Another way for biopharma companies to raise capital is by launching an initial primary offering
(IPO) on listed markets. The growing maturity of the biotech sector is underpinned by a significant
decrease in the time to IPO for biopharma companies (less than five years on average from Series
A to IPO in 2020) while the average amount raised on the market has been growing (over USD150m
on average in 2020).
Chart 25: Average time from crossover to IPO Chart 26: Average deal size
Source: HBM Healthcare Source: HBM Healthcare
HBM Healthcare Investments Buy | Target Price: CHF415.00
keplercheuvreux.com 18
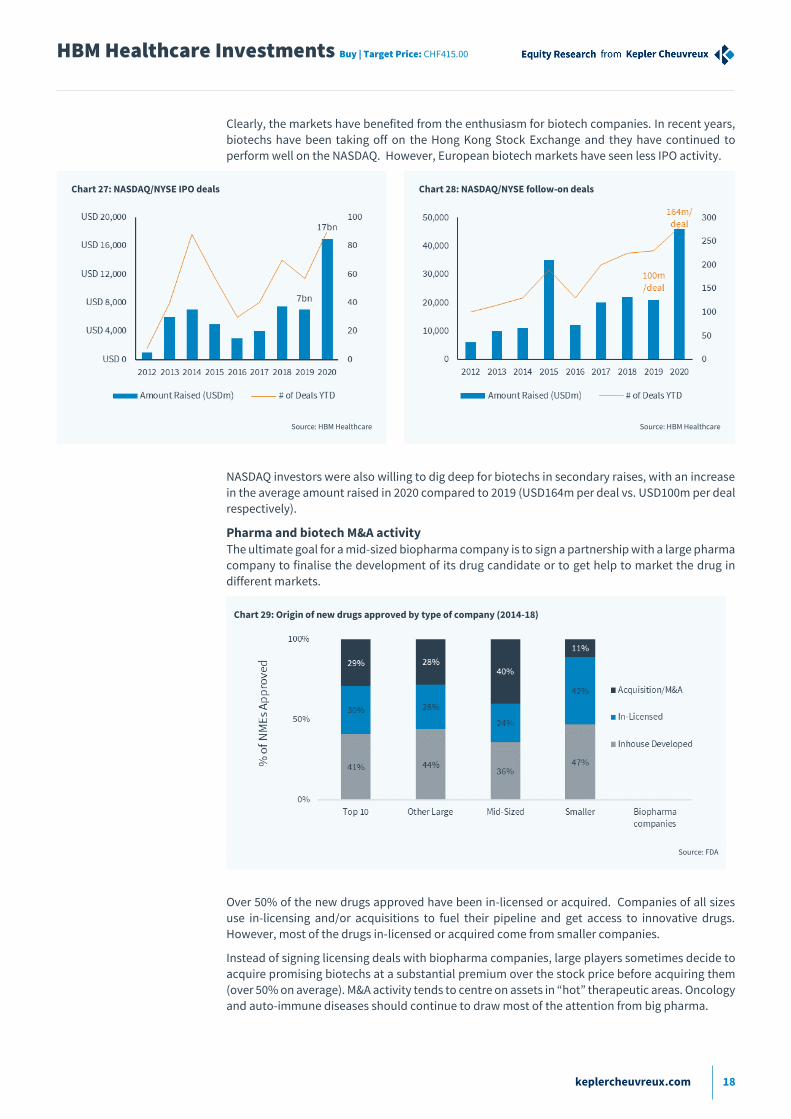
Clearly, the markets have benefited from the enthusiasm for biotech companies. In recent years,
biotechs have been taking off on the Hong Kong Stock Exchange and they have continued to
perform well on the NASDAQ. However, European biotech markets have seen less IPO activity.
Chart 27: NASDAQ/NYSE IPO deals Chart 28: NASDAQ/NYSE follow-on deals
Source: HBM Healthcare Source: HBM Healthcare
NASDAQ investors were also willing to dig deep for biotechs in secondary raises, with an increase
in the average amount raised in 2020 compared to 2019 (USD164m per deal vs. USD100m per deal
respectively).
Pharma and biotech M&A activity The ultimate goal for a mid-sized biopharma company is to sign a partnership with a large pharma
company to finalise the development of its drug candidate or to get help to market the drug in
different markets.
Chart 29: Origin of new drugs approved by type of company (2014-18)
Source: FDA
Over 50% of the new drugs approved have been in-licensed or acquired. Companies of all sizes
use in-licensing and/or acquisitions to fuel their pipeline and get access to innovative drugs.
However, most of the drugs in-licensed or acquired come from smaller companies.
Instead of signing licensing deals with biopharma companies, large players sometimes decide to
acquire promising biotechs at a substantial premium over the stock price before acquiring them
(over 50% on average). M&A activity tends to centre on assets in “hot” therapeutic areas. Oncology
and auto-immune diseases should continue to draw most of the attention from big pharma.
HBM Healthcare Investments Buy | Target Price: CHF415.00
keplercheuvreux.com 19
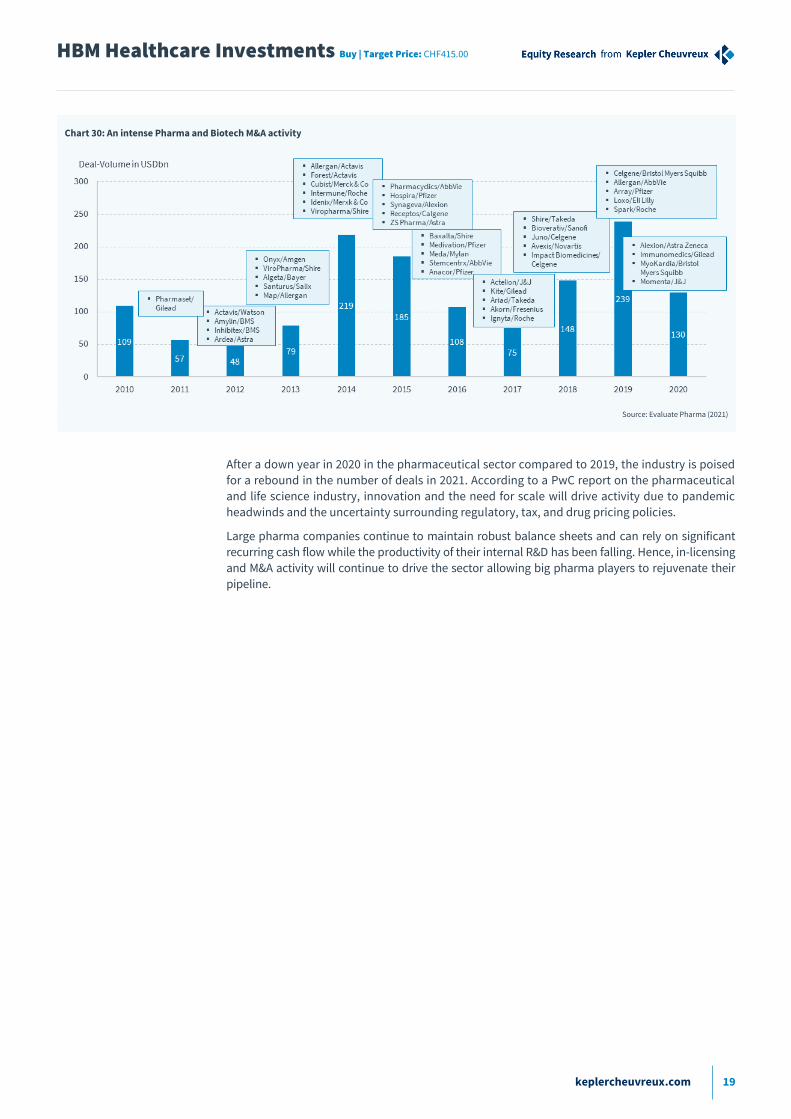
Chart 30: An intense Pharma and Biotech M&A activity
Source: Evaluate Pharma (2021)
After a down year in 2020 in the pharmaceutical sector compared to 2019, the industry is poised
for a rebound in the number of deals in 2021. According to a PwC report on the pharmaceutical
and life science industry, innovation and the need for scale will drive activity due to pandemic
headwinds and the uncertainty surrounding regulatory, tax, and drug pricing policies.
Large pharma companies continue to maintain robust balance sheets and can rely on significant
recurring cash flow while the productivity of their internal R&D has been falling. Hence, in-licensing
and M&A activity will continue to drive the sector allowing big pharma players to rejuvenate their
pipeline.

HBM Healthcare Investments Buy | Target Price: CHF415.00
keplercheuvreux.com 20
Investment conclusion
HBM has been the best-performing stock (medium- and long-term performance) in its peer
group despite having less exposure to the US market (more dynamic, higher valuation). In
our view, this performance is attributable to HBM’s wise selection of listed biotech stocks,
along with its ability to select promising private companies at an early stage of development
and support them until successful exits (trade sales and IPOs). Consequently, the historical
discount to NAV observed in recent years has turned into premium (HBM shares currently
trade at a 9% premium to NAV).
While we see little room for improvement in the premium to NAV, we believe that the
potential of HBM Healthcare’s stakes has not been fully priced in at current valuation levels.
Several biotechs in the private portfolio went public recently, allowing for the release of
more information on these companies. Moreover, several analysts have initiated the
coverage of these companies with ambitious target prices.
We use a NAV-based valuation for HBM including consensus target prices for public
companies. Against this backdrop, we update our model and apply a 10% premium to NAV to
take into account the positive development of the portfolio (vs. 5% previously). Accordingly,
we lift our TP to CHF415, implying 24% upside, and reiterate our Buy rating.
Buy, TP up from CHF320 to CHF415 In our view, a peer comparison is not an appropriate valuation method, as the investment theme
for each fund is different, as are their returns. In view of the company’s strong track record for
profitable exits, we no longer apply a discount to the NAV.
A NAV-based pricing model Our HBM valuation is based on the NAV of the company’s portfolio.
HBM publishes the net asset value per share of its fund twice a month. This NAV is calculated from
the share price of publicly traded portfolio companies, while the fair values of the funds and
investments in private companies are included at their acquisition cost or at the value determined
during the last financing round.
Kepler Cheuvreux’s healthcare/biotech team does not cover any companies in HBM Healthcare
Investments’ public portfolio (except for Argenx). Hence, our NAV is based on the following
assumptions:
For public companies, we use consensus target prices taken from Bloomberg when more than
four analysts cover the stock. Otherwise, we apply valuations based on the last trading price.
Following the successful IPOs of Cathay Biotech and Harmony Biosciences (from the private
portfolio), we include these investments at their market value based on the last trading price.
Due to the lock-up period of 36 months, to calculate the NAV of the fund, HBM Healthcare
values the investment in Cathay at a discount to the share price of 18% initially. This is then
reduced in a linear fashion over the term (0.5% per month from August 2020).
For private companies and funds, we apply the last disclosed fair value reported (as of 30
December 2020), despite HBM’s solid track record for exits.
Accordingly, we derive a target NAV per share of CHF377 leading to a TP of CHF415 (10% premium
to NAV) corresponding to 24% upside to the last listed price. At HBM’s current share price and
taking into account the market value of the public portfolio, the premium to NAV is 9%.
HBM Healthcare Investments Buy | Target Price: CHF415.00
keplercheuvreux.com 21
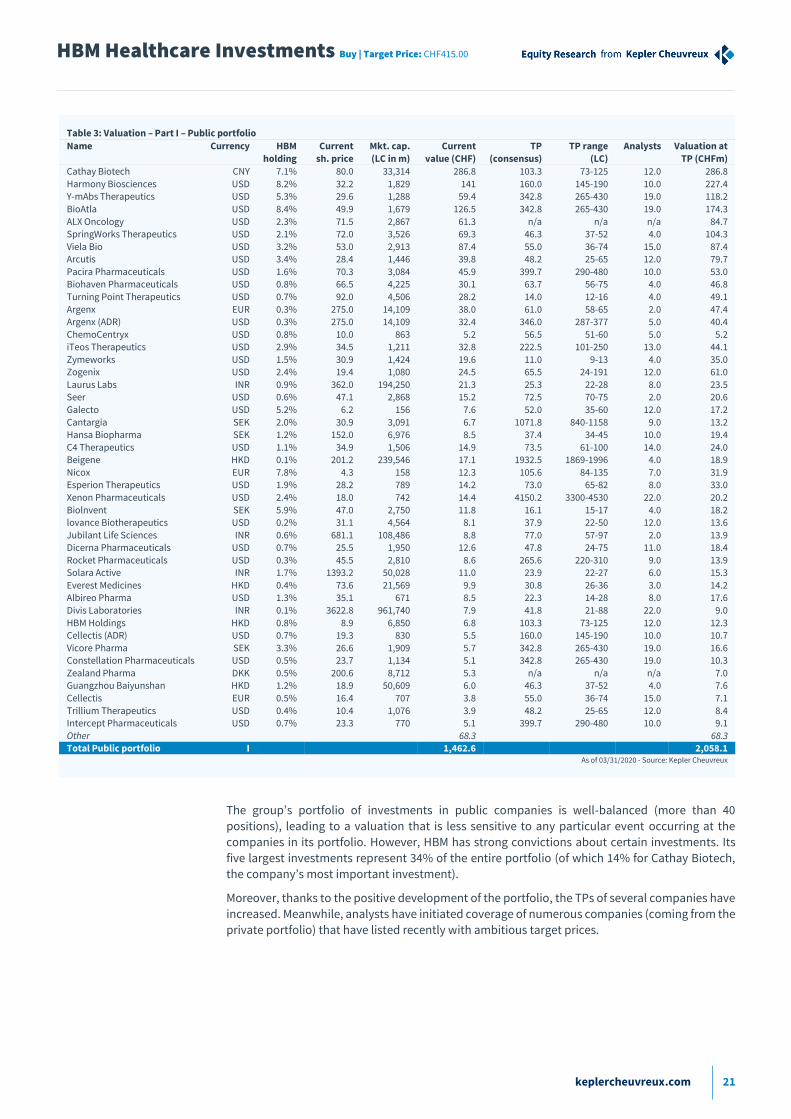
Table 3: Valuation – Part I – Public portfolio
Name Currency HBM
holding
Current
sh. price
Mkt. cap.
(LC in m)
Current
value (CHF)
TP
(consensus)
TP range
(LC)
Analysts Valuation at
TP (CHFm)
Cathay Biotech CNY 7.1% 80.0 33,314 286.8 103.3 73-125 12.0 286.8
Harmony Biosciences USD 8.2% 32.2 1,829 141 160.0 145-190 10.0 227.4 Y-mAbs Therapeutics USD 5.3% 29.6 1,288 59.4 342.8 265-430 19.0 118.2
BioAtla USD 8.4% 49.9 1,679 126.5 342.8 265-430 19.0 174.3
ALX Oncology USD 2.3% 71.5 2,867 61.3 n/a n/a n/a 84.7 SpringWorks Therapeutics USD 2.1% 72.0 3,526 69.3 46.3 37-52 4.0 104.3
Viela Bio USD 3.2% 53.0 2,913 87.4 55.0 36-74 15.0 87.4 Arcutis USD 3.4% 28.4 1,446 39.8 48.2 25-65 12.0 79.7
Pacira Pharmaceuticals USD 1.6% 70.3 3,084 45.9 399.7 290-480 10.0 53.0 Biohaven Pharmaceuticals USD 0.8% 66.5 4,225 30.1 63.7 56-75 4.0 46.8
Turning Point Therapeutics USD 0.7% 92.0 4,506 28.2 14.0 12-16 4.0 49.1
Argenx EUR 0.3% 275.0 14,109 38.0 61.0 58-65 2.0 47.4 Argenx (ADR) USD 0.3% 275.0 14,109 32.4 346.0 287-377 5.0 40.4
ChemoCentryx USD 0.8% 10.0 863 5.2 56.5 51-60 5.0 5.2 iTeos Therapeutics USD 2.9% 34.5 1,211 32.8 222.5 101-250 13.0 44.1
Zymeworks USD 1.5% 30.9 1,424 19.6 11.0 9-13 4.0 35.0 Zogenix USD 2.4% 19.4 1,080 24.5 65.5 24-191 12.0 61.0
Laurus Labs INR 0.9% 362.0 194,250 21.3 25.3 22-28 8.0 23.5 Seer USD 0.6% 47.1 2,868 15.2 72.5 70-75 2.0 20.6
Galecto USD 5.2% 6.2 156 7.6 52.0 35-60 12.0 17.2
Cantargia SEK 2.0% 30.9 3,091 6.7 1071.8 840-1158 9.0 13.2 Hansa Biopharma SEK 1.2% 152.0 6,976 8.5 37.4 34-45 10.0 19.4
C4 Therapeutics USD 1.1% 34.9 1,506 14.9 73.5 61-100 14.0 24.0 Beigene HKD 0.1% 201.2 239,546 17.1 1932.5 1869-1996 4.0 18.9
Nicox EUR 7.8% 4.3 158 12.3 105.6 84-135 7.0 31.9 Esperion Therapeutics USD 1.9% 28.2 789 14.2 73.0 65-82 8.0 33.0
Xenon Pharmaceuticals USD 2.4% 18.0 742 14.4 4150.2 3300-4530 22.0 20.2
Biolnvent SEK 5.9% 47.0 2,750 11.8 16.1 15-17 4.0 18.2 lovance Biotherapeutics USD 0.2% 31.1 4,564 8.1 37.9 22-50 12.0 13.6
Jubilant Life Sciences INR 0.6% 681.1 108,486 8.8 77.0 57-97 2.0 13.9 Dicerna Pharmaceuticals USD 0.7% 25.5 1,950 12.6 47.8 24-75 11.0 18.4
Rocket Pharmaceuticals USD 0.3% 45.5 2,810 8.6 265.6 220-310 9.0 13.9 Solara Active INR 1.7% 1393.2 50,028 11.0 23.9 22-27 6.0 15.3
Everest Medicines HKD 0.4% 73.6 21,569 9.9 30.8 26-36 3.0 14.2 Albireo Pharma USD 1.3% 35.1 671 8.5 22.3 14-28 8.0 17.6
Divis Laboratories INR 0.1% 3622.8 961,740 7.9 41.8 21-88 22.0 9.0
HBM Holdings HKD 0.8% 8.9 6,850 6.8 103.3 73-125 12.0 12.3 Cellectis (ADR) USD 0.7% 19.3 830 5.5 160.0 145-190 10.0 10.7
Vicore Pharma SEK 3.3% 26.6 1,909 5.7 342.8 265-430 19.0 16.6 Constellation Pharmaceuticals USD 0.5% 23.7 1,134 5.1 342.8 265-430 19.0 10.3
Zealand Pharma DKK 0.5% 200.6 8,712 5.3 n/a n/a n/a 7.0 Guangzhou Baiyunshan HKD 1.2% 18.9 50,609 6.0 46.3 37-52 4.0 7.6
Cellectis EUR 0.5% 16.4 707 3.8 55.0 36-74 15.0 7.1
Trillium Therapeutics USD 0.4% 10.4 1,076 3.9 48.2 25-65 12.0 8.4 Intercept Pharmaceuticals USD 0.7% 23.3 770 5.1 399.7 290-480 10.0 9.1
Other 68.3 68.3 Total Public portfolio I 1,462.6 2,058.1
As of 03/31/2020 - Source: Kepler Cheuvreux
The group’s portfolio of investments in public companies is well-balanced (more than 40
positions), leading to a valuation that is less sensitive to any particular event occurring at the
companies in its portfolio. However, HBM has strong convictions about certain investments. Its
five largest investments represent 34% of the entire portfolio (of which 14% for Cathay Biotech,
the company’s most important investment).
Moreover, thanks to the positive development of the portfolio, the TPs of several companies have
increased. Meanwhile, analysts have initiated coverage of numerous companies (coming from the
private portfolio) that have listed recently with ambitious target prices.
HBM Healthcare Investments Buy | Target Price: CHF415.00
keplercheuvreux.com 22
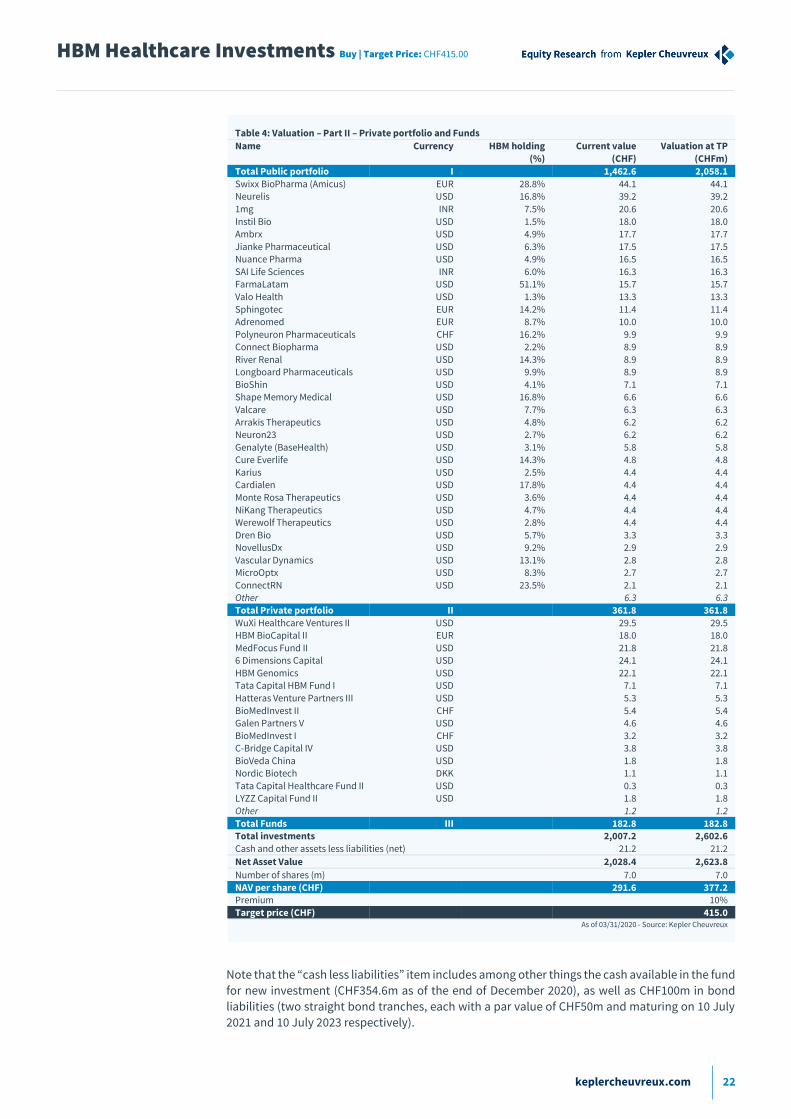
Table 4: Valuation – Part II – Private portfolio and Funds
Name Currency HBM holding
(%)
Current value
(CHF)
Valuation at TP
(CHFm)
Total Public portfolio I 1,462.6 2,058.1
Swixx BioPharma (Amicus) EUR 28.8% 44.1 44.1 Neurelis USD 16.8% 39.2 39.2
1mg INR 7.5% 20.6 20.6
Instil Bio USD 1.5% 18.0 18.0 Ambrx USD 4.9% 17.7 17.7
Jianke Pharmaceutical USD 6.3% 17.5 17.5 Nuance Pharma USD 4.9% 16.5 16.5
SAI Life Sciences INR 6.0% 16.3 16.3 FarmaLatam USD 51.1% 15.7 15.7
Valo Health USD 1.3% 13.3 13.3
Sphingotec EUR 14.2% 11.4 11.4 Adrenomed EUR 8.7% 10.0 10.0
Polyneuron Pharmaceuticals CHF 16.2% 9.9 9.9 Connect Biopharma USD 2.2% 8.9 8.9
River Renal USD 14.3% 8.9 8.9 Longboard Pharmaceuticals USD 9.9% 8.9 8.9
BioShin USD 4.1% 7.1 7.1 Shape Memory Medical USD 16.8% 6.6 6.6
Valcare USD 7.7% 6.3 6.3
Arrakis Therapeutics USD 4.8% 6.2 6.2 Neuron23 USD 2.7% 6.2 6.2
Genalyte (BaseHealth) USD 3.1% 5.8 5.8 Cure Everlife USD 14.3% 4.8 4.8
Karius USD 2.5% 4.4 4.4 Cardialen USD 17.8% 4.4 4.4
Monte Rosa Therapeutics USD 3.6% 4.4 4.4
NiKang Therapeutics USD 4.7% 4.4 4.4 Werewolf Therapeutics USD 2.8% 4.4 4.4
Dren Bio USD 5.7% 3.3 3.3 NovellusDx USD 9.2% 2.9 2.9
Vascular Dynamics USD 13.1% 2.8 2.8 MicroOptx USD 8.3% 2.7 2.7
ConnectRN USD 23.5% 2.1 2.1 Other 6.3 6.3
Total Private portfolio II 361.8 361.8
WuXi Healthcare Ventures II USD 29.5 29.5 HBM BioCapital II EUR 18.0 18.0
MedFocus Fund II USD 21.8 21.8 6 Dimensions Capital USD 24.1 24.1
HBM Genomics USD 22.1 22.1 Tata Capital HBM Fund I USD 7.1 7.1
Hatteras Venture Partners III USD 5.3 5.3
BioMedInvest II CHF 5.4 5.4 Galen Partners V USD 4.6 4.6
BioMedInvest I CHF 3.2 3.2 C-Bridge Capital IV USD 3.8 3.8
BioVeda China USD 1.8 1.8 Nordic Biotech DKK 1.1 1.1
Tata Capital Healthcare Fund II USD 0.3 0.3 LYZZ Capital Fund II USD 1.8 1.8
Other 1.2 1.2
Total Funds III 182.8 182.8 Total investments 2,007.2 2,602.6
Cash and other assets less liabilities (net) 21.2 21.2
Net Asset Value 2,028.4 2,623.8
Number of shares (m) 7.0 7.0
NAV per share (CHF) 291.6 377.2 Premium 10%
Target price (CHF) 415.0 As of 03/31/2020 - Source: Kepler Cheuvreux
Note that the “cash less liabilities” item includes among other things the cash available in the fund
for new investment (CHF354.6m as of the end of December 2020), as well as CHF100m in bond
liabilities (two straight bond tranches, each with a par value of CHF50m and maturing on 10 July
2021 and 10 July 2023 respectively).

HBM Healthcare Investments Buy | Target Price: CHF415.00
keplercheuvreux.com 23
Even if we assume no premium to the NAV, the upside at current levels would be 13%.
Table 5: Sensitivity analysis
Discount/Premium to NAV -5% 0% +10% +15%
Fair value (CHF) 358 377 415 434 Source: Kepler Cheuvreux
Upside to our valuation Our valuation only includes the potential of public companies based on their target prices. This
valuation does not include the potential valuation upside from private companies or funds.
Indeed, these investments are valued at their acquisition cost or the price of the last financing
round. Hence, their valuation does not change before either an exit or a new financing round.
Moreover, the valuation is based on Cathay Biotech’s current value minus a discount of 18%
reduced linearly at 0.5% per month from August 2020. At the current and constant valuation of
Cathay Biotech for the future, CHF0.6 will be added to our valuation each month.
Investments in private companies represent the hidden value in HBM’s portfolio. Before investing
in a private company, HBM carefully assesses the potential exit strategy. The main exit for private
companies is through an IPO or a trade sale. Due to several successful IPOs of companies coming
from the private portfolio during the last two years, and their relatively early stage of development
at the time of the IPO, we believe the value-creation potential is still intact.
HBM Healthcare Investments Buy | Target Price: CHF415.00
keplercheuvreux.com 24
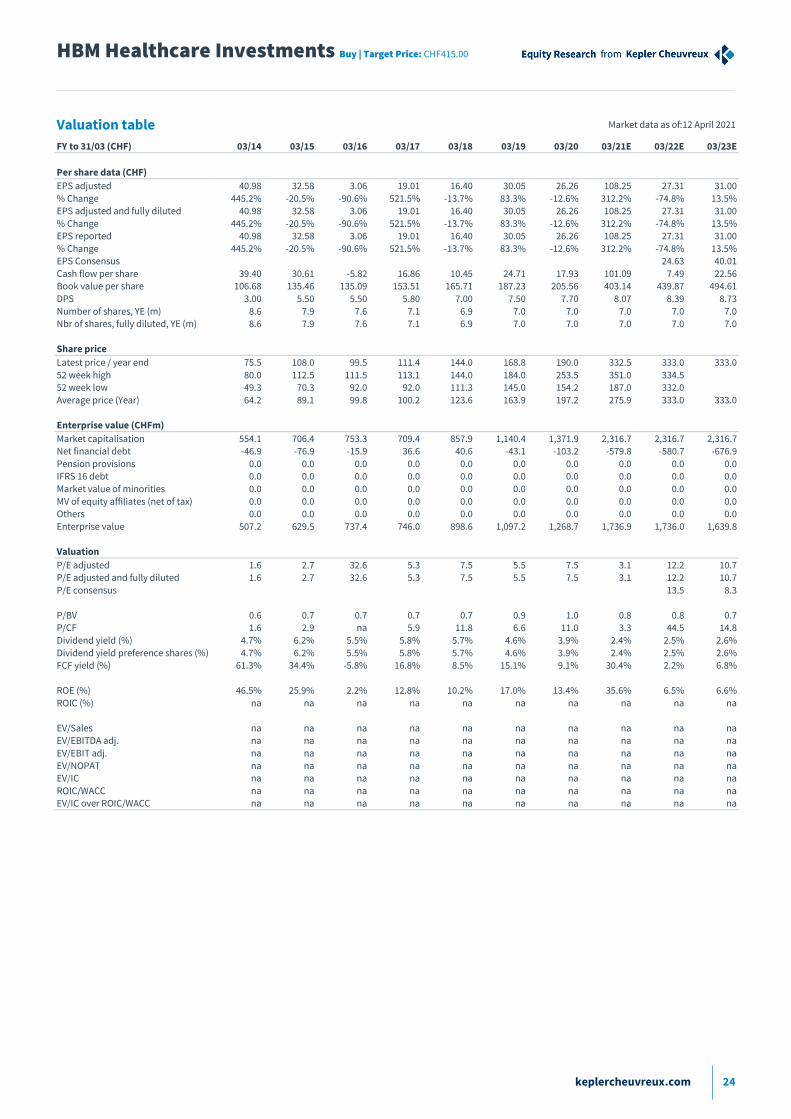
Valuation table Market data as of:12 April 2021
FY to 31/03 (CHF) 03/14 03/15 03/16 03/17 03/18 03/19 03/20 03/21E 03/22E 03/23E
Per share data (CHF)
EPS adjusted 40.98 32.58 3.06 19.01 16.40 30.05 26.26 108.25 27.31 31.00
% Change 445.2% -20.5% -90.6% 521.5% -13.7% 83.3% -12.6% 312.2% -74.8% 13.5% EPS adjusted and fully diluted 40.98 32.58 3.06 19.01 16.40 30.05 26.26 108.25 27.31 31.00
% Change 445.2% -20.5% -90.6% 521.5% -13.7% 83.3% -12.6% 312.2% -74.8% 13.5% EPS reported 40.98 32.58 3.06 19.01 16.40 30.05 26.26 108.25 27.31 31.00
% Change 445.2% -20.5% -90.6% 521.5% -13.7% 83.3% -12.6% 312.2% -74.8% 13.5% EPS Consensus 24.63 40.01
Cash flow per share 39.40 30.61 -5.82 16.86 10.45 24.71 17.93 101.09 7.49 22.56 Book value per share 106.68 135.46 135.09 153.51 165.71 187.23 205.56 403.14 439.87 494.61
DPS 3.00 5.50 5.50 5.80 7.00 7.50 7.70 8.07 8.39 8.73
Number of shares, YE (m) 8.6 7.9 7.6 7.1 6.9 7.0 7.0 7.0 7.0 7.0 Nbr of shares, fully diluted, YE (m) 8.6 7.9 7.6 7.1 6.9 7.0 7.0 7.0 7.0 7.0
Share price
Latest price / year end 75.5 108.0 99.5 111.4 144.0 168.8 190.0 332.5 333.0 333.0
52 week high 80.0 112.5 111.5 113.1 144.0 184.0 253.5 351.0 334.5 52 week low 49.3 70.3 92.0 92.0 111.3 145.0 154.2 187.0 332.0
Average price (Year) 64.2 89.1 99.8 100.2 123.6 163.9 197.2 275.9 333.0 333.0
Enterprise value (CHFm)
Market capitalisation 554.1 706.4 753.3 709.4 857.9 1,140.4 1,371.9 2,316.7 2,316.7 2,316.7 Net financial debt -46.9 -76.9 -15.9 36.6 40.6 -43.1 -103.2 -579.8 -580.7 -676.9
Pension provisions 0.0 0.0 0.0 0.0 0.0 0.0 0.0 0.0 0.0 0.0 IFRS 16 debt 0.0 0.0 0.0 0.0 0.0 0.0 0.0 0.0 0.0 0.0
Market value of minorities 0.0 0.0 0.0 0.0 0.0 0.0 0.0 0.0 0.0 0.0
MV of equity affiliates (net of tax) 0.0 0.0 0.0 0.0 0.0 0.0 0.0 0.0 0.0 0.0 Others 0.0 0.0 0.0 0.0 0.0 0.0 0.0 0.0 0.0 0.0
Enterprise value 507.2 629.5 737.4 746.0 898.6 1,097.2 1,268.7 1,736.9 1,736.0 1,639.8
Valuation
P/E adjusted 1.6 2.7 32.6 5.3 7.5 5.5 7.5 3.1 12.2 10.7 P/E adjusted and fully diluted 1.6 2.7 32.6 5.3 7.5 5.5 7.5 3.1 12.2 10.7
P/E consensus 13.5 8.3
P/BV 0.6 0.7 0.7 0.7 0.7 0.9 1.0 0.8 0.8 0.7 P/CF 1.6 2.9 na 5.9 11.8 6.6 11.0 3.3 44.5 14.8
Dividend yield (%) 4.7% 6.2% 5.5% 5.8% 5.7% 4.6% 3.9% 2.4% 2.5% 2.6%
Dividend yield preference shares (%) 4.7% 6.2% 5.5% 5.8% 5.7% 4.6% 3.9% 2.4% 2.5% 2.6% FCF yield (%) 61.3% 34.4% -5.8% 16.8% 8.5% 15.1% 9.1% 30.4% 2.2% 6.8%
ROE (%) 46.5% 25.9% 2.2% 12.8% 10.2% 17.0% 13.4% 35.6% 6.5% 6.6%
ROIC (%) na na na na na na na na na na
EV/Sales na na na na na na na na na na EV/EBITDA adj. na na na na na na na na na na
EV/EBIT adj. na na na na na na na na na na
EV/NOPAT na na na na na na na na na na EV/IC na na na na na na na na na na
ROIC/WACC na na na na na na na na na na EV/IC over ROIC/WACC na na na na na na na na na na
HBM Healthcare Investments Buy | Target Price: CHF415.00
keplercheuvreux.com 25
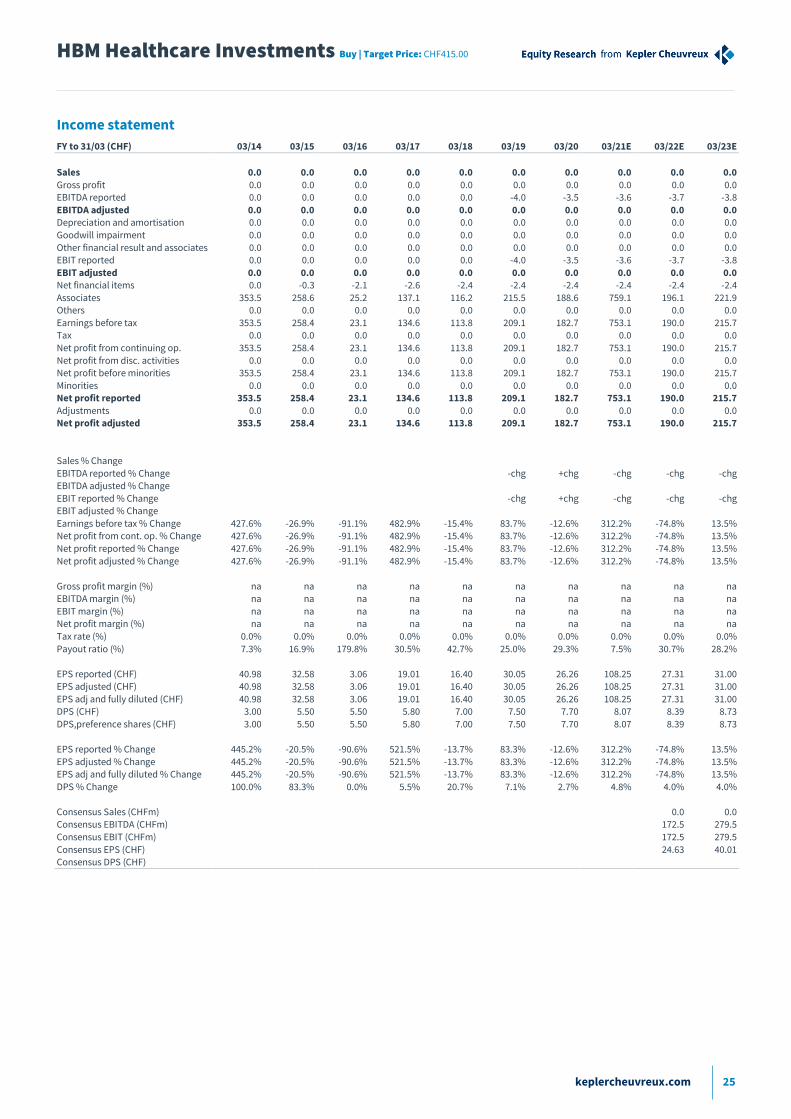
Income statement
FY to 31/03 (CHF) 03/14 03/15 03/16 03/17 03/18 03/19 03/20 03/21E 03/22E 03/23E
Sales 0.0 0.0 0.0 0.0 0.0 0.0 0.0 0.0 0.0 0.0
Gross profit 0.0 0.0 0.0 0.0 0.0 0.0 0.0 0.0 0.0 0.0 EBITDA reported 0.0 0.0 0.0 0.0 0.0 -4.0 -3.5 -3.6 -3.7 -3.8
EBITDA adjusted 0.0 0.0 0.0 0.0 0.0 0.0 0.0 0.0 0.0 0.0 Depreciation and amortisation 0.0 0.0 0.0 0.0 0.0 0.0 0.0 0.0 0.0 0.0
Goodwill impairment 0.0 0.0 0.0 0.0 0.0 0.0 0.0 0.0 0.0 0.0
Other financial result and associates 0.0 0.0 0.0 0.0 0.0 0.0 0.0 0.0 0.0 0.0 EBIT reported 0.0 0.0 0.0 0.0 0.0 -4.0 -3.5 -3.6 -3.7 -3.8
EBIT adjusted 0.0 0.0 0.0 0.0 0.0 0.0 0.0 0.0 0.0 0.0 Net financial items 0.0 -0.3 -2.1 -2.6 -2.4 -2.4 -2.4 -2.4 -2.4 -2.4
Associates 353.5 258.6 25.2 137.1 116.2 215.5 188.6 759.1 196.1 221.9 Others 0.0 0.0 0.0 0.0 0.0 0.0 0.0 0.0 0.0 0.0
Earnings before tax 353.5 258.4 23.1 134.6 113.8 209.1 182.7 753.1 190.0 215.7 Tax 0.0 0.0 0.0 0.0 0.0 0.0 0.0 0.0 0.0 0.0
Net profit from continuing op. 353.5 258.4 23.1 134.6 113.8 209.1 182.7 753.1 190.0 215.7
Net profit from disc. activities 0.0 0.0 0.0 0.0 0.0 0.0 0.0 0.0 0.0 0.0 Net profit before minorities 353.5 258.4 23.1 134.6 113.8 209.1 182.7 753.1 190.0 215.7
Minorities 0.0 0.0 0.0 0.0 0.0 0.0 0.0 0.0 0.0 0.0 Net profit reported 353.5 258.4 23.1 134.6 113.8 209.1 182.7 753.1 190.0 215.7
Adjustments 0.0 0.0 0.0 0.0 0.0 0.0 0.0 0.0 0.0 0.0 Net profit adjusted 353.5 258.4 23.1 134.6 113.8 209.1 182.7 753.1 190.0 215.7
Sales % Change
EBITDA reported % Change -chg +chg -chg -chg -chg EBITDA adjusted % Change
EBIT reported % Change -chg +chg -chg -chg -chg EBIT adjusted % Change
Earnings before tax % Change 427.6% -26.9% -91.1% 482.9% -15.4% 83.7% -12.6% 312.2% -74.8% 13.5% Net profit from cont. op. % Change 427.6% -26.9% -91.1% 482.9% -15.4% 83.7% -12.6% 312.2% -74.8% 13.5%
Net profit reported % Change 427.6% -26.9% -91.1% 482.9% -15.4% 83.7% -12.6% 312.2% -74.8% 13.5%
Net profit adjusted % Change 427.6% -26.9% -91.1% 482.9% -15.4% 83.7% -12.6% 312.2% -74.8% 13.5%
Gross profit margin (%) na na na na na na na na na na EBITDA margin (%) na na na na na na na na na na
EBIT margin (%) na na na na na na na na na na Net profit margin (%) na na na na na na na na na na
Tax rate (%) 0.0% 0.0% 0.0% 0.0% 0.0% 0.0% 0.0% 0.0% 0.0% 0.0%
Payout ratio (%) 7.3% 16.9% 179.8% 30.5% 42.7% 25.0% 29.3% 7.5% 30.7% 28.2%
EPS reported (CHF) 40.98 32.58 3.06 19.01 16.40 30.05 26.26 108.25 27.31 31.00 EPS adjusted (CHF) 40.98 32.58 3.06 19.01 16.40 30.05 26.26 108.25 27.31 31.00
EPS adj and fully diluted (CHF) 40.98 32.58 3.06 19.01 16.40 30.05 26.26 108.25 27.31 31.00 DPS (CHF) 3.00 5.50 5.50 5.80 7.00 7.50 7.70 8.07 8.39 8.73
DPS,preference shares (CHF) 3.00 5.50 5.50 5.80 7.00 7.50 7.70 8.07 8.39 8.73
EPS reported % Change 445.2% -20.5% -90.6% 521.5% -13.7% 83.3% -12.6% 312.2% -74.8% 13.5%
EPS adjusted % Change 445.2% -20.5% -90.6% 521.5% -13.7% 83.3% -12.6% 312.2% -74.8% 13.5% EPS adj and fully diluted % Change 445.2% -20.5% -90.6% 521.5% -13.7% 83.3% -12.6% 312.2% -74.8% 13.5%
DPS % Change 100.0% 83.3% 0.0% 5.5% 20.7% 7.1% 2.7% 4.8% 4.0% 4.0%
Consensus Sales (CHFm) 0.0 0.0 Consensus EBITDA (CHFm) 172.5 279.5
Consensus EBIT (CHFm) 172.5 279.5
Consensus EPS (CHF) 24.63 40.01 Consensus DPS (CHF)

HBM Healthcare Investments Buy | Target Price: CHF415.00
keplercheuvreux.com 26
Cash flow statement Market data as of: 12 April 2021
FY to 31/03 (CHF) 03/14 03/15 03/16 03/17 03/18 03/19 03/20 03/21E 03/22E 03/23E
Net profit before minorities 353.5 258.4 23.1 134.6 113.8 209.1 182.7 753.1 190.0 215.7
Depreciation and amortisation 0.0 0.0 0.0 0.0 0.0 0.0 0.0 0.0 0.0 0.0 Goodwill impairment 0.0 0.0 0.0 0.0 0.0 0.0 0.0 0.0 0.0 0.0
Change in working capital 0.0 0.0 0.0 0.0 0.0 0.0 0.0 0.0 0.0 0.0 Others -13.6 -15.6 -67.1 -15.2 -41.3 -37.1 -58.0 -49.8 -137.9 -58.7
Levered post tax CF before capex 339.9 242.8 -44.0 119.3 72.5 171.9 124.7 703.3 52.1 157.0
% Change 508.8% -28.6% -chg +chg -39.2% 137.0% -27.5% 463.9% -92.6% 201.2%
Capex 0.0 0.0 0.0 0.0 0.0 0.0 0.0 0.0 0.0 0.0
Free cash flow 339.9 242.8 -44.0 119.3 72.5 171.9 124.7 703.3 52.1 157.0 % Change 508.8% -28.6% -chg +chg -39.2% 137.0% -27.5% 463.9% -92.6% 201.2%
Acquisitions -309.8 -323.3 -395.9 -405.0 -556.5 -534.0 -515.7 0.0 0.0 0.0
Divestments 329.8 461.7 476.5 444.9 661.6 710.8 611.6 536.2 150.9 169.3
Dividend paid 0.0 -23.6 -42.3 -39.2 -40.8 -38.1 0.0 -56.2 -58.4 -60.7 Share buy back -20.6 -78.9 -35.9 -29.1 -9.9 -6.1 -0.8 0.0 0.0 0.0
Capital increases 0.0 0.0 0.0 0.0 0.0 0.0 0.0 0.0 0.0 0.0 Others -344.4 -184.8 6.0 14.2 -116.9 -256.3 -263.9 -706.7 -143.6 -169.3
Change in net financial debt 5.2 -93.9 35.6 -105.2 -10.1 -48.3 44.2 -476.6 -0.9 -96.2
Change in cash and cash equiv. -6.1 93.5 -25.6 104.2 4.2 45.5 -39.7 476.6 0.9 96.2
Attributable FCF 339.9 242.8 -44.0 119.3 72.5 171.9 124.7 703.3 52.1 157.0
Cash flow per share (CHF) 39.40 30.61 -5.82 16.86 10.45 24.71 17.93 101.09 7.49 22.56
% Change 529.1% -22.3% -chg +chg -38.0% 136.5% -27.5% 463.9% -92.6% 201.2%
FCF per share (CHF) 39.40 30.61 -5.82 16.86 10.45 24.71 17.93 101.09 7.49 22.56 % Change 529.1% -22.3% -chg +chg -38.0% 136.5% -27.5% 463.9% -92.6% 201.2%
Capex / Sales (%) na na na na na na na na na na Capex / D&A (%) na na na na na na na na na na
Cash flow / Sales (%) na na na na na na na na na na
FCF / Sales (%) na na na na na na na na na na
FCF Yield (%) 61.3% 34.4% -5.8% 16.8% 8.5% 15.1% 9.1% 30.4% 2.2% 6.8%
Unlevered FCF Yield (%) 67.0% 38.6% -5.7% 16.3% 8.3% 15.9% 10.0% 40.6% 3.1% 9.7%
HBM Healthcare Investments Buy | Target Price: CHF415.00
keplercheuvreux.com 27
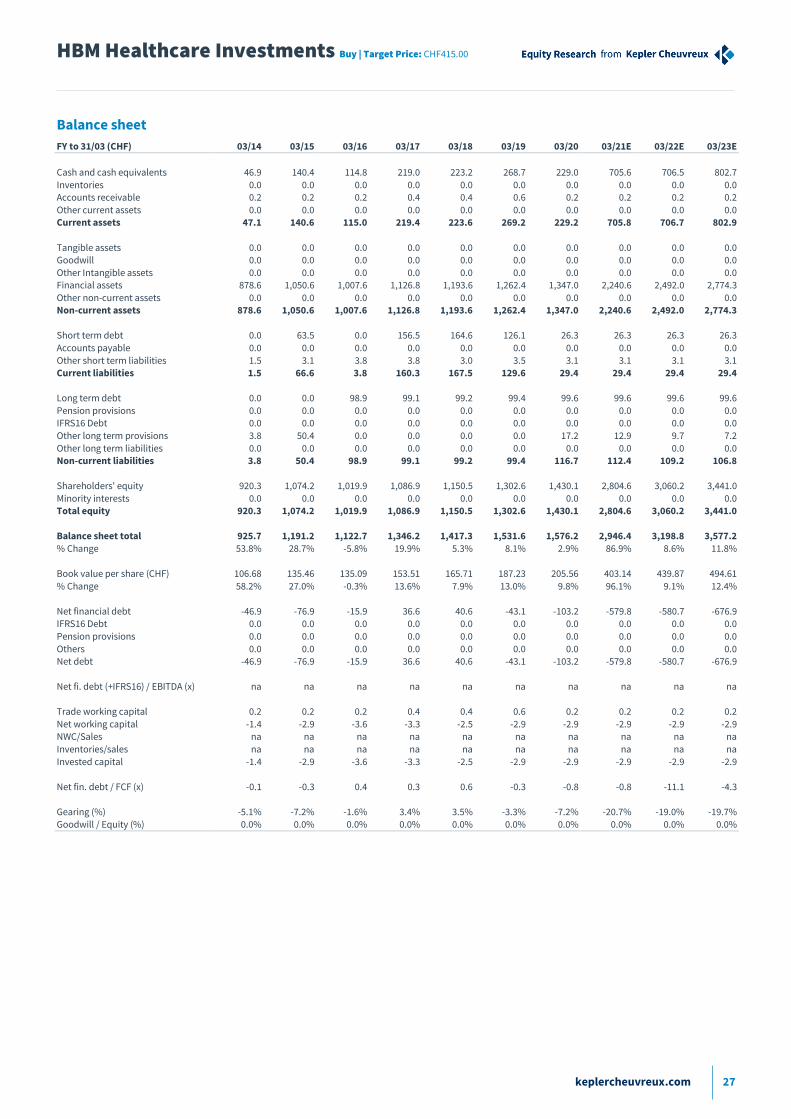
Balance sheet
FY to 31/03 (CHF) 03/14 03/15 03/16 03/17 03/18 03/19 03/20 03/21E 03/22E 03/23E
Cash and cash equivalents 46.9 140.4 114.8 219.0 223.2 268.7 229.0 705.6 706.5 802.7
Inventories 0.0 0.0 0.0 0.0 0.0 0.0 0.0 0.0 0.0 0.0 Accounts receivable 0.2 0.2 0.2 0.4 0.4 0.6 0.2 0.2 0.2 0.2
Other current assets 0.0 0.0 0.0 0.0 0.0 0.0 0.0 0.0 0.0 0.0 Current assets 47.1 140.6 115.0 219.4 223.6 269.2 229.2 705.8 706.7 802.9
Tangible assets 0.0 0.0 0.0 0.0 0.0 0.0 0.0 0.0 0.0 0.0 Goodwill 0.0 0.0 0.0 0.0 0.0 0.0 0.0 0.0 0.0 0.0
Other Intangible assets 0.0 0.0 0.0 0.0 0.0 0.0 0.0 0.0 0.0 0.0 Financial assets 878.6 1,050.6 1,007.6 1,126.8 1,193.6 1,262.4 1,347.0 2,240.6 2,492.0 2,774.3
Other non-current assets 0.0 0.0 0.0 0.0 0.0 0.0 0.0 0.0 0.0 0.0 Non-current assets 878.6 1,050.6 1,007.6 1,126.8 1,193.6 1,262.4 1,347.0 2,240.6 2,492.0 2,774.3
Short term debt 0.0 63.5 0.0 156.5 164.6 126.1 26.3 26.3 26.3 26.3
Accounts payable 0.0 0.0 0.0 0.0 0.0 0.0 0.0 0.0 0.0 0.0
Other short term liabilities 1.5 3.1 3.8 3.8 3.0 3.5 3.1 3.1 3.1 3.1 Current liabilities 1.5 66.6 3.8 160.3 167.5 129.6 29.4 29.4 29.4 29.4
Long term debt 0.0 0.0 98.9 99.1 99.2 99.4 99.6 99.6 99.6 99.6
Pension provisions 0.0 0.0 0.0 0.0 0.0 0.0 0.0 0.0 0.0 0.0 IFRS16 Debt 0.0 0.0 0.0 0.0 0.0 0.0 0.0 0.0 0.0 0.0
Other long term provisions 3.8 50.4 0.0 0.0 0.0 0.0 17.2 12.9 9.7 7.2
Other long term liabilities 0.0 0.0 0.0 0.0 0.0 0.0 0.0 0.0 0.0 0.0 Non-current liabilities 3.8 50.4 98.9 99.1 99.2 99.4 116.7 112.4 109.2 106.8
Shareholders' equity 920.3 1,074.2 1,019.9 1,086.9 1,150.5 1,302.6 1,430.1 2,804.6 3,060.2 3,441.0
Minority interests 0.0 0.0 0.0 0.0 0.0 0.0 0.0 0.0 0.0 0.0 Total equity 920.3 1,074.2 1,019.9 1,086.9 1,150.5 1,302.6 1,430.1 2,804.6 3,060.2 3,441.0
Balance sheet total 925.7 1,191.2 1,122.7 1,346.2 1,417.3 1,531.6 1,576.2 2,946.4 3,198.8 3,577.2
% Change 53.8% 28.7% -5.8% 19.9% 5.3% 8.1% 2.9% 86.9% 8.6% 11.8%
Book value per share (CHF) 106.68 135.46 135.09 153.51 165.71 187.23 205.56 403.14 439.87 494.61
% Change 58.2% 27.0% -0.3% 13.6% 7.9% 13.0% 9.8% 96.1% 9.1% 12.4%
Net financial debt -46.9 -76.9 -15.9 36.6 40.6 -43.1 -103.2 -579.8 -580.7 -676.9 IFRS16 Debt 0.0 0.0 0.0 0.0 0.0 0.0 0.0 0.0 0.0 0.0
Pension provisions 0.0 0.0 0.0 0.0 0.0 0.0 0.0 0.0 0.0 0.0
Others 0.0 0.0 0.0 0.0 0.0 0.0 0.0 0.0 0.0 0.0 Net debt -46.9 -76.9 -15.9 36.6 40.6 -43.1 -103.2 -579.8 -580.7 -676.9
Net fi. debt (+IFRS16) / EBITDA (x) na na na na na na na na na na
Trade working capital 0.2 0.2 0.2 0.4 0.4 0.6 0.2 0.2 0.2 0.2
Net working capital -1.4 -2.9 -3.6 -3.3 -2.5 -2.9 -2.9 -2.9 -2.9 -2.9 NWC/Sales na na na na na na na na na na
Inventories/sales na na na na na na na na na na
Invested capital -1.4 -2.9 -3.6 -3.3 -2.5 -2.9 -2.9 -2.9 -2.9 -2.9
Net fin. debt / FCF (x) -0.1 -0.3 0.4 0.3 0.6 -0.3 -0.8 -0.8 -11.1 -4.3
Gearing (%) -5.1% -7.2% -1.6% 3.4% 3.5% -3.3% -7.2% -20.7% -19.0% -19.7% Goodwill / Equity (%) 0.0% 0.0% 0.0% 0.0% 0.0% 0.0% 0.0% 0.0% 0.0% 0.0%
HBM Healthcare Investments Buy | Target Price: CHF415.00
keplercheuvreux.com 28
Research ratings and important disclosures
The term "KEPLER CHEUVREUX" shall, unless the context otherwise requires, mean each of KEPLER CHEUVREUX and its affiliates, subsidiaries and related companies (see
“Regulators” table below).
The investment recommendation(s) referred to in this report was (were) completed on 12/04/2021 18:03 (GMT) and was first disseminated on 13/04/2021 5:07 (GMT).
Unless otherwise stated, all prices are aligned with the “Market Data date” on the front page of this report .
Disclosure checklist - Potential conflict of interests
Company Name ISIN Disclosure
Argenx NL0010832176 nothing to disclose
BB Biotech CH0038389992 KEPLER CHEUVREUX and the issuer have agreed that KEPLER CHEUVREUX will produce and disseminate investment
research on the said issuer as a service to the issuer
HBM Healthcare
Investments
CH0012627250 KEPLER CHEUVREUX and the issuer have agreed that KEPLER CHEUVREUX will produce and disseminate investment
research on the said issuer as a service to the issuer
Nicox FR0013018124 KEPLER CHEUVREUX is a liquidity provider in relation to price stabilisation activities for the issuer to provide liquidity in such
instruments
KEPLER CHEUVREUX and the issuer have agreed that KEPLER CHEUVREUX will produce and disseminate investment
research on the said issuer as a service to the issuer
Organizational and administrative arrangements to avoid and prevent conflicts of interests
KEPLER CHEUVREUX promotes and disseminates independent investment research and have implemented written procedures designed to identify and manage potential
conflicts of interest that arise in connection with its research business, which are available upon request. The KEPLER CHEUVREUX research analysts and other staff involved in
issuing and disseminating research reports operate independently of KEPLER CHEUVREUX Investment Banking business. Information barriers and procedures are in place
between the research analysts and staff involved in securities trading for the account of KEPLER CHEUVREUX or clients to ensure that price sensitive information is handled
according to applicable laws and regulations.
It is Kepler Cheuvreux’ policy not to disclose the rating to the issuer before publication and dissemination. Nevertheless, this document, in whole or in part, and with the exclusion
of ratings, target prices and any other information that could lead to determine its valuation, may have been provided to the issuer prior to publication and dissemination, solely
with the aim of verifying factual accuracy.
Please refer to www.keplercheuvreux.com for further information relating to research and conflict of interest management.
Analyst disclosures
The functional job title of the person(s) responsible for the recommendations contained in this report is Equity/Credit Research Analyst unless otherwise stated on the cover.
Name of the Research Analyst(s): Arsene Guekam
Regulation AC - Analyst Certification: Each Equity/Credit Research Analyst(s) listed on the front-page of this report, principally responsible for the preparation and content of
all or any identified portion of this research report hereby certifies that, with respect to each issuer or security or any identified portion of the report with respect to an issuer or
security that the equity research analyst covers in this research report, all of the views expressed in this research report accurately reflect their personal views about those
issuer(s) or securities. Each Equity/Credit Research Analyst(s) also certifies that no part of their compensation was, is, or will be, directly or indirectly, related to the specific
recommendation(s) or view(s) expressed by that equity research analyst in this research report.
Each Equity/Credit Research Analyst certifies that he is acting independently and impartially from KEPLER CHEUVREUX shareholders, directors and is not affected by any current
or potential conflict of interest that may arise from any KEPLER CHEUVREUX activities.
Analyst Compensation: The research analyst(s) primarily responsible for the preparation of the content of the research report attest that no part of the analyst’s(s’)
compensation was, is or will be, directly or indirectly, related to the specific recommendations expressed by the research analyst(s) in the research report. The research
analyst’s(s’) compensation is, however, determined by the overall economic performance of KEPLER CHEUVREUX.
Registration of non-US Analysts: Unless otherwise noted, the non-US analysts listed on the front of this report are employees of KEPLER CHEUVREUX, which is a non-US affiliate
and parent company of Kepler Capital Markets, Inc. a SEC registered and FINRA member broker-dealer. Equity/Credit Research Analysts employed by KEPLER CHEUVREUX, are
not registered/qualified as research analysts under FINRA/NYSE rules, may not be associated persons of Kepler Capital Markets, Inc. and may not be subject to NASD Rule 2711
and NYSE Rule 472 restrictions on communications with covered companies, public appearances, and trading securities held by a research analyst account.
Research ratings
Rating ratio Kepler Cheuvreux Q4 2020
Rating Breakdown A B
Buy 54% 63%
Hold 34% 27%
Reduce 9% 2%
Not Rated/Under Review/Accept Offer 3% 8%
Total 100% 100%
Source: Kepler Cheuvreux
A: % of all research recommendations
B: % of issuers to which material services of investment firms are supplied
12 months rating history
The below table shows the history of recommendations and target prices changes issued by KEPLER CHEUVREUX research department (Equity and Credit) over a 12 months
period.
Company Name Date Business Line Rating Target Price Closing Price
Argenx (EUR) 26/05/2020 08:35 Equity Research Under Review 146.60
27/05/2020 08:26 Equity Research Buy 215.00 190.00
31/07/2020 07:00 Equity Research Hold 200.00 202.40
02/02/2021 08:02 Equity Research Hold 225.00 263.00
05/03/2021 08:43 Equity Research Hold 220.00 253.00
BB Biotech (CHF) 03/02/2021 08:42 Equity Research Buy 94.00 82.80
HBM Healthcare Investments (CHF) 05/10/2020 07:22 Equity Research Buy 320.00 268.50
HBM Healthcare Investments Buy | Target Price: CHF415.00
keplercheuvreux.com 29
Nicox (EUR) 27/11/2020 12:20 Equity Research Buy 10.00 5.56
Credit research does not issue target prices. Left intentionally blank.
Please refer to the following link https://research.keplercheuvreux.com/disclosure/stock/ for a full list of investment recommendations issued over the last 12 months
by the author(s) and contributor(s) of this report on any financial instruments.
Equity research
Rating system
KEPLER CHEUVREUX equity research ratings and target prices are issued in absolute terms, not relative to any given benchmark. A rating on a stock is set after assessing the
twelve months expected upside or downside of the stock derived from the analyst’s fair value (target price) and in the light of the risk profile of the company. Ratings are defined
as follows:
Buy: The minimum expected upside is 10% over next 12 months (the minimum required upside could be higher in light of the company’s risk profile).
Hold: The expected upside is below 10% (the expected upside could be higher in light of the company’s risk profile).
Reduce: There is an expected downside.
Accept offer: In the context of a total or partial take-over bid, squeeze-out or similar share purchase proposals, the offer price is considered to be fairly valuing the shares.
Reject offer: In the context of a total or partial take-over bid, squeeze-out or similar share purchase proposals, the offered price is considered to be undervaluing the shares.
Under review: An event occurred with an expected significant impact on our target price and we cannot issue a recommendation before having processed that new information
and/or without a new share price reference.
Not rated: The stock is not covered.
Restricted: A recommendation, target price and/or financial forecast is not disclosed further to compliance and/or other regulatory considerations.
Due to share prices volatility, ratings and target prices may occasionally and temporarily be inconsistent with the above definition.
Valuation methodology and risks
Unless otherwise stated in this report, target prices and investment recommendations are determined based on fundamental research methodologies and relies on commonly
used valuation methodologies such as Discounted Cash Flow (DCF), valuation multiples comparison with history and peers, Dividend Discount Model (DDM).
Valuation methodologies and models can be highly dependent on macroeconomic factors (such as the price of commodities, exchange rates and interest rates) as well as other
external factors including taxation, regulation and geopolitical changes (such as tax policy changes, strikes or war). In addition, investors’ confidence and market sentiment can
affect the valuation of companies. The valuation is also based on expectations that might change rapidly and without notice, depending on developments specific to individual
industries. Whichever valuation method is used there is a significant risk that the target price will not be achieved within the expected timeframe.
Unless otherwise stated, models used are proprietary. Additional information about the proprietary models used in this report is accessible on request.
KEPLER CHEUVREUX’ equity research policy is to update research rating when it deems appropriate in the light of new findings, markets development and any relevant
information that can impact the analyst’s view and opinion.
Regulators
Location Regulator Abbreviation
KEPLER CHEUVREUX S.A - France Autorité des Marchés Financiers AMF
KEPLER CHEUVREUX, Madrid branch Comisión Nacional del Mercado de Valores CNMV
KEPLER CHEUVREUX, Frankfurt branch Bundesanstalt für Finanzdienstleistungsaufsicht BaFin
KEPLER CHEUVREUX, Milan branch Commissione Nazionale per le Società e la Borsa CONSOB
KEPLER CHEUVREUX, Amsterdam branch Autoriteit Financiële Markten AFM
KEPLER CHEUVREUX (Switzerland) SA, Zurich branch Swiss Financial Market Supervisory Authority FINMA
KEPLER CAPITAL MARKETS, Inc. Financial Industry Regulatory Authority FINRA
KEPLER CHEUVREUX, London branch Financial Conduct Authority FCA
KEPLER CHEUVREUX, Vienna branch Austrian Financial Services Authority FMA
KEPLER CHEUVREUX, Stockholm branch Finansinspektionen FI
KEPLER CHEUVREUX Oslo branch Finanstilsynet NFSA
KEPLER CHEUVREUX, Bruxelles branch Autorité des Services et Marchés Financiers FSMA
KEPLER CHEUVREUX is authorised and regulated by both Autorité de Contrôle Prudentiel and Autorité des Marchés Financiers.
HBM Healthcare Investments Buy | Target Price: CHF415.00
keplercheuvreux.com 30
Legal and disclosure information
Other disclosures
This product is not for distribution to retail clients.
MIFID 2 WARNING: We remind you that pursuant to MiFID 2, it is your responsibility, as a recipient of this research document, to determine whether or not your firm is impacted
by the provisions of the Directive 2014/65/EU of the European Parliament and of the Council of 15 May 2014 on markets in financial instruments (“MiFID 2”) regarding the
unbundling of research and execution (the “MiFID 2 Research Rules”). For any request on the provision of research documents, please send an email to
The information contained in this publication was obtained from various publicly available sources believed to be reliable, but has not been independently verified by KEPLER
CHEUVREUX. KEPLER CHEUVREUX does not warrant the completeness or accuracy of such information and does not accept any liability with respect to the accuracy or
completeness of such information, except to the extent required by applicable law.
This publication is a brief summary and does not purport to contain all available information on the subjects covered. Further information may be available on request.
This publication is for information purposes only and shall not be construed as an offer or solicitation for the subscription or purchase or sale of any securities, or as an
invitation, inducement or intermediation for the sale, subscription or purchase of any securities, or for engaging in any other transaction.
Any opinions, projections, forecasts or estimates in this report are those of the author only, who has acted with a high degree of expertise. They reflect only the current views of
the author at the date of this report and are subject to change without notice. KEPLER CHEUVREUX has no obligation to update, modify or amend this publication or to otherwise
notify a reader or recipient of this publication in the event that any matter, opinion, projection, forecast or estimate contained herein, changes or subsequently becomes
inaccurate, or if research on the subject company is withdrawn. The analysis, opinions, projections, forecasts and estimates expressed in this report were in no way affected or
influenced by the issuer. The author of this publication benefits financially from the overall success of KEPLER CHEUVREUX.
The investments referred to in this publication may not be suitable for all recipients. Recipients are urged to base their investment decisions upon their own appropriate
investigations that they deem necessary. Any loss or other consequence arising from the use of the material contained in this publication shall be the sole and exclusive
responsibility of the investor and KEPLER CHEUVREUX accepts no liability for any such loss or consequence. In the event of any doubt about any investment, recipients should
contact their own investment, legal and/or tax advisers to seek advice regarding the appropriateness of investing. Some of the investments mentioned in this publication may
not be readily liquid investments. Consequently it may be difficult to sell or realise such investments. The past is not necessarily a guide to future performance of an investment.
The value of investments and the income derived from them may fall as well as rise and investors may not get back the amount invested. Some investments discussed in this
publication may have a high level of volatility. High volatility investments may experience sudden and large falls in their value which may cause losses. International investing
includes risks related to political and economic uncertainties of foreign countries, as well as currency risk.
To the extent permitted by applicable law, no liability whatsoever is accepted for any direct or consequential loss, damages, costs or prejudices whatsoever arising from the use
of this publication or its contents.
Country and region disclosures
United Kingdom: This document is for persons who are Eligible Counterparties or Professional Clients only and is exempt from the general restriction in section 21 of the
Financial Services and Markets Act 2000 on the communication of invitations or inducements to engage in investment activity on the grounds that it is being distributed in the
United Kingdom only to persons of a kind described in Articles 19(5) (Investment professionals) and 49(2) (High net worth companies, unincorporated associations, etc.) of the
Financial Services and Markets Act 2000 (Financial Promotion) Order 2005 (as amended). It is not intended to be distributed or passed on, directly or indirectly, to any other class
of persons. Any investment to which this document relates is available only to such persons, and other classes of person should not rely on this document.
United States: This communication is only intended for, and will only be distributed to, persons residing in any jurisdictions where such distribution or availability would not be
contrary to local law or regulation. This communication must not be acted upon or relied on by persons in any jurisdiction other than in accordance with local law or regulation
and where such person is an investment professional with the requisite sophistication to understand an investment in such securities of the type communicated and assume the
risks associated therewith.
This communication is confidential and is intended solely for the addressee. It is not to be forwarded to any other person or copied without the permission of the sender. This
communication is provided for information only. It is not a personal recommendation or an offer to sell or a solicitation to buy the securities mentioned. Investors should obtain
independent professional advice before making an investment.
Notice to U.S. Investors: This material is not for distribution in the United States, except to “major US institutional investors” as defined in SEC Rule 15a-6 ("Rule 15a-6"). KEPLER
CHEUVREUX has entered into a 15a-6 Agreement with Kepler Capital Markets, Inc. ("KCM, Inc.”) which enables this report to be furnished to certain U.S. recipients in reliance on
Rule 15a-6 through KCM, Inc.
Each U.S. recipient of this report represents and agrees, by virtue of its acceptance thereof, that it is a "major U.S. institutional investor" (as such term is defined in Rule 15a-6)
and that it understands the risks involved in executing transactions in such securities. Any U.S. recipient of this report that wishes to discu ss or receive additional information
regarding any security or issuer mentioned herein, or engage in any transaction to purchase or sell or solicit or offer the purchase or sale of such securities, should contact a
registered representative of KCM, Inc.
KCM, Inc. is a broker-dealer registered with the Securities and Exchange Commission (“SEC”) under the U.S. Securities Exchange Act of 1934, as amended, Member of the Financial
Industry Regulatory Authority (“FINRA”) and Member of the Securities Investor Protection Corporation (“SIPC”). Pursuant to SEC Rule 15a-6, you must contact a Registered
Representative of KCM, Inc. if you are seeking to execute a transaction in the securities discussed in this report. You can reach KCM, Inc. at Tower 49, 12 East 49th Street, Floor
36, New York, NY 10017, Compliance Department (212) 710-7625; Operations Department (212) 710-7606; Trading Desk (212) 710-7602. Further information is also available at
www.keplercheuvreux.com. You may obtain information about SIPC, including the SIPC brochure, by contacting SIPC directly at 202-371-8300; website: http://www.sipc.org/.
KCM, Inc. is a wholly owned subsidiary of KEPLER CHEUVREUX. KEPLER CHEUVREUX , registered on the Paris Register of Companies with the number 413 064 841 (1997 B 10253),
whose registered office is located at 112 avenue Kléber, 75016 Paris, is authorised and regulated by both Autorité de Contrôle Prudentiel (ACP) and Autorité des Marchés
Financiers (AMF).
Nothing herein excludes or restricts any duty or liability to a customer that KCM, Inc. may have under applicable law. Investment products provided by or through KCM, Inc. are
not insured by the Federal Deposit Insurance Corporation and are not deposits or other obligations of any insured depository institution, may lose value and are not guaranteed
by the entity that published the research as disclosed on the front page and are not guaranteed by KCM, Inc.
Investing in non-U.S. Securities may entail certain risks. The securities referred to in this report and non-U.S. issuers may not be registered under the U.S. Securities Act of 1933,
as amended, and the issuer of such securities may not be subject to U.S. reporting and/or other requirements. Rule 144A securities may be offered or sold only to persons in the
U.S. who are Qualified Institutional Buyers within the meaning of Rule 144A under the Securities Act. The information available about non-U.S. companies may be limited, and
non-U.S. companies are generally not subject to the same uniform auditing and reporting standards as U.S. companies. Securities of some non-U.S. companies may not be as
liquid as securities of comparable U.S. companies. Securities discussed herein may be rated below investment grade and should therefore only be considered for inclusion in
accounts qualified for speculative investment.
HBM Healthcare Investments Buy | Target Price: CHF415.00
keplercheuvreux.com 31
Analysts employed by KEPLER CHEUVREUX SA, a non-U.S. broker-dealer, are not required to take the FINRA analyst exam. The information contained in this report is intended
solely for certain "major U.S. institutional investors" and may not be used or relied upon by any other person for any purpose. Such information is provided for informational
purposes only and does not constitute a solicitation to buy or an offer to sell any securities under the Securities Act of 1933, as amended, or under any other U.S. federal or state
securities laws, rules or regulations. The investment opportunities discussed in this report may be unsuitable for certain investors depending on their specific investment
objectives, risk tolerance and financial position.
In jurisdictions where KCM, Inc. is not registered or licensed to trade in securities, or other financial products, transactions may be executed only in accordance with applicable
law and legislation, which may vary from jurisdiction to jurisdiction and which may require that a transaction be made in accordance with applicable exemptions from
registration or licensing requirements.
The information in this publication is based on sources believed to be reliable, but KCM, Inc. does not make any representation with respect to its completeness or accuracy. All
opinions expressed herein reflect the author's judgment at the original time of publication, without regard to the date on which you may receive such information, and are
subject to change without notice.
KCM, Inc. and/or its affiliates may have issued other reports that are inconsistent with, and reach different conclusions from, the information presented in this report. These
publications reflect the different assumptions, views and analytical methods of the analysts who prepared them. Past performance should not be taken as an indication or
guarantee of future performance, and no representation or warranty, express or implied, is provided in relation to future performance.
KCM, Inc. and any company affiliated with it may, with respect to any securities discussed herein: (a) take a long or short position and buy or sell such securities; (b) act as
investment and/or commercial bankers for issuers of such securities; (c) act as market makers for such securities; (d) serve on the board of any issuer of such securities; and (e)
act as paid consultant or advisor to any issuer. The information contained herein may include forward-looking statements within the meaning of U.S. federal securities laws that
are subject to risks and uncertainties. Factors that could cause a company's actual results and financial condition to differ from expectations include, without limitation: political
uncertainty, changes in general economic conditions that adversely affect the level of demand for the company's products or services, changes in foreign exchange markets,
changes in international and domestic financial markets and in the competitive environment, and other factors relating to the foregoing. All forward-looking statements
contained in this report are qualified in their entirety by this cautionary statement.
France: This publication is issued and distributed in accordance with legal or regulatory requirements relating to independent investment research, as defined under Article 36
of the EU delegated regulation n°565/2017.
Germany: This report must not be distributed to persons who are retail clients in the meaning of Sec. 31a para. 3 of the German Securities Trading Act (Wertpapierhandelsgesetz
– “WpHG”). This report may be amended, supplemented or updated in such manner and as frequently as the author deems.
Italy: This document is issued by KEPLER CHEUVREUX Milan branch, authorised in France by the Autorité des Marchés Financiers (AMF) and the Autorité de Contrôle Prudentiel
(ACP) and registered in Italy by the Commissione Nazionale per le Società e la Borsa (CONSOB) and is distributed by KEPLER CHEUVREUX. This document is for Eligible
Counterparties or Professional Clients only as defined by the CONSOB Regulation 16190/2007 (art. 26 and art. 58).Other classes of persons should not rely on this document.
Reports on issuers of financial instruments listed by Article 180, paragraph 1, letter a) of the Italian Consolidated Act on Financial Services (Legislative Decree No. 58 of 24/2/1998,
as amended from time to time) must comply with the requirements envisaged by articles 69 to 69-novies of CONSOB Regulation 11971/1999. According to these provisions
KEPLER CHEUVREUX warns on the significant interests of KEPLER CHEUVREUX indicated in Annex 1 hereof, confirms that there are not significant financial interests of KEPLER
CHEUVREUX in relation to the securities object of this report as well as other circumstance or relationship with the issuer of the securities object of this report (including but not
limited to conflict of interest, significant shareholdings held in or by the issuer and other significant interests held by KEPLER CHEUVREUX or other entities controlling or subject
to control by KEPLER CHEUVREUX in relation to the issuer which may affect the impartiality of this document]. Equities discussed herein are covered on a continuous basis with
regular reports at results release. Reports are released on the date shown on cover and distributed via print and email. KEPLER CHEUVREUX branch di Milano analysts is not
affiliated with any professional groups or organisations. All estimates are by KEPLER CHEUVREUX unless otherwise stated.
Spain: This document is only intended for persons who are Eligible Counterparties or Professional Clients within the meaning of Article 78bis and Article 78ter of the Spanish
Securities Market Act. It is not intended to be distributed or passed on, directly or indirectly, to any other class of persons. This report has been issued by KEPLER CHEUVREUX
Sucursal en España registered in Spain by the Comisión Nacional del Mercado de Valores (CNMV) in the foreign investments firms registry and it has been distributed in Spain by
it or by KEPLER CHEUVREUX authorised and regulated by both Autorité de Contrôle Prudentiel and Autorité des Marchés Financiers. There is no obligation to either register or
file any report or any supplemental documentation or information with the CNMV. In accordance with the Spanish Securities Market Law (Ley del Mercado de Valores), there is
no need for the CNMV to verify, authorise or carry out a compliance review of this document or related documentation, and no information needs to be provided.
Switzerland: This publication is intended to be distributed to professional investors in circumstances such that there is no public offer. This publication does not constitute a
prospectus within the meaning of Articles 652a and 1156 of the Swiss Code of Obligations.
Canada: This document is for information and marketing purposes only. The information contained herein is not, and under no circumstances to be construed as, a prospectus,
an offering memorandum, an advertisement, a public offering, an offer to sell securities, or a solicitation of an offer to buy securities, in Canada or any province or territory
thereof. Any offer or sale of the securities described herein in Canada will be made only under an exemption from the requirements to file a prospectus with the relevant Canadian
securities regulators under applicable Canadian securities laws in the relevant province or territory of Canada in which such offer or sale is made. Under no circumstances is the
information contained herein to be construed as investment advice in any province or territory of Canada and is not tailored to the needs of the recipient. No securities
commission or similar regulatory authority in Canada has reviewed or in any way passed upon these materials, the information contained herein or the merits of the securities
described herein.
Pursuant to a research distribution agreement between Kepler Cheuvreux and CIBC World Markets Inc. (“CIBC”), CIBC distributes Kepler Cheuvreux equity research to Canadian
clients of CIBC. This research report has not been prepared in accordance with the disclosure requirements of Dealer Member Rule 3400 –Research Restrictions and Disclosure
Requirements of the Investment Industry Regulatory Organization of Canada (“IIROC”). KEPLER CHEUVREUX is authorised and regulated by both Autorité de Contrôle Prudentiel
and Autorité des Marchés Financiers (“AMF”). If this research report had been prepared in compliance with IIROC’s requirements it would require disclosure if the IIROC regulated
dealer and its affiliates collectively beneficially owned 1% or more of any class of equity securities issued by the company covered in this research report. Under AMF requirements
disclosure is only required for major shareholdings by the AMF regulated dealer or any of its affiliates, including at least shareholdings exceeding 5% of the total issued share
capital of the company covered in this research report.
Other countries: Laws and regulations of other countries may also restrict the distribution of this report. Persons in possession of this document should inform themselves
about possible legal restrictions and observe them accordingly.
None of the material, nor its content may be altered in anyway, transmitted to, copied or distributed to any other party, in whole or in part, unless otherwise agreed
with KEPLER CHEUVREUX in writing.
Copyright © KEPLER CHEUVREUX. All rights reserved.
Pharma & biotech Research Team
Arsene Guekam Main author
[email protected] +33 1 70 81 57 56
David Evans Co-head
[email protected] +44 (0) 207 621 5197
Arsene Guekam Co-head
[email protected] +33 1 70 81 57 56
Arsene Guekam is a Senior Equity Research Analyst specialising in healthcare and biotech/medtech. He joined Kepler Cheuvreux in November 2015. Previously, he spent eleven years at CM-CIC Securities as the Head of the European Pharma/Biotech Research Team, more than two years at Oddo MidCap and three years at Natexis covering both large and small caps as well as biotechs. Arsene Guekam began his career in various public institutes and in R&D at Sanofi. He graduated from Pharmaceutical studies and from EM Lyon, where he obtained a master’s degree in Finance.
Tom Bedford Specialist Sales
Damien Choplain [email protected]
+33 1 53 65 35 22
Paul de Froment
+33 1 53 65 36 60
Pablo de Renteria
+34 91 436 5221
Pierre-Alexandre Desir
[email protected] +33 1 70 81 57 61
Dariusz Ubik
[email protected] +44 (0) 207 621 5129
Daan Vandenberk, CFA [email protected]
+32 11 49 1462
Europe North America
Amsterdam +31 20 573 06 66
Geneva +41 22361 5151
Milan +39 02 8550 7201
Stockholm +468 723 51 00
New York +1 212 710 7600
Brussels
+32 11 491460
London +44 20 7621 5100
Oslo +47 23 13 9080
Vienna +43 1 537 124 147
Frankfurt
+49 69 756 960
Madrid
+34 914 36 5100
Paris
+33 1 53 65 35 00 Zurich
+41 43 333 66 66
Local insight, European scale.