Embed Size (px)
Citation preview

Astronomy 110: SURVEY OF ASTRONOMY
13. THE REALM OF THE NEBULAE
1. Distances and Types of Galaxies
2. Hubble’s Law and Galaxy Evolution
3. Peculiar and Active Galaxies

Galaxy History Revealed in This Colorful Hubble View

1. DISTANCES AND TYPES OF GALAXIES
a. An Extragalactic Distance Scale
b. Galaxy Morphology
c. Groups and Clusters
2p Dec June
p
D
AU
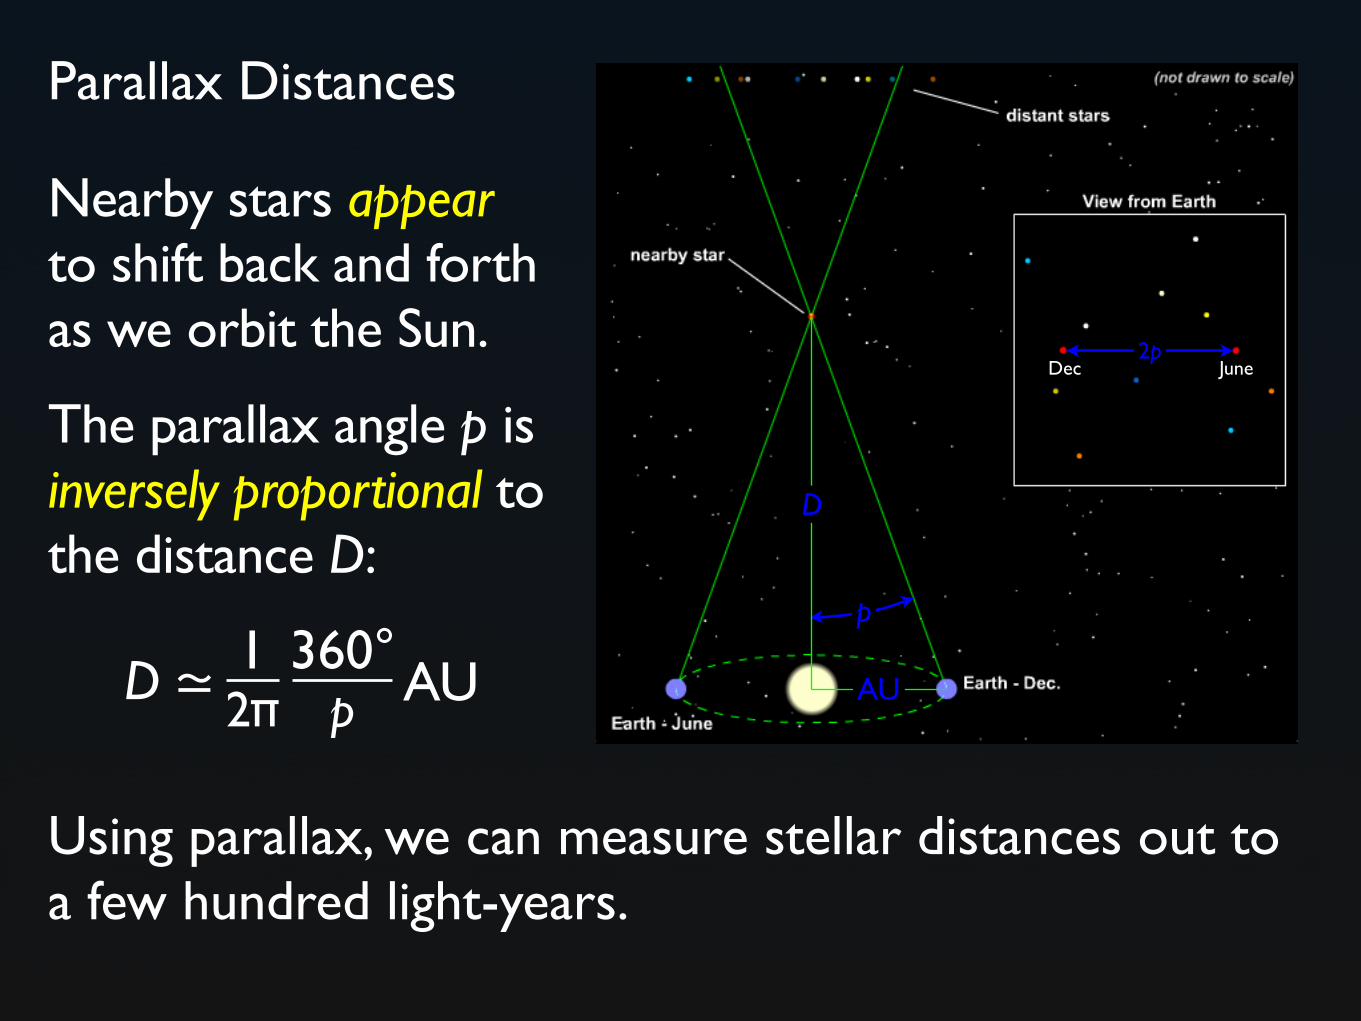
Parallax Distances
D ≃ p360°AU2π
1
The parallax angle p is inversely proportional to the distance D:
Nearby stars appear to shift back and forth as we orbit the Sun.
Using parallax, we can measure stellar distances out to a few hundred light-years.
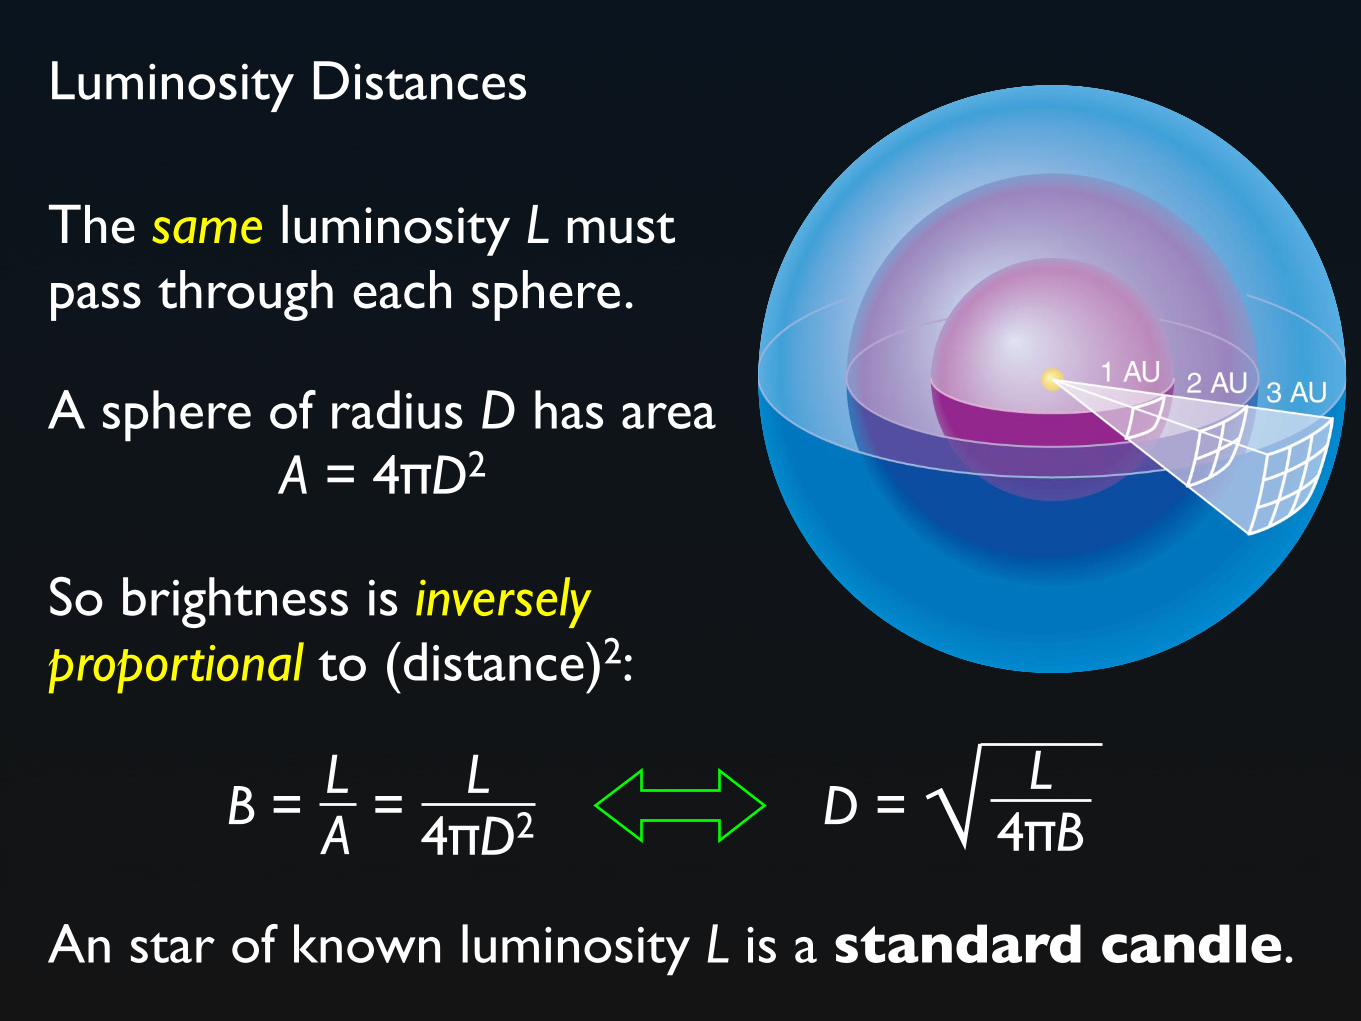
Luminosity Distances
The same luminosity L must pass through each sphere.
A sphere of radius D has areaA = 4πD2
B = LAL
4πD2=
So brightness is inversely proportional to (distance)2:
D = L
4πB√An star of known luminosity L is a standard candle.
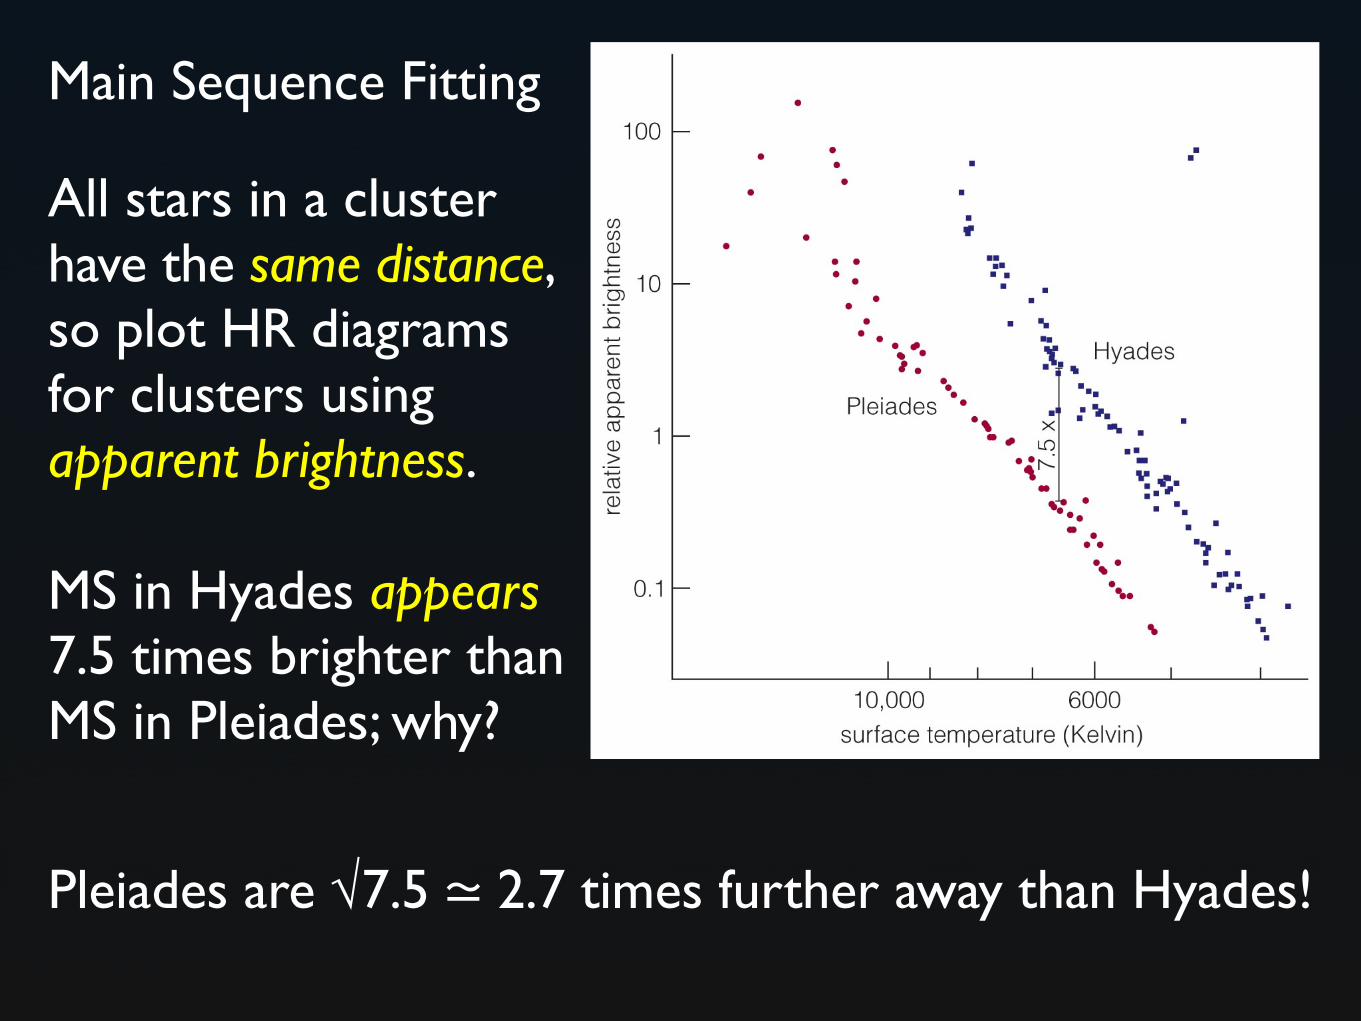
Main Sequence Fitting
106
All stars in a cluster have the same distance, so plot HR diagrams for clusters using apparent brightness.
MS in Hyades appears 7.5 times brighter than MS in Pleiades; why?
Pleiades are √7.5 ≃ 2.7 times further away than Hyades!
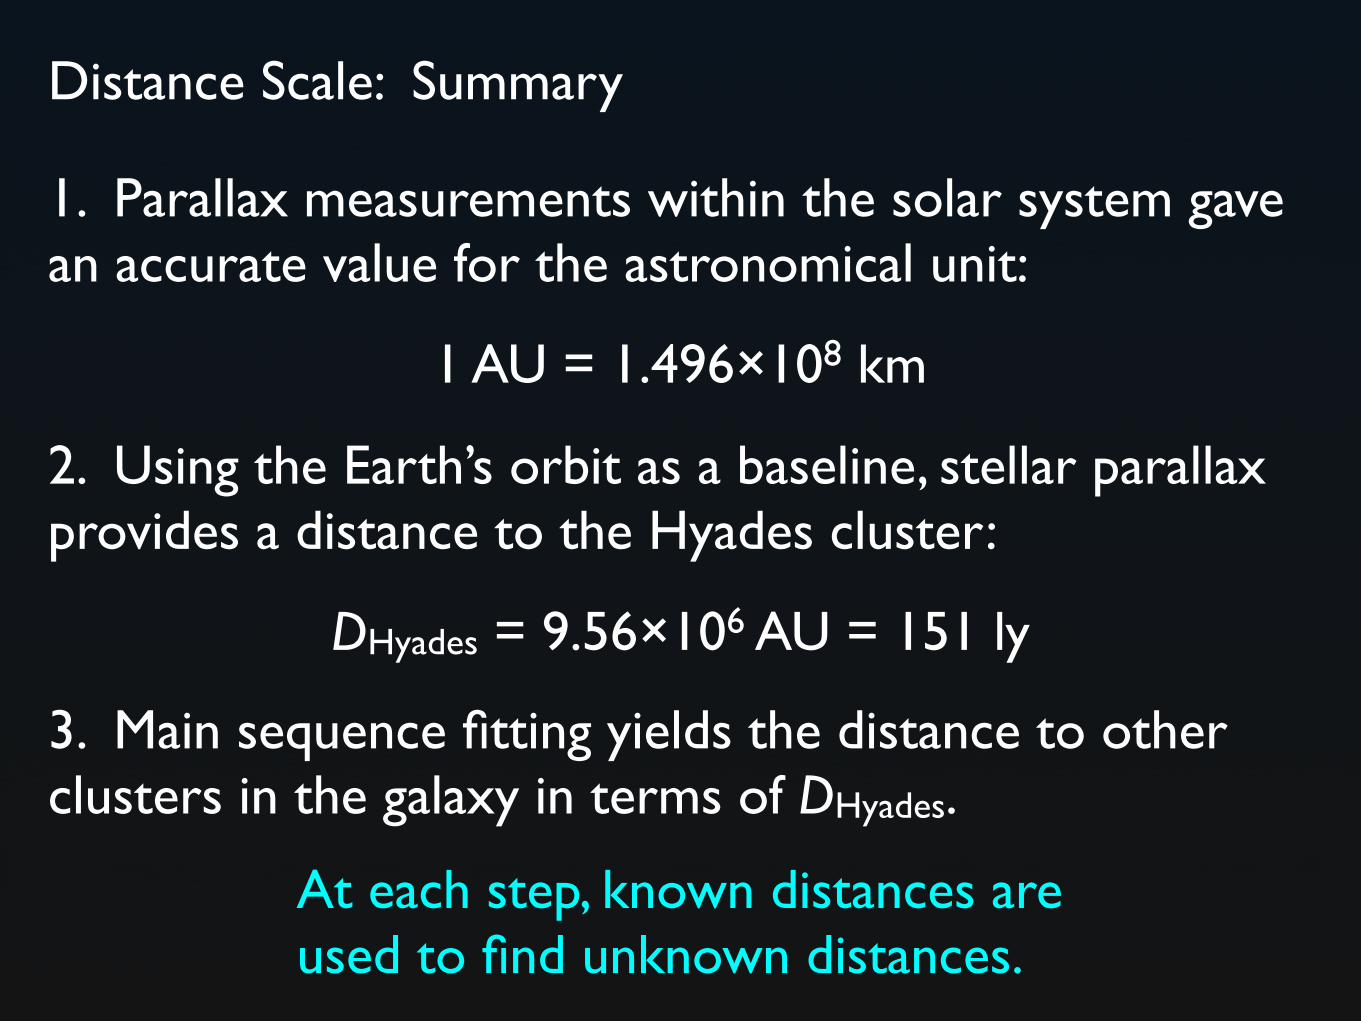
Distance Scale: Summary
1. Parallax measurements within the solar system gave an accurate value for the astronomical unit:
2. Using the Earth’s orbit as a baseline, stellar parallax provides a distance to the Hyades cluster:
3. Main sequence fitting yields the distance to other clusters in the galaxy in terms of DHyades.
At each step, known distances are used to find unknown distances.
1 AU = 1.496×10⁸ km
DHyades = 9.56×10⁶ AU = 151 ly

delta Cephei
4.5
4.0
3.5
2 4 6 8 10 12
Time (days)
Brig
htne
ss (
mag
)
Period
Cepheid Variable Stars
During this phase, they vary in size, temperature, and brightness in regular ways with well-defined periods.
Massive stars become Cepheid Variables at one phase of their lives after leaving the main sequence.

Period-Luminosity Relationship. I
Cepheids in the Large Magellanic Cloud were found to obey a relationship between period and apparent brightness.
0.1
1.0
10
100
0.01
rela
tive
appa
rent
brig
htne
ss
Large Magellanic Cloud
These stars are all at the same distance, so their apparent brightnesses are proportional to their absolute luminosities.
abso
lute
lum
inos
ity
So Cepheids must obey a period-luminosity relationship!

Period-Luminosity Relationship. II
To be useful for distance measurements, the P-L relationship must be calibrated in units of L⊙ by measuring absolute luminosities of some Cepheids.
Cepheids in star clusters are handy for this, since distances are available via main-sequence fitting.
Once this is done, a Cepheid’s luminosity can be found from its period.

The Distance to Andromeda (M31)
M31: The Andromeda Galaxy
Is M31 another galaxy, or part of the Milky Way?
The luminosities of several Cepheids in M31 were determined from their periods via the P-L relationship.
Given their luminosities and brightnesses, distances to these Cepheids could be computed: DM31 ≃ 2.4×10⁶ ly.
Andromeda Nebula: Var!
M31 is far beyond the Milky Way!
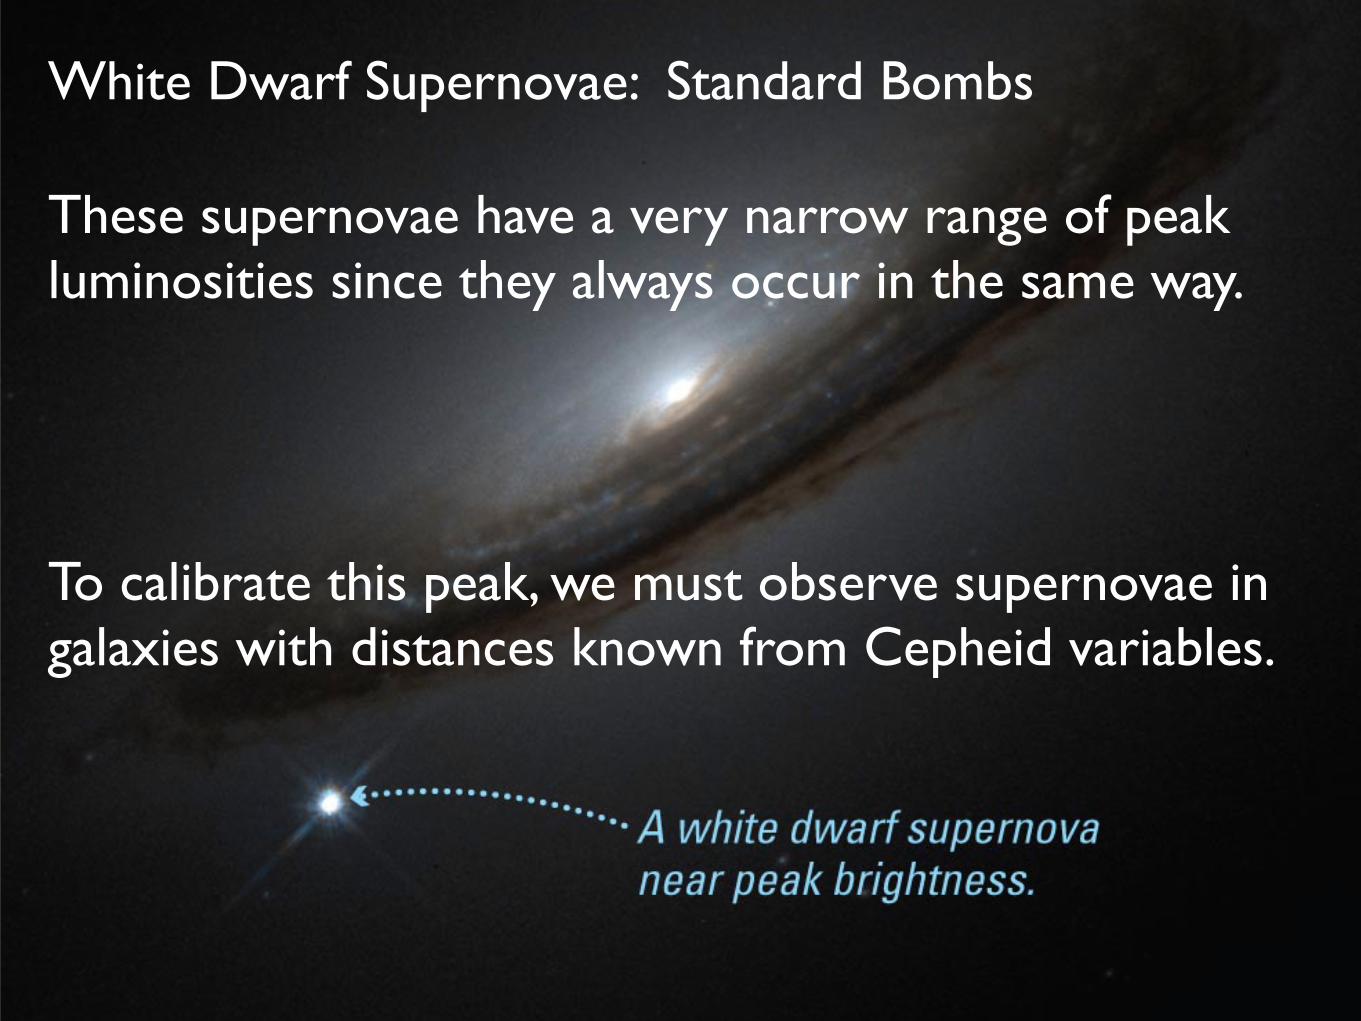
White Dwarf Supernovae: Standard Bombs
These supernovae have a very narrow range of peak luminosities since they always occur in the same way.
To calibrate this peak, we must observe supernovae in galaxies with distances known from Cepheid variables.

An Extragalactic Distance Scale
Interlocking methods allow distances up to ~1010 ly to be measured fairly reliably.
10-3 ly
1 ly
103 ly
106 ly
109 ly
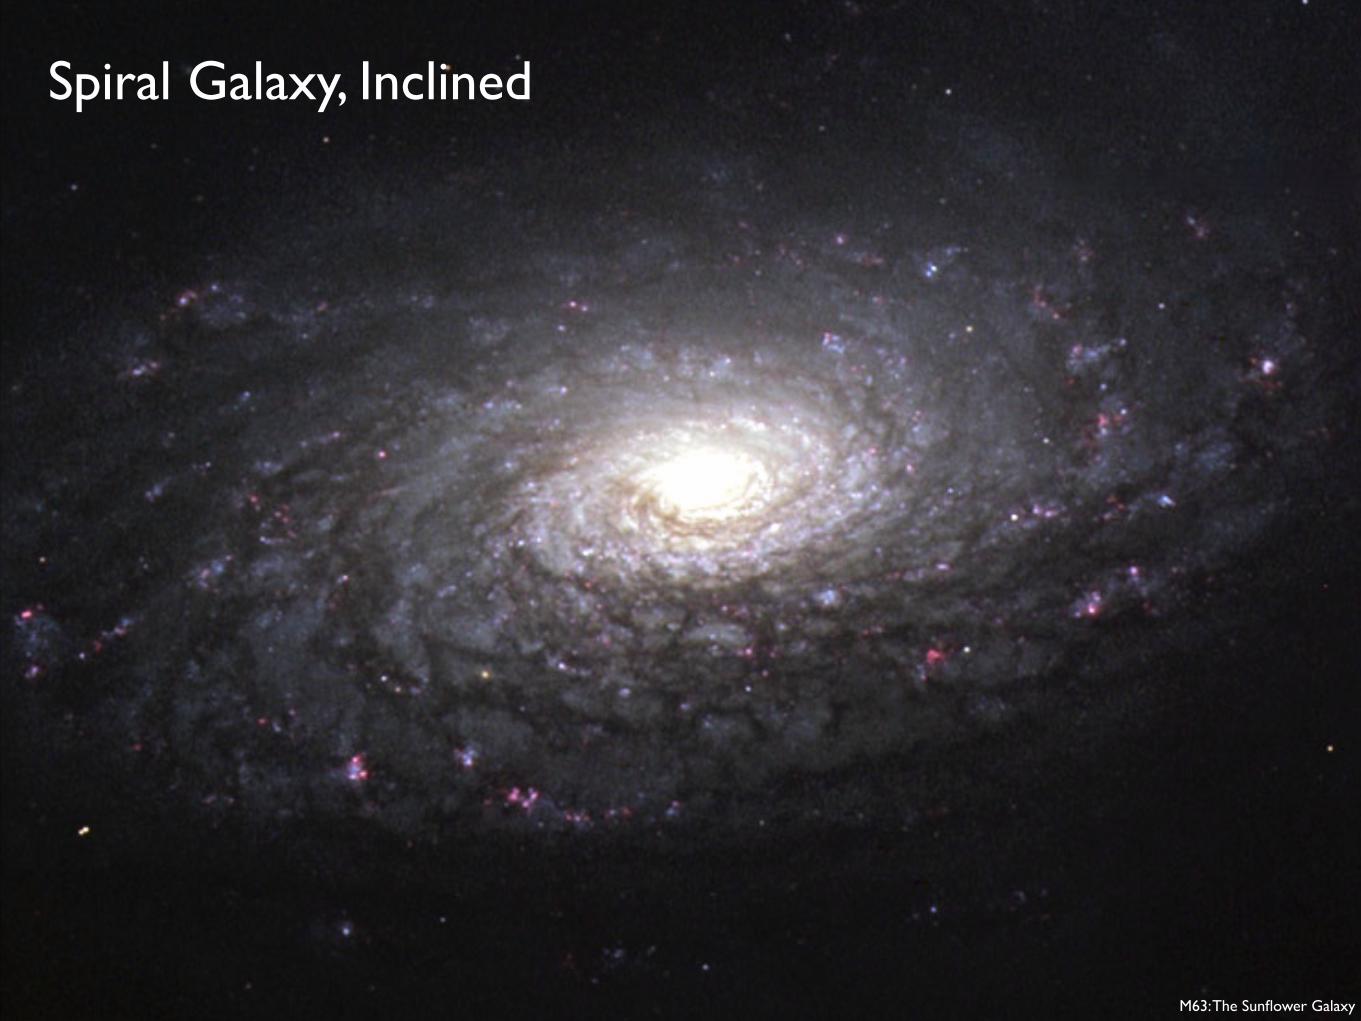
M63: The Sunflower Galaxy
Spiral Galaxy, Inclined
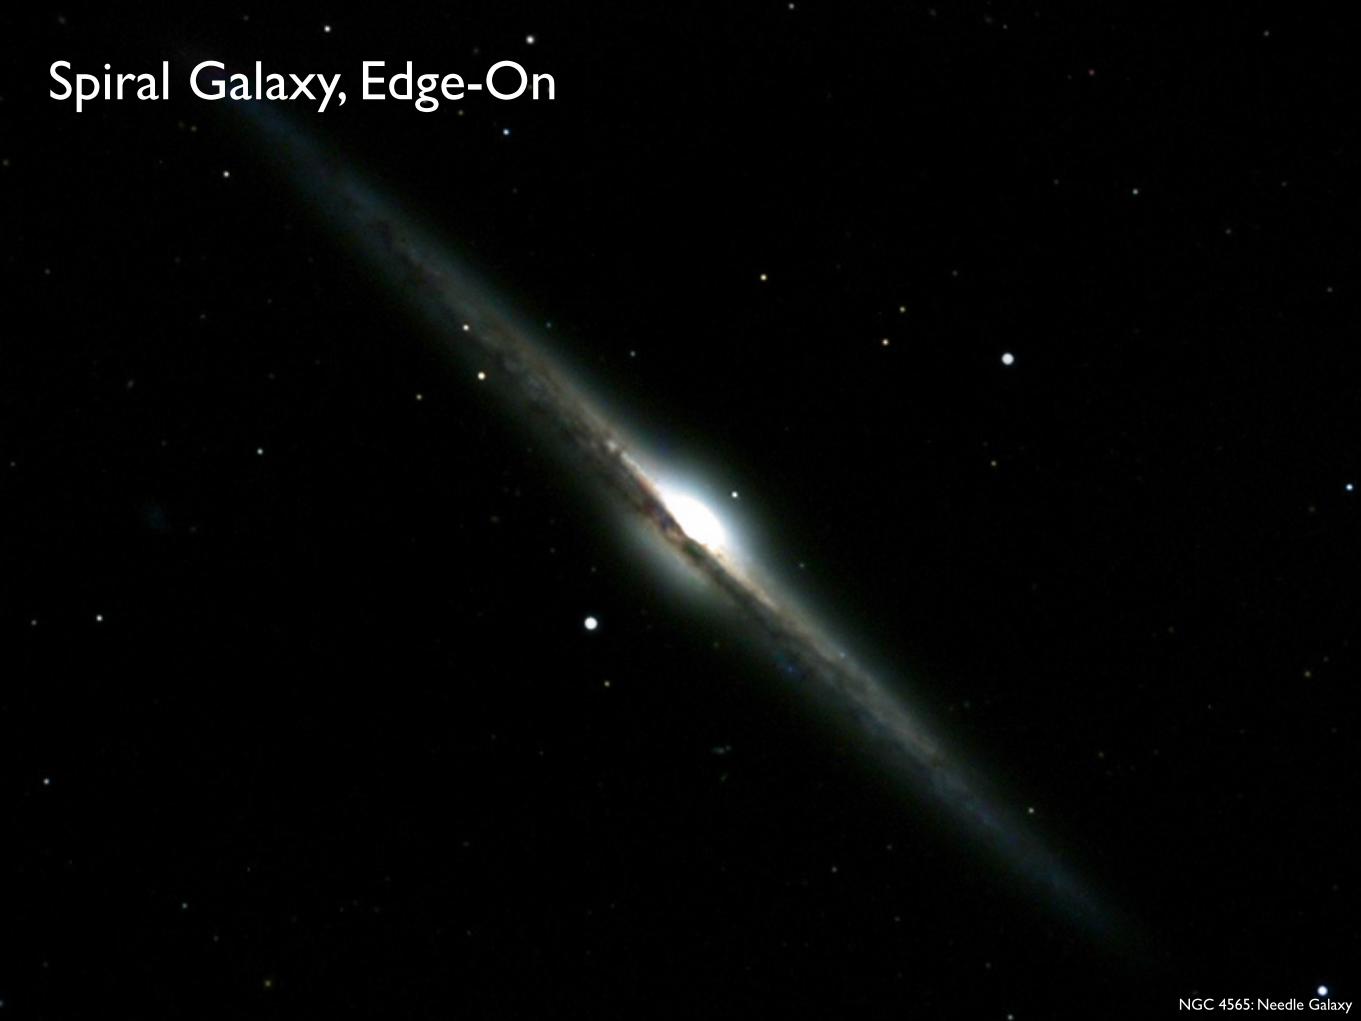
NGC 4565: Needle Galaxy
Spiral Galaxy, Edge-On
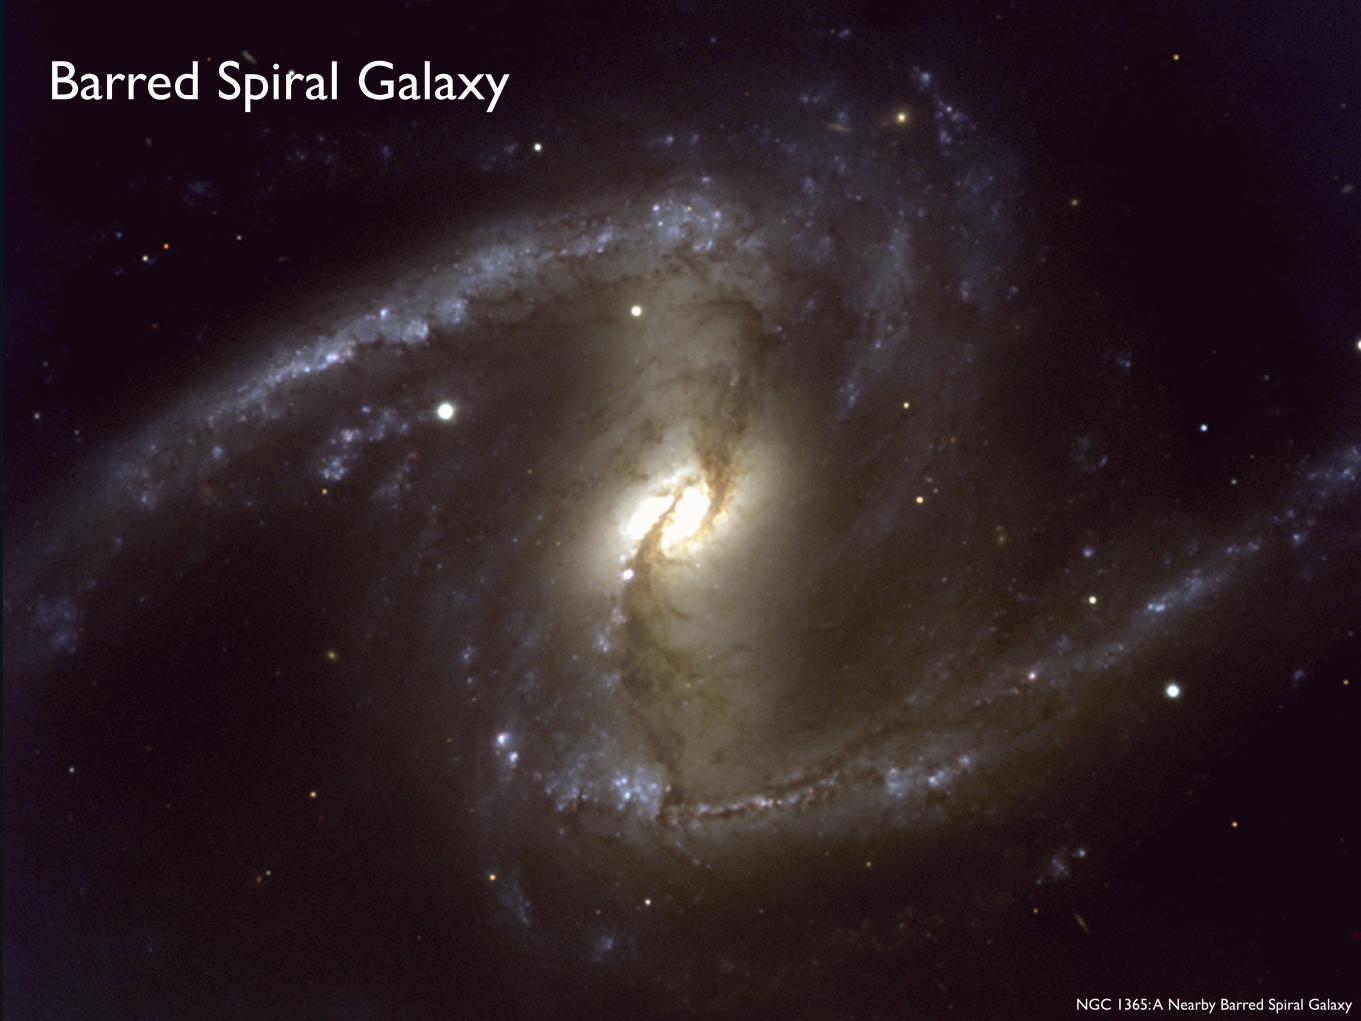
Barred Spiral Galaxy
NGC 1365: A Nearby Barred Spiral Galaxy
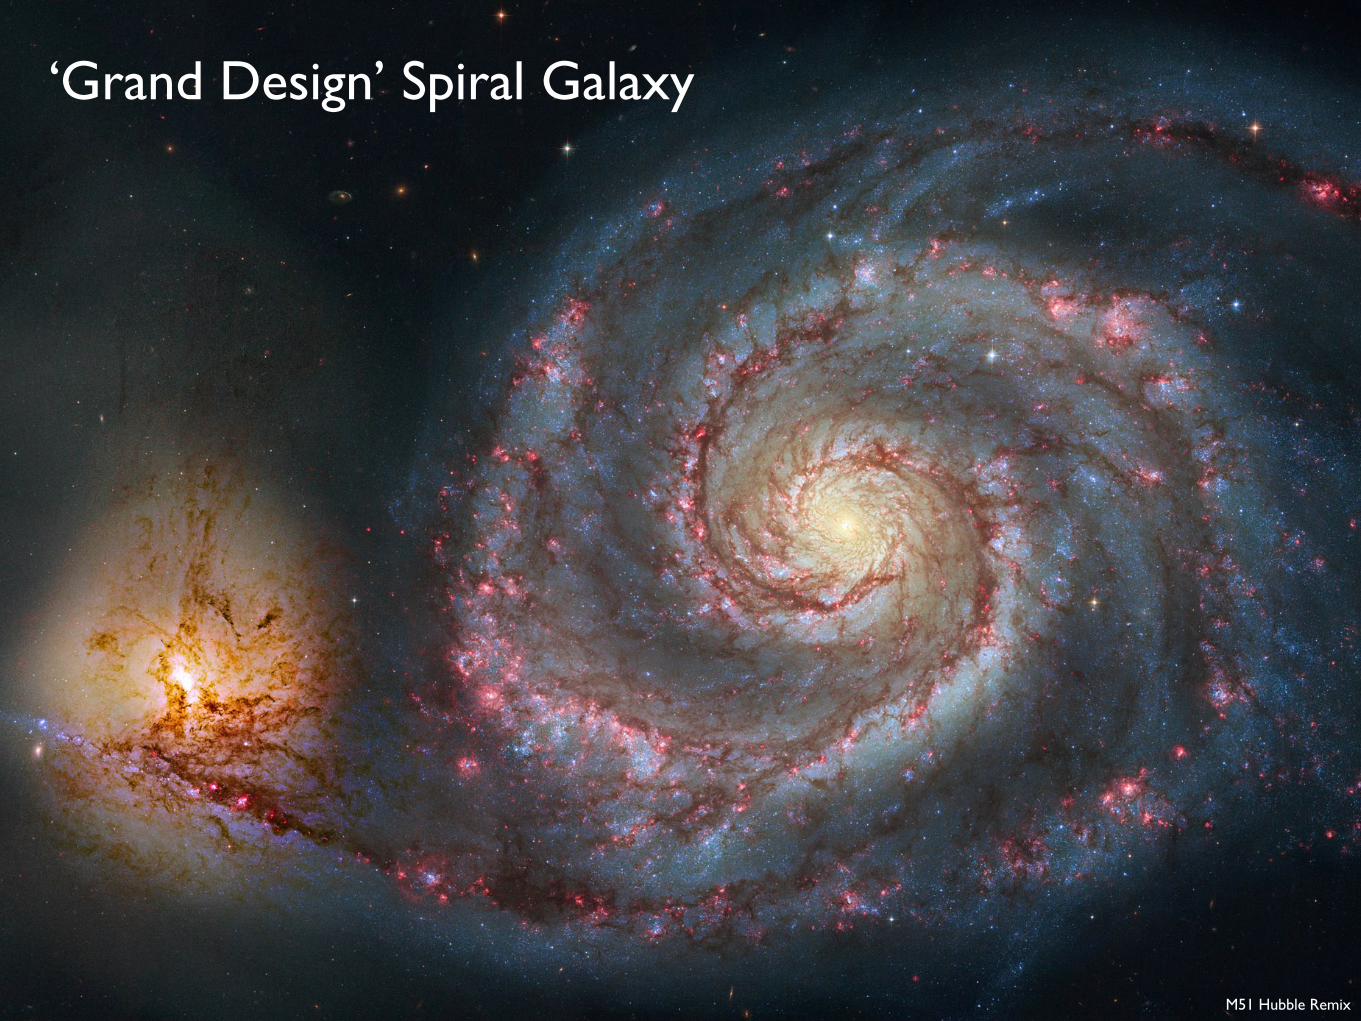
M51 Hubble Remix
‘Grand Design’ Spiral Galaxy

The Sombrero Galaxy from VLT
Disk Galaxy With Large Bulge

NGC 2787: A Barred Lenticular Galaxy
Lenticular Galaxy With Dust

Galaxies Away
Giant Elliptical Galaxy With Companions

M31: The Andromeda Galaxy
Dwarf Elliptical Galaxy Companions to M31
M32: Blue Stars in an Elliptical Galaxy

The Large Cloud of Magellan
Irregular Galaxy (Large Magellanic Cloud)

Peculiar Galaxy
The Colliding Galaxies of NGC 520

The Hubble Tuning Fork — Classification of Galaxies
Hubble’s Galaxy Classification
Irregular and peculiar galaxies not included.
Local Group
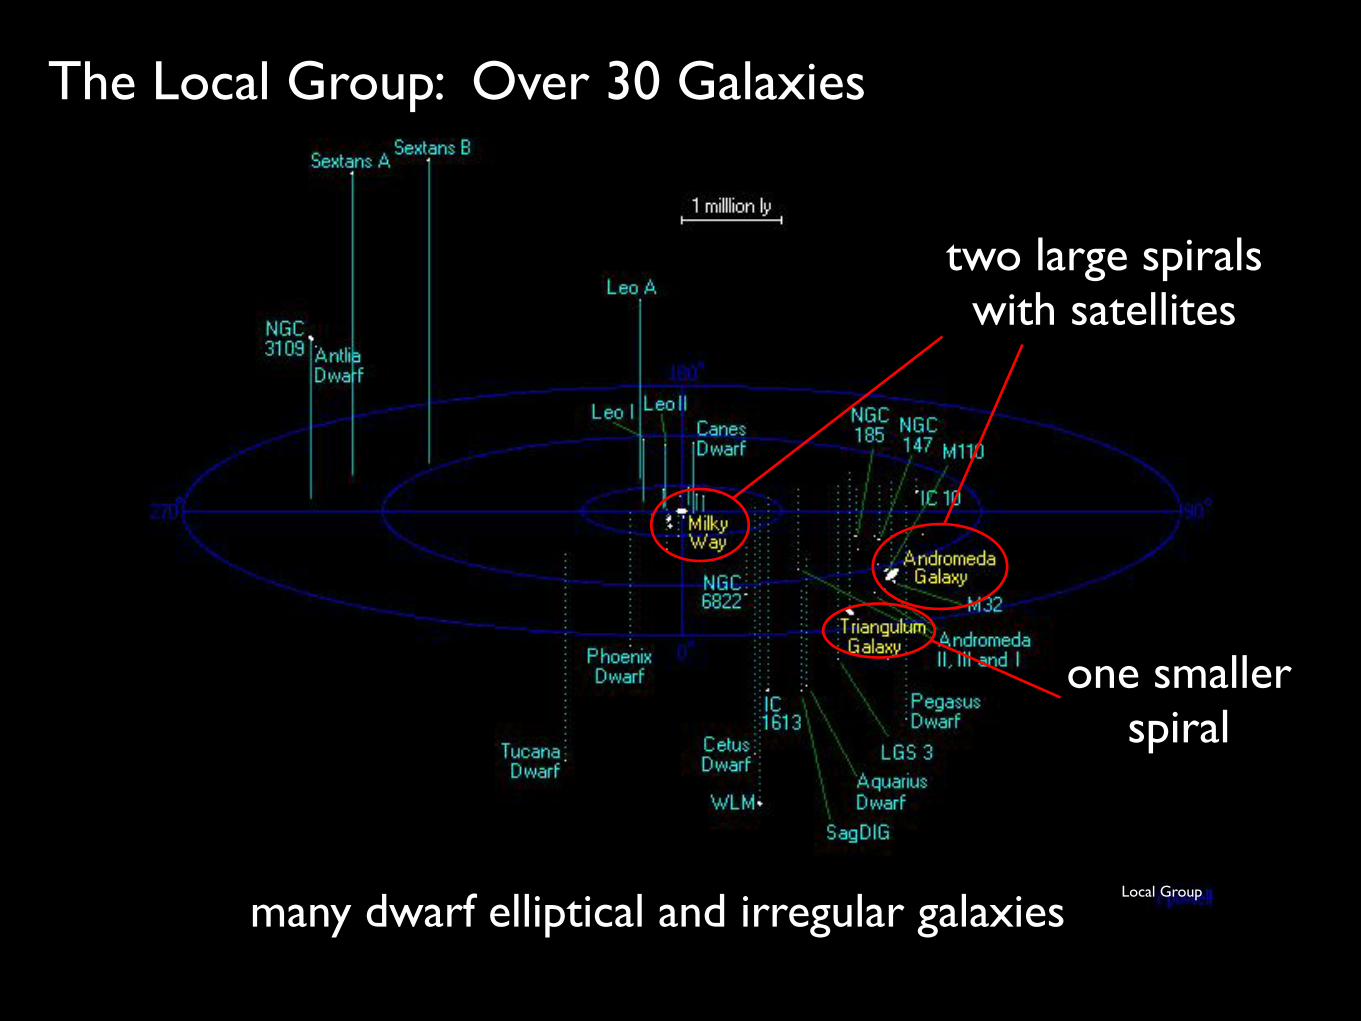
The Local Group: Over 30 Galaxies
two large spirals with satellites
one smaller spiral
many dwarf elliptical and irregular galaxies

The Virgo Cluster:
M86 in the Virgo Cluster
: Over 1000 Galaxies!
Distance: ~6 × 10⁷ lythree massive elliptical galaxiesmany MW-sized galaxies
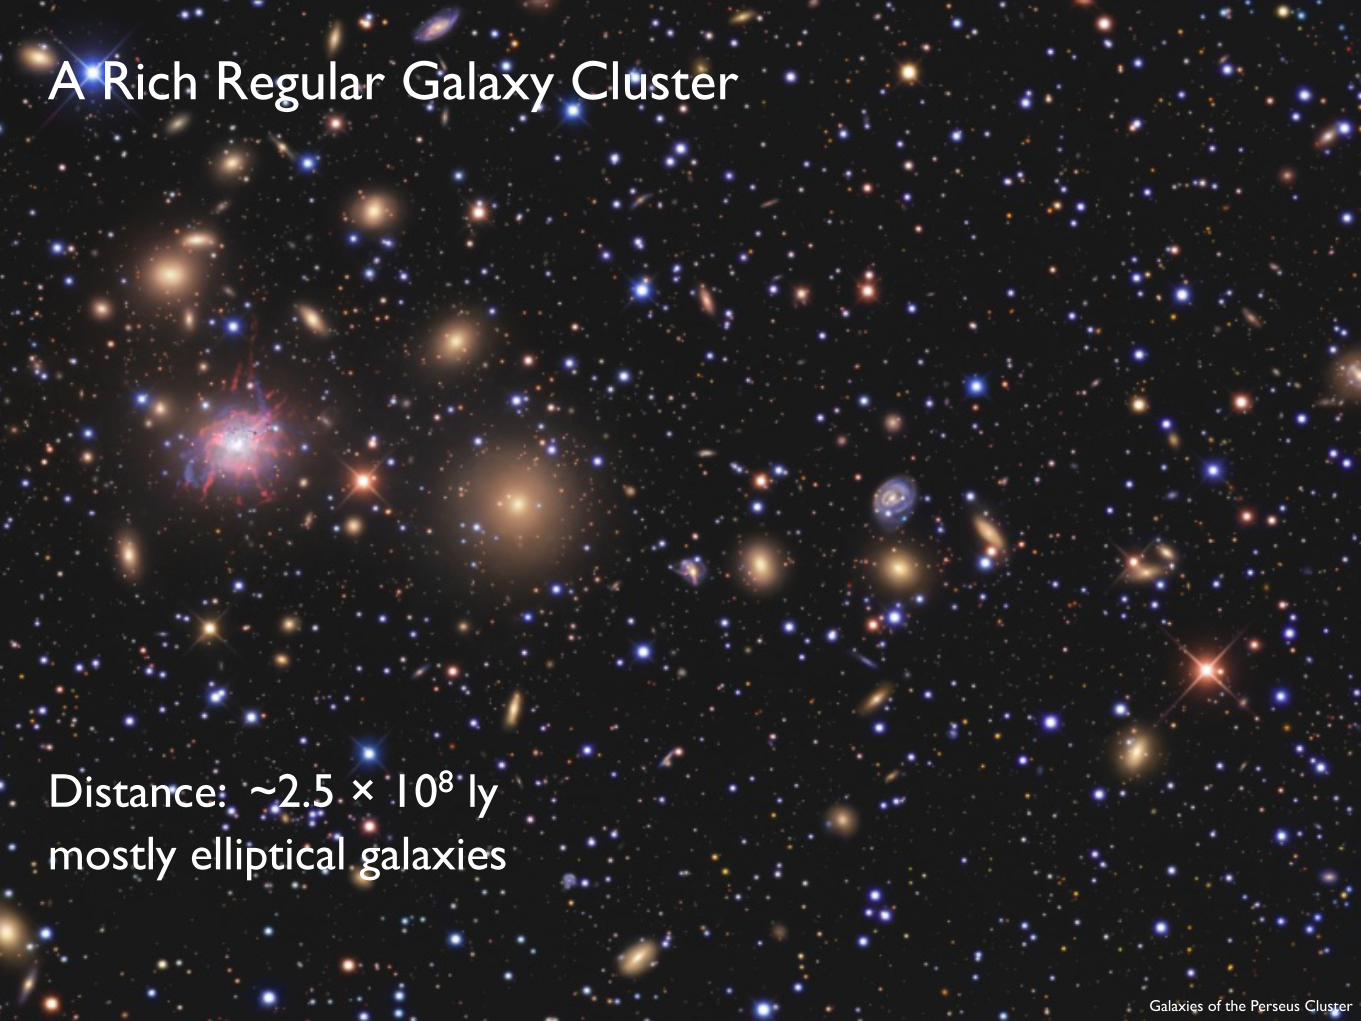
A Rich Regular Galaxy Cluster
Galaxies of the Perseus Cluster
Distance: ~2.5 × 10⁸ lymostly elliptical galaxies
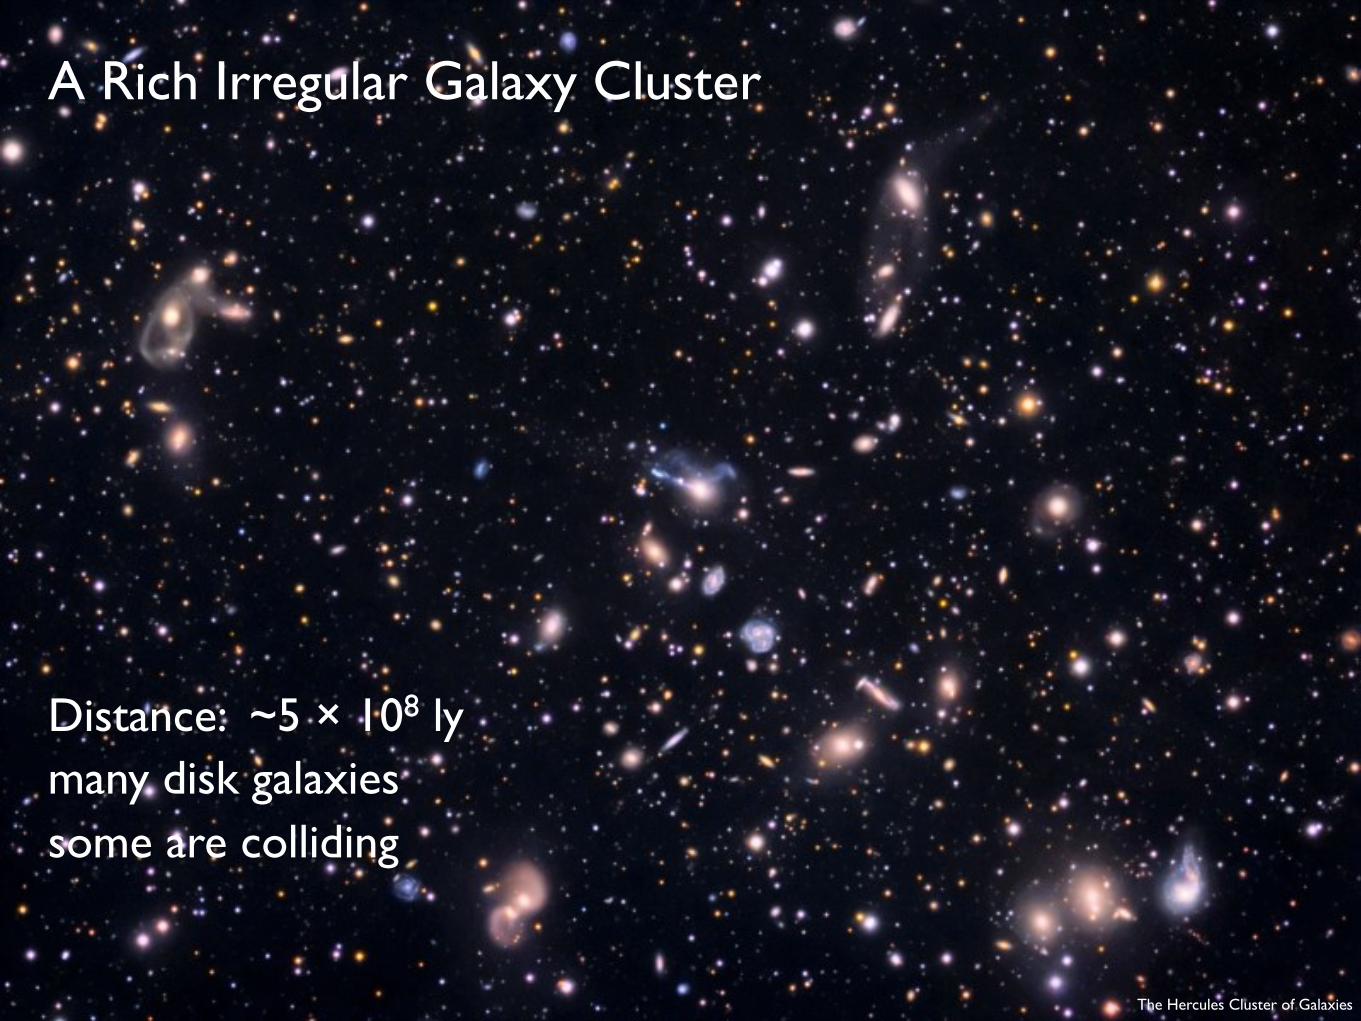
A Rich Irregular Galaxy Cluster
The Hercules Cluster of Galaxies
Distance: ~5 × 10⁸ lymany disk galaxies some are colliding
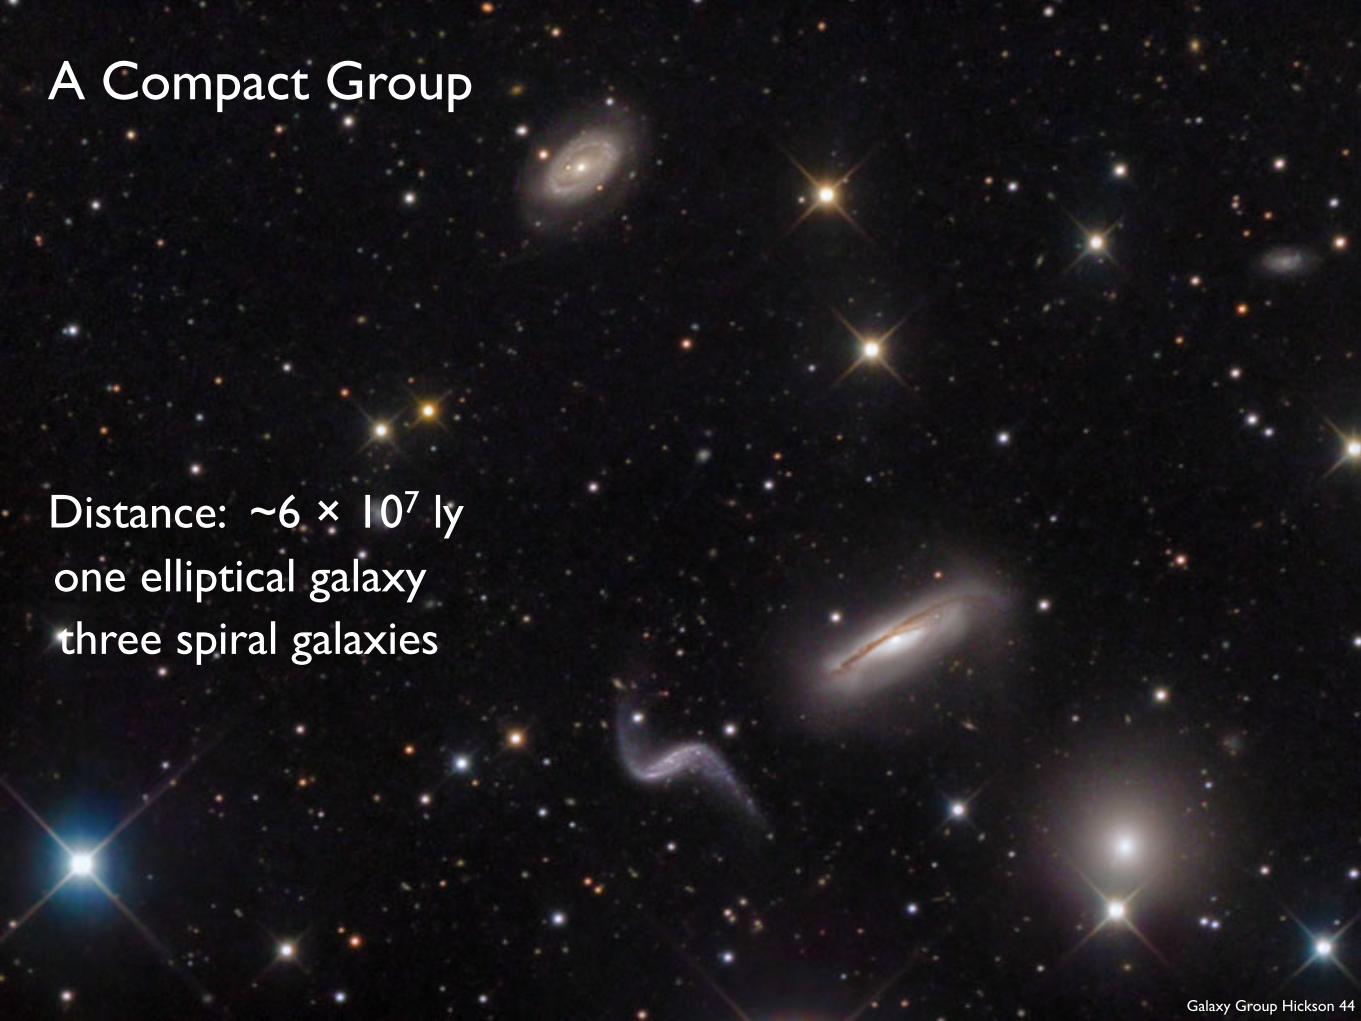
A Compact Group
Distance: ~6 × 10⁷ lyone elliptical galaxy three spiral galaxies
Galaxy Group Hickson 44

2. HUBBLE’S LAW AND GALAXY EVOLUTION
a. The Expanding Universe
b. Looking Back in Time
c. Class Survey

The Doppler Shift
A stationary source sends out waves of the same wavelength in all directions.
If the source is moving, the waves bunch up ahead of its motion, and spread out behind.
Doppler EffectDoppler Effect

The Doppler Shift: Light
We get a similar effect with light. The change in wavelength λ depends on the source’s velocity v toward or away from us:
λshift - λrest
λrest=
vc
where λshift is the observed (shifted) wavelength, λrest is the wavelength with the source at rest, and c is the speed of light.
red-shift blue-shift
Note: valid for v ≪ c

Text
The Redshift
Most galaxies have spectra systematically shifted toward the red, implying that they’re moving away from us.

The Redshift: An Example
Arp 188 and the Tadpole's Tidal Tail
line λrest(nm)
λshift(nm)
z v = c z(km/s)
Hβ 486.1 500.9 0.0304 9120
Hγ 434.1 447.3 0.0304 9120
Hδ 410.2 422.7 0.0304 9120
λshift - λrest
λrest= z
Define the redshift:

1931ApJ....74...43H
The Expansion of the Universe
Plotting galaxy velocities, v, against their distances, d, revealed a relationship:
v ≃ H0 d,
where H0 is Hubble’s “constant”:

The Expansion of the Universe
Plotting galaxy velocities, v, against their distances, d, revealed a relationship:
v ≃ H0 d,
where H0 is Hubble’s “constant”:
Two consequences:(1) galaxy redshifts can be used to estimate distances;(2) the universe is expanding.
H0 ≃ 22 km/s/Mly.

The Cartoon History of the Universe
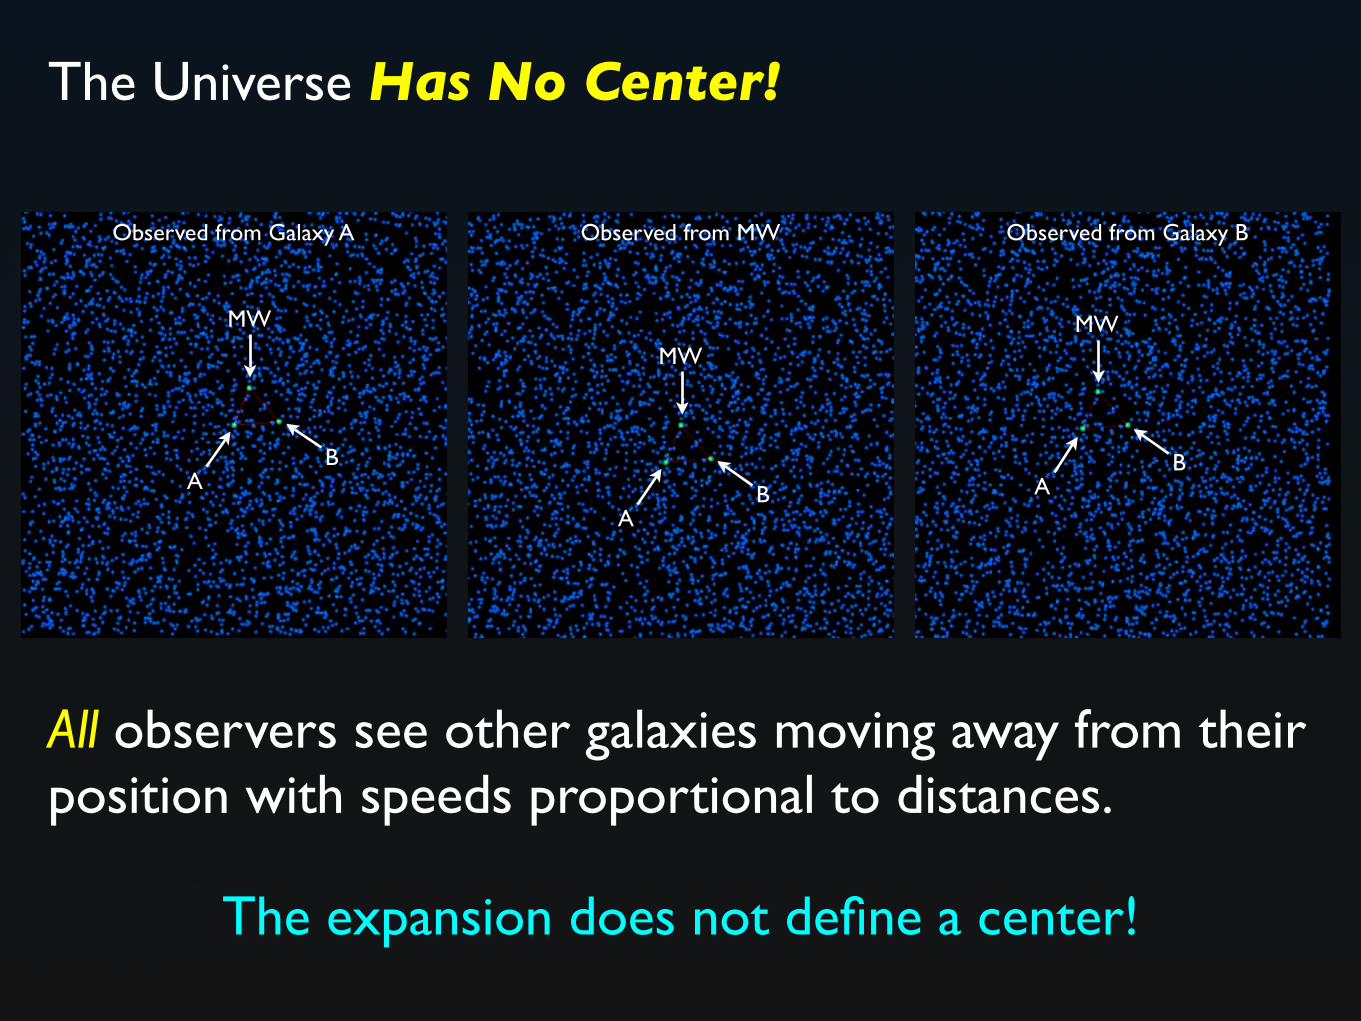
The Universe Has No Center!
Observed from MW Observed from Galaxy BObserved from Galaxy A
MW
AB
MW
AB
MW
AB
All observers see other galaxies moving away from their position with speeds proportional to distances.
The expansion does not define a center!
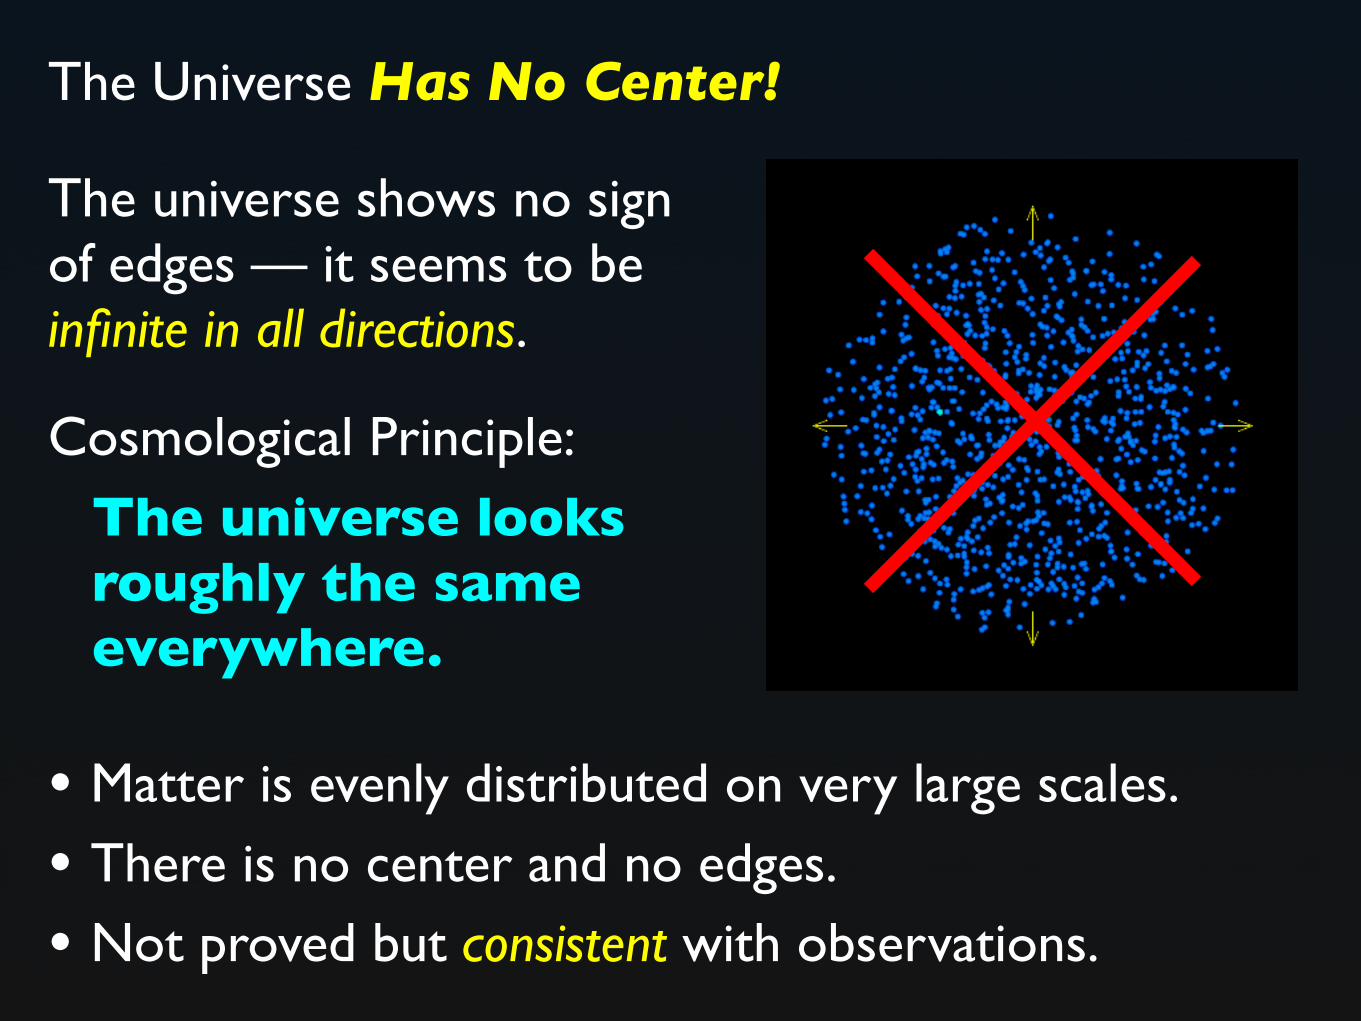
The universe shows no sign of edges — it seems to be infinite in all directions.
The universe looks roughly the same everywhere.
• Matter is evenly distributed on very large scales.
• There is no center and no edges.
• Not proved but consistent with observations.
The Universe Has No Center!
Cosmological Principle:
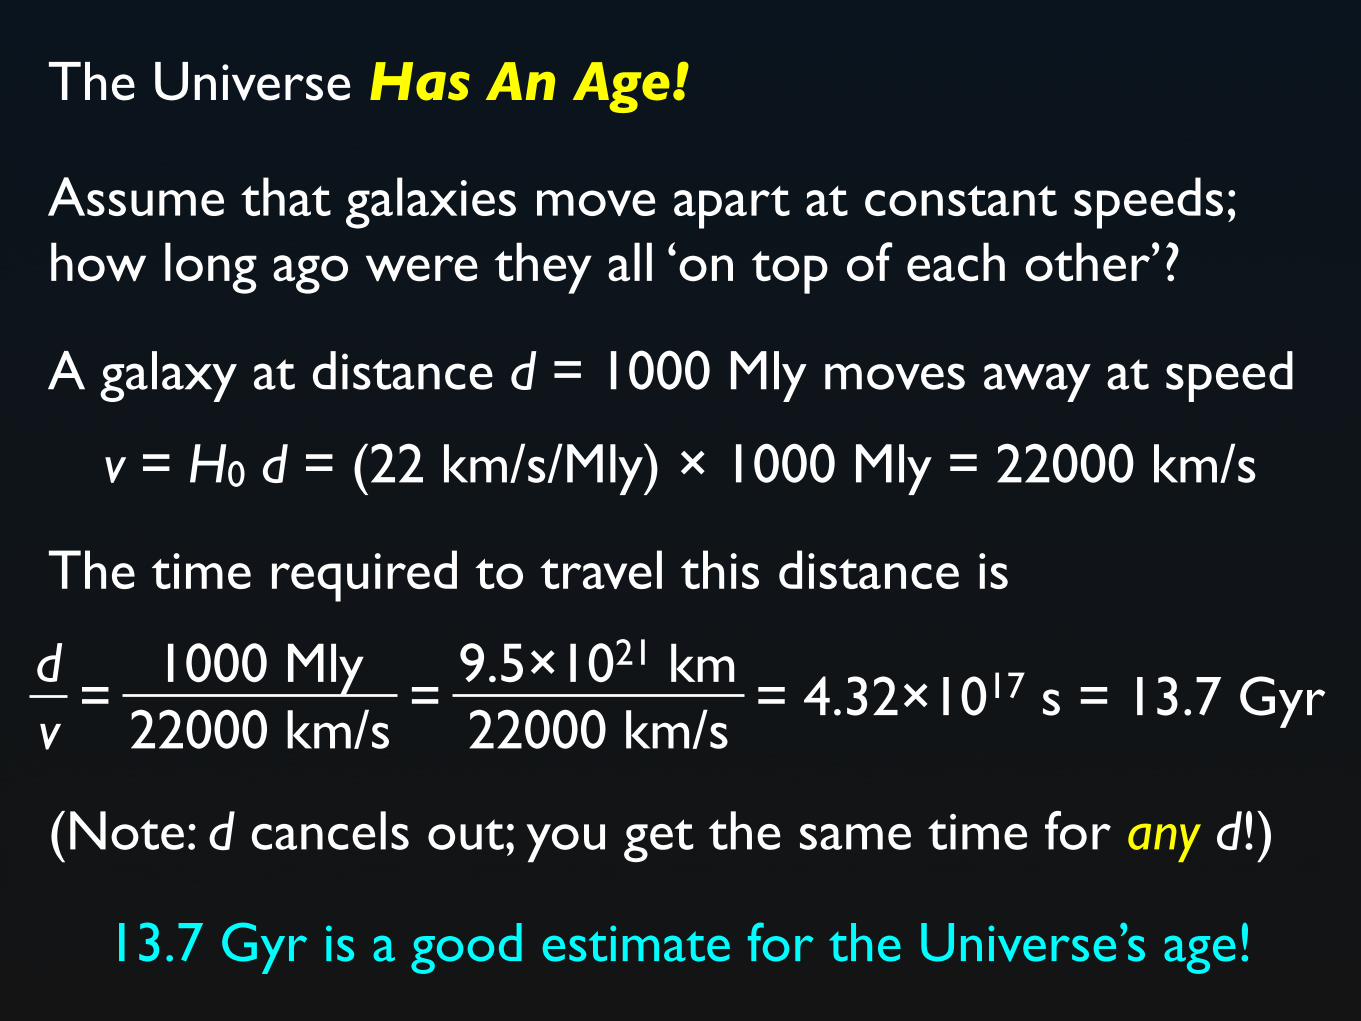
The Universe Has An Age!
Assume that galaxies move apart at constant speeds; how long ago were they all ‘on top of each other’?
A galaxy at distance d = 1000 Mly moves away at speed
v = H0 d = (22 km/s/Mly) × 1000 Mly = 22000 km/s
dv
=1000 Mly
22000 km/s=
9.5×10²¹ km22000 km/s
= 4.32×10¹⁷ s = 13.7 Gyr
The time required to travel this distance is
(Note: d cancels out; you get the same time for any d!)
13.7 Gyr is a good estimate for the Universe’s age!

galaxylocation
then
then
High Redshift
Redshifts z bigger than one can’t be interpreted in terms of galaxy velocity:
v = c z
dthen
dtoday
A correct interpretation:
1 + z = dthen
dtoday
Example: from redshiftz = 2 to today, galaxy distances have tripled.

Galaxy History Revealed in This Colorful Hubble View
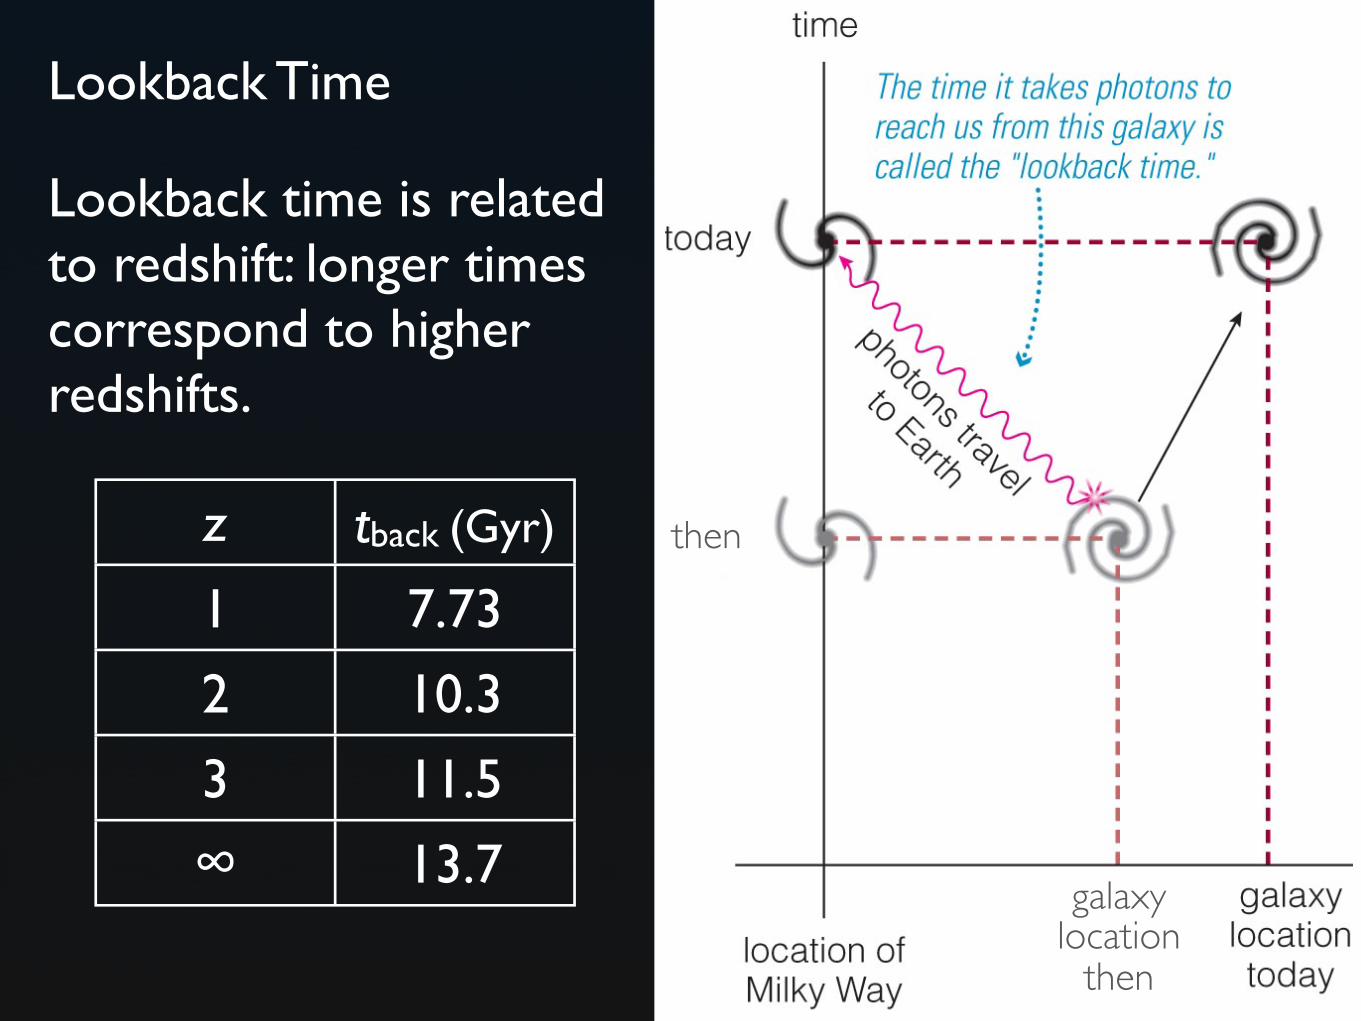
Looking Back in Time
Light travels at finite speed, so when we look out into space we are also looking back in time!
Many of these galaxies are billions of lightyears away, so we’re seeing them as they were billions of years ago.
galaxylocation
then
then
Lookback Time
Lookback time is related to redshift: longer times correspond to higher redshifts.
z tback (Gyr)
1 7.73
2 10.3
3 11.5
∞ 13.7
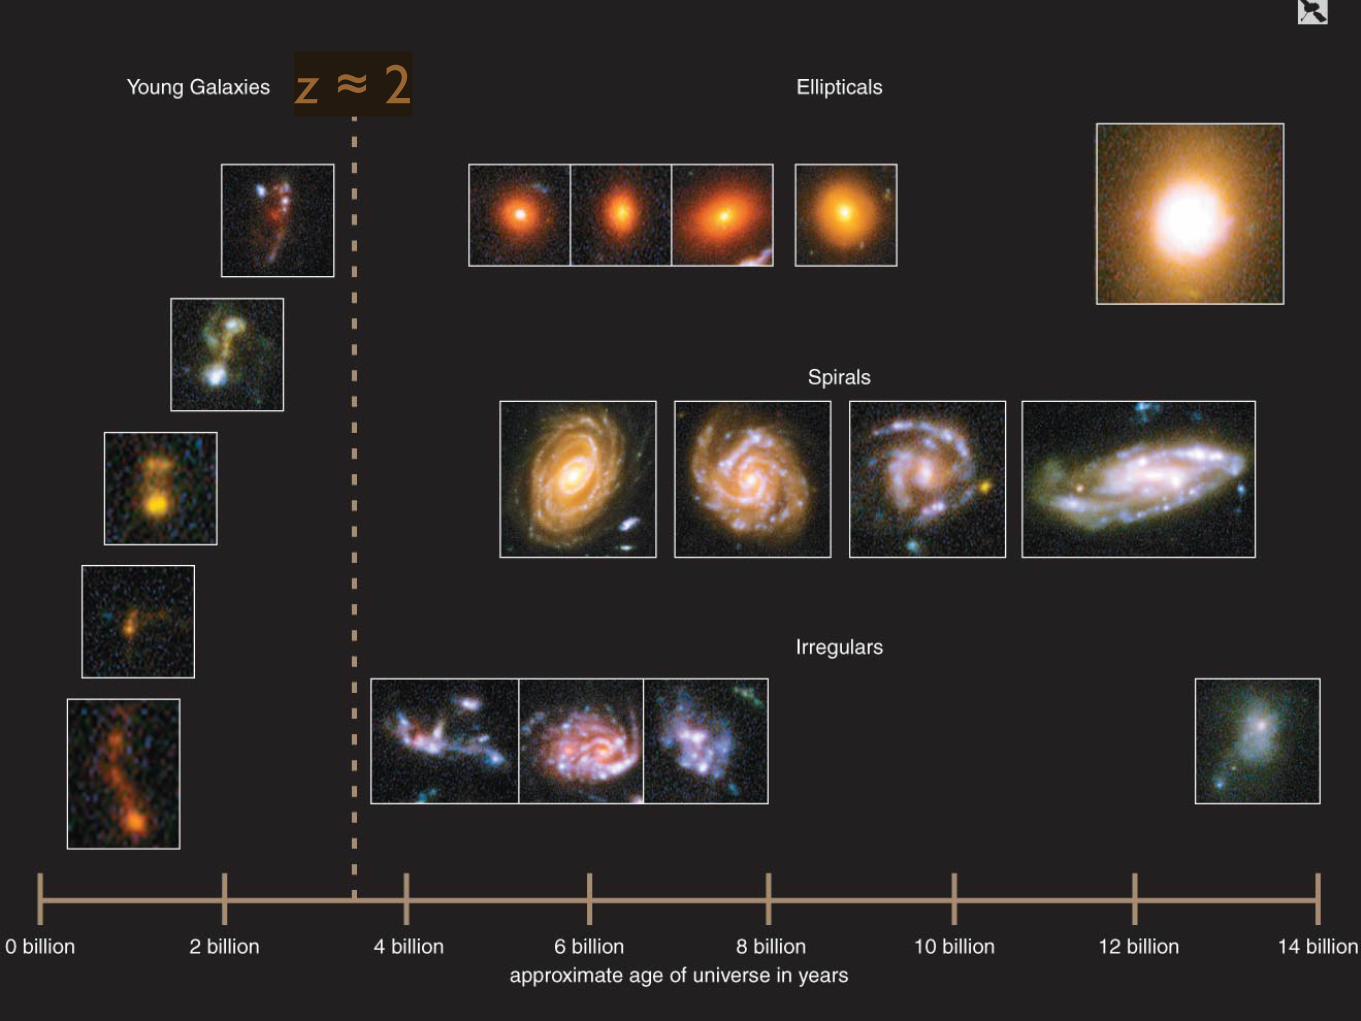
z ≈ 2
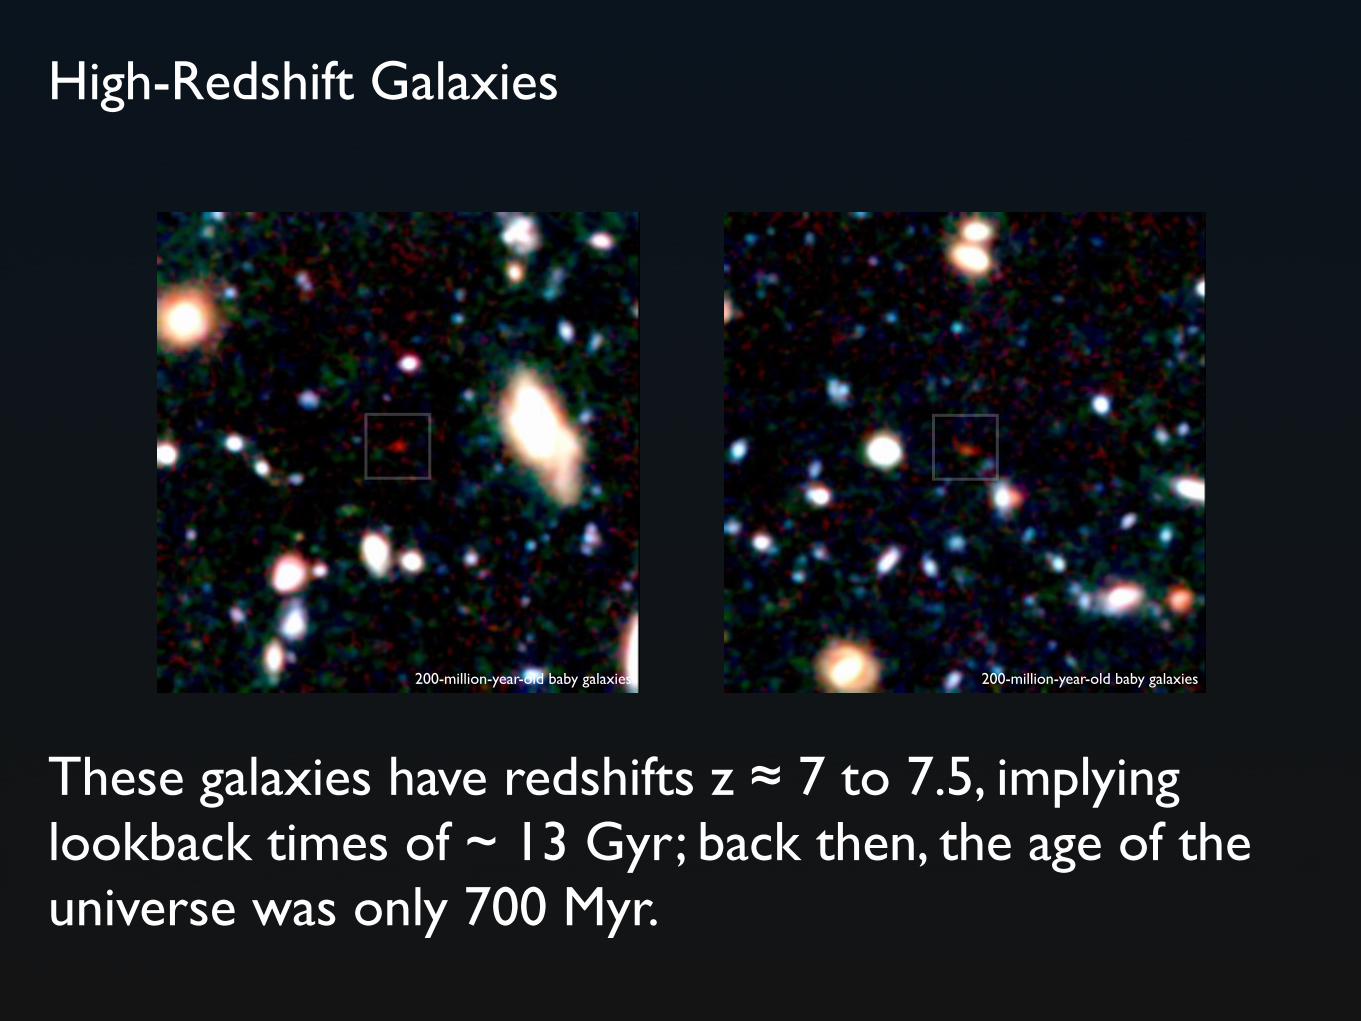
High-Redshift Galaxies
200-million-year-old baby galaxies 200-million-year-old baby galaxies
These galaxies have redshifts z ≈ 7 to 7.5, implying lookback times of ~ 13 Gyr; back then, the age of the universe was only 700 Myr.

High-Redshift Galaxies
200-million-year-old baby galaxies 200-million-year-old baby galaxies
• Irregular shapes; no apparent symmetry• Very high rates of star formation• Powerful outflows of gas
1. What do we need to know about a star before we can use it as a standard candle?
A. MassB. DiameterC. AgeD. Luminosity E. Temperature
2. We compute the peak luminosity of a white-dwarf supernovae in another galaxy by determining its distance using __________ and measuring its __________.
A. parallax; temperature from spectraB. Cepheids in the same galaxy; apparent brightnessC. main-sequence fitting; apparent brightnessD. Cepheids in the same galaxy; makeup from spectraE. parallax; mass using orbital motion
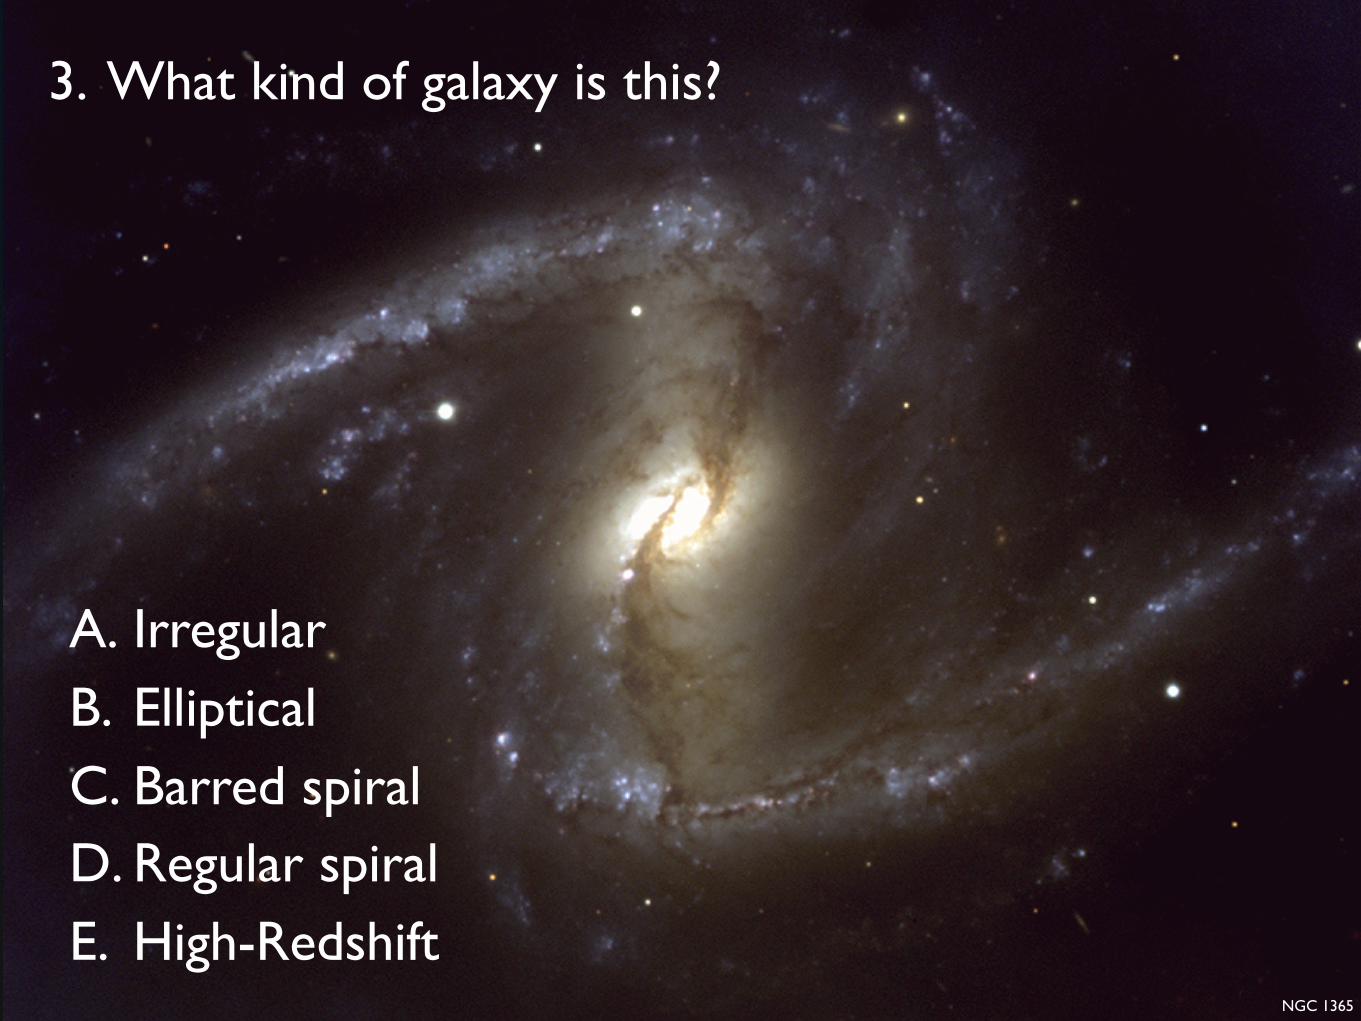
NGC 1365
3. What kind of galaxy is this?
A. IrregularB. EllipticalC. Barred spiralD. Regular spiralE. High-Redshift
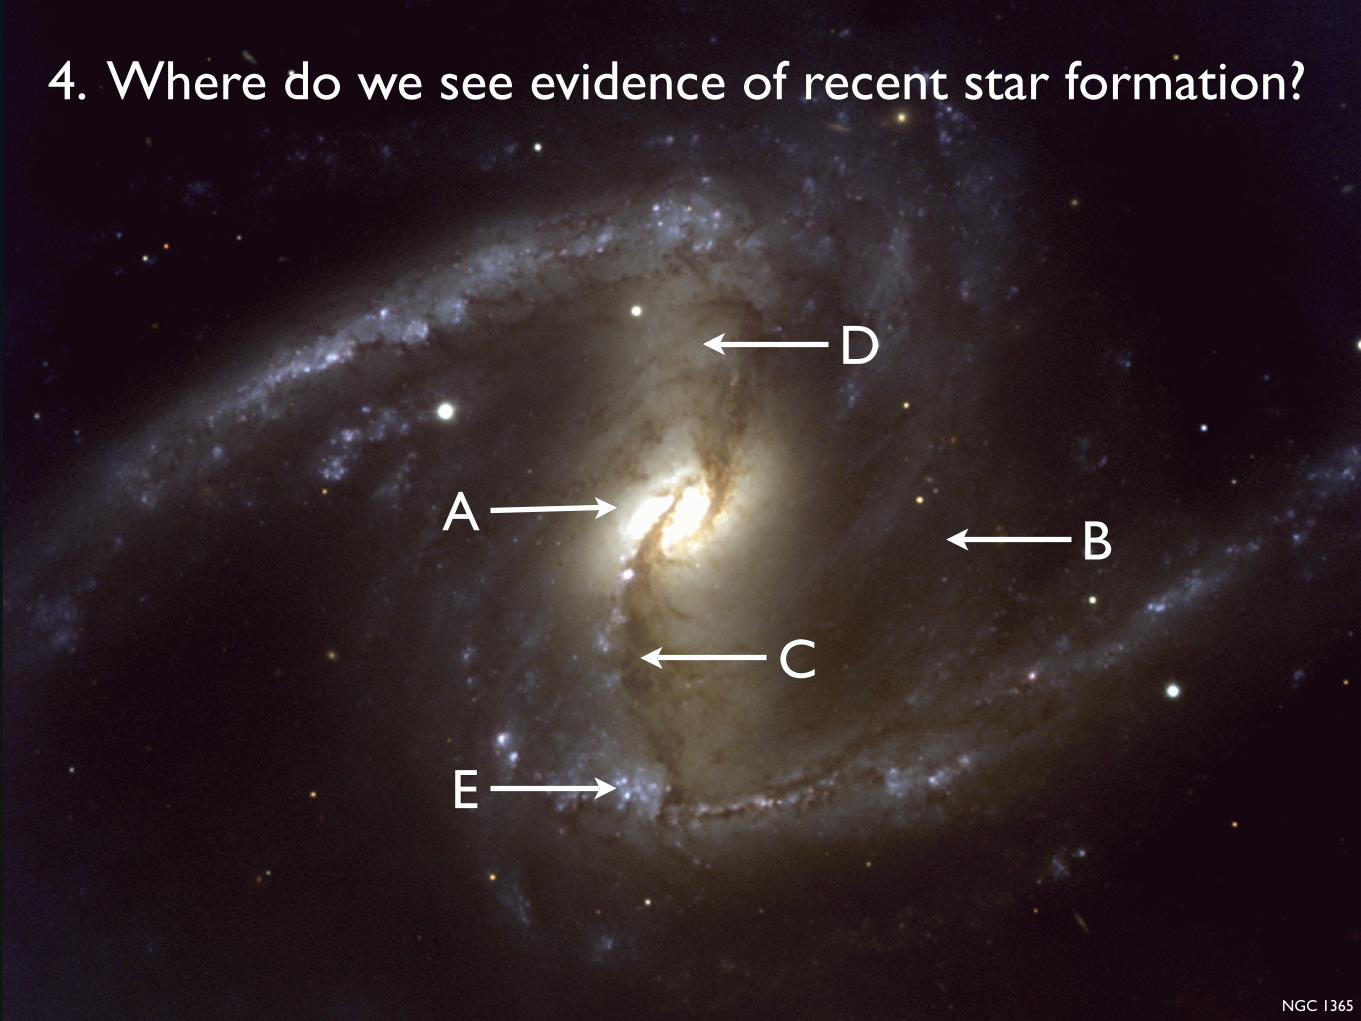
4. Where do we see evidence of recent star formation?
A
E
C
D
B
NGC 1365

M86 in the Virgo Cluster
5. Which of these is an elliptical galaxy?
A
BC
DE

6. How can we tell another galaxy is moving away?
A. It appears smaller from year to year.B. It appears fainter from year to year.C. Its spectral lines are shifted toward the blue.D. Its spectral lines are shifted toward the red.E. Its parallax angle gets smaller over time.

7. If galaxy A has redshift zA = 0.05 and galaxy B has redshift zB = 0.1,
A. galaxy A is twice as far as galaxy B.B. both galaxies have the same distance.C. galaxy B is twice as far as galaxy A.D. galaxy B is four times as far as galaxy A.E. we cannot tell which galaxy is further.

8. Which statement is most likely to be correct?
A. Other galaxies are moving away from the Milky Way, but not from each other.
B. Every galaxy in the universe is surrounded by other galaxies which are moving away from it.
C. The universe is a finite sphere of galaxies expanding into empty space.
D. All galaxies are orbiting the center of the universe.E. Galaxies are moving away from the Milky Way with
speeds which do not depend on their distances.

3. PECULIAR AND ACTIVE GALAXIES
a. Galaxy Collisions
b. Starburst Galaxies
c. Active Galaxies
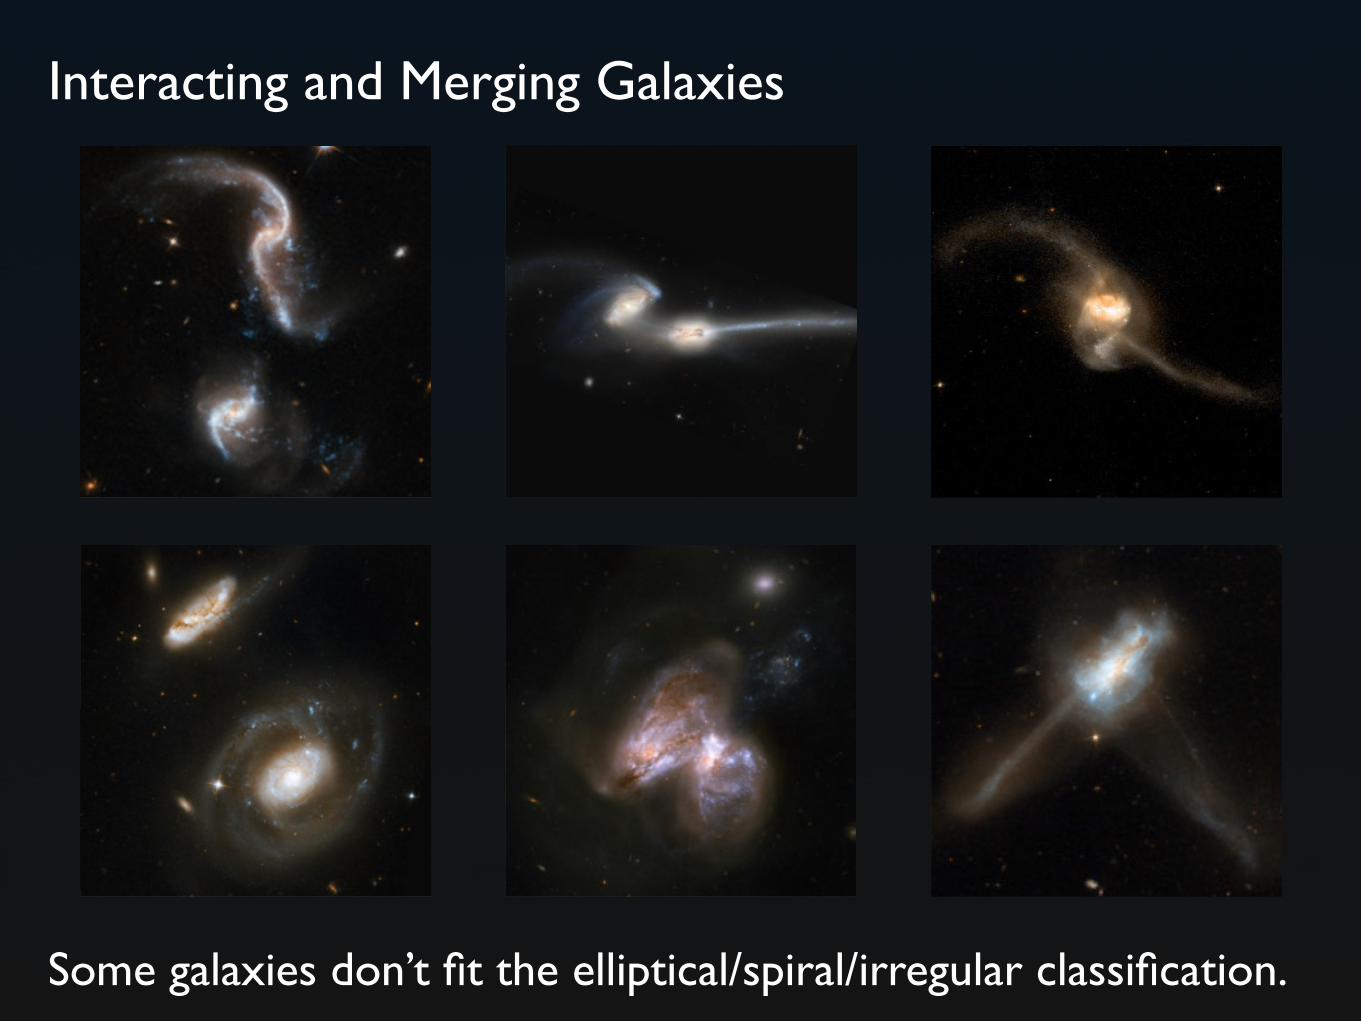
Figure 1.4 Galaxy sample in this study. Top and middle row from left to right: Arp 256,NGC 7469, NGC 4676 and Arp 299. Bottom row from left to right: IC 883, NGC 2623 andNGC 7252. North is up, and east is to the left. Most colored images are restored from HSTACS/WFC images (courtesy of NASA, the Hubble Heritage, A. Evans and ESA, taken fromhttp://hubblesite.org/newscenter/archive/releases/galaxy/interacting/2008/16/image/a/,and courtesy of NASA, H. Ford, G. Illingworth, M. Clampin, G. Hartig, and the ACS ScienceTeam, taken from http://hubblesite.org/newscenter/archive/releases/2002/11/image/d/).Image of NGC 7252 is restored from B- and R-band images taken with CTIO 4m telescopefrom Hibbard et al. (1994).
12
Figure
1.4G
alaxysam
plein
thisstudy.
Topand
middle
rowfrom
leftto
right:A
rp256,
NG
C7469,N
GC
4676and
Arp
299.B
ottomrow
fromleft
toright:
IC883,N
GC
2623and
NG
C7252.
North
isup,and
eastis
tothe
left.M
ostcolored
images
arerestored
fromH
ST
AC
S/WFC
images
(courtesyofN
ASA
,theH
ubbleH
eritage,A.E
vansand
ESA
,takenfrom
http://hubblesite.org/newscenter/archive/releases/galaxy/interacting/2008/16/im
age/a/,and
courtesyofN
ASA
,H.Ford,G
.Illingworth,M
.Clam
pin,G.H
artig,andthe
AC
SScience
Team,
takenfrom
http://hubblesite.org/newscenter/archive/releases/2002/11/im
age/d/).Im
ageofN
GC
7252is
restoredfrom
B-and
R-band
images
takenw
ithC
TIO
4mtelescope
fromH
ibbardet
al.(1994).
12
Figure 1.4 Galaxy sample in this study. Top and middle row from left to right: Arp 256,NGC 7469, NGC 4676 and Arp 299. Bottom row from left to right: IC 883, NGC 2623 andNGC 7252. North is up, and east is to the left. Most colored images are restored from HSTACS/WFC images (courtesy of NASA, the Hubble Heritage, A. Evans and ESA, taken fromhttp://hubblesite.org/newscenter/archive/releases/galaxy/interacting/2008/16/image/a/,and courtesy of NASA, H. Ford, G. Illingworth, M. Clampin, G. Hartig, and the ACS ScienceTeam, taken from http://hubblesite.org/newscenter/archive/releases/2002/11/image/d/).Image of NGC 7252 is restored from B- and R-band images taken with CTIO 4m telescopefrom Hibbard et al. (1994).
12
Interacting and Merging Galaxies
Some galaxies don’t fit the elliptical/spiral/irregular classification.

How Can Galaxies Collide?
If galaxies move away from each other as the universe expands, how can they ever collide?
Interacting Galaxy UGC 9618
The gravitational attraction of two massive galaxy halos can locally reverse the expansion and cause a collision.
Most interacting pairs probably fell together “recently”.
SPIN
10.50–0.5
32.521.5
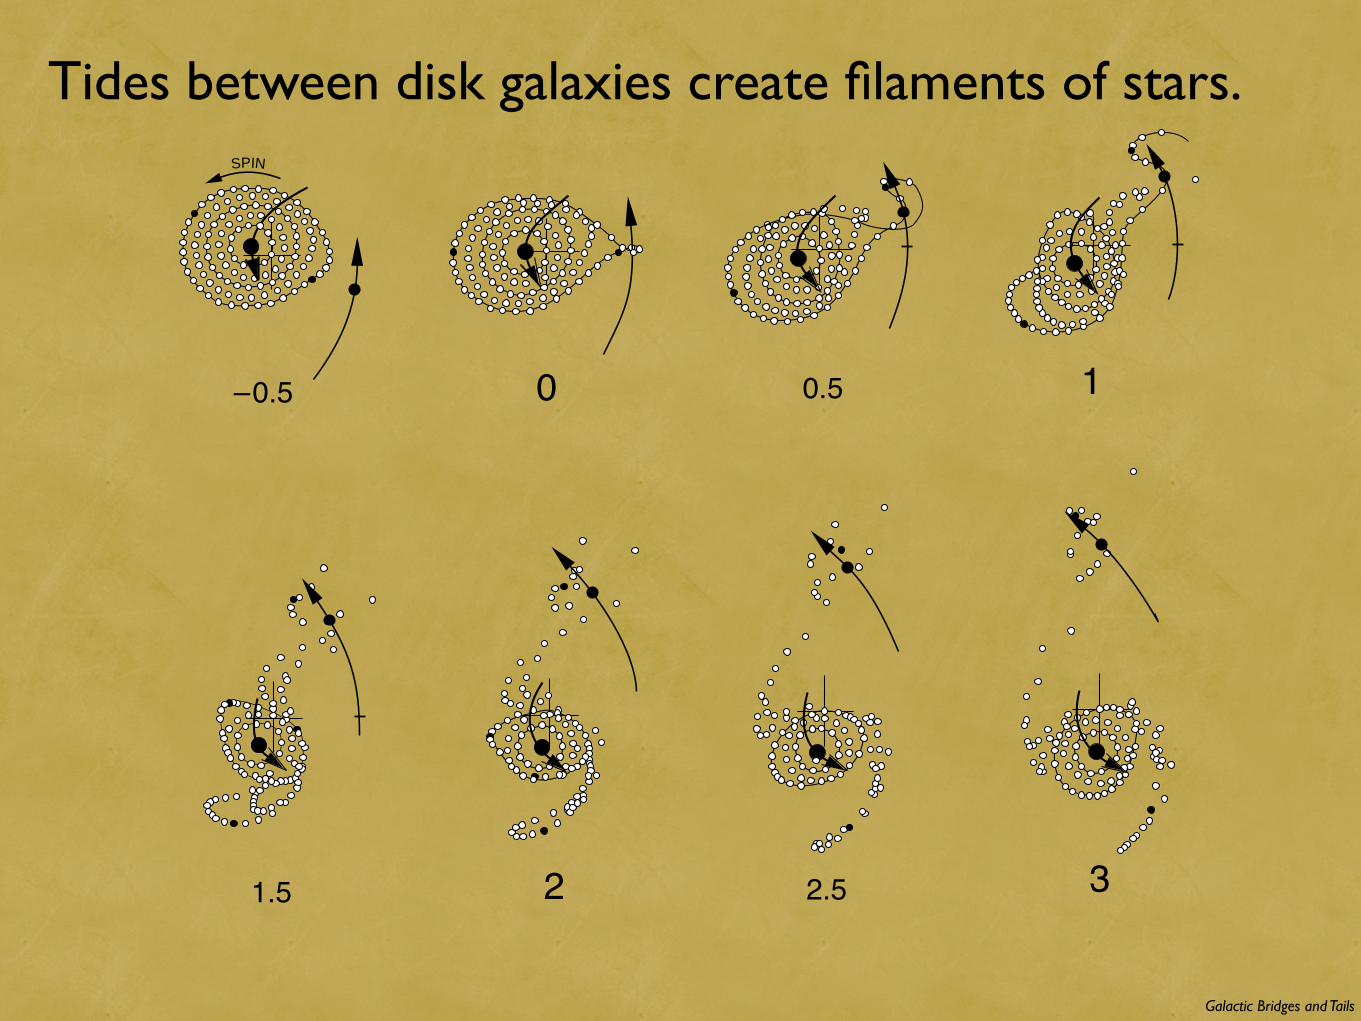
Galactic Bridges and Tails
Tides between disk galaxies create filaments of stars.
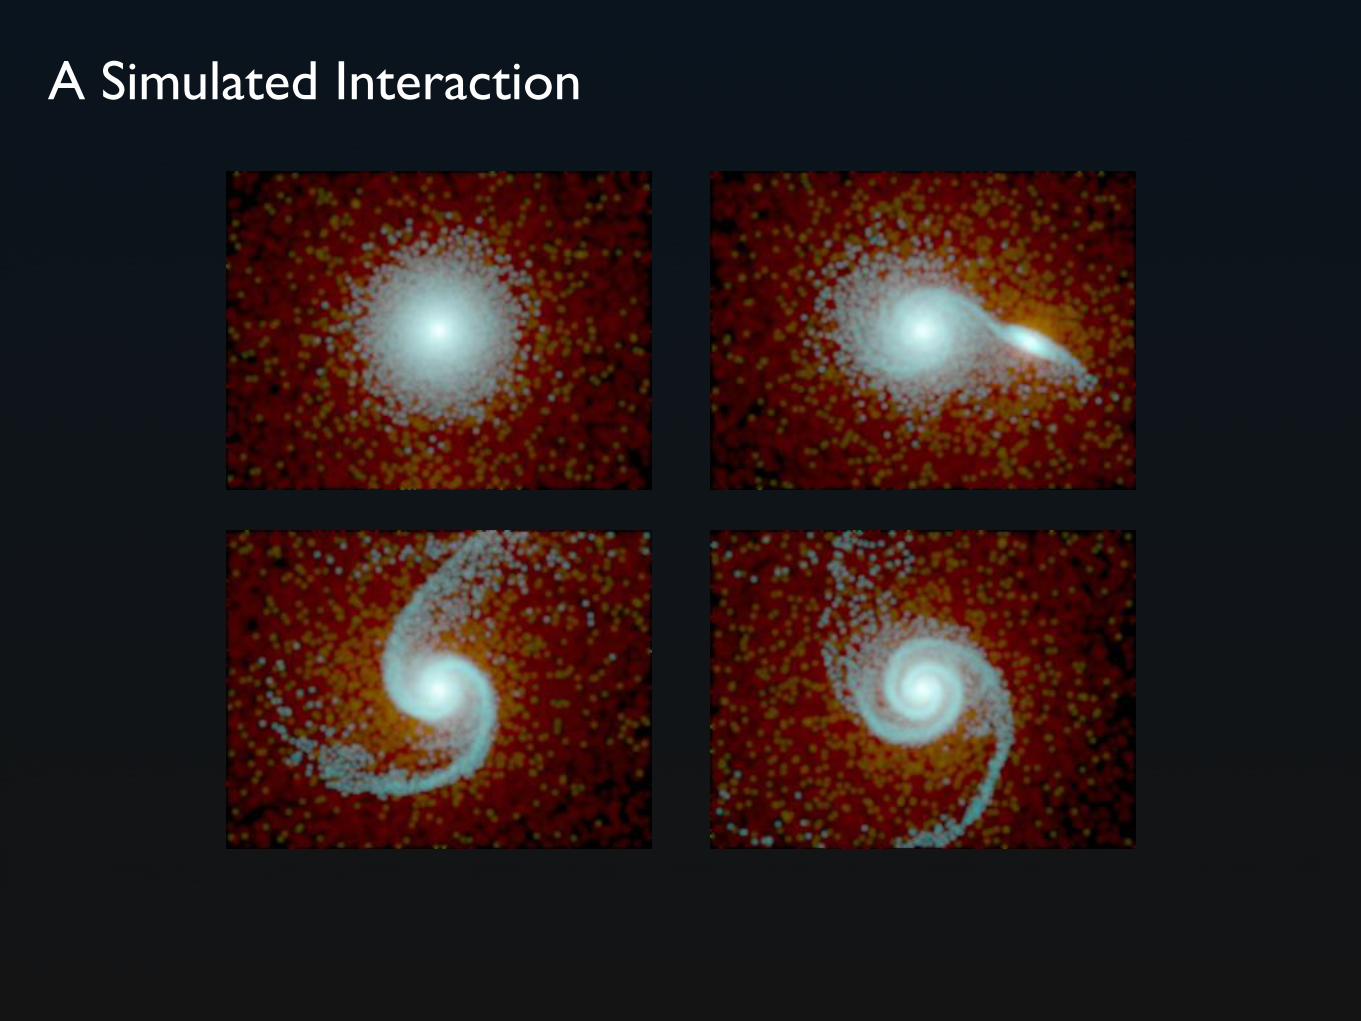
A Simulated Interaction

A Simulated Interaction
Tidal Interaction

M51 Hubble Remix
The Whirlpool Nebula

"The
Mic
e": C
ollid
ing
Gal
axie
s
The Mice: Two Colliding Spirals
NGC 4676: True-Color RGB Image
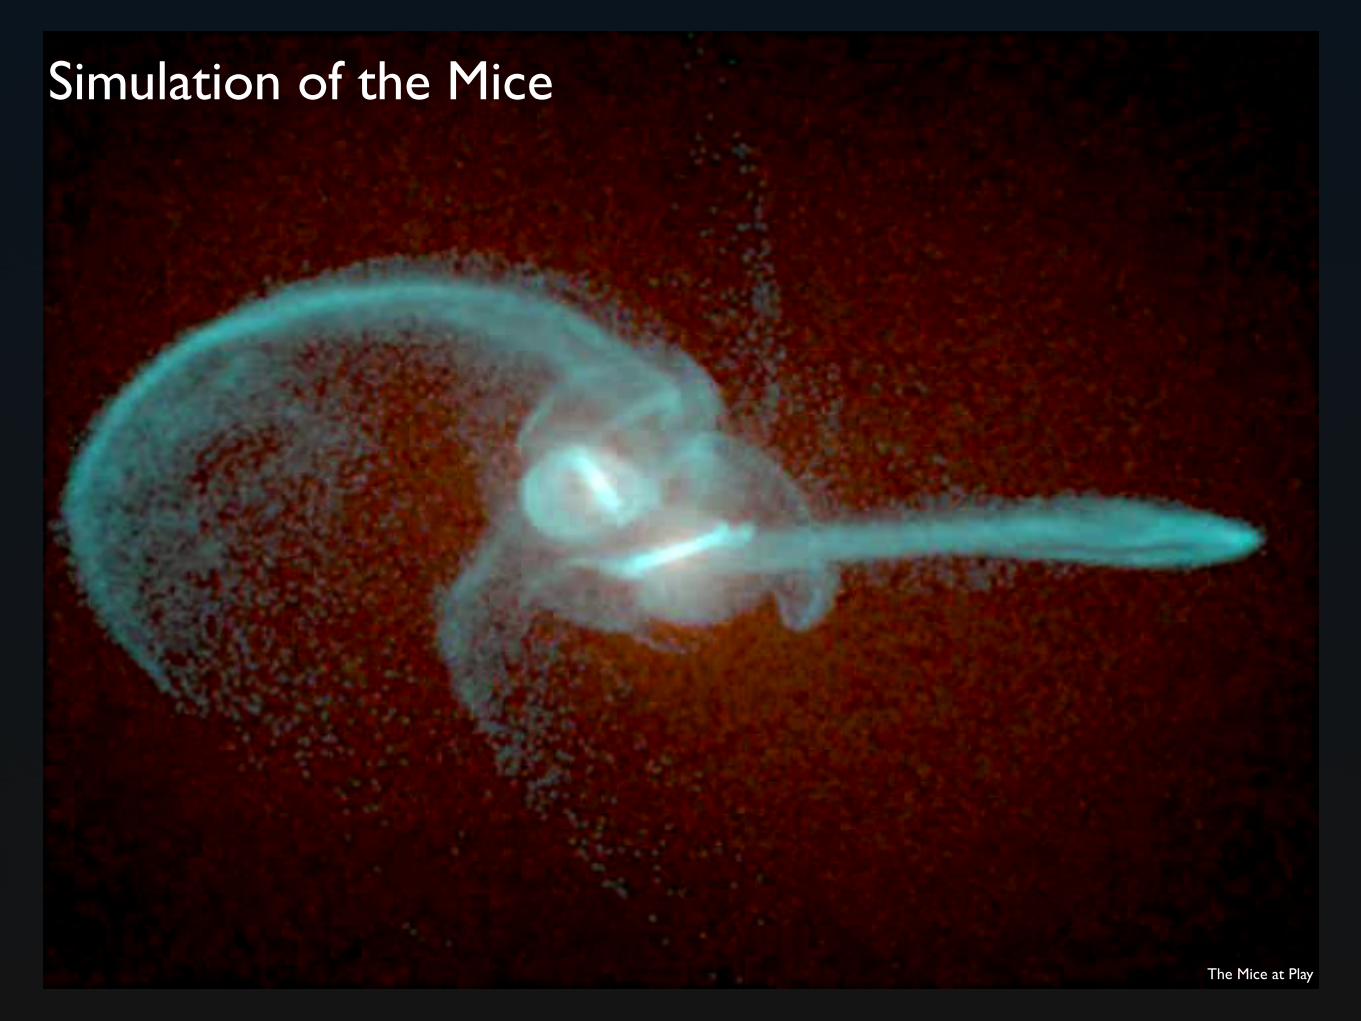
Simulation of the Mice
The Mice at Play
Why do Galaxies Merge?
Tidal forces transform the organized orbital motion of galaxies into random motions of stars and dark matter.
• This is a form of friction — it slows galaxies down.
• Dark matter plays critical role — absorbs momentum.

What Kind of Galaxy is Produced?
Random stellar orbits can naturally account for the oval shapes and slow rotation of elliptical galaxies.
• Merger hypothesis: spiral galaxies merge to form elliptical galaxies.
• Estimated merger rates can produce right number of elliptical galaxies.
• Need additional star formation in mergers to form cores of elliptical galaxies.

NGC 4038/4039
Super Star Clusters in the Antennae Galaxies
The Antennae
Rapid star formation is common in merging spiral galaxies!

Antennae Simulation With Star Formation

Galaxy Wars: M81 versus M82
Starburst Galaxies

Galaxy Wars: M81 versus M82
Starburst Galaxies
Starb
urst
Galaxy
M82
Star formation rate:~10 × Milky Way’s.
Gas outflow driven by supernovae

Interacting Galaxy NGC 3690
Arp 299: Supernova Factory
Ultra-Luminous Infrared Galaxy(L > 1012 L⊙)
First encounter ~700 Mry ago

A Collision In The Heart Of A Galaxy
Interacting Galaxy Arp 220
Arp 220: Merger Remnant
Core contains as much gas as entire Milky Way!
Star formation rate:~100 × Milky Way’s!
Active nucleus as well as stars.
Copyright © 2009 Pearson Education, Inc.
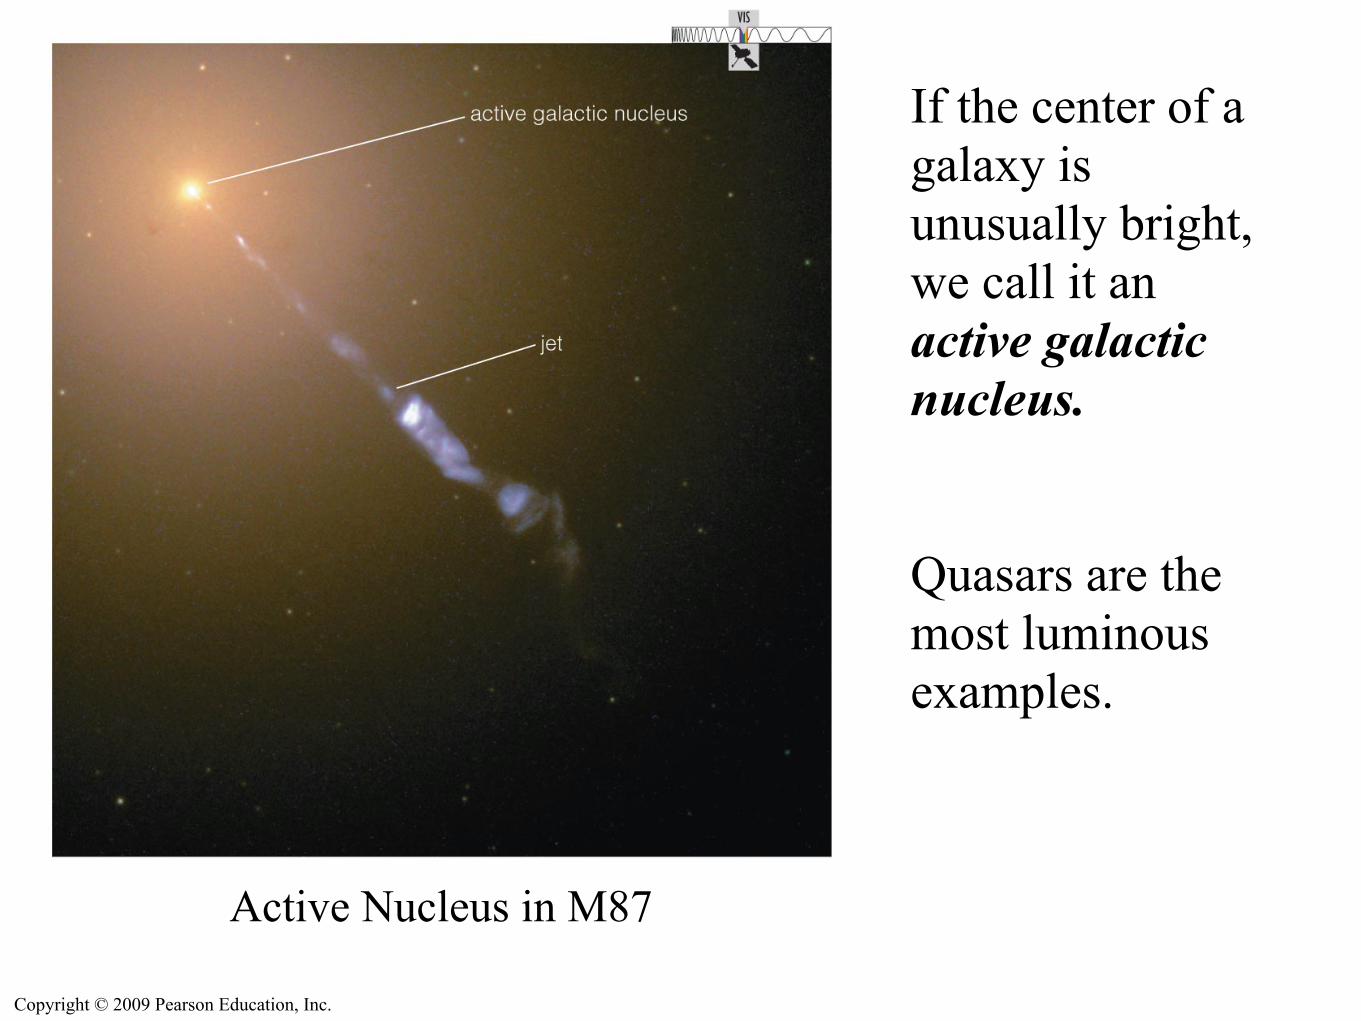
If the center of a galaxy is unusually bright, we call it an active galactic nucleus.
Quasars are the most luminous examples.
Active Nucleus in M87
Copyright © 2009 Pearson Education, Inc.
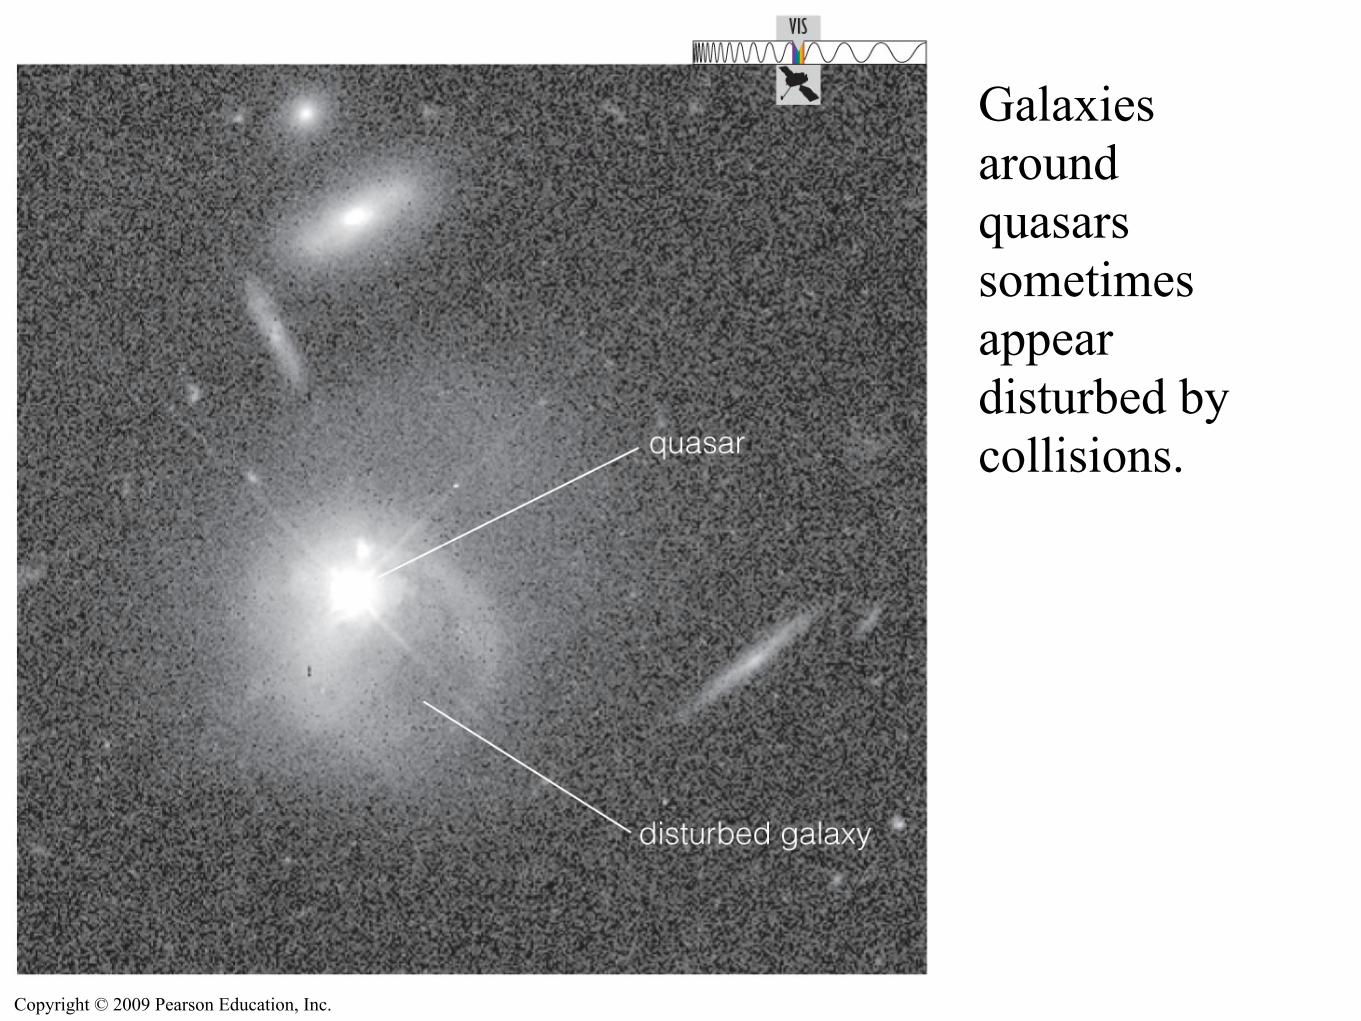
Galaxies around quasars sometimes appear disturbed by collisions.

Copyright © 2009 Pearson Education, Inc.
Radio galaxies contain active nuclei shooting out vast jets of plasma that emit radio waves coming from electrons moving at near light speed.

Copyright © 2009 Pearson Education, Inc.
Characteristics of Active Galaxies
• Luminosity can be enormous (>1012LSun).
• Luminosity can rapidly vary (comes from a space smaller than solar system).
• They emit energy over a wide range of wavelengths (contain matter with wide temperature range).
• Some drive jets of plasma at near light speed.

Copyright © 2009 Pearson Education, Inc.
What is the power source for quasars and other active galactic nuclei?

Copyright © 2009 Pearson Education, Inc.
The accretion of gas onto a supermassive black hole appears to be the only way to explain all the properties of quasars.
Copyright © 2009 Pearson Education, Inc.
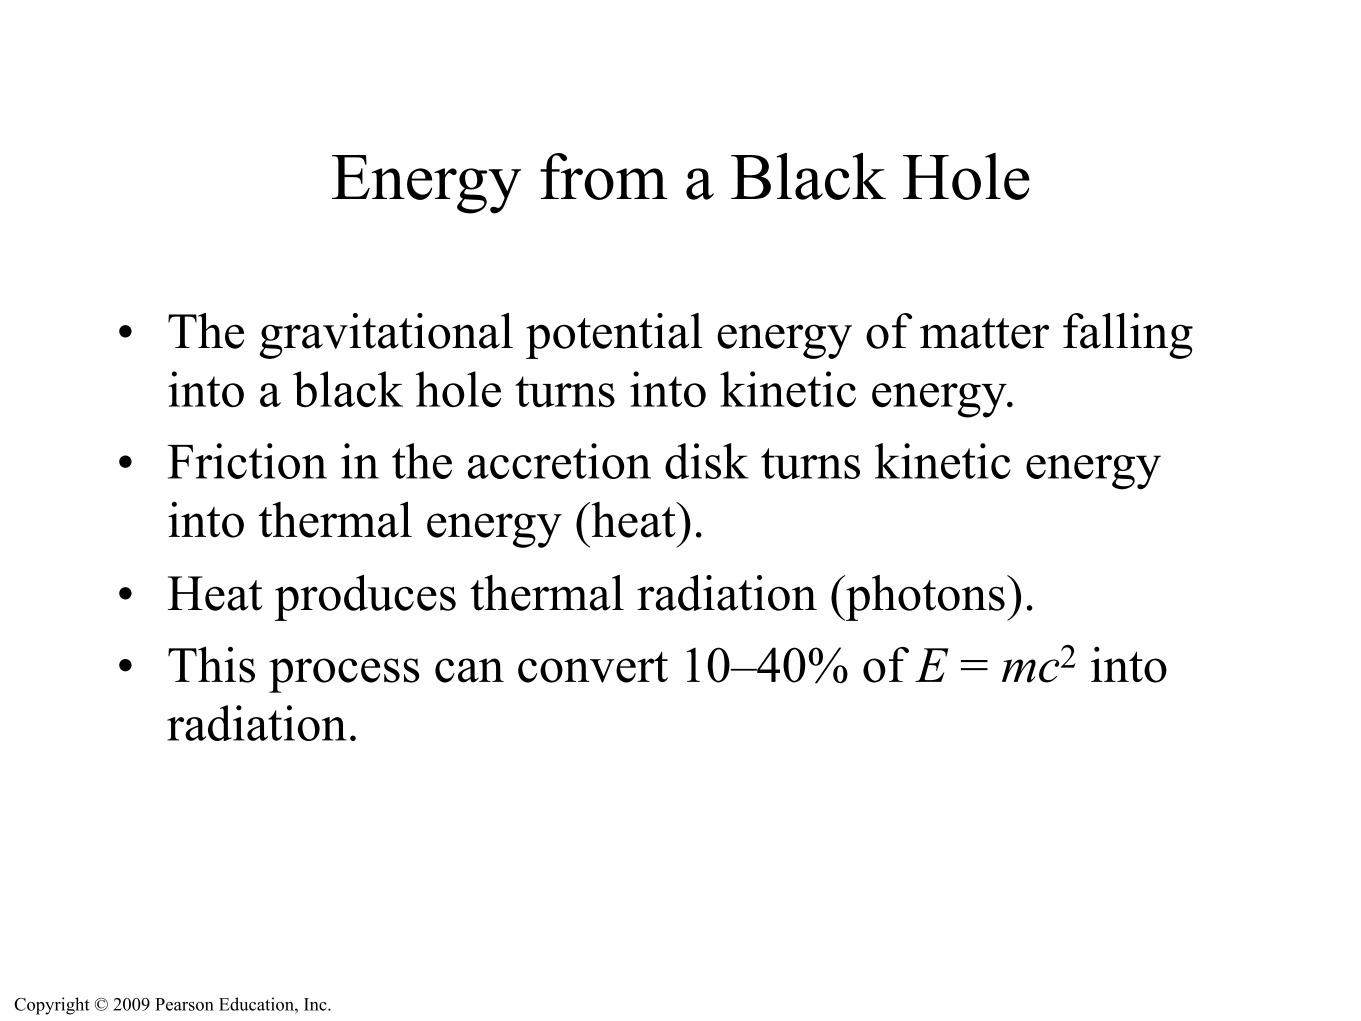
• The gravitational potential energy of matter falling into a black hole turns into kinetic energy.
• Friction in the accretion disk turns kinetic energy into thermal energy (heat).
• Heat produces thermal radiation (photons).• This process can convert 10–40% of E = mc2 into
radiation.
Energy from a Black Hole
Copyright © 2009 Pearson Education, Inc.
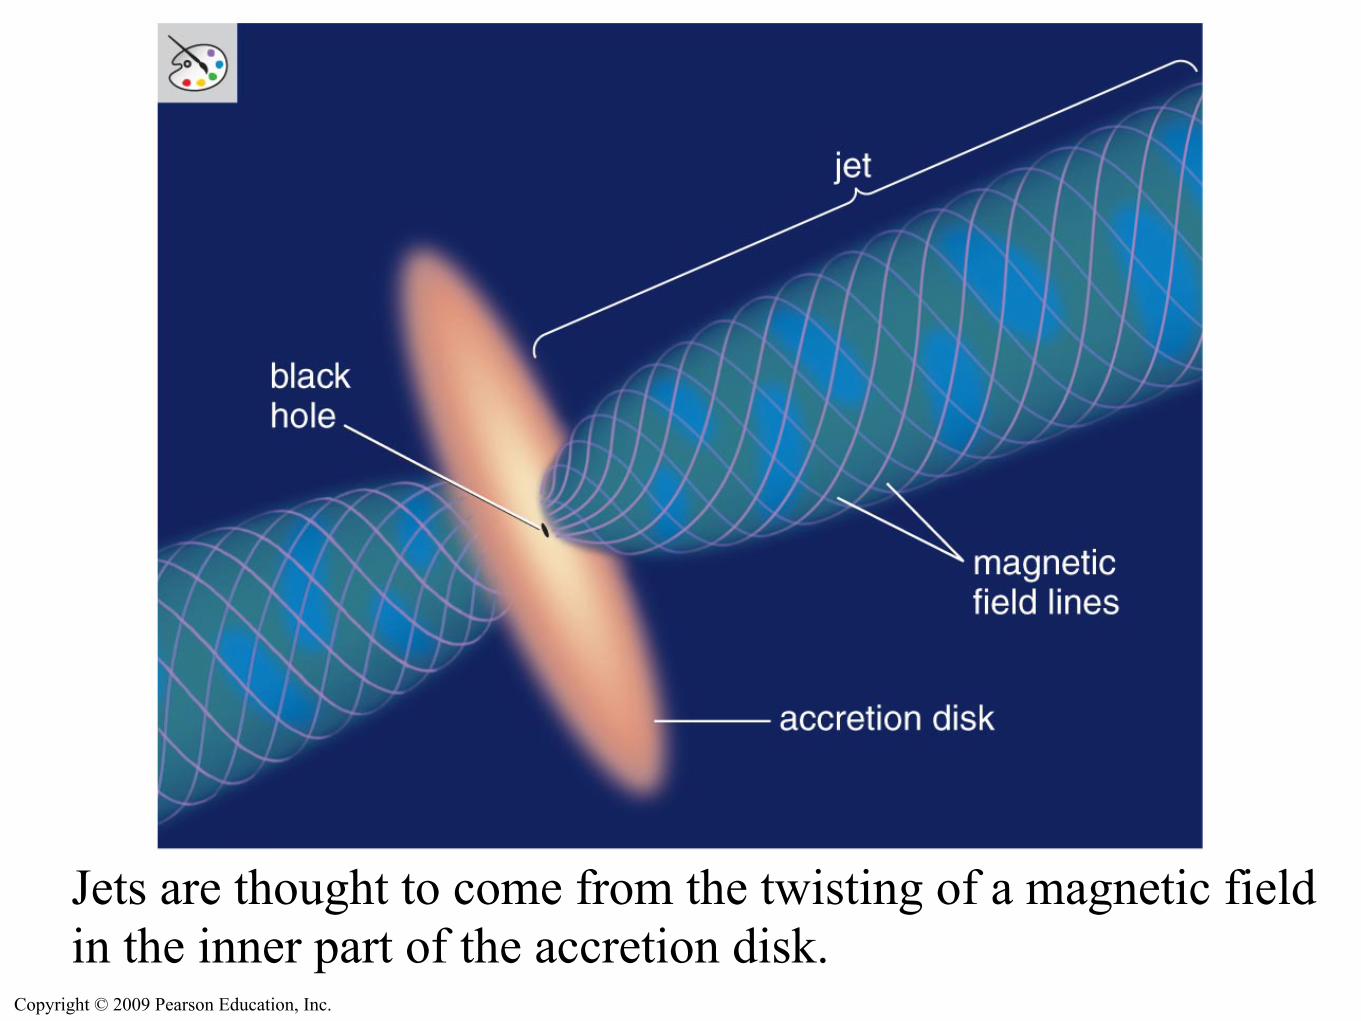
Jets are thought to come from the twisting of a magnetic field in the inner part of the accretion disk.

Copyright © 2009 Pearson Education, Inc.
Do supermassive black holes really exist?

Copyright © 2009 Pearson Education, Inc.
Orbital speed and distance of gas orbiting center of M87 indicate a black hole with mass of 3 billion MSun.

Copyright © 2009 Pearson Education, Inc.
Orbits of stars at center of Milky Way indicate a black hole with mass of 4 million MSun.
Copyright © 2009 Pearson Education, Inc.
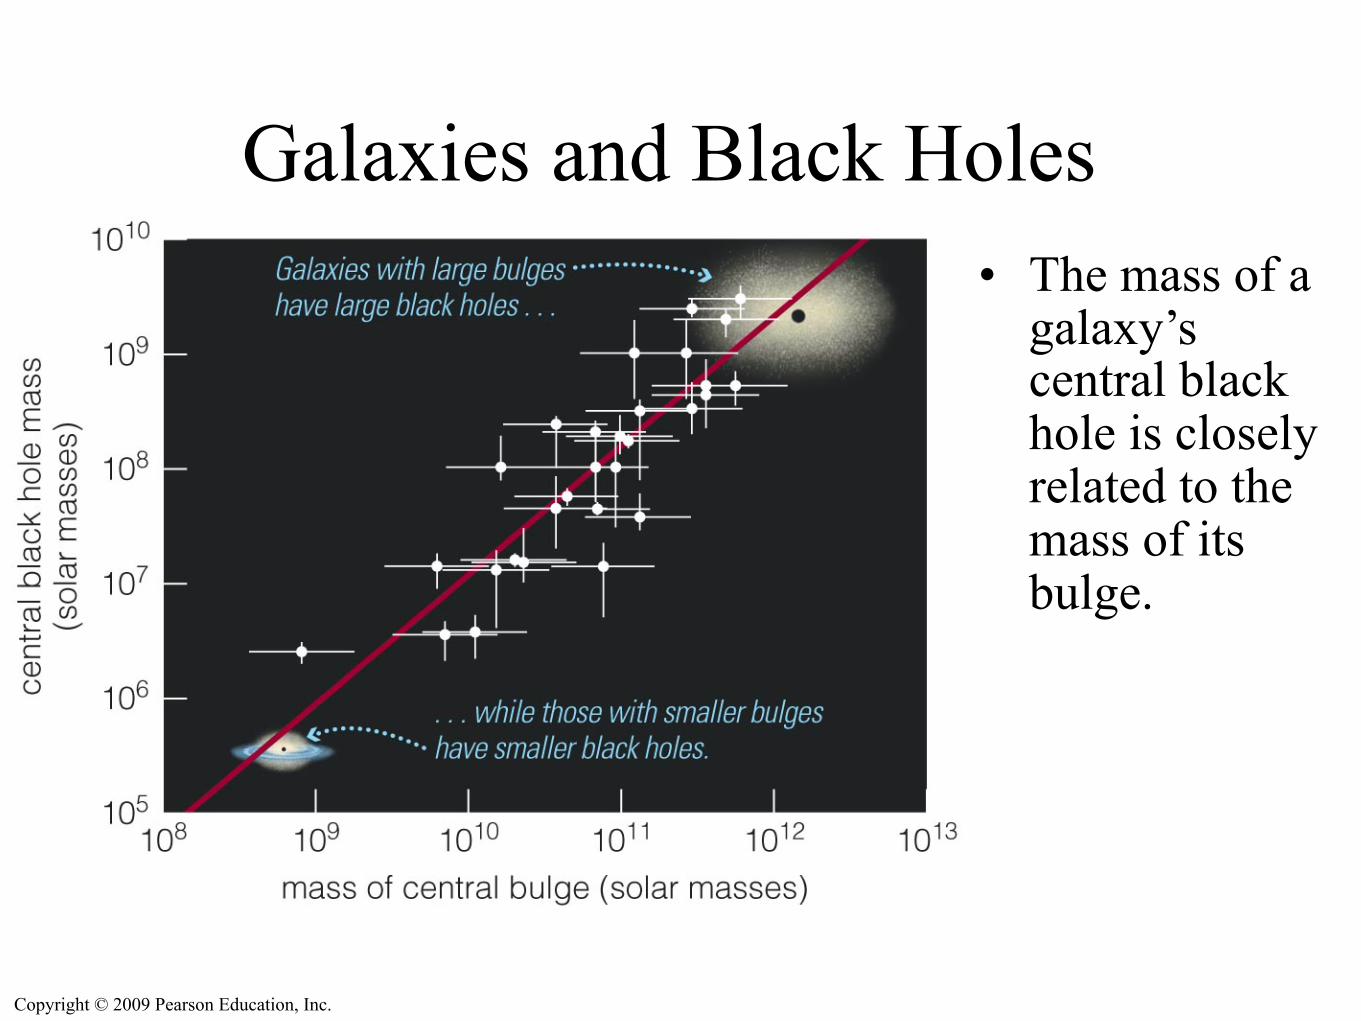
Galaxies and Black Holes• The mass of a
galaxy’s central black hole is closely related to the mass of its bulge.

Copyright © 2009 Pearson Education, Inc.
Galaxies and Black Holes• The
development of a central black hole must somehow be related to galaxy evolution.

Galaxy Mergers With Gas
Transformations of Galaxies II: Gas Only Transformations of Galaxies II: Final Encounter

Galaxy Collisions Awaken Dormant Black Holes
Mergers With Gas and Black Holes