Embed Size (px)
Citation preview

Tunnels in weak rock
Introduction
Tunnelling in weak rock presents some special challenges to the geotechnical engineer
since misjudgements in the design of support systems can lead to very costly failures. In
order to understand the issues involved in the process of designing support for this type
of tunnel it is necessary to examine some very basic concepts of how a rock mass
surrounding a tunnel deforms and how the support systems acts to control this
deformation. Once these basic concepts have been explored, examples of practical
support designs for different conditions will be considered.
Deformation around an advancing tunnel
Figure 1 shows the results of a three-dimensional finite element analysis of the
deformation of the rock mass surrounding a circular tunnel advancing through a weak
rock mass subjected to equal stresses in all directions. The plot shows displacement
vectors in the rock mass as well as the shape of the deformed tunnel profile. Figure 2
gives a graphical summary of the most important features of this analysis.
Deformation of the rock mass starts about one half a tunnel diameter ahead of the
advancing face and reaches its maximum value about one and one half diameters behind
the face. At the face position about one third of the total radial closure of the tunnel has
already occurred and the tunnel face deforms inwards as illustrated in Figures 1 and 2.
Whether or not these deformations induce stability problems in the tunnel depends upon
the ratio of rock mass strength to the in situ stress level, as will be demonstrated in the
following pages.
Note that it is assumed that the deformation process described occurs immediately upon
excavation of the face. This is a reasonable approximation for most tunnels in rock. The
effects of time dependent deformations upon the performance of the tunnel and the
design of the support system will be not be discussed in this chapter.
Tunnel deformation analysis
In order to explore the concepts of rock support interaction in a form which can readily
be understood, a very simple analytical model will be utilised. This model involves a
circular tunnel subjected to a hydrostatic stress field in which the horizontal and vertical
stresses are equal.
For the sake of simplicity this analysis is based on the Mohr-Coulomb failure criterion
which gives a very simple solution for the progressive failure of the rock mass
surrounding the tunnel.

Tunnels in weak rock
2
Figure 1: Vertical section through a three-dimensional
finite element model of the failure and deformation of the
rock mass surrounding the face of an advancing circular
tunnel. The plot shows displacement vectors as well as the
shape of the deformed tunnel profile.
Figure 2: Pattern of deformation in the rock mass surrounding an advancing tunnel.

Tunnels in weak rock
3
In this analysis it is assumed that the surrounding heavily jointed rock mass behaves as an
elastic-perfectly plastic material in which failure involving slip along intersecting
discontinuities is assumed to occur with zero plastic volume change (Duncan Fama,
1993). Support is modelled as an equivalent internal pressure and, although this is an
idealised model, it provides useful insights on how support operates.
Definition of failure criterion
It is assumed that the onset of plastic failure, for different values of the effective
confining stress '3σ , is defined by the Mohr-Coulomb criterion and expressed as:
'3
'1 σ+σ=σ kcm (1)
The uniaxial compressive strength of the rock mass σcm is defined by:
)sin1(
cos 2'
''
φ−
φ=σ
ccm (2)
and the slope k of the '1σ versus '
3σ line as:
)sin1(
)sin1('
'
φ−
φ+=k (3)
where '1σ is the axial stress at which failure occurs
'3σ is the confining stress
c' is the cohesive strength and
φ' is the angle of friction of the rock mass
Analysis of tunnel behaviour
Assume that a circular tunnel of radius ro is subjected to hydrostatic stresses po and a
uniform internal support pressure pi as illustrated in Figure 3. Failure of the rock mass
surrounding the tunnel occurs when the internal pressure provided by the tunnel lining is
less than a critical support pressure pcr , which is defined by:
k
pp cmo
cr+
σ−=
1
2 (4)

Tunnels in weak rock
4
Figure 3: Plastic zone surrounding a circular tunnel.
If the internal support pressure pi is greater than the critical support pressure pcr, no
failure occurs, the behaviour of the rock mass surrounding the tunnel is elastic and the
inward radial elastic displacement of the tunnel wall is given by:
)()1(
iom
oie pp
E
ru −
ν+= (5)
where Em is the Young's modulus or deformation modulus and
ν is the Poisson's ratio. When the internal support pressure pi is less than the critical support pressure pcr, failure
occurs and the radius rp of the plastic zone around the tunnel is given by:
)1(
1
))1)((1(
))1((2 −
σ+−+
σ+−=
k
cmi
cmoop
pkk
kprr (6)
For plastic failure, the total inward radial displacement of the walls of the tunnel is:
−ν−−
−ν−
ν+= ))(21())(1(2
)1(2
ioo
pcro
oip pp
r
rpp
E
ru (7)
A spreadsheet for the determination of the strength and deformation
characteristics of the rock mass and the behaviour of the rock mass surrounding
the tunnel is given in Figure 4.

Tunnels in weak rock
5
Input: sigci = 10 MPa mi = 10 GSI = 25
mu = 0.30 ro = 3.0 m po = 2.0 Mpa
pi = 0.0 MPa pi/po = 0.00
Output: mb = 0.69 s = 0.0000 a = 0.525
k = 2.44 phi = 24.72 degrees coh = 0.22 MPa
sigcm = 0.69 MPa E = 749.9 MPa pcr = 0.96 MPa
rp = 6.43 m ui = 0.0306 m ui= 30.5957 mm
sigcm/po 0.3468 rp/ro = 2.14 ui/ro = 0.0102
Calculation:
Sums
sig3 1E-10 0.36 0.71 1.1 1.43 1.79 2.14 2.50 10.00
sig1 0.00 1.78 2.77 3.61 4.38 5.11 5.80 6.46 29.92
sig3sig1 0.00 0.64 1.98 3.87 6.26 9.12 12.43 16.16 50
sig3sq 0.00 0.13 0.51 1.15 2.04 3.19 4.59 6.25 18
Cell formulae:
mb = mi*EXP((GSI-100)/28)
s = IF(GSI>25,EXP((GSI-100)/9),0)
a = IF(GSI>25,0.5,0.65-GSI/200)
sig3 = Start at 1E-10 (to avoid zero errors) and increment in 7 steps of sigci/28 to 0.25*sigci
sig1 = sig3+sigci*(((mb*sig3)/sigci)+s)^a
k = (sumsig3sig1 - (sumsig3*sumsig1)/8)/(sumsig3sq-(sumsig3^2)/8)
phi = ASIN((k-1)/(k+1))*180/PI()
coh = (sigcm*(1-SIN(phi*PI()/180)))/(2*COS(phi*PI()/180))
sigcm = sumsig1/8 - k*sumsig3/8
E = IF(sigci>100,1000*10^((GSI-10)/40),SQRT(sigci/100)*1000*10^((GSI-10)/40))
pcr = (2*po-sigcm)/(k+1)
rp = IF(pi<pcr,ro*(2*(po*(k-1)+sigcm)/((1+k)*((k-1)*pi+sigcm)))^(1/(k-1)),ro)
ui = IF(rp>ro,ro*((1+mu)/E)*(2*(1-mu)*(po-pcr)*((rp/ro)^2)-(1-2*mu)*(po-pi)),ro*(1+mu)*(po-pi)/E)
Figure 4: Spreadsheet for the calculation of rock mass characteristics and the behaviour of the
rock mass surrounding a circular tunnel in a hydrostatic stress field.
A more elaborate analysis of the same problem, using the the Hoek-Brown failure
criterion, has been published by Carranza-Torres and Fairhurst (1999) and Carranza-
Torres (2004). The details of these analyses are beyond the scope of this discussion but
the results have been incorporated into a program called RocSupport1 and are used in the
following discussion.
Dimensionless plots of tunnel deformation
A useful means of studying general behavioural trends is to create dimensionless plots
from the results of parametric studies. One such dimensionless plot is presented in Figure
5. This plot was constructed from the results of a Monte Carlo analysis in which the input
parameters for rock mass strength and tunnel deformation were varied at random in 2000
iterations. It is remarkable that, in spite of the very wide range of conditions included in
these analyses, the results follow a very similar trend and that it is possible to fit curves
which give a very good indication of the average trend.
1 Available from www.rocscience.com

Tunnels in weak rock
6
0.0 0.1 0.2 0.3 0.4 0.5 0.6 0.7 0.8 0.9 1.0
0
5
10
15
20
25
30P
erc
en
t str
ain
ε =
(tu
nn
el clo
su
re / tu
nn
el d
iam
ete
r) x
10
0
Rock mass strength σcm
/ in situ stress po
Carranza-Torres and Fairhurst solution
Duncan Fama solution
ε = 0.2 (σcm
/ po)-2
2
3
4
5
6
Figure 5: Tunnel deformation versus ratio of rock mass strength to in situ stress based on
a Monte-Carlo analysis which included a wide range of input parameters 2.
Figure 5 is a plot of the ratio of tunnel wall displacement to tunnel radius against the ratio
of rock mass strength to in situ stress. Once the rock mass strength falls below 20% of the
in situ stress level, deformations increase substantially and, unless these deformations are
controlled, collapse of the tunnel is likely to occur.
Based on field observations and measurements, Sakurai (1983) suggested that tunnel
strain levels in excess of approximately 1% are associated with the onset of tunnel
2 Using the program @RISK in conjunction with a Microsoft Excel spreadsheet for estimating rock mass
strength and tunnel behaviour (equations 4 to 7). Uniform distributions were sampled for the following
input parameters, the two figures in brackets define the minimum and maximum values used: Intact rock
strength σci (1,30 MPa), Hoek-Brown constant mi (5,12), Geological Strength Index GSI (10,35), In situ
stress (2, 20 MPa), Tunnel radius (2, 8 m).

Tunnels in weak rock
7
instability and with difficulties in providing adequate support. Field observations by
Chern et al (1998), plotted in Figure 6, confirm Sakurai’s proposal.
Note that some tunnels which suffered strains as high as 5% did not exhibit stability
problems. All the tunnels marked as having stability problems were successfully
completed but the construction problems increased significantly with increasing strain
levels. Hence, the 1% limit proposed by Sakurai is only an indication of increasing
difficulty and it should not be assumed that sufficient support should be installed to limit
the tunnel strain to 1%. In fact, in some cases, it is desirable to allow the tunnel to
undergo strains of as much as 5% before activating the support.
Figure 6: Field observations by Chern et al (1998) from the Second Freeway, Pinglin and
New Tienlun headrace tunnels in Taiwan.
Figures 5 is for the condition of zero support pressure (pi = 0). Similar analyses were run
for a range of support pressures versus in situ stress ratios (pi/po) and a statistical curve
fitting process was used to determine the best fit curves for the generated data for each
pi/po value. The resulting curve for tunnel displacement for different support pressures is
given in Figure 7.

Tunnels in weak rock
8
Figure 7: Ratio of tunnel deformation to tunnel radius versus the
ratio of rock mass strength to in situ stress for different support
pressures.
The series of curves shown in Figures 7 are defined by the equation:
−
−=×=
24.2
25.02.0100% o
i
p
p
o
cm
o
i
pp
p
ro
ui σε (8)
where rp = Plastic zone radius
ui = Tunnel sidewall deformation
ro = Original tunnel radius in metres
pi = Internal support pressure
po = In situ stress = depth below surface × unit weight of rock mass
σcm= Rock mass strength = )sin1/(cos2 ''' φ−φc
Tunnels in weak rock
9
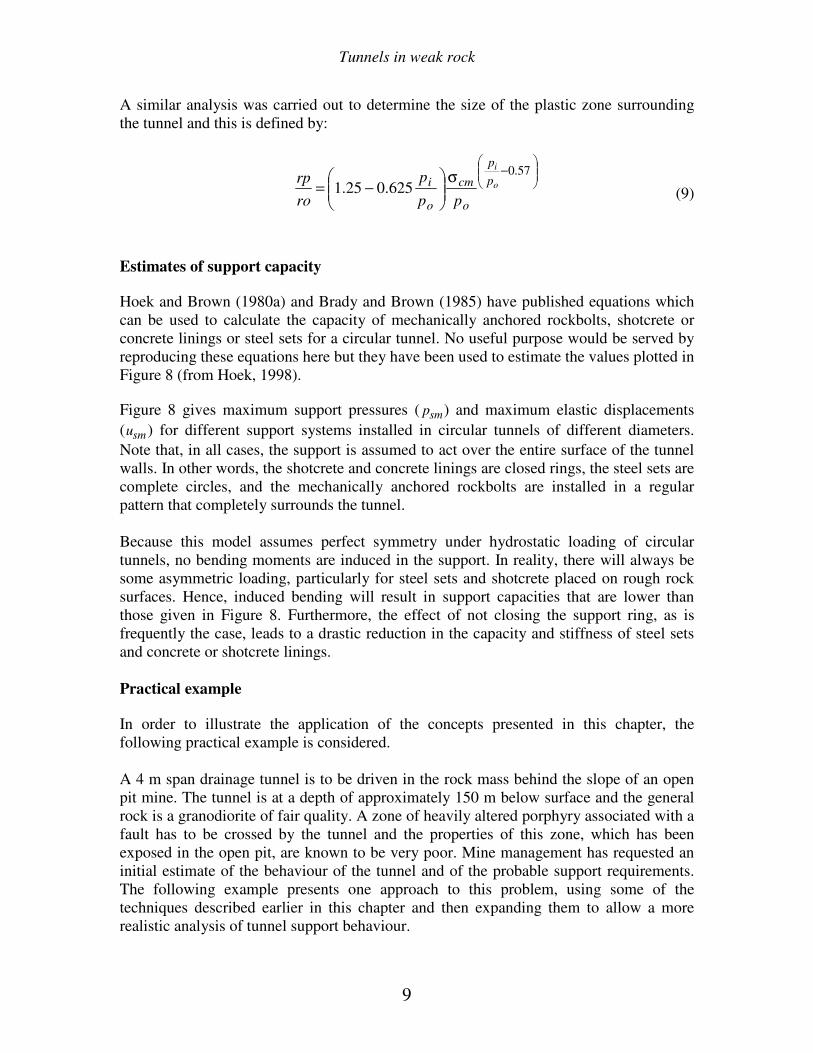
A similar analysis was carried out to determine the size of the plastic zone surrounding
the tunnel and this is defined by:
−
σ
−=
57.0
625.025.1 o
i
p
p
o
cm
o
i
pp
p
ro
rp (9)
Estimates of support capacity
Hoek and Brown (1980a) and Brady and Brown (1985) have published equations which
can be used to calculate the capacity of mechanically anchored rockbolts, shotcrete or
concrete linings or steel sets for a circular tunnel. No useful purpose would be served by
reproducing these equations here but they have been used to estimate the values plotted in
Figure 8 (from Hoek, 1998).
Figure 8 gives maximum support pressures ( psm) and maximum elastic displacements
(usm) for different support systems installed in circular tunnels of different diameters.
Note that, in all cases, the support is assumed to act over the entire surface of the tunnel
walls. In other words, the shotcrete and concrete linings are closed rings, the steel sets are
complete circles, and the mechanically anchored rockbolts are installed in a regular
pattern that completely surrounds the tunnel.
Because this model assumes perfect symmetry under hydrostatic loading of circular
tunnels, no bending moments are induced in the support. In reality, there will always be
some asymmetric loading, particularly for steel sets and shotcrete placed on rough rock
surfaces. Hence, induced bending will result in support capacities that are lower than
those given in Figure 8. Furthermore, the effect of not closing the support ring, as is
frequently the case, leads to a drastic reduction in the capacity and stiffness of steel sets
and concrete or shotcrete linings.
Practical example
In order to illustrate the application of the concepts presented in this chapter, the
following practical example is considered.
A 4 m span drainage tunnel is to be driven in the rock mass behind the slope of an open
pit mine. The tunnel is at a depth of approximately 150 m below surface and the general
rock is a granodiorite of fair quality. A zone of heavily altered porphyry associated with a
fault has to be crossed by the tunnel and the properties of this zone, which has been
exposed in the open pit, are known to be very poor. Mine management has requested an
initial estimate of the behaviour of the tunnel and of the probable support requirements.
The following example presents one approach to this problem, using some of the
techniques described earlier in this chapter and then expanding them to allow a more
realistic analysis of tunnel support behaviour.

Tunnels in weak rock
10
Support type
Fla
nge
wid
th -
mm
S
ectio
n d
epth
- m
m
Weig
ht – k
g/m
Curv
e n
um
be
r
Maximum support
pressure pimax (MPa) for a
tunnel of diameter D (metres) and a set spacing of s (metres)
Wide flange rib
305
203
150
305
203
150
97
67
32
1 2 3
sDpi23.1
max 9.19 −=
sDpi3.1
max 2.13 −=
sDpi4.1
max 0.7 −=
I section rib
203
152
254
203
82
52
4 5
sDpi29.1
max 6.17 −=
sDpi33.1
max 1.11 −=
TH section rib
171
124
138
108
38
21
6
7
sDpi24.1
max 5.15 −=
sDpi27.1
max 8.8 −=
3 bar lattice girder
220
140
190
130
19
18
8
sDpi03.1
max 6.8 −=
4 bar lattice girder
220
140
280
200
29
26
9
sDpi02.1
max 3.18 −=
Rockbolts or cables spaced on a grid of s x s metres
34 mm rockbolt 25 mm rockbolt 19 mm rockbolt 17 mm rockbolt SS39 Split set EXX Swellex 20mm rebar 22mm fibreglass Plain cable Birdcage cable
10
11
12
13
14
15
16
17
18
19
2
max 354.0 spi =
2max 267.0 spi =
2max 184.0 spi =
2max 10.0 spi =
2max 05.0 spi =
2max 11.0 spi =
2max 17.0 spi =
2max 26.0 spi =
2max 15.0 spi =
2max 30.0 spi =
Support type
Thic
kness -
mm
Age -
days
UC
S -
MP
a
Curv
e n
um
be
r
Maximum support
pressure pimax (MPa) for a
tunnel of diameter D (metres)
Concrete or shotcrete
lining
1m
300
150
100
50
50
50
28
28
28
28
28 3
0.5
35
35
35
35
35
11 6
20
21
22
23
24
25
26
92.0
max 8.57 −= Dpi
92.0max 1.19 −= Dpi
97.0max 6.10 −= Dpi
98.0max 3.7 −= Dpi
99.0max 8.3 −= Dpi
97.0max 1.1 −= Dpi
0.1max 6.0 −= Dpi
Tunnel diameter D - metres
0.01
0.05
0.10
0.50
1.00
2.00
5.00
10.00
Maxim
um
sup
port
pre
ssu
re p
-
MP
a
2 3 4 5 6 7 8 9 10 15 20
2
3
5
6
78
9
14
15
Wid
e fla
nge
ste
el ri
bs
TH
sectio
n s
teel ri
bs
La
ttic
e g
irde
rs
Ancho
red r
ockb
olts
Sp
lit s
ets
and
Sw
elle
x
Gro
ute
d b
olts a
nd
cable
s
Co
ncre
te a
nd s
hotc
rete
lin
ing
s
ima
x
s
ectio
n s
teel ri
bs
I
1
4
10
11
12
13
16'
17
18
19
20
21
22
23
24
25
26
Figure 8: Approximate maximum capacities for different
support systems installed in circular tunnels. Note that
steel sets and rockbolts are all spaced at 1 m.

Tunnels in weak rock
11
Estimate of rock mass properties
Figures 5 and 7 show that a crude estimate of the behaviour of the tunnel can be made if
the ratio of rock mass strength to in situ stress is available. For the purpose of this
analysis the in situ stress is estimated from the depth below surface and the unit weight of
the rock. For a depth of 150 m and a unit weight of 0.027 MN/m3, the vertical in situ
stress is approximately 4 MPa. The fault material is considered incapable of sustaining
high differential stress levels and it is assumed that the horizontal and vertical stresses are
equal within the fault zone.
In the case of the granodiorite, the laboratory uniaxial compressive strength is
approximately 100 MPa. However, for the fault material, specimens can easily be broken
by hand as shown in Figure 11. The laboratory uniaxial compressive strength of this
material is estimated at approximately 10 MPa.
Based upon observations in the open pit mine slopes and utilizing the procedures
described in the chapter on “Rock mass properties”, the granodiorite is estimated to have
a GSI value of approximately 55. The fault zone, shown in Figure 9, has been assigned
GSI = 15.
Figure 9: Heavily altered porphyry can easily be broken by hand.

Tunnels in weak rock
12
The program RocLab3 implements the methodology described in the chapter on “Rock
mass properties” and, in particular, the equations given in the 2002 version of the Hoek-
Brown failure criterion (Hoek et al, 2002). This program has been used to calculate the
global rock mass strength σcm for the granodiorite and the fault zone and the results are
presented below:
Material σci - MPa GSI mi σcm σcm/po
Granodiotite 100 55 30 33 8.25
Fault 10 15 8 0.6 0.15
Support requirements
Figures 5 and 6 show that, for the granodiorite with a ratio of rock mass strength to in situ
stress of 8.25, the size of the plastic zone and the induced deformations will be negligible.
This conclusion is confirmed by the appearance of an old drainage tunnel that has stood
for several decades without any form of support. Based upon this evaluation, it was
decided that no permanent support was required for the tunnel in the fair quality
granodiorite. Spot bolts and shotcrete were installed for safety where the rock mass was
more heavily jointed. The final appearance of the tunnel in granodiorite is shown in
Figure 10.
Figure 10: Appearance of the drainage tunnel in fair quality granodiorite in which no
permanent support was required. Spot bolts and shotcrete were installed for safety in
jointed areas. The concrete lined drainage channel is shown in the centre of the tunnel
floor.
3 This program can be downloaded (free) from www.rocscience.com.

Tunnels in weak rock
13
In the case of the altered porphyry and fault material, the ratio of rock mass strength to in
situ stress is 0.15. From Equation 9 the radius of plastic zone for a 2 m radius tunnel in
this material is approximately 7.4 m without support. The tunnel wall deformation is
approximately 0.18 m which translates into a tunnel strain of (0.18/2)*100 = 9%.
Based on the observations by Sakurai (1983) and Chern et al (1998), the predicted strain
of 9% for the mine drainage tunnel discussed earlier is clearly unacceptable and
substantial support is required in order to prevent convergence and possible collapse of
this section. Since this is a drainage tunnel, the final size is not a major issue and a
significant amount of closure can be tolerated.
An approach that is frequently attempted in such cases is to install sufficient support
behind the face of the tunnel to limit the strain to an acceptable level. Assuming a
practical limit of 2% strain (from Figure 6), equation 8 and Figure 7 show that, for σcm/po
= 0.15, an internal support pressure of approximately pi/po = 0.25 is required to support
the tunnel. For po = 4 MPa this means a support pressure pi = 1 MPa.
Figure 8 shows that, for a 4 m diameter tunnel, a support in excess of 1 MPa can only be
provided by a passive system of steel, sets, lattice girders, shotcrete or concrete lining or
by some combination of these systems. These systems have to be installed in a fully
closed ring (generally in a circular tunnel) in order to act as a load bearing structure.
Rockbolts or cables, even assuming that they could be anchored in the fault material,
cannot provide this level of equivalent support.
There are several problems associated with the installation of heavy passive support in
this particular tunnel. These are:
1. The remainder of the drainage tunnel is horseshoe shaped as shown in Figure 10.
Changing the section to circular for a relative short section of fault zone is not a
very attractive proposition because of the limitations this would impose on
transportation of equipment and materials through the zone.
2. The use of heavy steel sets creates practical problems in terms of bending the sets
into the appropriate shape. A practical rule of thumb is that an H or I section can
only be bent to a radius of about 14 times the depth of the section. Figure 11
which shows a heavy H section set being bent and there is significant buckling of
the inside flange of the set.
3. The use of shotcrete or concrete lining is limited by the fact that it takes time for
these materials to harden and to achieve the required strength required to provide
adequate support. The use of accelerators or of thick linings can partially
overcome these problems but may introduce another set of practical problems.
The practical solution adopted in the actual case upon which this example is based was to
use sliding joint top hat section sets. These sets, as delivered to site, are shown in Figure
12 which illustrates how the sections fit into each other. The assembly of these sets to
form a sliding joint is illustrated in Figure 14 and the installation of the sets in the tunnel
is illustrated in Figure 15.

Tunnels in weak rock
14
Figure 12: Buckling of an H section
steel set being bent to a small radius.
Temporary stiffeners have been tack
welded into the section to minimise
buckling but a considerable amount of
work is required to straighten the
flanges after these stiffeners have been
removed.
Figure 13 Top hat section steel sets
delivered to site ready to be
transported underground.
Tunnels in weak rock
15
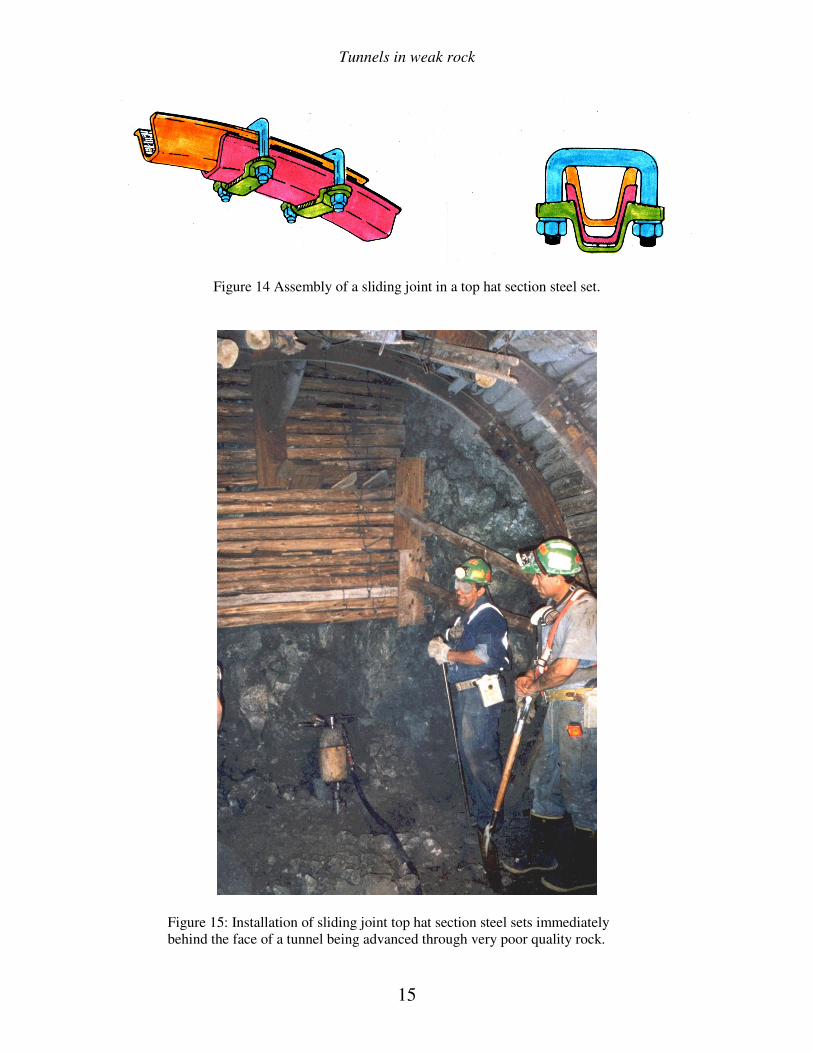
Figure 14 Assembly of a sliding joint in a top hat section steel set.
Figure 15: Installation of sliding joint top hat section steel sets immediately
behind the face of a tunnel being advanced through very poor quality rock.

Tunnels in weak rock
16
The sets are installed immediately behind the advancing face which, in a rock mass such
as that considered here, is usually excavated by hand. The clamps holding the joints are
tightened to control the frictional force in the joints which slide progressively as the face
is advanced and the rock load is applied to the sets.
The use of sliding joints in steel sets allows very much lighter section sets to be used than
would be the case for sets with rigid joints. These sets provide immediate protection for
the workers behind the face but they permit significant deformation of the tunnel to take
place as the face is advanced. In most cases, a positive stop is welded onto the sets so
that, after a pre-determined amount of deformation has occurred, the joint locks and the
set becomes rigid. A trial and error process has to be used to find the amount of
deformation that can be permitted before the set locks. Too little deformation will result
in obvious buckling of the set while too much deformation will result in loosening of the
surrounding rock mass.
In the case of the tunnel illustrated in Figure 15, lagging behind the sets consists of
wooden poles of about 100 mm diameter. A variety of materials can be used for lagging
but wood, in the form of planks or poles, is still the most common material used in
mining. In addition to the lagging, a timber mat has been propped against the face to
improve the stability of the face. This is an important practical precaution since instability
of the tunnel face can result in progressive ravelling ahead of the steel sets and, in some
cases, collapse of the tunnel.
The way in which sliding joints work is illustrated diagrammatically in Figure 16.
Figure 16: Delay in the activation of passive support by the use of sliding joints.

Tunnels in weak rock
17
Figure 16 shows that passive support in the form of steel sets, lattice girders, shotcrete or
concrete linings can fail if installed too close to the face. This is because the support
pressure required to achieve stability is larger than the capacity of the support system. As
the displacements in the tunnel increase as the face moves away from the section under
consideration, the support pressure required to achieve equilibrium decreases as
illustrated by the curve in Figure 16. Hence, delaying the activation of the support system
can stabilize the tunnel at support pressures within the capacity of the support.
This can be achieved by delaying the installation of the support system but this can be
very dangerous since workers at the face have to work in an unsupported tunnel.
Introducing “yielding elements” into the support system can overcome this problem since
the activation of the support is delayed but the support system is in place to catch
runaway stability if this should occur.
Many systems have been used to introduce these yielding elements into tunnels with
squeezing problems. An example is the use of sliding joints in steel sets as shown in
Figure 16. Another system is to use “stress controllers” in which controlled buckling of
an inner steel tube provides the yielding required and the system locks and becomes more
rigid when a pre-determined deformation has occurred. This system, developed by
Professor Wulf Schubert (Schubert, 1996) at the University of Graz in Austria, is
illustrated in Figures 17 and 18.
Figure 17: A row of stress controllers installed in a slot in the
shotcrete lining in a tunnel
Figure 18: Section
through a stress
controller showing the
buckling inner tube.
After Schubert, 1996.

Tunnels in weak rock
18
As an alternative to supporting the face, as illustrated in Figure 15, spiles or forepoles can
be used to create an umbrella of reinforced rock ahead of the advancing face. Figure 19
illustrate the general principles of the technique. In the example illustrated, spiling is
being used to advance a 7 m span, 3 m high tunnel top heading through a clay-rich fault
zone material in a tunnel in India. The spiles, consisting of 25 mm steel bars, were driven
in by means of a heavy sledgehammer.
Figure 19: Spiling in very poor quality clay-rich fault zone material.
Figure 20 shows a more elaborate system used in large span tunnels in poor quality rock
masses. This system relies on grouted fiberglass dowels, which can be cut relatively
easily, to stabilize the face ahead of the tunnel and grouted forepoles to provide a
protective umbrella over the face. These forepoles consist of 75 to 140 mm diameter steel
pipes through which grout is injected. In order for the forepoles to work effectively the
rock mass should behave in a frictional manner so that arches or bridges can form
between individual forepoles. The technique is not very effective in fault gouge material
containing a siginifcant proportion of clay unless the forepole spacing is very close. The
forepoles are installed by means of a special drilling machine as illustrated in Figure 21.
While these forepole umbrella systems can add significantly to the cost of driving tunnels
and can also result in very slow advance rates, they have been used very successfully in
driving many transportation tunnels in Europe (Carrieri et al, 1991).

Tunnels in weak rock
19
1 Forepoles – typically 75 or 114 mm diameter pipes, 12 m long installed every 8 m to create a 4 m overlap between successive forepole umbrellas.
2 Shotcrete – applied immediately behind the face and to the face, in cases where face stability is a problem. Typically, this initial coat is 25 to 50 mm thick.
3 Grouted fiberglass dowels – Installed midway between forepole umbrella installation steps to reinforce the rock immediately ahead of the face. These dowels are usually 6 to 12 m long and are spaced on a 1 m x 1 m grid.
4 Steel sets – installed as close to the face as possible and designed to support the forepole umbrella and the stresses acting on the tunnel.
5 Invert struts – installed to control floor heave and to provide a footing for the steel sets.
6 Shotcrete – typically steel fibre reinforced shotcrete applied as soon as possible to embed the steel sets to improve their lateral stability and also to create a structural lining.
7 Rockbolts as required. In very poor quality ground it may be necessary to use self-drilling rockbolts in which a disposable bit is used and is grouted into place with the bolt.
8 Invert lining – either shotcrete or concrete can be used, depending upon the end use of the tunnel.
Figure 20: Full face 10 m span tunnel excavation through weak rock under the protection
of a forepole umbrella. The final concrete lining is not included in this figure.

Tunnels in weak rock
20
Figure 21: Installation of 12 m long 75 mm diameter pipe forepoles in an 11 m span
tunnel top heading in a fault zone.
References
Brady, B.H.G. and Brown, E.T. 1985. Rock mechanics for underground mining. London:
Allen and Unwin.
Carranza-Torres, C. and Fairhurst, C. 1999. The elasto-plastic response of underground
excavations in rock masses that satisfy the Hoek-Brown failure criterion. Int. J.
Rock Mech. Min. Sci. 36(6), 777–809.
Carranza-Torres, C. 2004. Elasto-plastic solution of tunnel problems using the
generalized form of the Hoek-Brown failure criterion. In proc. ISRM
SINOROCK2004 symposium China, (Eds. J.A. Hudson and F. Xia-Ting). Int. J.
Rock Mech. Min. Sci. 41(3), 480–481.
Carranza-Torres, C. 2004. Some Comments on the Application of the Hoek-Brown
Failure Criterion for Intact Rock and Rock Masses to the Solution of Tunnel and
Slope Problems. In MIR 2004 – X conference on rock and engineering mechanic,
Torino, (eds. G. Barla and M. Barla). Chapter 10, 285–326. Pàtron Editore.
Bologna: Pàtron Editore.

Tunnels in weak rock
21
Chern, J.C., Yu, C.W., and Shiao, F.Y. 1998. Tunnelling in squeezing ground and
support estimation. Proc. reg. symp. sedimentary rock engineering, Taipei, 192-
202.
Duncan Fama, M.E. 1993. Numerical modelling of yield zones in weak rocks. In
Comprehensive rock engineering, ( ed. J.A. Hudson) 2, 49-75. Oxford: Pergamon.
Hoek, E., and Brown, E.T. 1980. Underground excavations in rock. London: Instn Min.
Metall.
Hoek, E. and Brown, E.T. 1997. Practical estimates or rock mass strength. Int. J. Rock
Mech. & Mining Sci. & Geomech. Abstrs. 34(8), 1165-1186.
Hoek, E. 1998. Tunnel support in weak rock, Keynote address, Symp. On sedimentary
rock engineering, Taipei, Taiwan, 20-22.
Hoek E, Carranza-Torres CT, Corkum B. Hoek-Brown failure criterion-2002 edition.
2002. In Proceedings of the Fifth North American Rock Mechanics Symp.,
Toronto, Canada, 1: 267–73.
Carrieri, G., Grasso, P., Mahtab, A. and Pelizza, S. 1991. Ten years of experience in the
use of umbrella-arch for tunnelling. Proc. SIG Conf. On Soil and Rock
Improvement, Milano 1, 99-111.
Sakurai, S. 1983. “Displacement measurements associated with the design of
underground openings.” Proc. Int. Symp. Field Measurements in Geomechanics,
Zurich, 2, 1163-1178.
Schubert, W. 1996. Dealing with squeezing conditions in Alpine tunnels.” Rock Mech.
Rock Engng. 29(3), 145-153.