Embed Size (px)
Citation preview

DOCUMENT RESUME
ED 408 708 EA 028 451
AUTHOR Whitener, Summer D.; And OthersTITLE Characteristics of Stayers, Movers, and Leavers: Results
from the Teacher Followup Survey: 1994-95. Schools andStaffing Survey. E.D. Tabs.
INSTITUTION National Center for Education Statistics (ED), Washington,DC.; Pinkerton Computer Consultants, Inc., BaileysCrossroads, Va.; Bureau of the Census (DOC), Suitland, Md.
REPORT NO NCES-97-450; ISBN-0-16-049079-0PUB DATE May 97NOTE 132p.
AVAILABLE FROM U.S. Government Printing Office, Superintendent ofDocuments, Mail Stop: SSOP, Washington, DC 20402-9328. (For
free single copies, call National Data Resource Center:703/845-3151, phone; 703-820-7465, FAX).
PUB TYPE Numerical/Quantitative Data (110) Tests/Questionnaires(160)
EDRS PRICE MF01/PC06 Plus Postage.DESCRIPTORS Career Change; Elementary Secondary Education; *Faculty
Mobility; *Labor Turnover; Occupational Surveys; PrivateSchools; Public Schools; Retirement; *Teacher Persistence;*Teacher Transfer; Teaching (Occupation)
ABSTRACTThe TFS (Teacher. Fc71,kAii, Survey is a survey of elementary
and secondary school teachers who participated in the Schools and StaffingSurvey (SASS) Teacher Questionnaire and is conducted in the school yearfollowing the SASS data collection. The sample for the 1994-95 TFS wasselected from the 7,200 teachers who participated in the 1993-94 SASS; itconsisted of all who left teaching within the year after SASS wasadministered and a subsample of those who continued teaching. The TFS soughtto provide estimates of teacher attrition rates; examine the characteristicsof those who stay in the teaching profession and those who leave; obtain dataon occupations or other activities for those who leave teaching and careerinformation for those who are still teaching; update information oneducation, other training, and career plans; and collect data on attitudesabout the teaching profession and job satisfaction. Some highlights follow:The attrition rate from the teaching profession between 1993-94 and 1994-95was 6.6 percent in public schools and 11.9 percent in private schools.Teacher attrition varied by teacher's age. The two main reasons cited bypublic school teachers for leaving the teaching profession were retirementand pregnancy/child rearing; private school teachers reported that they leftto pursue another career or because of a family or personal move. Nineteentables are ihcluded. Appendices contain 15 standard error tables, copies ofthe Teacher Followup Surveys (for former and for current teachers), and alist of SASS and TFS data products. (LMI)
********************************************************************************Reproductions supplied by EDRS are the best that can be made
from the original document.********************************************************************************

NATIONAL CENTER FOR EDUCATION STATISTICS
E.D. Tabs May 1997
c)°")
Schools and Staffing Survey00
Characteristics of Stayers,Movers, and Leavers:Results from the TeacherFollowup Survey: 1994-95
U.S. DEPARTMENT OF EDUCATIONOtte of Educational Researcn ana Imarovement
ED CATIONAL RESOURCES INFORMATIONCENTER (ERIC)
This document has been reproduced asreceived from the person or organizationoriginating it.
Minor changes have been made toimprove reproduction quality.
Points of view or opinions stated in thisdocument do not necessarily representofficial OERI position or policy.
U.S. Department of EducationOffice of Educational Research and Improvement
2
NCES 97-450

NATIONAL CENTER FOR EDUCATION STATISTICS
E.D. Tabs May 1997
Schools and Staffing Survey
Characteristics of Stayers,Movers, and Leavers:Results from the TeacherFollowup Survey: 1994-95
Summer D. WhitenerKerry J. GruberNational Center for Education Statistics
Hilda LynchKate TangosMia PeronaPinkerton Computer Consultants, Inc.
Sharon FondelierBureau of the Census
U.S. Department of EducationOffice of Educational Research and Improvement NCES 97-450
3

U.S. Department of EducationRichard W. RileySecretary
Office of Educational Research and improvementRamon C. CortinesActing Assistant Secretary
National Center for Education StatisticsPascal D. Forgione, Jr.Commissioner
The National Center for Education Statistics (NCES) is the primary federal entity for collecting, analyzing,and reporting data related to education in the United States and other nations. It fulfills a congressionalmandate to collect, collate, analyze, and report full and complete statistics on the condition of education inthe United States; conduct and publish reports and specialized analyses of the meaning and significance ofsuch statistics; assist state and local education agencies in improving their statistical systems; and reviewand report on education activities in foreign countries.
NCES activities are designed to address high priority education data needs; provide consistent, reliable,complete, and accurate indicators of education status and trends; and report timely, useful, and high qualitydata to the U.S. Department of Education, the Congress, the states, other education policymakers,practitioners, data users, and the general public.
We strive to make our products available in a variety of formats and in language that is appropriate to avariety of audiences. You, as our customer, are the best judge of our success in communicating informationeffectively. If you have any comments or suggestions about this or any other NCES product or report, wewould like to hear from you. Please direct your comments to:
National Center for Education StatisticsOffice of Educational Research and ImprovementU.S. Department of Education555 New Jersey Avenue NWWashington, DC 20208-5574
May 1997
The NCES World Wide Web Home Page address ishttp://www.ed.gov/NCES/
Suggested CitationU.S. Department of Education. National Center for Education Statistics. Characteristics of Stayers, Movers,and Leavers, Results from the Teacher Followup Survey: 1994-95, NCES 97-450, by Summer D. Whitener,Kerry J. Gruber, Hilda Lynch, Kate Tingoes, Mia Perona, and Sharon Fondelier. Project Officer: Summer D.Whitener. Washington, DC: 1997.
Contact:Summer D. Whitener(202) 219-1368
For free single copies of this publication, call the National Data Resource Center at(703) 845-3151 or send a FAX request to (703) 820-7465.
For sale by the U.S. Government Printing Office
Superintendent of Documents, Mail Stop: SSOP, Washington, DC 20402-9328
ISBN 0-16-049079-0
4

Highlights
The attrition rate from the teaching profession between school years 1993-94 and1994-95 was 6.6 percent in public schools and 11.9 percent in private schools(table 1).
Teacher attrition varied by teacher's age. The rate for teachers in the 25 to 29 agecategory was 10.0 percent for public school teachers and 13.1 percent for privateschool teachers; the rate for the 60 to 64 age category was 30.5 and 13.1 percent forpublic and private school teachers, respectively (table 2).
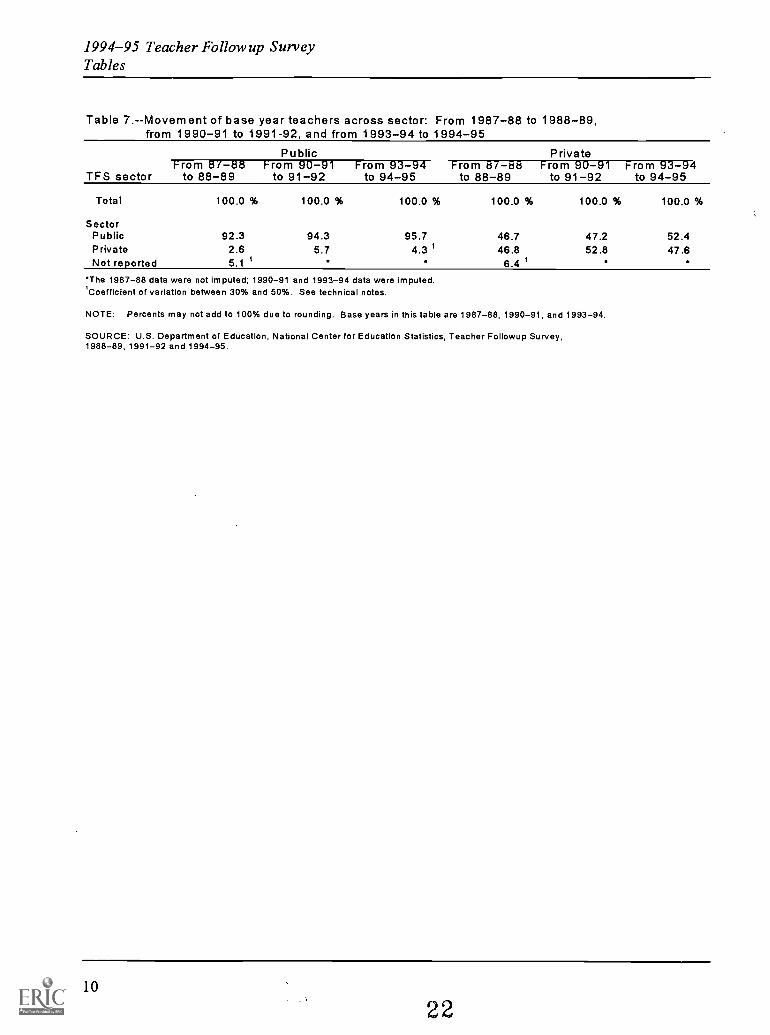
Almost all public school teachers who changed schools between school years 1993-94and 1994-95 transferred to other public school (95.7 percent); about one-half (47.6percent) of the private school teachers in 1993-94 who changed schools for the1994-95 school year stayed in private schools and about one-half (52.4 percent)transferred to public schools (table 7).
Some 16.2 percent of former public school teachers and 17.1 percent of former privateschool teachers cited homemaking and/or child rearing as their primary occupationalstatus in 1994-95. About 27.1 percent of former public school teachers said they wereretired, versus 10.8 percent of the former private school teachers who said they wereretired (table 8).
Twenty percent of former public school teachers and one-third of former privateschool teachers were employed elsewhere (table 8).
The main occupation for these former teachers working outside of elementary orsecondary education in 1994-95 was employment in a private company, business, orindividual for wages, salary, or commission (70.3 percent for public and 76.2 percentfor private) (table 9).
The two main reasons public school teachers cited for leaving the teaching professionin the 1994-95 school year were retirement (27.4 percent) and pregnancy/child rearing(14.3 percent). For private school teachers, the two main reasons cited for leaving theteaching profession were to pursue another career (16.3 percent) and for a family orpersonal move (16.2 percent) (table 10).
Among teachers who left the teaching profession between 1993-94 and 1994-95, 25.7percent of public school teachers expected to retire, while 24.1 percent of the privateschool teachers expected to work outside the field of education (table 11).
5iii

iv
Among public school teachers who left between 1993-94 and 1994-95 and citeddissatisfaction with teaching as a career, student discipline problems (17.9 percent),poor student motivation to learn (17.6 percent), and inadequate support fromadministration (15.3 percent) were cited as the main reasons that they were dissatisfiedwith teaching as a career (table 12).
Among private school teachers who left between 1993-94 and 1994-95 and citeddissatisfaction with teaching as a career, lack of recognition and support from theadministration (30.2 percent), poor opportunity for professional advancement (14.6percent), and inadequate support from administration (12.5 percent) were cited as themain reasons that they were dissatisfied with teaching as a career (table 12).
Among teachers who stayed in the same school between school years 1993-94 and1994-95, 53.1 percent of public and 59.2 percent of private school teachers felt that"providing higher salaries or better fringe benefits" would be the most effective stepthat schools might take to encourage teachers to remain in teaching (tables 14 and15).
6

Acknowledgments
The authors wish to thank all those who contributed to the production of this E.D.TAB. Among the staff at the Bureau of the Census, Kathy Stoner and Lenore Colaciello,monitored the data collection for this survey. Thanks also to Carol Rohr of PinkertonComputer Consultants, Inc. for formatting the text and tables in this report.
We would like to acknowledge the helpful comments of the peer reviewers. Internalreviewers were Susan Ahmed of the Statistical Standards and Services Group and ShellyBurns and Debra Gerald of the Data Development and Longitudinal Studies Group. Outsidereviewers were Iris R. Weiss, Horizon Research, Inc., and Jewell Gould, American Federationof Teachers. Marilyn M. McMillen, of the Surveys and Cooperative Systems Group was thestatistical consultant for the E.D. TAB.

Table of Contents Page
Highlights iii
Acknowledgments v
Introduction 1
Tables
Table A. Weighted number of stayers, movers, and leavers, by sector as of: 1988-89,1991-92, and 1994-95 2
Table B. Weighted number of teachers in each field, by main field of assignment:1987-88,1990-91, and 1993-94 3
Table 1. Attrition rates from the teaching profession, by main field of assignment:from 1987-88 to 1988-89, from 1990-91 to 1991-92, and from 1993-94to 1994-95 4
Table 2. Attrition rates from the teaching profession, by selected teacher characteristics:from 1987-88 to 1988-89, from 1990-91 to 1991-92, and from 1993-94 to1994-95 5
Table 3. Percentage of public school stayers, movers, and leavers, by selected teachercharacteristics: from 1987-88 to 1988-89, from 1990-91 to 1991-92, andfrom 1993-94 to 1994-95 6
Table 4. Percentage of private school stayers, movers, and leavers, by selected teachercharacteristics: from 1987-88 to 1988-89, from 1990-91 to 1991-92, andfrom 1993-94 to 1994-95 7
Table 5. Percentage of public school stayers, movers, and leavers, by selected schoolcharacteristics: form 1987-88 to 1988-89, from 1990-91 to 1991-92, andfrom 1993-94 to 1994-95 8
Table 6. Percentage of private school stayers, movers, and leavers, by selected schoolcharacteristics: from 1987-88 to 1988-89, from 1990-91 to 1991-92, andfrom 1993-94 to 1994-95 9
Table 7. Movement of base year teachers across sector: from 1987-88 to 1988-89,from 1990-91 to 1991-92, and from 1993-94 to 1994-95 10
vii
8

Table 8. Current primary occupational status of base year teachers who left the teachingprofession: 1988-89,1991-92, and 1994-95 11
Table 9. Current 'primary occupational status of base year teachers who left the teachingprofession and are working in an occupation outside of elementary or secondaryeducation: 1988-89,1991-92, and 1994-95 12
Table 10. Main reason why base year teachers left the teaching profession: 1988-89,1991-92, and 1994-95 13
Table 11. What base year teachers expected their main activity would be during the nextschool year, by current teaching status: 1987-88,1990-91, and 1993-94 . . . 14
Table 12. Percentage of base year teachers who reported "dissatisfaction with teaching asa career" as one of the three main reasons for leaving the profession, by mainarea of dissatisfaction: 1988-89,1991-92, and 1994-95
Table 13. Percentage of base year teachers who reported "dissatisfaction with the previousschool" as one of three main reasons for changing schools, by main area ofdissatisfaction: 1988-89,1991-92, and 1994-95
15
16
Table 14. Percentage of public school teachers who think that each step is the mosteffective step that schools might take to encourage teachers to remain inteaching: 1988-89,1991-92, and 1994-95 17
Table 15. Percentage of private school teachers who think that each step is the mosteffective step that schools might take to encourage teachers to remain inteaching: 1988-89,1991-92, and 1994-95 18
Technical Notes
I. Overview 19A. Purpose of the Survey 19B. Periodicity of Survey 19C. Target Populations 20
II. Sample Design 23A. SASS Sampling Frames 23B. SASS Stratification 24C. TFS Stratification and Sample Allocation 26D. SASS Sample Selection 29E. TFS Sample Selection 33
viii 9

III. Data Collection 33
A. Time Frame of the Survey 33
B. Data Collection Procedures 34
IV. Edit Procedures 35
A. Clerical Edit 35
B. Preliminary ISR Classification 35
C. Computer Edit 36
D. Final Interview Status Edit 36
V. Response Rates 38
A. Survey Response Rates 38
B. Item Response Rates 40
VI. Imputation 40
VII. Weighting 41
A. SASS Teacher Weights 41
B. TFS Teacher Weights 42
VIII. Variance Estimation 42
IX. Reinterview Program 45
X. Confidentiality Protection Measures 45
XI. Changes to TFS Content from 1991-92 to 1994-95 46
XII. Caution Concerning the Measurement of Change Using 1991-92 and 1994-95TFS 46
XIII. User Notes and Comments 46
Appendix A. Standard Error Tables Al
Al. Standard errors for attrition rates from the teaching profession, by main fieldof assignment: from 1987-88 to 1988-89, from 1990-91 to 1991-92, andfrom 1993-94 to 1994-95 (table 1) A2
A2. Standard errors for attrition rates from the teaching profession, by selectedteacher characteristics: from 1987-88 to 1988-89, from 1990-91 to 1991-92,and from 1993-94 to 1994-95 (table 2) A3
10 ix

A3. Standard errors for percentage of public school stayers, movers, and leavers, byselected teacher characteristics: from 1987-88 to 1988-89, from 1990-91 to1991-92, and from 1993-94 to 1994-95 (table 3) A4
A4. Standard errors for percentage of private school stayers, movers, and leavers, byselected teacher characteristics: from 1987-88 to 1988-89, from 1990-91 to1991-92, and from 1993-94 to 1994-95 (table 4) A5
A5. Standard errors for percentage of public school stayers, movers, and leavers, byselected school characteristics: from 1987-88 to 1988-89, from 1990-91 to1991-92, and from 1993-94 to 1994-95 (table 5) A6
A6. Standard errors for percentage of private school stayers, movers, and leavers, byselected school characteristics: from 1987-88 to 1988-89, from 1990-91 to1991-92, and from 1993-94 to 1994-95 (table 6) A7
A7. Standard errors for movement of base year teachers across sector: from 1987-88to 1988-89, from 1990-91 to 1991-92, and from 1993-94 to 1994-95 (table 7) . A8
A8. Standard errors for current primary occupational status of base year teachers wholeft the teaching profession: 1988-89,1991-92, and 1994-95 (table 8) A9
A9. Standard errors for current primary occupational status of base year teachers wholeft the teaching profession and are working in an occupation outside of elementaryor secondary education: 1988-89,1991-92, and 1994-95 (table 9) Al 0
A10. Standard errors for main reason why base year teachers left the teaching profession:1988-89,1991-92, and 1994-95 (table 10) All
All. Standard errors for what base year teachers expected their main activity wouldbe during the next school year, by current teaching status: 1987-88,1990-91, and1993-94 (table 11) Al2
Al2. Standard errors for percentage of base year teachers who reported "dissatisfactionwith teaching as a career" as one of three main reasons for leaving the profession,by main area of dissatisfaction: 1988-89,1991-92, and 1994-95 (table 12) . . . . A13
A13. Standard errors for percentage of base year teachers who reported "dissatisfactionwith previous school" as one of three main reasons for changing schools, by mainarea of dissatisfaction: 1988-89,1991-92, and 1994-95 (table 13) A14
A14. Standard errors for percentage of public school teachers who think that eachstep is the most effective step that schools might take to encourage teachers toremain in teaching: 1988-89,1991-92, and 1994-95 (table 14) A15

A15. Standard errors for percentage of private school teachers who think that eachstep is the most effective step that schools might take to encourage teachers toremain in teaching: 1988-89,1991-92, and 1994-95 (table 15) A16
Appendix B. Teacher Followup SurveyQuestionnaire for Current Teachers B1
Appendix C. Teacher Followup SurveyQuestionnaire for Former Teachers Cl
Appendix D. SASS and TFS Data Products D1
xi
12

1994-95 Teacher Follow up Survey
Introduction
How the Teacher Followup Survey is related to the Schools and Staffing Survey
The Teacher Followup Survey is a one-year followup of a sample of teachers whowere originally selected for the Teacher Questionnaire in the Schools and Staffing Survey.The Schools and Staffing Survey is an integrated set of surveys of public and private schools,principals, teachers, and public school districts throughout the United States of America.There have been three data cycles for the Schools and Staffing Survey, and likewise, threeTeacher Followup Surveys.
The 1994-95 Teacher Followup Survey data in this report links responses from the1994-95 school year to characteristics of those same teachers who participated in the1993-94 school year SASS. Within this report, there are some data that are drawn directlyfrom the 1993-94 SASS. These data are termed "base year" because the SASS sample is the"base" for the teachers who are selected for the Teacher Followup Survey. Base yearcharacteristics include personal and professional descriptors of the teacher (age, sex, race,field of teaching assignment), as well as characteristics of the school in which the teachersworked in 1993-94: whether the school was public or private, region of the country in whichthe school is located, and the community type or locale of the school. These "base year"characteristics provide the context for the data collected in the Teacher Followup Survey.
Purpose of the Teacher Followup Survey
How do teachers who remain teaching at the same school from year to year ("stayers")compare with those who don't? How many teachers move from one school to another("movers")? What percentage of teachers are leaving the profession between one year and thenext ("leavers")? These types of questions can be answered with data from the TeacherFollowup Survey. For teachers who leave the profession, TFS asks about their occupationalstatus (are former teachers working, retired, or caring for family members?) or whether theyare seeking further education, and reasons for leaving teaching, as well as recommendationsfor how schools might retain teachers. Those who remain in teaching are asked about changesin teaching assignment, opinions about retaining teachers, and retirement plans. Both currentand former teachers are asked for their current family income. Teachers who move from oneschool to another are asked to describe the type of school to which they moved. Data fromthe Teacher Followup Survey can be used to compare public and private teachers' jobsatisfaction, as well as movement within and out of the teaching profession.
1
13

1994-95 Teacher Follow up SurveyTables
Table A.-- Weighted number of stayers, movers, and leavers, by sector as of: 1988-89,
1991-92, and 1994-95
Stayers Movers Leavers Total
Public
1988-89 2,065,839 188,404 132,311 2,387,174
1991-92 2,237,320 185,659 130,495 2,553,474
1994-95 2,205,268 182,949 167,564 2,555,781
Private
1988-89 242,528 29,682 39,714 311,924
1991-92 287,126 23,226 43,499 353,851
1994-95 310,123 21,725 45,021 376,869
NOTE: Stayers are teachers who were teaching in the same school in the current schoolyear as in the base year. Movers are teachers who were still teaching in the current schoolyear but had moved to a different school after the base year. Leavers are teachers wholeft the teaching profession after the base year.
SOURCE: U.S. Department of Education, National Center for Education Statistics,Teacher Follow-Up Survey, 1988-89, 1991-92 and 1994-95.
14

1994-95 Teacher Followup SurveyTables
Table B.-- Weighted number of teachers in each field, by main field of assignment: 1987-88,1990-91, and 1993-94
Public Private1987-88 1990-91 1993-94 1987-88 1990-91 1993-94
Total 2,387,174 2,553,474 2,555,781 311,924 353,851 376,869
Kindergarten 119,736 110,723 104,748 22,961 22,796 22,937General elementary 692,847 766,053 745,806 108,765 122,587 118,762Art/music 189,477 191,656 144,119 10,817 19,511 26,381Bilingual/ESL 15,616 25,208 40,324 -- 1,240 1,426Business 37,062 66,150 45,278 1,827 2,532 --English/language arts 182,952 184,272 169,327 31,485 32,654 33,935Health 126,561 141,183 161,746 15,157 14,565 17,367Home economics 34,270 31,428 24,110 740 2,196 740Industrial arts 43,561 34,518 34,884 516 1,250 837Math 164,914 177,375 166,665 24,462 29,315 30,852Reading 61,204 59,030 79,645 6,086 4,832 6,238Social studies 147,544 146,545 154,030 19,131 20,716 23,800
Science total 140,169 147,978 146,801 21,678 21,972 21,698Biology 45,449 40,778 53,491 4,954 5,946 9,846Chemistry/physics 21,658 30,289 24,409 6,567 4,926 4,307General science/earth scienc 73,061 76,911 68,900 10,157 11,101 7,545
Special education total 245,292 287,563 274,873 10,497 9,414 15,286Mentally retarded 50,172 20,141 19,078 1,649 812Learning disabled 118,038 82,918 92,265 4,782 3,436 2,687Other special education 77,082 184,504 163,530 4,066 5,680 11,788
Vocational education 57,427 30,909 50,539 203 1,227 3,077
Foreign languages ++ 65,297 57,193 ++ 15,529 19,386
Physical science Ir * it* 13,133 .., .. 1,704
All others* 128,544 87,587 142,558 36,197 31,513 32,412
--Too few cases for a reliable estimate.+4-Foreign languages in 1987-88 was included in the "All others" category.
*Includes computer science, remedial education, religion, gifted, prekindergarten, and all others (and foreign languages in 1987-88).**No equivalent category in 1987-88 or 1990-91.
SOURCE: U.S. Department of Education, National Center for Education Statistics, Teacher Followup Survey, 1988-89,1991-92 and1994-95.
3
15

1994-95 Teacher Followup SurveyTables
Table 1.-Attrition rates from the teaching profession, by main field of assignment: From 1987-88 to1988-89, from 1990-91 to 1991-92, and from 1993-94 to 1994-95
Base year's mainfield of assignment
Public PrivateFrom 87-88
to 88-89From 90-91
to 91-92From 93-94
to 94-95From 87-88
to 88-89From 90-91
to 91-92From 93-94
to 94-95
Total 5.6 5.1 6.6 12.7 12.3 11.9
Kindergarten 3.1 4.0 1 3.1 10.5 11.9 15.9General elementary 5.6 5.3 6.7 11.9 10.4 8.8
Art/music 4.2 5.9 7.0 17.7 13.0 10.9
Bilingual/ESL 8.2 1 4.5' 4.0' -- -- 10.9 2
Business 5.9 1 7.7' 6.0 21.1 2 10.7 2 --English /language arts 8.5 5.1 8.5 18.7 13.9 12.8Health 3.8 3.3 4.1 1 6.3 1 15.6 13.6
Home economics 6.6' 4.2 6.8 1 31.7 2 -- --
Industrial arts 3.7' 2.7 1 5.7 -- -- 30.3 2
Math 4.9 5.2 6.9 10.8 10.9 12.7
Reading 5.1 3.4' 2.9' 6.7 1 31.8 1 6.4 1
Social studies 5.1 1 6.7 4.6 8.41 10.8 1 11.6
Science total 5.4 6.1 1 6.5 9.2 7.3 9.6
Biology 3.2 8.6 8.5 2 6.6 2 8.4 1
Chemistry/physics 4.1 1 4.4 2 1.6 1 7.0 2 11.9
General science/earth science 7.1 8.0 1 6.7 1 10.9 1 7.5 1 9.8 1
Special education total 7.3 4.9 6.3 13.7 2 9.4' 14.1
Mentally retarded 12.6' 3.7 1 9.2 1 6.4 2 --
Learning disabled 4.3 3.2 4.3 2 7.6 2 3.4 2 4.0 2
Other special education 8.4' 5.8 7.1 23.7 2 13.5 2 17.1
Vocational education 6.7' 5.6' 8.2' 0.0 44.1 2
Foreign languages ++ 2.3 7.0 ++ 14.1 10.4
Physical science 4.8 2 . 4.1 2
All others* 5.2 4.8 12.9 18.2 19.0 22.8
--Too few cases for a reliable estimate.++Foreign languages in 1987-88 was included in the "All others" category.
'Coefficient of variation between 30% and 50%. See technical notes.=Coefficient of variation greater than 50%. See technical notes.*Includes computer science, remedial education, religion, gifted, prekindergarten, and all others (and foreign languages in 1987-88).
**No equivalent category in 1987-88 or 1990-91.
NOTE: The attrition rate is the percentage of teachers who left the teaching profession between school years 1987-88 to 1988-89,1990-91 to 1991-92, and 1993-94 to 1994-95 (percent "leavers"). Base years in this table are 1987-88,1990-91, and 1993-94.
SOURCE: U.S. Department of Education, National Center for Education Statistics, Teacher Followup Survey, 1988-89,1991-92
and 1994-95.
BEST COPY AVAILABLE
4 16

1994-95 Teacher Follow up SurveyTables
Table 2.-Attrition rates from the teaching profession, by selected teacher characteristics: From1987-88 to 1988-89, from 1990-91 to 1991-92, and from 1993-94 to 1994-9
Base year's teacher
characteristics
Public Private
From 87-88
to 88-89
From 90-91
to 91-92
From 93-94
to 94-95
From 87-88
to 88-89
From 90-91
to 91-92
From 93-94
to 94-95
Total 5.6 5.1 6.6 12.7 12.3 11.9
Sex
Male 5.1 4.5 5.2 10.2 12.1 13.1
Female 5.8 5.3 7.1 13.4 12.3 11.6
Not reported 7.2' ** ** - nir
AgeLess than 25 4.3 9.1 3.8 19.0 23.8 20.0
25 to 29 9.0 9.0 10.0 17.6 17.8 13.1
30 to 39 5.8 4.2 6.7 12.4 13.7 14.9
40 to 49 2.4 2.0 3.9 10.5 7.7 8.7
50 to 59 5.7 6.7 6.3 11.3 9.63 8.2
60 to 64 23.4 26.8 30.5 16.9' 17.8 13.1
65 or more 16.7 2 40.9' 34.17.9 1 20.7 41.9
Not reported 12.9 2 .r. ** 6.2 2 * *.
Full-time teaching experience
Less than 1 year 11.6 17.2 ' 9.3 27.4 28.4 22.1
1 to 3 years 8.3 7.2 7.8 15.9 16.7 17.3
1 year 8.5 8.4 6.4 18.8 18.8 21.7
2 years 7.6 7.1 9.1 14.6 15.8 17.0
3 years 8.8 5.9 7.8 14.3 14.7 12.4
4 to 9 years 6.0 5.3 7.1 12.8 12.7 11.9
10 to 19 years 4.0 2.4 4.4 11.4 6.2 7.9
20 to 24 years 2.2 3.4 4.6 7.4 1 4.7' 5.2
25 years or more 11.0 11.0 11.1 7.4 14.6 11.6
Not reported 2.5 2 . 18.4 2
Degree eathed
Less than bachelor's 3.2 1 21.3 2 3.9' 26.4 29.6 22.8
Bachelor's 5.6 5.2 6.3 12.7 11.4 11.2
Master's 5.5 4.6 6.5 10.4 10.9 9.7
Education specialist 6.4 4.9 10.9 23.5 1 14.0' 25.2
Doctorate or professional 4.3 2 12.3 25.9 2 8.3 2 8.9' 21.6'
Race/ethnicity
White, non-Hispanic 5.7 5.1 6.5 12.1 12.0 11.7
Total minority 4.4 5.3 6.8 21.4 15.4 14.8
Am Indian, Aleut, Eskimo 3.1 2 1.7' 35 1 17.5 2 16.5 2 38.5 2
Asian or Pacific Islander 4.2 2 7.0 2 2.4' 8.8 2 12.2 2 17.5'
Black, non-Hispanic 5.1 1 6.1 6.6 34.7 19.3 1 12.6'
Hispanic 2.9 4.4 9.1 21.3 1 13.6 1 14.6'
Not reported 6.1 1 ... .., 18.5 2
Level taught
Elementary 5.5 4.8 6.4 12.5 11.3 11.5
Secondary 5.6 5.5 6.7 12.9 13.3 12.6
-Too few cases for a reliable estimate.*The 1987-88 data were not imputed; 1990-91 and 1993-94 data were imputed.
1Coefficient of variation between 30% and 50%. See technical notes.
2Coefficient of variation greater than 50%. See technical notes.
1This number has been revised from earlier publications.
NOTE: The attrition rate is the percentage of teachers who left the teaching profession between school years 1987-88 to 1988-89,
1990-91 to 1991-92, and 1993-94 (percent leavers"). Base years in this table are 1987-88, 1990-91, and 1993-94.
BEST COPY AVAILABLE
175

1994-95 Teacher Followup SurveyTables
Table 3.-Percentage of public school stayers, movers, and leavers, by selected teacher characteristics: From 1987-88 to1988-89, from 1990-91 to 1991-92, and from 1993-94 to 1994-95
Base years teachercharacteristics
From 1987-88 to 1988-89 From 1990-91 to 1991-92 From 1993-94 to 1994-95Stayers Movers Leavers Stayers Movers Leavers Stayers Movers Leavers
Total 86.5 % 7.9 % 5.6 % 87.6 % 7.3 % 5.1 % 86.3 % 7.2 % 6.6 %SexMale 87.7 7.3 5.1 89.1 6.4 4.5 88.2 6.6 5.2Female 86.1 8.1 5.8 87.1 7.6 5.3 85.6 7.4 7.1Not reported 81.8 1 11.0 2 7.2 2
AgeLess than 25 78.7 17.0 4.3 73.8 17.2 9.1 81.1 15.2 3.825 to 29 75.0 16.1 9.0 76.6 14.3 9.0 76.3 13.7 10.030 to 39 85.2 9.0 5.8 85.9 9.9 4.2 84.8 8.6 6.740 to 49 91.2 6.4 2.4 92.5 5.5 2.0 89.9 6.1 3.950 to 59 90.4 3.9 5.7 89.3 4.0 6.7 88.9 4.8 6.360 to 64 72.0 4.5 2 23.4 71.0 2.2 a 26.8 68.0 1.5 2 30.565 or more 83.3 0.0 16.7 2 48.9 10.3 2 40.9' 63.2 - 34.1Not reported 77.9 9.3 1 8.5 2
Full-time teaching experienceLess than 1 year 76.9 11.5 1 11.6 51.5 31.3 17.21 79.7 11.1 9.31 to 3 years 77.4 14.3 8.3 79.7 13.1 7.2 79.6 12.7 7.8
1 year 77.3 14.2 8.5 79.0 12.6 8.4 81.2 12.4 6.42 years 78.8 13.6 7.6 78.7 14.1 7.1 76.4 14.6 9.13 years 76.0 15.2 8.8 81.6 12.4 5.9 81.4 10.8 7.8
4 to 9 years 82.9 11.1 6.0 84.8 9.9 5.3 83.0 9.9 7.110 to 19 years 89.3 6.7 4.0 91.0 6.5 2.4 89.1 6.6 4.420 to 24 years 93.6 4.1 2.2 93.3 3.3 3.4 92.5 2.8 4.625 years or more 84.9 4.1 11.0 85.9 3.1 11.0 84.9 4.1 11.1Not reported 95.0 2.5 2 2.5 2
Degree earnedLess than bachelor's 96.3 - 3.2 1 76.1 2.7 2 21.3 2 91.0 5.0 2 3.9 1Bachelors 85.7 8.7 5.6 87.3 7.5 5.2 86.2 7.5 6.3Masters 87.5 7.0 5.5 88.4 7.0 4.6 86.8 6.7 6.5Education specialist 86.0 7.6 6.4 85.9 9.1 4.9 81.8 7.3 10.9Doctorate or professional 88.4 7.3 2 4.3 2 87.5 - 12.3 2 85.9 8.2 2
5.5 2
Race/ethnicityWhite, non-Hispanic 86.5 7.8 5.7 87.6 7.3 5.1 86.7 6.8 6.5Total minority 87.0 8.6 4.4 87.5 7.1 5.3 83.7 9.5 6.8Am. Indian, Aleut, Eskimo 95.0 1.5 2
3.1 2 96.3 2.0 2 1.7 1 90.0 6.6 13.5 1
Asian or Pacific Islander 73.7 22.1 2 4.2 2 84.7 8.2 1 7.0 2 87.8 9.8 1 2.4'Black, non-Hispanic 86.2 8.8 5.1 1 85.5 8.3 6.1 84.9 8.5 6.6Hispanic 88.9 8.2 2.9 89.6 6.0 4.4 79.4 11.5 9.1
Not reported 86.1 7.9 1 6.1 1
Level taught
Elementary 85.0 9.5 5.5 87.1 8.1 4.8 86.0 7.6 6.4Secondary 88.1 6.2 5.6 88.2 6.4 5.5 86.6 6.7 6.7
-Too few cases for a reliable estimate.*The 1987-88 data were not imputed; 1990-91 and 1993-94 data were imputed.'Coefficient of variation between 30% and 50%. See technical notes.2Coefficient of variation greater than 50%. See technical notes.
NOTE: Percents may not add to 100% due to rounding. Base years in this table are 1987-88,1990-91, and 1993-94. Stayers are teachers whowere teaching in the same school in the current school year as in the base year. Movers are teachers who were still teaching in thecurrent schoolyear but had moved to a different school after the base year. Leavers are teachers who left the teaching profession after the base year.
SOURCE: U.S. Department of Education, National Center for Education Statistics, Teacher Followup Survey, 1988-89,1991-92, and 1994-95.
BEST COPY AVAILABLE
18

1994-95 Teacher Follow up SurveyTables
Table 4.-Percentage of private school stayers, movers, and leavers, by selected teacher characteristics: From 1987-88 to1988-89, from 1990-91 to 1991-92, and from 1993-94 to 1994-95
Base year's teachercharacteristics
From 1987-88 to 1988-89 From 1990-91 to 1991-92 From 1993-94 to 1994-95Stayers Movers Leavers Stayers Movers Leavers Stayers Movers Leavers
Total 77.896 9.5 % 12.7 % 81.1 % 6.6 % 12.3 % 82.3 % 5.8 % 11.9 %
Sex
Male 83.7 6.1 10.2 81.6 6.3 12.1 82.1 4.8 13.1
Female 76.2 10.4 13.4 81.0 6.6 12.3 82.4 6.1 11.6
Not reported 0.0 - 0.0
AgeLess than 25 63.2 17.9 19.0 62.4 13.8 23.8 67.4 12.6 20.0
25 to 29 64.8 17.5 17.6 70.4 11.8 17.8 76.1 10.8 13.1
30 to 39 78.5 9.1 12.4 78.7 7.5 13.7 77.6 7.5 14.9
40 to 49 82.0 7.5 10.5 87.2 5.2 7.7 87.2 4.1 8.7
50 to 59 82.3 6.4 11.3 87.0 i 9.6 89.3 2.4 8.2
60 to 64 79.8 3.3 2 16.9 1 81.1 1.1 2 17.8 84.9 2.0 1 13.1
65 or more 88.2 3.9 2 7.9 1 73.4 5.9 1 20.7 56.6 - 41.9
Not reported 84.8 91 2 6.2 2
Full-time teaching experienceLess than 1 year 67.0 5.6 1 27.4 67.0 4.6 28.4 70.3 7.6 22.1
1 to 3 years 70.6 13.5 15.9 73.5 9.8 16.7 72.3 10.3 17.3
1 year 64.1 17.0 18.8 71.2 10.0 18.8 66.7 11.6 21.7
2 years 73.5 12.0 14.6 75.0 9.2 15.8 71.9 11.2 17.0
3 years 74.0 11.7 14.3 75.1 10.2 14.7 79.8 7.8 12.4
4 to 9 years 75.7 11.6 12.8 79.2 8.1 12.7 81.2 7.0 11.9
10 to 19 years 81.1 7.5 11.4 88.6 5.3 6.2 89.7 2.4 7.9
20 to 24 years 85.5 7.1 2 7.4 1 92.3 3.0 4.7 1 92.3 2.5 5.2
More than 25 years 88.3 4.3 1 7.4 83.0 2.4 14.6 85.5 2.9 11.6
Not reported 74.6 7.0 2 18.4 2
Degree earnedLess than bachelors 64.2 9.5 2 26.4 65.1 5.2 ' 29.6 72.9 4.2 ' 22.8
Bachelor's 76.8 10.5 12.7 80.9 7.7 11.4 82.6 6.2 11.2
Master's 81.4 8.2 10.4 84.6 4.5 10.9 84.5 5.7 9.7
Education specialist 66.4 10.1 / 23.5 1 79.0 7.0 2 14.0 1 73.6 1.2 2 25.2
Doctorate or professional 90.4 - 8.3 2 91.0 - 8.9 1 77.6 - 21.6 1
Race/ethnicityWhite, non-Hispanic 78.7 9.2 12.1 81.3 6.7 12.0 82.5 5.7 11.7
Total minority 64.4 14.2 21.4 79.3 5.3 ' 15.4 79.2 - 14.8
Am. Indian, Aleut, Eskimo 67.1 1 15.5 2 17.5 2 83.5 - 16.5 2 - - 38.5 2
Asian or Pacific Islander 90.3 - 8.8 2 85.9 1.9 2 12.2 2 79.0 - 17.5 1
Black, non-Hispanic 29.6 35.7 34.7 78.4 2.4 2 19.3 1 82.3 12.6 1
Hispanic 68.6 10.2 1 21.3' 77.4 9.0 1 13.6 1 77.2 - 14.6'Not reported 67.5 14.1 2 18.5 2 * me
Level taughtElementary 76.7 10.8 12.5 81.9 6.7 11.3 82.4 6.1 11.5
Secondary 78.9 8.2 12.9 80.3 6.4 13.3 82.2 5.2 12.6--Too few cases for a reliable estimate."The 1987-88 data were not imputed; 1990-91 and 1993-94 data were imputed.'Coefficient of variation between 30% and 50%. See technical notes.2Coefficient of variation greater than 50%. See technical notes.
NOTE: Percents may not add to 100% due to rounding. Base years in this table are 1987-88,1990-91, and 1993-94. Stayers are teacherswho were teaching in the same school in the current school year as in the base year. Movers are teachers who were still teaching in the currentschool year but had moved to a different school after the base year. Leavers are teachers who left the teaching profession after the base year.
SOURCE: U.S. Department of Education, National Center for Education Statistics, Teacher Followup Survey, 1988-89,1991-92, and 1993-94.
BEST COPY AVAILABLE
7
19

1994-95 Teacher Followup SurveyTables
Table 5.-Percentage of public school stayers, movers, and leavers, by selected school characteristics: From 1987-88to 1988-89, from 1990-91 to 1991-92, and from 1993-94 to 1994-95
Base year's schoolcharacteristics
From 1987-88 to 1988-89 From 1990-91 to 1991-92 From 1993-94 to 1994-95Stayers Movers Leavers Stayers Movers Leavers Stayers Movers Leavers
Total 86.5 % 7.9 % 5.6 % 87.6 % 7.3 % 5.1 % 86.3 % 7.2 % 6.6 %
School levelElementary 86.0 8.8 5.2 86.6 8.0 5.3 85.4 7.8 6.8Secondary 88.1 6.5 5.4 89.5 5.6 4.9 87.5 5.7 6.7Combined 87.5 5.6 6.9 83.2 11.5 5.3 87.8 7.0 5.2Not reported 82.9 8.9 8.2 90.3 6.2 3.5 87.4 8.0 4.6
School sizeLess than 150 85.6 9.8 4.5 86.6 8.1 5.3 78.6 10.3 11.1 I
150-299 84.6 9.9 5.4 88.0 7.7 4.3 85.8 7.0 7.1300-499 86.9 7.5 5.6 85.8 8.5 5.7 86.2 7.3 6.5500-749 86.8 7.5 5.7 87.7 7.6 4.7 85.3 7.1 7.6750 or more 87.7 7.4 4.9 88.6 6.1 5.4 87.7 6.6 5.7Not reported 82.9 8.9 8.2 90.3 6.2 3.5 87.4 8.0 4.6
Minority statusLess than 5% 88.0 6.9 5.1 89.6 5.7 4.6 87.1 4.9 8.05 to 19% 86.6 7.6 5.8 88.1 6.4 5.5 87.3 6.7 6.020 to 49% 87.3 7.6 5.2 85.6 8.6 5.9 86.6 7.2 6.250% or more 85.0 9.7 5.3 86.2 8.9 4.9 83.6 9.6 6.8Not reported 82.9 8.9 8.2 90.3 6.2 3.5 87.4 8.0 4.6
Community typeCentral city 86.3 8.6 5.2 86.1 7.6 6.3Urban fringe/large town 87.2 7.3 5.5 86.3 7.2 6.5RuraVsmall town " 88.8 6.4 4.8 86.4 6.8 6.8
RegionNortheast 89.9 5.6 4.5 89.2 6.6 4.1 88.7 5.1 6.2Midwest 86.5 7.6 5.9 89.7 5.9 4.4 85.3 6.5 8.2South 84.7 9.3 5.9 86.1 8.1 5.9 85.1 8.4 6.5West 86.0 8.3 5.7 86.0 8.3 5.7 87.3 7.9 4.8
*Community types for 1987-88,1990-91, and 1993-94 are not comparable. In the 1987-88 SASS, respondents reported whether theylived in a rural, suburban, urban or other type of community. In the 1990-91 and 1993-94 SASS, the community type of the school wasdefined by LOCALE codes created by Johnson. Johnson, F. (1989), 'Assigning Type of Locale Codes to the 1987-88 CCD Public SchoolUniverse", Technical Report, Data Series: SP-CCD-87188-7.4, CS 89-194 (Washington, D.C.: U.S. Department of Education, NationalCenter for Education Statistics).1Coefficient of variation between 30% and 50%. See technical notes.
NOTE: Percents may not add to 100% due to rounding. "Not reported" data in this table are due to total survey nonresponse from someschools in the 1987-88 or 1990-91 SASS. Base years in this table are 1987-88,1990-91, and 1993-94. Stayers are teachers who wereteaching in the same school in the current school year as in the base year. Movers are teachers who were still teaching in the currentschool year but had moved to a different school after the base year. Leavers are teachers who left the teaching profession after the baseyear.
SOURCE: U.S. Department of Education, National Center for Education Statistics, Teacher Followup Survey, 1988-89,1991-92 and1994-95.
20

1994-95 Teacher Follow up SurveyTables
Table 6.-Percentage of private school stayers, mov1988-89, from 1990-91 to 1991-92, and
ers, and leavers, by selected school characteristics: From 1987-88 tofrom 1993-94 to 1994-95
Base year's schoolcharacteristics
From 1987-88 to 1988-89 From 1990-91 to 1991-92 From 1993-94 to 1994-95Stayers Movers Leavers Stayers Movers Leavers Stayers Movers Leavers
Total
School levelElementarySecondaryCombinedNot reported
School sizeLess than 150150-299300-499500-749750 or moreNot reported
Minority statusLess than 5%5 to 19%20 to 49%50% or moreNot reported
Community typeCentral cityUrban fringe/large townRural/small town
RegionNortheastMidwestSouthWest
77.8
77.081.375.978.7
64.479.680.384.9
82.278.7
77.682.271.869.678.7
78.581.575.673.4
% 9.5 %
10.96.98.5
10.0
16.28.49.55.94.91
10.0
9.27.49.3
16.810.0
11.18.68.89.3
12.7
12.111.815.611.3
19.412.110.29.2
12.811.3
13.210.318.913.611.3
10.49.9
15.617.3
% 81.1
81.284.179.780.1
72.679.486.485.591.080.1
81.282.082.476.780.1
81.0
83.078.7
83.183.677.381.7
% 6.6
7.44.96.75.3
10.36.85.94.72.35.3
7.35.85.3
10.25.4
6.3
6.47.4
5.46.76.78.1
%
1
12.3
11.411.013.614.6
17.013.87.79.86.7
14.6
11.512.212.213.114.6
12.7
10.613.9
11.59.7
16.010.2
%
1
82.3
83.783.079.182.8
76.079.684.389.689.682.8
83.984.877.075.882.8
83.4
81.980.0
84.084.381.578.3
% 5.8
5.85.56.05.5
7.98.03.23.34.25.5
5.14.27.4
10.95.5
5.7
5.56.4
7.15.94.16.7
% 11.9 %
10.511.514.911.6
16.212.412.5
7.1
6.211.6
11.011.115.613.211.6
10.9
12.613.6
8.99.8
14.515.0
Community types for 1987-88,1990-91, and 1993-94 are not comparable. In the 1987-88 SASS, respondents reported whether they lived ina rural, suburban, urban or other type of community. In the 1990-91 and 1993-94 SASS, the community type of the school was defined byLOCALE codes created by Johnson. Johnson, F. (1989), 'Assigning Type of Locale Codes to the 1987-88 CCD Public School Universe",Technical Report, Data Series: SP-CCD-87188-7.4, CS 89-194 (Washington, DC: U.S. Department of Education, National Center forEducation Statistics).'Coefficient of variation between 30% and 50%. See technical notes.
NOTE: Percents may not add to 100% due to rounding. "Not reported" data in this table are due to total survey nonresponse from some schools in
the 1987-88 or 1990-91 SASS. Base years in this table are 1987-88,1990-91, and 1993-94. Stayers are teachers who were teaching in thesame school in the current school year as in the base year. Movers are teachers who were still teaching in the current school year but had movedto a different school after the base year. Leavers are teachers who left the teaching profession after the base year.
SOURCE: U.S. Department of Education, National Center for Education Statistics, Teacher Followup Survey, 1988-89,1991-92 and 1994-95.
BEST COPY AVAILABLE
21 9
1994-95 Teacher Follow up SurveyTables
Table 7.--Movement of base year teachers across sector: From 1987-88 to 1988-89,from 1990-91 to 1991-92, and from 1993-94 to 1994-95
TFS sector
Public PrivateFrom 87-88
to 88-89From 90-91
to 91-92From 93-94
to 94-95From 87-88
to 88-89From 90-91
to 91-92From 93-94
to 94-95
Total
SectorPublicPrivateNot reported
100.0
92.32.65.1
%
1
100.0
94.35.7
*
% 100.0 %
95.74.31
100.0
46.746.8
6.4
%
1
100.0
47.252.8
% 100.0 %
52.447.6
The 1987-88 data were not imputed; 1990-91 and 1993-94 data were imputed.'Coefficient of variation between 30% and 50%. See technical notes.
NOTE: Percents may not add to 100% due to rounding. Base years in this table are 1987-88,1990-91, and 1993-94.
SOURCE: U.S. Department of Education, National Center for Education Statistics, Teacher Followup Survey,1988-89,1991-92 and 1994-95.
10
22

1994-95 Teacher Followup SurveyTables
Table 8.--Current primary occupational status of base year teachers who left the teachingprofession: 1988-89,1991-92, and 1994-95
Public PrivatePrimary occupational status 1988-89 1991-92 1994-95 1988-89 1991-92 1994-95
Total
Retired
Homemaking and/or child rearing
Working in an elementary or secondaryschool with an assignment other thanteaching
Working in an occupation outside ofelementary or secondary education
Other
Attending a college or university
Disabled
100.0
24.8
27.2
17.2
17.8
6.8
5.5
0.7
% 100.0
33.3
18.6
15.1
13.5
11.8
6.7
1.0
%
1
100.0
27.1
16.2
21.2
20.4
11.3
2.2
1.7
%
1
100.0
5.7
29.6
9.2
35.2
10.0
10.0
0.3
%
2
100.0
8.4
19.3
6.2
35.8
18.8
11.0
0.6
%
1
100.0
10.8
17.1
11.9
34.1
15.7
8.6
1.8
%
2
1Coefficient of variation between 30% and 50%. See technical notes.2Coefficient of variation greater than 50%. See technical notes.
NOTE: Percents may not add to 100% due to rounding. Similar estimates across tables 8 through 11 may vary due to thereference period for different survey items. Tables 8 and 9 reflect the former teachers reported status in the followup year.Table 10 shows data on the factors that affected the former teachers' decisions to leave the classroom. Table 11 is based on allteachers' base-year expectations for the next year. Base years in this table are 1987-88,1990-91, and 1993-94.
SOURCE: U.S. Department of Education, National Center for Education Statistics, Teacher Followup Survey, 1988-89,1991-92and 1994-95.
23 11

1994-95 Teacher Followup SurveyTables
Table 9. -- Current primary occupational status of base year teachers who left the teachingprofession and are working in an occupation outside of elementary or secondaryeducation: 1988-89,1991-92, and 1994-95
JobPublic Private
1988-89 1991-92 1994-95 1988-89 1991-92 1994-95
Total
Employee of a private company,business, or individual for wages,salary, or commission
Federal/State/Local governmentemployee
Self-employed in own business,professional practice, or farm
Working without pay in a familybusiness or farm
100.0
62.5
20.3
16.5
% 100.0
69.3
18.8
11.9
%
1
100.0
70.3
21.2
8.4
% 100.0
74.4
11.8
12.4
1.4
%
2
100.0
71.1
10.4
18.0
0.0
%
1
100.0 %
76.2
9.1 1
13.8
--Too few cases for a reliable estimate.'Coefficient of variation between 30% and 50%. See technical notes.2Coefficient of variation greater than 50%. See technical notes.
NOTE: Percents may not add to 100% due to rounding. This table is based on those former teachers working in an occupation outsideof elementary or secondary education (weighted 1987-88 public n=23,522; private n=13,853; weighted 1990-91 public n=17,622; private n=15,555).Similar estimates across tables 8 through 11 may vary due to the reference period for different survey items. Tables 8 and 9 reflect the formerteachers reported status in the followup year. Table 10 shows data on the factors that affected the former teachers' decisions to leave the classroom.Table 11 is based on all teachers' base-year expectations for the next year. Base years in this table are 1987-88, 1990-91, and 1993-94.
SOURCE: U.S. Department of Education, National Center for Education Statistics, Teacher Followup Survey, 1988-89, 1991-92 and 1994-95.
BEST COPY AVAILABLE
124

1994-95 Teacher Followup SurveyTables
Table 10. - -Main reason why base year teachers left the teaching profession: 1988-89,1991-92,and 1994-95
Public PrivateReason 988-89 1991-92 1994-95 1988-89 1991-92 1994-95
Total
To retire
Pregnancy/child rearing
Family or personal move
School staffing action
Dissatisfied with teaching as acareer
To pursue another career
To take courses to improve careeropportunities in the field ofeducation
Other family or personal reason
Health
For better salary or benefits
To take a sabbatical or otherbreak from teaching
To take courses to improve careeropportunities outside the fieldof education
Not reported
100.0
22.3
18.9
8.7
5.8
8.9
13.4
3.4
4.8
2.2
4.5
5.4
1.4
0.5
%
2
100.0
30.4
10.9
10.0
9.8
8.3
7.8
6.3
5.7
3.7
3.6
2.1
1.5
**
%
1
1
100.0
27.4
14.3
10.1
3.2
5.3
12.1
6.1
6.5
4.7
6.5
3.4
0.5
**
%
1
1
100.0 %
5.5
21.1
17.7
7.0
6.6
10.6
7.2
6.6
1.51
9.1
4.5 1
1.8 1
0.8 1
100.0
8.1
11.4
15.8
10.9
4.9
15.9
4.9
11.4
3.0
7.2
2.1
4.4
**
%
1
1
1
100.0
9.3
10.2
16.2
8.2
5.0
16.3
6.3
11.1
4.0
7.7
4.9
0.8
%
2
The 1987-88 data were not imputed; 1990-91 and 1993-94 data were imputed.1Coefficient of variation between 30% and 50%. See technical notes.2Coefficient of variation greater than 50%. See technical notes.
NOTE: Percents may not add to 100% due to rounding. Similar estimates across tables 8 through 11 may vary due to thereference period for different survey items. Tables 8 and 9 reflect the former teachers reported status in the followup year.Table 10 shows data on the factors that affected the former teachers' decisions to leave the classroom. Table 11 is based on allteachers' base-year expectations for the next year. Base years in this table are 1987-88,1990-91, and 1993-94.
SOURCE: U.S. Department of Education, National Center for Education Statistics, Teacher Followup Survey, 1988-89,1991-92and 1994-95.
2513

1994-95 Teacher Follow up SurveyTables
Table 11.-What base year teachers expected their main activity would be during the next schoolyear,by current teaching status: 1987-88,1990-91, and 1993-94
ActivityCurrent teachers Former teachers
1987-88 1990-91 1993-94 1987-88 1990-91 1993-94
Total public 100.0 % 100.0 % 100.0 % 100.0 % 100.0 % 100.0 %
Teaching any of grades K-12 93.8 95.8 96.4 17.7 14.7 14.5
Working in non-teaching occupation
in education 0.9' 1.2 0.8 17.7 15.5 22.2
Retired 1.3 1.2 1.1 20.5 31.7 25.7
Homemaking and/or child rearing 0.5 1 0.8 0.5 15.3 9.6 12.8
Working outside the field of education 0.9 0.4 0.6 13.2 10.5 9.4
Attending a college or university 0.3 1 0.3 1 0.3 1 4.2 4.0 1 3.0
Unemployed and seeking work 0.2 1 0.2 1 0.02 1.0 1.1 1 1.9'
Teaching at pre-K or post-sec level 0.12 0.12 0.2 1 2.6 2.9 1 2.1
Other 1.5 0.11 0.2 2 7.3 10.0 8.4
Military 0.0 0.0 0.0 0.0 0.0
Not reported 0.5 .., ... 0.5 1 **
Total private 100.0 % 100.0 % 100.0 % 100.0 % 100.0 % 100.0 %
Teaching any of grades K-12 88.9 92.7 95.2 12.3 16.1 15.5
Working in non-teaching occupationin education 1.4 1 1.2 1 1.2 1 8.2 9.2 12.6
Retired 0.62 0.32 0.2 2 5.0 6.6 11.3
Homemaking and/or child rearing 2.6 1.6 1.4 26.0 14.7 14.1
Working outside the field of education 1.6 1 1.2 0.7 21.1 22.4 24.1
Attending a college or university 1.02 1.3 0.8 9.4 7.3 4.9
Unemployed and seeking work 0.11 0.8 1 - 1.7 1 3.3 1 0.6 1
Teaching at pre-K or post-sec level 2 0.4' 1.6 6.2 1 6.8
Other 2.8 0.6 0.3 1 13.8 14.0 9.5
Military 0.0 0.0 0.0
Not reported 0.7 2 ** ** 0.6 2
-Too few cases for a reliable estimate.
**The 1987-88 data were not imputed; 1990-91 and 1993-94 data were Imputed.
'Coefficient of variation between 30% and 50%. See technical notes.
=Coefficient of variation greater than 50%. See technical notes.
NOTE: Percents may not add to 100% due to rounding. Similar estimates across tables 8 through 11 may vary due to the reference period fordifferent survey items. Tables 8 and 9 reflect the former teachers reported status in the followup year. Table 10 shows data on the factors thataffected the former teachers' decisions to leave the classroom. Table 11 is based on all teachers' base-year expectations for the next year.Base years in this table are 1987-88,1990-91, and 1993-94.
SOURCE: U.S. Department of Education, National Center for Education Statistics, Teacher Followup Survey, 1988-89,1991-92 and 1994-95.
BEST COPY AVAILABLE
14
26

1994-95 Teacher Followup SurveyTables
Table 12.-Percentage of base year teachers who reported "dissatisfaction with teaching as a career" asone of three main reasons for leaving the profession, by main area of dissatisfaction: 1988-89,1991-92, and 1994-95
Public PrivateArea of dissatisfaction 1988-89 1991-92 1994-95 1988-89 1991-92 1994-95
Total 100.0 % 100.0 % 100.0 % 100.0 % 100.0 % 100.0 %
Inadequate support fromadministration 30.2 24.9 15.3 23.3 16.1 1 12.5
Poor student motivation to learn 20.3 1 18.8 17.6 1 13.0' 21.2' 5.71
Intrusions on teaching time ++ 10.8 2 4.5 1 ++ 2.7 2
Lack of control over own classrooms 2.5 12 4.9 1
Student discipline problems 9.0 9.4 17.9 17.9 4.5 2 10.5
Inadequate time to prepare lesson pla ++ 5.5 2 2.11 ++ 5.2 1 5.9 2
Poor opportunity for professionaladvancement 9.4 1 5.3 3.5 1 6.9 2 14.6 1
Lack of influence over schoolpolicies and practices 7.9 4.3 6.6 2.7 2 2 6.5 1
Lack of community support for schools ++ 3.0 2 ++ ++ 0.0 ++
Unsafe working environment 1.1 2 2.8 2 ++ 0.0 ++
Interference from others regardingwhat I taught ++ 2.0' ++ ++ 1.2 2 ++
Class sizes too large 3.5' 1.4 1 1.2 1 2.9 2
Generally poor working conditions 4.4 1.2' ++ 8.4 1 ++
Poor salary 8.2 0.7 1 10.7 1 15.8 17.4 1 8.4'
Lack of professional competence ofcolleagues 1.6 2 0.4 2 ++ 3.0 2 ++
Lack of recognition and support fromadministration ++ ++ 13.8 ++ ++ 30.2
Lack of resources and materials/equipment for your classroom ++ ++ 1.7 2 ++ ++ 0.0
Not reported 2.0 2 * 5.2 2
--Too few cases for a reliable estimate.++Not asked on either the 1988-89, 1991-92, or 1994-95 Teacher Followup Survey.
The 1987-88 data were not imputed; 1990-91 and 1993-94 data were imputed.'Coefficient of variation between 30% and 50%. See technical notes.'Coefficient of variation greater than 50%. See technical notes.
NOTE: Percents may not add to 100% due to rounding or missing values in cells with too few cases. This table is based on those formerteachers who reported that being "dissatisfied with teaching as a career" was one of their three main reasons for leaving the teachingprofession (weighted 1987-88 public n=11,731; private n=2,597; weighted 1990-91 public n=25,792; private n=5,683). Base years in this tableare 1987-88, 1990-91, and 1993-94.
SOURCE: U.S. Department of Education, National Center for Education Statistics, Teacher Followup Survey, 1988-89, 1991-92 and 1994-95.
15
27

1994-95 Teacher Follow up SurveyTables
Table 13.-Percentage of base year teachers who reported "dissatisfaction with previous school" as oneof three main reasons for changing schools, by main area of dissatisfaction: 1988-89,1991-92, and 1994-95
Area of dissatisfactionPublic Private
1988-89 1991-92 1994-95 1988-89 1991-92 1994-95
Total 100.0 % 100.0 % 100.0 % 100.0 % 100.0 % 100.0 %
Inadequate support fromadministration 45.9 45.6 28.9 50.9 42.4 18.0 1
Unsafe working environment 1.3 2 13.2 2 ++ ++
Lack of professional competence ofcolleagues 6.1 i 6.6' ++ 6.6' 3.6 2 ++
Class sizes too large 6.5 5.4' 0.0 0.0
Lack of community support for school ++ 4.9' ++ ++ ++
Poor student motivation to learn 6.3 1 3.6 2 10.1 2 0.0
Generally poor working conditions 6.8 3.4 1 ++ 4.4 2 8.0 2 ++
Student discipline problems 2.5 1 3.2 1 12.3 2.0 2
Interference from others regardingwhat I taught ++ 2.9 2 ++ ++ 6.5 2 ++
Lack of influence over schoolpolicies and practices 6.1 1 2.7 2 8.5' 2.6 2 7.1 2 2.8 2
Poor opportunity for professionaladvancement 12.2' 2.6 2 6.3 1 6.9 1 16.6 1 22.1 1
Lack of control over own classrooms 2.1 2 2.3 2 2.2 2
Poor salary 2.61 1.3 2 1.5 2 24.0 5.6' 10.8'
Inadequate time to prepare lesson pla ++ 1.2 2 1.6 2 ++ 0.0 0.0
Intrusions on teaching time ++ 0.9 2 ++ 0.0
Lack of recognition and support fromadministration ++ ++ 25.6 ++ ++ 39.2
Lack of resources and materials/equipment for your classroom ++ ++ 2.3 1 ++ ++ 3.5 1
Not reported 1.6 2 ** 1.0 2 *
--Too few cases for a reliable estimate.++Not asked on either the 1988-89, 1991-92, or 1994-95 Teacher Followup Survey.**The 1987-88 data were not imputed; 1990-91 and 1993-94 data were imputed.'Coefficient of variation between 30% and 50%. See technical notes.2Coefficient of variation greater than 50%. See technical notes.
NOTE: Percents may not add to 100% due to rounding or missing values in cells with too few cases. This table is based on those currentteachers who reported that being "dissatisfied with the previous school" was one of their three main reasons for leaving the school in which theyhad taught in 1987-88 or 1990-91 (weighted 1987-88 public n=42,956; private n=6,825; weighted 1990-91 public n=31,825; private n=5,204).Base years in this table are 1987-88, 1990-91, and 1993-94.
SOURCE: U.S. Department of Education, National Center for Education Statistics, Teachef Followup Survey, 1988-89, 1991-92 and 1994-95.
16 BEST COPY AVAILABLE
28

1994-95 Teacher Follow up SurveyTables
Table 14.- Percentage of public school teachers who think that each step is the most effective step that schools might taketo encourage teachers to
remain in teaching: 1988-89, 1991-92, and 1994-95
1988-89Step Stayers Movers Leavers
Total 100.0 % 100.0 % 100.0
Providing higher salaries or betterfringe benefits 64.4 61.0 46.1
Decreasing class size 5.5 5.6 6.4
Dealing more effectively with studentdiscipline and making schools safer 7.3 9.2 10.3
Giving teachers more authority in theschool and in their own classrooms 5.5 4.5 9.1
Reducing teacher worldoad 3.1 3.3 I 3.0
Reducing the paperwork burdenon teachers 3.3 2.5 5.0
Improving opportunities forprofessional advancement 2.8 4.5 5.8
Increasing parent involvementin the schools 1.4 1.5 1.3
Increasing standards for students'academic performance 1.3 1.6 I 2.8
Providing better resources andmaterials for classroom use 1.4 1.2 2.2
Giving special recognition tooutstanding teachers ++ ++ ++
Providing merit pay or other payincentives to teachers 1.7 1.2 4.2
Providing more support for new teachers(e.g., mentor teacher programs) 1.1 1.4 1.5
Providing teacher training in contentareas and instructional methods 0.5 ' 0.3 1 1.0
Improving opportunities forprofessional development ++ ++ ++
Providing tuition reimbursement forcoursework required for certificationor career advancement ++ ++ ++
Revising health insurance programto include stress reduction training(e.g., seminars, counseling) ++ ++ ++
Not reported 0.5 2.2 2 1.3-Too few cases for reliable estimate.++Not asked on either the 1988-89,1991-92, or 1994-95 Teacher Fdlowup Survey."The 1987-88 data we not imputed; 1990-91 and 1993-94 data were imputed.
'Coeffident of variation between 30% and 50%. See b3chrical notes.
2C.oeffldent of variation greater than 50%. See technical notes.
1991-92 1994-95Stayers Movers Leavers Stayers Movers Leavers
% 100.0 % 100.0 % 100.0 % 100.0 % 100.0 % 100.0 %
53.4 54.6 37.8 53.1 47.2 39.9
11.0 9.7 13.1 10.4 12.3 6.8
9.7 11.2 14.7 16.0 16.7 20.6
6.9 4.9 11.4 5.7 5.2 8.9
3.1 1.3 1 2.7 3.0 2.5 2.3
2.7 3.3 I 4.5 1.9 2.1 1.8
' 2.4 3.5 1 2.1 2.1 3.4 ' 4.7
2.2 2.7 I 2.9 1.1 1.4 2.0
1.9 1.1 I 2.2 1.1 1.9 2.6 2
2 1.7 2.7 1 2.4 1 1.2 2.5 1.2
1.5 1.4 2.2 0.7 I 1.1 I 1.0 '
1 1.2 0.6 ' 0.6 ' 0.6 1.0 ' 0.9 I
0.8 1 0.8 ' 1.9 ' 1.5 1.0 4.5 1
0.7 ' 1.4 ' 0.5 2 ++ ++ ++
++ ++ ++ 0.7 I 0.4 ' 1.6 I
0.7 0.8 I 0.4 ' 0.5 1.1 I 0.4 2
0.2 ' 0.0 2 0.5 2 0.3 ' - 0.6 2
NOTE: Percents may not add to 100% due to rounding. Base years In tis table are 1987-88,1990-91, and 1993-94. Stayers are teachers who were teachng inthe same
school In the current school year as in the base year. Movers are teachers who were stil Matting in the ctrrent school year but hadmoved to a different school after the base
year. Leavers are teachers who left the teacNng profession after the base year.
SOURCE: U.S. Department of Education, Nabortal Center for Education Statistics, Teacher Folowtri Survey, 1988-89,1991-92, end 1994-95.
BEST COPY AVAILABLE
2917

1994-95 Teacher Follow up SurveyTables
Table 15.-Percentage of private school teachers who think that each step is the most effective step that schools might take to encourage teachers toremain in teaching: 1988-89, 1991-92, and 1994-95
1988-89 1991-92 1994-95Step Stayers Movers Leavers Stayers Movers Leavers Stayers Movers Leavers
Total 100.0 % 100.0 .% 100.0 % 100.0 % 100.0 % 100.0 % 100.0 % 100.0 % 100.0 %
Providing higher salaries orbetter fringe benefits 64.7 51.8 51.4 58.0 37.0 38.0 59.2 56.5 40.5
Decreasing class size 3.3 6.9 2.4 5.3 7.9 4.8 5.4 4.6 5.6
Dealing more effectively with studentdiscipline and making schools safer 5.7 10.8 15.3 9.2 8.9 16.6 11.5 9.3 19.5
Giving teachers more authority in theschool and in their own classrooms 5.9 4.5 5.2 4.9 10.1 6.7 4.4 3.8 9.6
Reducing teacher worldoad 1.8 1 3.2 7.0 I 2.4 3.8 3.3 ' 3.0 3.2 ' 2.3
Reducing the paperwork burdenon teachers 2.6 ' 5.4 1 2.6 2.2 4.2 1 3.0 I 1.8 1.1 I 3.3 1
Improving opportunities forprofessional advancement 5.2 2.1 3.1 2.6 4.7 ' 14 1 1.8 4.9 2 14
Increasing parent involvementin the schools 1.3 1 2.5 1 3.0 1 2.5 3.2 ' 2.9 ' 1.5 1.4 2 2.5
Increasing standards for students'academic performance 2.0 1 1.0 ' 2.7 ' 3.3 4.9 6.0 1.5 4.2 2 3.1 1
Providing better resources andmaterials for classroom use 1.7 1.0' 0.9' 2.3 1.2 2 2.9 1 1.1 3.6 1 1.9 1
Giving special recognition tooutstanding teachers ++ ++ ++ 1.1 1
2 2.3 2 1.4 1.5 2 3.9 1
Providing merit pay or other payincentives to teachers 2.8 ' 2.3 1.7 1.9 1.6 2 1.9 2 2.5 0.9 1 1.3 1
Providing more support for new teachers(e.g., mentor teacher programs) ilia 2 3.4 2.4 2.1 2.4 1 1.6 1 1.8 3.1 ' 1.6 1
Providing teacher training in contentareas and instructional methods 0.8 2 0.6 ' 1.4 I 0.9 1 2.1 1 4.0 2 ++ 4-4. ++
Improving opportunities forprofessional development 4+ ++ ++ ++ ++ ++ 0.9 1 - 1.3 1
Providing tuition reimbursement forcoursework required for certificationor career advancement ++ ++ ++ 1.4 6.6 2 1.2 I 1.6 1.1 I
Revising health Insurance program toinclude stress reduction training(e.g., seminars, couseling) ++ ++ ++
Not reported 1.4 1 4.5 2 1.0 1
1.4 2 0.5'Mir tree oar
-Too few cases fora rellade estimate.++Not asked on either the 1988-89,1991-92, or 1994-95 Teacher Followtp Survey.
The 1987-88 data were not imputed; 1990-91 and 1993-94 data were Imputed.
'Coefficient of variation between 30% and 50%. See technical notes.
'Coefficient of variation weeder than 50%. See technical notes.
NOTE: Percents may not add to 100% Ore to rounding. Base years In Pis table are 1987-88,1990-91, and 1993-94. Stayers are teachers who were teacNng Inthe sameschool In the current school year as In the base year. Movers are teachers who were still tead-ing in the current school year but had moved to a different school after the baseyear. Leavers are teachers who left the teaching profession after the base year.
SOURCE: U.S. Department of Education, National Center for Education Statistics, Teacher Folloverp Survey, 1988-89,1991-92, and 1994-95.
BEST COPY AVAILABLE
18
30

1999-95 Teacher Followup SurveyTechnical Notes
I. Overview
The 1994-95 Teacher Followup Survey (TFS) was sponsored by the National Centerfor Education Statistics (NCES) of the U.S. Department of Education to update informationon teacher attrition and career patterns. The U.S. Bureau of the Census collected andprocessed the data.
The TFS is a survey of elementary and secondary school teachers who participated inthe Schools and Staffing Survey (SASS)' and is conducted in the school year following theSASS data collection. The sample for the 1994-95 TFS was selected from those teacherswho participated in the 1993-94 SASS; it consisted of all who left teaching within the yearafter SASS was administered and a subsample of those who continued teaching.
A. Purpose of the Survey
The major objectives of TFS are to:
Provide estimates of teacher attrition rates;
Examine the characteristics of those who stay in the teaching professionand those who leave;
Obtain data on occupations or other activities for those who leaveteaching and career information for those who are still teaching;
Update information on education, other training, and career plans;
Collect data on attitudes about the teaching profession and jobsatisfaction.
Congress, state education departments, federal agencies, private schoolassociations, teacher associations, and educational organizations have used data fromthe 1988-89 and 1991-92 TFS surveys.
B. Periodicity of Survey
The TFS was conducted in the 1988-89,1991-92, and 1994-95 school years(after the 1987-88,1990-91, and 1993-94 administrations of SASS, respectively).NCES currently plans to conduct the next survey in the 1999-2000 school year; it willcollect data from a subsample of teachers who participate in the 1998-99 SASS.
'For a complete description of the 1993-94 Schools and Staffing Survey, see 1993-94 Schools and StaffingSurvey: Data File User's Manual, Volume I: Survey Documentation, by Gruber, K., Rohr, C., and Fondelier,S., U.S. Department of Education, National Center for Education Statistics (NCES 96- 142 I).
31 19

1994-95 Teacher Follow up SurveyTechnical Notes
C. Target Populations
The target population for the 1994-95 TFS was the universe of elementary andsecondary school teachers who taught in schools that had a first grade and/or higher inthe United States during the 1993-94 school year. This population was divided intotwo componentsthose who left teaching after the 1993-94 school year (formerteachers) and those who continued teaching (current teachers).
The following terms are used in this publication and are defined as they applyto TFS:
Teacher. A teacher is any full-time or part-time school staff member whoteaches one or more regularly scheduled classes in any of grades K-12 (or comparableungraded levels).2 In addition to regular full-time teachers, the following types ofteachers are also included: (1) itinerant teachers, (2) long-term substitutes who fill therole of a regular teacher on a long-term basis, (3) administrators, counselors, librarians,or other professional or support staff who teach any regularly scheduled classes, and(4) other part-time teachers.
Leavers. Teachers who left the teaching profession after the 1993-94 schoolyear.
Movers. Teachers who were still teaching in the 1994-95 school year but hadmoved to a different school after the 1993-94 school year.
Stayers. Teachers who were teaching in the same school in the 1994-95school year as in the 1993-94 school year.
Out-of-Scope TFS teachers. Teachers who left the United States or who died.
The following definitions were used in the 1993-94 SASS; they describevariables included on each TFS respondent's record to identify the school where he/shetaught during the 1993-94 school year. They are also used in this publication.
2This definition was revised for the 1993-94 SASS and differs from the one used for previousadministrations of SASS and TFS. In previous SASS and TFS surveys, a teacher was defined as a school staffmember whose primary assignment was teaching in any of grades K-12 (or comparable ungraded levels).School staff whose primary assignment was something other than teaching were excluded, even if they taughtsome regularly scheduled classes.
20
32

1994-95 Teacher Follow up SurveyTechnical Notes
Census region. The four Census regions are:
Northeast - Maine, New Hampshire, Vermont, Massachusetts, RhodeIsland, Connecticut, New York, New Jersey, Pennsylvania
Midwest - Ohio, Indiana, Illinois, Michigan, Wisconsin, Minnesota,Iowa, Missouri, North Dakota, South Dakota, Nebraska, Kansas
South - Delaware, Maryland, District of Columbia, Virginia, WestVirginia, North Carolina, South Carolina, Georgia, Florida, Kentucky,Tennessee, Alabama, Mississippi, Arkansas, Louisiana, Oklahoma,Texas
West - Montana, Idaho, Wyoming, Colorado, New Mexico, Arizona,Utah, Nevada, Washington, Oregon, California, Alaska, Hawaii
Common Core of Data (CCD). The Common Core of Data (CCD) is a groupof surveys that collect public elementary and secondary education data from the 50states, the District of Columbia, and the U.S. territories (American Samoa, Guam,Puerto Rico, Virgin Islands, Northern Marianas). CCD is an annual survey thatcollects information about staff and students in public schools at the school, district,and state levels. Revenue and expenditure data are also collected at the state level.
Local education agency (LEA). LEAs, or public school districts, aregovernment agencies that employ elementary or secondary teachers and areadministratively responsible for providing public elementary/secondary instruction andeducational support services. Included are education agencies that do not operateschools but employ teachers, e.g., regional cooperatives that employ special educationteachers who teach in schools in more than one school district.
School, alternative. Alternative schools serve students whose needs cannot bemet in a regular, special education, or vocational school. They provide nontraditionaleducation and may serve as an adjunct to a regular school. They fall outside thecategories of regular, special education, and vocational education, although they mayprovide similar services or curriculum. Some examples of alternative schools are thosefor potential drop-outs, residential treatment centers for substance abuse (if theyprovide elementary or secondary education), and schools for chronic truants.
School, BL4. BIA schools are schools funded by the Bureau of Indian Affairs,U.S. Department of Interior. These schools may be operated by the BIA, a tribe, aprivate contractor, or an LEA (or school district).
21
33
1994-95 Teacher Follow up SurveyTechnical Notes
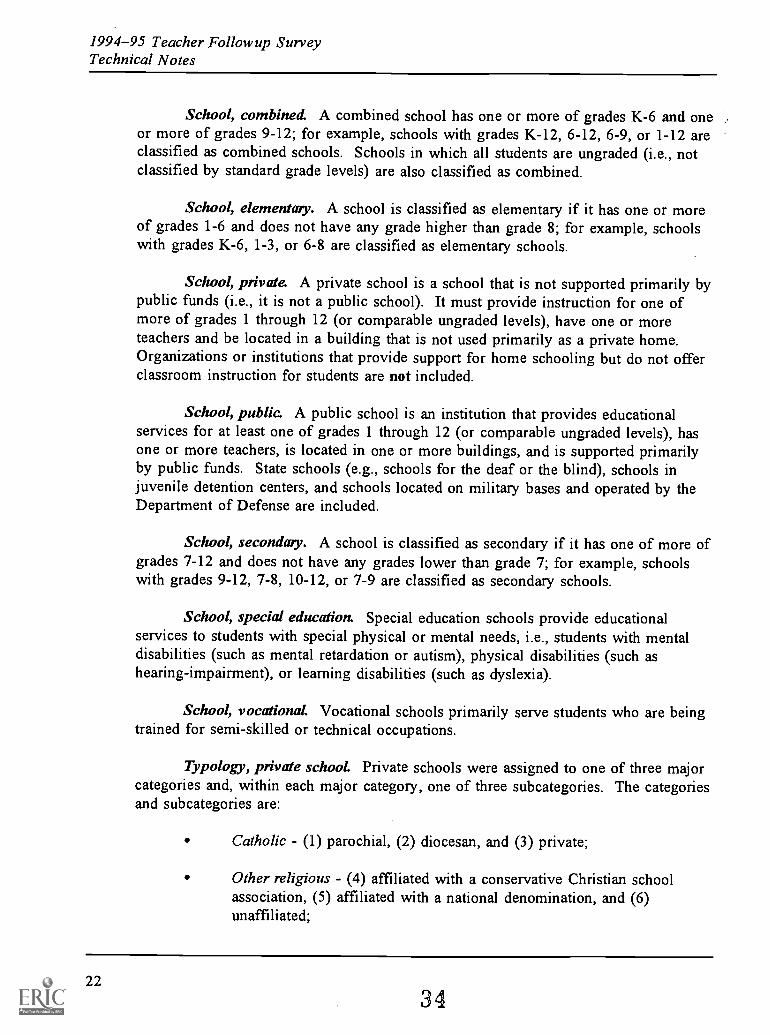
School, combined. A combined school has one or more of grades K-6 and oneor more of grades 9-12; for example, schools with grades K-12, 6-12, 6-9, or 1-12 areclassified as combined schools. Schools in which all students are ungraded (i.e., notclassified by standard grade levels) are also classified as combined.
School, elementary. A school is classified as elementary if it has one or moreof grades 1-6 and does not have any grade higher than grade 8; for example, schoolswith grades K-6, 1-3, or 6-8 are classified as elementary schools.
School, private. A private school is a school that is not supported primarily bypublic funds (i.e., it is not a public school). It must provide instruction for one ofmore of grades 1 through 12 (or comparable ungraded levels), have one or moreteachers and be located in a building that is not used primarily as a private home.Organizations or institutions that provide support for home schooling but do not offerclassroom instruction for students are not included.
School, public. A public school is an institution that provides educationalservices for at least one of grades 1 through 12 (or comparable ungraded levels), hasone or more teachers, is located in one or more buildings, and is supported primarilyby public funds. State schools (e.g., schools for the deaf or the blind), schools injuvenile detention centers, and schools located on military bases and operated by theDepartment of Defense are included.
School, secondary. A school is classified as secondary if it has one of more ofgrades 7-12 and does not have any grades lower than grade 7; for example, schoolswith grades 9-12, 7-8, 10-12, or 7-9 are classified as secondary schools.
School, special education. Special education schools provide educationalservices to students with special physical or mental needs, i.e., students with mentaldisabilities (such as mental retardation or autism), physical disabilities (such ashearing-impairment), or learning disabilities (such as dyslexia).
School, vocational. Vocational schools primarily serve students who are beingtrained for semi-skilled or technical occupations.
Typology, private school. Private schools were assigned to one of three majorcategories and, within each major category, one of three subcategories. The categoriesand subcategories are:
Catholic - (1) parochial, (2) diocesan, and (3) private;
Other religious - (4) affiliated with a conservative Christian schoolassociation, (5) affiliated with a national denomination, and (6)
unaffiliated;
22
34

1994-95 Teacher Follow up SurveyTechnical Notes
Nonsectarian - (7) regular, (8) special program emphasis, and (9) specialeducation.3
Teacher, itinerant. An itinerant teacher teaches at more than one school, e.g., amusic teacher who teaches three days per week at one school and two days per weekat another.
Ungraded students. Ungraded students are those who are not assigned to aparticular grade level (kindergarten, first grade, second grade, etc.); for example,special education centers and alternative schools often classify their students asungraded. Students in Montessori schools are also considered ungraded if the schoolassigns them to "primary" and "intermediate" levels instead of specific grades.
II. Sample Design
A. SASS Sampling Frames
1. Public Schools
The public school sampling frame was based on the 1991-92 schoolyear Common Core of Data (CCD). The CCD is collected annually by NCESfrom all state education agencies and is believed to be the most completepublic school listing available. The frame includes regular public schools,some schools on Department of Defense military bases, and nonregular schoolssuch as special education, vocational, and alternative schools. The frame alsoincluded 176 Bureau of Indian Affairs (BIA) schools.
2. Private Schools
The sampling frame for private schools was the 1991-92 Private SchoolSurvey (PSS).4 This data collection used two components to develop estimatesof the number of private schools in the United States. A list frame was theprimary private school frame and an area frame was used to identify schoolsnot on the list frame and thereby compensate for the undercoverage of the listframe.
'See M. McMillen and P. Benson, Diversity of Private Schools, Technical Report, NCES 92-082(Washington, D.C.: U.S. Department of Education, National Center for Education Statistics, 1991).
'U.S. Department of Education, National Center for Education Statistics, Private School Universe Survey,1991-92, (E. Gerald, M. McMillen, S. Kaufman) NCES 94-350.
23
35

1994-95 Teacher Follow up SurveyTechnical Notes
List Frame
The list frame used for the 1993-94 SASS private school sample wasthe same list used for the 1991-92 PSS. It consisted of approximately 25,051schools from the PSS universe, which was updated in the spring of 1993 byusing lists from 24 private school associations.
A rea Frame
The SASS area frame consisted of a list of private schools that had notbeen included on the PSS universe and had not been reported by private schoolassociations during the list frame updating operation. These schools werelocated in 123 selected PSUs5 throughout the United States.
For more information, see the technical report 1993-94 Schools andStaffing Survey: Sample Design and Estimation, by R. Abramson, C. Cole, S.Fondelier, B. Jackson, R. Parmer, S.Kaufman, (NCES 96-089).
Duplicate schools, as well as schools that did not meet the criteria for being in-scope for the survey (e.g., adult education centers, schools where the highest gradewas prekindergarten or kindergarten, and tutoring services) were eliminated from thefiles before sampling. The resulting number of public schools on the 1993-94 publicschool frame was 82,746 (9,956 were sampled); the resulting number of privateschools on the 1993-94 private school universe was 25,051 (3,315 were sampled).The list frame sample for 1993-94 SASS consisted of 3,162 schools. Additionalduplicate private schools were discovered on the PSS after sampling had taken place;these schools received a weighting adjustment to account for their increasedprobability of selection. Additional out-of-scope public and private schools weredetected after processing the sample schools' SASS school questionnaires. Theseschools were eliminated from further processing of the school samples and are not partof any SASS estimates of the number of schools.
B. SASS Stratification
1. Public Schools
The first level of stratification divided the universe of public schoolsinto four types: (A) BIA (Bureau of Indian Affairs) schools; (B) NativeAmerican schools (schools with 19.5% or more Native American students); (C)schools in Delaware, Nevada, and West Virginia (where it was necessary toimplement a different sampling methodology to select at least one school from
'A PSU is a primary sample unit, which is a geographic area consisting of one or more contiguouscounties or an independent city.
24
36

1994-95 Teacher Follow up SurveyTechnical Notes
each LEA in the state because of the small number of LEAs); and (D) all otherschools (i.e., all schools not included in A, B, or C).
For the second level of stratification, the type B schools were stratifiedby Arizona, California, Montana, New Mexico, Washington, and all other states(except Alaska, since most Alaskan schools have high Native Americanenrollment). The type C schools were stratified first by state and then by LEA.The type D schools were stratified by state (all states and the District ofColumbia, except Delaware, Nevada, and West Virginia).
Within each second level of stratification, regular schools were dividedinto three grade level strata (elementary, secondary, and combined schools),defined as follows:
Elementary - Lowest Grade 6 and Highest grade 5 8
Secondary - Lowest Grade 7 and Highest grade 12
Combined - Lowest Grade 6 and Highest grade > 8
Nonregular schools such as special education, vocational, technical,adult education (if part of in-scope school) or alternative/continuation schoolswere classified as combined schools.
2. Private Schools
For list frame private schools, the frame was partitioned into an initialset of 228 cells. The first level of stratification was school associationmembership:
(1) Military - membership in the Association of American Military Collegesand Schools;
(2) Catholic - affiliation as Catholic or membership in the National CatholicEducational Association or the Jesuit Secondary Education Association;
(3) Friends - affiliation as Friends or membership in the Friends Council onEducation;
(4) Episcopal - affiliation as Episcopal or membership in the NationalAssociation of Episcopal Schools;
(5) Hebrew Day - membership in the National Society for Hebrew DaySchoo1s;
(6) Solomon Schechter - membership in the Solomon Schechter DaySchools;
(7) Other Jewish - other Jewish affiliation;
3725

1994-95 Teacher Follow up SurveyTechnical Notes
(8) Missouri Synod - membership in the Lutheran Church, Missouri Synodschool association;
(9) Wisconsin Synod - membership in the Evangelical Lutheran Church -
Wisconsin Synod school association or affiliation as EvangelicalLutheran - Wisconsin Synod;
(10) Evangelical Lutheran - membership in the Association of EvangelicalLutheran Churches school association or affiliation as EvangelicalLutheran Church in America;
(11) Other Lutheran - other Lutheran affiliation;(12) Seventh-Day Adventist - affiliation as Seventh-Day Adventist or
membership in the General Conference of the Seventh-Day AdventistChurch;
(13) Christian Schools International - membership in Christian SchoolsInternational;
(14) American Association of Christian Schools - membership in theAmerican Association of Christian Schools;
(15) National Association of Private Schools for Exceptional Children -
membership in the National Association of Private Schools forExceptional Children;
(16) Montessori - membership in the American Montessori Society or otherMontessori association;
(17) National Association of Independent Schools - member of the NationalAssociation of Independent Schools;
(18) National Independent Private School Association - member of theNational Independent Private Schools;
(19) All else - member of any other association specified in the PSS oraffiliated with a group not listed above or not a member of anyassociation.
Within each association membership, schools were stratified by grade level(elementary, secondary, or combined). Within association/grade level, schools werestratified by four Census regions (Northeast, Midwest, South, or West).
C. ITS Stratification and Sample Allocation
The 1994-95 TFS is a survey of approximately 7,200 teachers interviewed inthe 1993-94 SASS Teacher Survey. As described earlier, the purpose of the 1994-95TFS was to measure teacher attrition rates one year after the 1993-94 SASS datacollection. In SASS, schools were selected first. Next, teachers were selected withineach sampled school. The TFS teachers were selected from the SASS teacher sample.The TFS sample is a stratified sample that was allocated to allow comparisons ofstayers, movers, and leavers within sector (public/private), experience groups, andlevel. Therefore, for the TFS, the responding 1993-94 SASS teachers were stratifiedby four variables (sector, teacher status, experience, teaching level) in the order shown:
26
38

1994-95 Teacher Followup SurveyTechnical Notes
1) Sector: (Public/Private School Indicator)
Public - teachers who taught in a public school system in the 1993-94 schoolyear;
Private - teachers who taught in a private school in the 1993-94 school year;
2) Teacher status:
Leavers - teachers in the 1993-94 school year who left the teaching professionprior to the 1994-95 school year;
Stayers - teachers in the 1993-94 school year who were still teaching in thesame school in the 1994-95 school year as they were in the previous schoolyear;
Movers - teachers in the 1993-94 school year who were still teaching in1994-95, but who were in a different school in the 1994-95 school year;
Don't know - teachers whose status was unknown (or was not reported) in1994-95 by staff at the school in which they taught in 1993-94.
3) Experience: (New/Experienced Teacher Indicator)
New - teachers who had three years or less teaching experience at the end ofthe 1993-94 school year;
Experienced - teachers who had more than three years of experience at the endof the 1993-94 school year;
The teacher status and the teacher's teaching experience was defined by theschool.
4) Teaching level:
Elementary - teachers who taught elementary students in the 1993-94 schoolyear regardless of the level of the school (elementary, secondary, or combined)in which they taught;
Secondary - teachers who taught secondary students in the 1993-94 school yearregardless of the level of the school (elementary, secondary, or combined) inwhich they taught.
3927

1994-95 Teacher Follow up SurveyTechnical Notes
The final TFS sample allocation is summarized in Table II-1.
Table 11-1.TES sample allocation6
Total New Experienced
Public 5,075 1,682 3,393
LeaversTotal 2,035 294 1,741Elementary 697 109 588Secondary 1,338 185 1,153
Non leavers 3,040 1,388 1,652Elementary
Total 1,624 692 932Movers 700 364 336Stayers 924 328 596
SecondaryTotal 1,416 696 720Movers 664 438 226Stayers 752 258 494
Private 2,097 838 1,259
LeaversTotal 641 223 418Elementary 343 119 224Secondary 298 104 194
Non leavers 1,456 615 841Elementary
Total 833 349 484Movers 290 112 178Stayers 543 237 306
SecondaryTotal 623 266 357Movers 209 86 123
Stayers 414 180 234
6"Don't know" strata cases are included in the "stayer" Categories of this table.
2840

1994-95 Teacher Follow up SurveyTechnical Notes
D. SASS Sample Selection
1. Public Schools
Before the sample of public schools was selected, the schools withineach stratum were sorted. To facilitate the calculation of LEA weights, it wasimportant to keep all schools within a stratum and Local Education Agency(LEA) together. To accomplish this, the first three digits of the ZIP code of allschools within a stratum and LEA were set equal to those of the first school inthe stratum and LEA.
After the ZIP code was recoded, non-BIA' schools within each stratumwere sorted by the following variables:
1) State;2) LEA metro status:
1 = Central City of a Metropolitan Statistical Area (MSA)2 = MSA, not Central City3 = Outside MSA
3) °Recoded LEA ZIP Code (The first three digits);4) CCD LEA ID number;5) Highest grade in school;6) School percent minority:
1 = < 5.5% or unknown2 = 5.5% and < 20.5%3 = > 20.5% and < 50.5%4 = 50.5% or more;
7) School enrollment; and8) CCD School ID (the CCD ID of the last school used.)
Within each stratum, non-BIA schools were systematically selectedusing a probability proportionate to size algorithm. The measure of size usedwas the square root of the number of teachers in the school as reported on theCCD file. Any school with a measure of size larger than the sampling intervalwas excluded from the probability sampling process and included in the samplewith certainty. This selection process produced a sample of 9,780 non-BIApublic schools.
'BIA schools were not sorted since they were designated to be in sample with certainty. All 176 BIAschools were in the 1993-94 SASS school sample.
29
41

1994-95 Teacher Follow up SurveyTechnical Notes
2. Private Schools
Within each stratum, private schools in the list frame were sorted on thefollowing variables:
1) State;2) Highest grade in school;3) Urbanicity:
1 = Large Central City2 = Mid-size Central City3 = Urban Fringe of Large City4 = Urban Fringe of Mid-size City5 = Large Town6 = Small Town7 = Rural
4) ZIP Code (The first two digits);5) 1991-92 PSS enrollment;6) PIN number (a unique number that identifies the school on the
PSS).
Within each stratum, private schools in the list frame weresystematically selected using a probability proportionate to size algorithm. Themeasure of size used was the square root of the 1991-92 PSS number ofteachers in the school. Any school with a measure of size larger than thesampling interval was excluded from the probability sampling process andincluded in the sample with certainty.
3. Teachers
Selecting the teacher sample in both public and private schools involvedthe following steps:
The selected schools were asked to provide teacher lists;
From the lists, 56,736 public school teachers and 11,548 privateschool teachers were selected.
The public and private teacher sample selections are described togetherbecause identical methodologies were used. The only differences were in theaverage number of teachers selected within a school.'
3042

1994-95 Teacher Followup SurveyTechnical Notes
Teacher Frame
Each selected school was asked to provide a list of their teachers withselected information for each teacher. Nine percent of the private schools andfour percent of the public schools did not provide teacher lists. A factor in theteacher weighting system was used to adjust for these nonparticipant schools.
The sample schools were asked to provide the following information foreach teacher listed:
Whether the teacher was new or experienced, where "new" wasdefined as three years or less of teaching experience and"experienced" was defined as having more than three years ofexperience;
Race/ethnicity;
Whether teacher taught bilingual or English as a SecondLanguage (ESL) classes;8
Main subject taught (General elementary, special education, andall others for elementary level teachers; math, science, English,social studies, vocational education, special education, and allothers for secondary teachers.)
The above information for each teacher in a selected SASS schoolcomprised the school teacher frame.
Within each selected school, teachers were stratified into one of fiveteacher types in the following hierarchical order:
1) Asian or Pacific Islander (API)2) American Indian or Aleutian or Eskimo (AIAE)3) Bilingual/ESL4) New5) Experienced
Within-School Teacher A llocation
First, the total number of sample teachers to be selected for each schoolwithout regard to strata was calculated assuming no teacher oversampling for
8In bilingual classes, subject matter (science, math, social studies, etc.) is taught by using a language otherthan English. In ESL classes, English is taught to students whose primary language is not English.
4331

1994-95 Teacher Follow up SurveyTechnical Notes
new teachers. Then, to allocate across the strata, public school teachers wereallocated to the new and experienced categories proportional to their numbersin the school. However, for private teachers, it was decided to oversample newteachers to ensure that there would be a sufficient sample of new teachers inthe TFS. (This was also done in 1990-91 SASS.)
Asian or Pacific Islander, American Indian or Aleutian or Eskimo, andbilingual teachers were oversampled at a rate to ensure a set number of eachgroup was selected. To make sure a school was not overburdened, themaximum number of teachers per school was set at 20. When the number ofsample teachers exceeded 20 in a school, the Asian or Pacific Islander,American Indian or Aleutian or Eskimo, and bilingual teachers wereproportionally reduced to meet the maximum requirement.
Within each teacher stratum, secondary teachers were sorted by teacher'smain subject taught (as reported by the principal on the SASS Teacher List);and elementary teachers were sorted by general elementary, special education,or other teaching assignment. When combined schools had both elementaryand secondary teachers, the teachers were sorted by grade level/main subjecttaught. This method was used to assure a good distribution of teachers bymain subject taught.
Within each school and teacher stratum, teachers were selectedsystematically with equal probability.
A total of 68,284 teachers were selected for SASS (62,770 new andexperienced; 1,735 Asian Pacific Islander; 1,661 American Indian or Aleutianor Eskimo; and 2,118 bilingual/ESL). Table 11-2 shows the number of selectedteachers in SASS sample by teacher type and sector.
Table 11-2.Number of selected teachers in SASS sample, by teacher type and sector
Teacher type Public Private Total
American Indian/Aleut/Eskimo 1,525 136 1,661
Asian/Pacific Islander 1,483 252 1,735
Bilingual/ESL 2,024 94 2,118
New 4,799 2,182 6,981
Experienced 46,905 8,884 55,789
Total 56,736 11,548 68,284
32
44

1994-95 Teacher Follow up SurveyTechnical Notes
E. TFS Sample Selection
Sorting. Within each public TFS stratum, teachers who responded to the1993-94 SASS Teacher Survey were sorted by teacher subject, Census region,urbanicity, school enrollment, and SASS teacher control number. Within each privateTFS stratum, responding teachers were sorted by teacher subject, associationmembership (list frame), affiliation (area frame), urbanicity, school enrollment, andSASS teacher control number.
Sample Selection. After they were sorted, teachers were selected within eachstratum using a probability proportional to size sampling procedure. The measure ofsize was the 1993-94 SASS intermediate teacher weight, which is the product of theBasic Weight, Sampling Adjustment Factor, School Nonresponse Factor, TeacherNoninterview Factor, and the First-Stage Ratio Adjustment Factor. (See Table II.1 formore details on TFS Sample allocation.)
For more information about weights and estimation in SASS, see the technicalreport 1993-94 Schools and Staffing Survey: Sample Design and Estimation, by R.Abramson, C. Cole, S. Fondelier, B. Jackson, R. Parmer, S. Kaufman, (NCES96-089).
111. Data Collection
A. Time Frame of the Survey
The Bureau of the Census collected the 1994-95 TFS data during the 1994-95school year. Table III-1 summarizes the specific data collection activities and the timeframe in which each occurred.
Table 111-1.Data collection time schedule
Activity Month of Activity
Advance letters mailed to LEAs and state administrators August 1994
Teacher Status Forms (TFS-1) and letters mailed to sample schools September 1994
Reminder postcards mailed to sample schools September 1994
Telephone followup of Teacher Status Forms not returned by schools October-November 1994
Initial mailing of leaver/stayer questionnaires (TFS-2 and TFS-3) January 1995
Second mailing of leaver/stayer questionnaires (TFS-2 and TFS-3) February 1995
Telephone followup of mail questionnaire nonrespondents March-May 1995
4533

1994-95 Teacher Follow up SurveyTechnical Notes
B. Data Collection Procedures
The U.S. Bureau of the Census collected TFS data in two phases:
Phase 1 - In September 1994, the Census Bureau mailed teacher statusforms (TFS-1) to schools that had provided lists of teachers for 1993-94 SASS.On this form, the school principal (or other knowledgeable school staffmember) was asked to report the current occupational status of each teacherwho participated in the 1993-94 SASS, by indicating whether he/she was stillat the school in a teaching or nonteaching capacity, or had left the school toteach elsewhere or for a non-teaching occupation. One week after the TFS-1mailout, reminder postcards were mailed to the sample schools. In October andearly November, Census interviewers telephoned schools that had not returnedthe TFS-1 to obtain the requested information.
If the school staff indicated a sample teacher had moved, the CensusBureau also tried to obtain address correction information for the sampleteacher's home address through the post office.
Phase 2 - In January 1995, the TFS questionnaires were mailed toselected teachers and former teachers. The Questionnaire for Former Teachers(TFS-2) was sent to sample persons reported by school administrators as havingleft the teaching profession. The Questionnaire for Current Teachers (TFS-3)was sent to sample persons who were reported as still teaching at theelementary or secondary level. When home addresses were available, thequestionnaires were mailed there. Otherwise, they were mailed to the sampleteacher's 1993-94 school.
In February, the Census Bureau mailed a second questionnaire to eachsample person who had not returned the first questionnaire. Also, for thosewho returned the first form and indicated that it did not apply to them (becausetheir status was incorrectly reported by their 1993-94 school), the appropriatequestionnaire was mailed to them. For example, if a sample person who wasteaching in another school received the questionnaire for former teachers (TFS-2), he/she was instructed to return the questionnaire; the Census Bureau sentthe correct questionnaire (TFS-3 for current teachers) to the respondent duringthe second mailout.
In late March 1995, Census interviewers began calling sample personswho had not returned a mail questionnaire. In addition to these nonresponsefollowup cases, some "nonmailable" cases (cases with incomplete addresses)were assigned for telephone followup. If the interviewers were unable tocontact a sample teacher through a contact person (two contact persons hadbeen listed by the sample teacher on the SASS form as knowing how or where
34
46

1994-95 Teacher Followup SurveyTechnical Notes
to get in touch with him or her) or through directory assistance, they called thesample person's 1993-94 school to obtain information about the person'scurrent address or employer. Telephone followup of nonrespondents ended inMay 1995.
During the telephone followup, the interviewers used form TFS-4,Telephone Questionnaire for the Teacher Followup Survey 1994-95, to collectthe data. This form was a combination of the TFS-2 and the TFS-3questionnaires; i.e., data for a current or a former teacher could be recorded onthis single form.
IV. Edit Procedures
A. Clerical Edit
Questionnaires returned by individual respondents and those completed byCensus interviewers during telephone followup were sent to the Census Bureauprocessing center in Jeffersonville, Indiana. Upon receipt, clerks assigned codes toeach questionnaire to indicate its statuse.g., complete interview, refusal, deceased.Then they performed a general clerical edit that included reviewing all entries forlegibility and making corrections, e.g., changing "one" to "1" and rounding fractions towhole numbers. For the TFS-2 (Questionnaire for Former Teachers), the clerks alsoassigned industry and occupation codes' to the respondent's current job (questionnaireitem 3). For TFS-3 (current teachers) respondents teaching in a different state, theyassigned a state FIPS code to the respondent's new state (questionnaire item 13).
After the clerical edit, the questionnaires were batched by type and interviewstatus (i.e., interviews, noninterviews, out-of-scope for survey) for data keying. Dataentry personnel were instructed to correct all errors identified during the keyingoperation and to refer problem cases to their supervisor. To assure the quality of thedata, all keying was independently verified at the 100 percent level.
B. Preliminary ISR Classification
After keying data, the next step in processing was to make a preliminarydetermination of each case's interview status (ISR)i.e., whether it was an interview,a noninterview, or out-of-scope for the survey. In general, those cases with "out-of-scope" check-in codes (assigned by clerks when questionnaires were received at theprocessing center) were classified as out-of-scope (ISR=3) for the preliminary ISR.
9The lists of industry and occupation codes used for TFS-2 item 3 are provided in Appendix D of thispublication.
35
47
1994-95 Teacher Follow up SurveyTechnical Notes
Otherwise, cases with data entries were classified as interviews (ISR=1) and those withno data were classified as noninterviews (ISR=2).
C. Computer Edit
After the assignment of the preliminary ISR code, the file was divided into twofiles: (1) former teachers (leavers) and (2) current teachers (stayers and movers).Then these files were submitted to a computer edit that consisted of a range check, aconsistency edit, and a blanking edit. Only records classified as interviews in thepreliminary ISR were edited.
The range check deleted entries that were outside the range of acceptablevalues.
The consistency edit identified inconsistent entries within each record and,whenever possible, corrected them; if they could not be corrected, the entries weredeleted.
Example: If the respondent answered "Yes" in Item 9 to indicate that he/she hadearned a college degree during the past 12 months but recorded a datein Item 10 (month and year of degree) that was later than June 1995,the "Yes" response in Item 9 was changed to "No" in the consistencyedit and the entry in Item 10 was deleted.
The blanking edit deleted extraneous entries and assigned the "not answered"(.N) code to items that should have been answered but were not.
D. Final Interview Status Edit
After the range check, consistency edit, and blanking edit were completed, therecords were edited to determine whether the case was eligible for inclusion in thesurvey and, if so, whether sufficient data had been collected for the case to beclassified as an interview. An interview status recode (ISR) value was then assignedto each case as a result of the edit:
A case was classified as out-of-scope (ISR=3) if the respondent haddied or moved out of the United States.
A TFS-2 case (former teacher) was classified as an interview (ISR=1) iffour of these items were reported:Item 1 - Main occupational statusItem 4 - Full-time/part-time employee statusItem 5 - Earnings at new jobItem 8 - Main activity for next year
36 48

1994-95 Teacher Followup SurveyTechnical Notes
Item 18 - Whether respondent plans to return to teachingItem 23a - Main reason for leaving teaching profession
A TFS-3 case (current teacher) was classified as an interview (ISR=1) ifsix of these items were reported:Item 5a - Full-time/part-time teaching statusItem 7a - Main teaching assignment fieldItem a - Whether respondent is certified in main teaching assignmentfieldItem 9a - Whether respondent is certified in other teaching assignmentfieldItem 10 - Grade levels of students taught by respondentItem 11 - Type of community where school is locatedItem 12 - Whether respondent has changed schoolsItem 28 - Main activity for next yearItem 51b(1) - Teaching salaryItem 51c - Total earned income
A case was classified as a noninterview (ISR=2) if the conditions forout-of-scope cases and interview cases were not met.
Table IV-1.Number of 1994-95 Teacher Followup Survey teachersin sample, by sector and interview status
Teachers in sample Interviewed Not interviewed Out-of-scope
Public 4,528 463 34
Current teachers 2,798 281 2
Former teachers 1,730 182 32
Private 1,751 330 17
Current teachers 1,175 232 0
Former teachers 576 98 17
BIA 44 6 0
NOTE: Noninterviews and out-of-scope teachers are not included in the TFS analytic or public-use datafiles.
SOURCE: U.S. Department of Education, National Center for Education Statistics, "Teacher Followup Survey,
1994-95," (TFS-2 Former Teachers Questionnaire, and TFS-3, Current Teacher Questionnaire) unpublished
tabulations.
37
49

1994-95 Teacher Follow up SurveyTechnical Notes
V. Response Rates
A. Survey Response Rates
Table V-1 summarizes the weighted and unweighted response rates for the TFS(shown in percentages).
Table V-1.Response rates, by sector and teaching status, unweighted and weighted
Interviews
Sampled Teachers Unweighted Weighted
Public 90.7 92.3Current teachers 90.9 92.5Former teachers 90.5 89.2
Private 84.1 87.2Current teachers 83.5 87.2Former teachers 85.5 87.6
BIA 88.0 99.5Current teachers 95.5 99.9Former teachers 82.1 88.9
Total 88.8 91.6Current teachers 88.6 91.8Former teachers 89.1 88.8
38
50

1994-95 Teacher Followup SurveyTechnical Notes
Table V-2.Survey response rates for 1993-94 SASS Teacher List,1993-94 Schools and Staffing Teacher Survey, and 1994-95Teacher Followup Survey, weighted
Sector
Public Private
ComponentsCurrent
Teachers'°Former
TeachersCurrent
TeachersFormer
Teachers
SASS Teacher Listresponse rate" 95.0 91.0
SASS Teacher Surveyresponse rate12 88.2'3 80.2'4
Teacher Followup Surveyresponse rate's 92.5 89.2 87.2 87.6
A cumulative overall response rate is the product of the survey response rates shown in TableV-2; (SASS Teacher List response rate) (SASS Teacher Survey response rate) (TFS Teacherresponse rate). The cumulative overall response rates by sector and teacher status for the1994-95 TFS are:
Public current teachers: (.95)(.882)(.925)(100)=80.0.Public former teachers: (.95)(882)(892)(100)=74.7.Private current teachers: (.91)(.832)(.872)(100) =66.0.Private former teachers: (.91)(832)(876)(100)=66.3.
'Includes stayers and movers.
"Percent of schools providing teacher lists for the 1993-94 SASS sample, unweighted.
'Percent of eligible sample teachers responding to the 1993-94 SASS Teacher Survey, weighted.
"This rate does not include the 5 percent of the public schools which did not provide teacher lists.
"This rate does not include the 9 percent of the private schools that did not provide teacher lists.
°Percent of eligible sample teachers responding to the 1994-95 Teacher Followup Survey, weighted.
5139

1994-95 Teacher Follow up SurveyTechnical Notes
B. Item Response Rates
Table V-3 is a brief summary of the unweighted item response rates for the1994-95 TFS questionnaires. A response rate for an item is defined as the number ofrecords with valid responses to that item divided by the number of eligible respondentsfor the item.
Table V-3.Summary of Unweighted Item Response Rates
Former teachers Current teachers
Range of item response rates 78-100% 52-99%
Percentage of items with a response rate of90% or more 92.6% 90.4%
Percentage of items with a response rate lessthan 80% 1.2% 4.1%
Items" with a response rate less than 80% 7 9b, 9c, 48i, 51a(1), 51a(2),51a(3), 51b(3), 51b(4), 57b
VI. Imputation
For questionnaire items that should have been answered but were not, values wereimputed by using data from (1) other items on the questionnaire, (2) the 1993-94 SASSTeacher Survey record for the same respondent, and (3) data from the record for a respondentwith similar characteristics (commonly known as the nearest neighbor "hotdeck" method forimputing for item nonresponse").
For some incomplete items, the entry from another part of the questionnaire, the SASSTeacher Survey record, or the data record for a similar case was directly imputed to completethe item; for others, the entry was used as part of an adjustment factor with other data on theincomplete record.
"The questionnaire wording for these items can be found in Appendices B and C of this publication.
"Ka lton, G. and Kasprzyk, D. (1982), "Imputing for Missing Survey Responses," Proceedings of the Sectionon Survey Research Methods, American Statistical Association, 22-31; Ka lton, G., Compensating for MissingSurvey Data. Ann Arbor: Survey Research Center, University of Michigan, 1983; Kalton, G. and Kasprzyk, D.(1986), "The Treatment of Missing Survey Data," Survey Methodology, Vol. 12, No.1, pp. 1-16; Little, R. J. A.and Rubin, D. B. (1987), Statistical Analysis with Missing Data, John Wiley and Sons; Madow, W. G., Olkin,I., and Rubin, D. B. (eds.) 1983, Incomplete Data in Sample Surveys, Vols. 1, 2, and 3, New York, AcademicPress.
40

1994-95 Teacher Follow up SurveyTechnical Notes
The procedures described above were carried out by computer processing. However,for a few items there were cases where entries were clerically imputed. The data record,SASS teacher file record, and in some cases, the questionnaire were reviewed and an entryconsistent with the information from those sources was imputed. This procedure was usedwhen (1) there was not suitable record to use as a donor, (2) the computer method producedan entry that was outside the acceptable range for the item, or (3) there were very few caseswhere an item was unanswered (usually less than 10).
Values were imputed to items with missing data within records classified as interviews(ISR=1). Noninterview adjustment factors were used during the weighting process tocompensate for data missing because the sample person was a noninterview (ISR=2).
Entries imputed to TFS records are identified by flags that denote the stage or type ofimputation: 1 = ratio adjustment of original entry; 2 = entry was imputed by using other dataon the record or from the SASS teacher file; 3 = entry was imputed by using data from therecord for a similar sample person (donor); 4 = clerical imputation; 0 = not imputed.
The variable names for these flags are F_ (variable name), where variable name is thevariable name for the data entry, e.g., F_TFS012 is the imputation flag for variable TFS012(item 6 of the TFS-2).
VII. Weighting
A. SASS Teacher Weights
The SASS teacher basic weight is the inverse of the probability of selection ofthe teacher. Teacher basic weights were adjusted to account for schools that refusedto provide lists of teachers (school nonresponse adjustment factor), and for teacherswho were selected for the survey but did not provide questionnaire data (teachernoninterview factor). In addition, the school sampling adjustment factor and the first-stage ratio adjustment factor were also applied to produce the final weight.
School sampling adjustment factor was applied to certain schools to account forduplicate records, merged schools, or any other circumstance that would affect theschool's true probability of selection.
School nonresponse adjustment factor was calculated to compensate for schoolsthat refused to provide lists of their teachers.
First stage ratio adjustment factor adjusted the sample weighted count of allcases (interviewed, noninterview, and out-of-scope) to known frame totals. For publicschools, the frame totals such as grade level by urbanicity by state came from the
41

1994-95 Teacher Follow up SurveyTechnical Notes
1991-92 CCD. For private schools on the list frame, the updated private school listframe universe was the source of totals such as grade level by association membership.
B. TFS Teacher Weights
The final TFS sample weight equals:
TFS basic weight x SASS weighting adjustment factor x TFS noninterviewadjustment x TFS ratio adjustment
where:
TFS basic weight is the inverse of the probability of selecting a teacher for TFS.This weight is the product of the intermediate teacher weight from SASS (described inprevious section) and TFS subsampling adjustment factor. The TFS subsamplingadjustment factor is an adjustment that accounts for the subsampling of teachers fromSASS sample teachers.
SASS weighting adjustment factor is used to adjust for the fact that preliminarySASS final weights were used in computing the TFS basic weight. The weightingadjustment factor adjusts for any changes that may have occurred between thepreliminary and final weighting calculations.
TFS noninterview adjustment is the factor used to adjust for teachers whoparticipated in SASS but did not participate in the 1994-95 TFS.
TFS ratio adjustment is the factor used to adjust the TFS sample totals to knownSASS sample totals. This adjustment ensures that the weighted number of TFSteachers (interviews, noninterviews, and out-of-scopes) will equal the weighted numberof SASS teachers from 1993-94.
VIII. Valiance Estimation
The previous SASS surveys (1987-88 and 1991-92) used the variance procedureknown as balanced half sample replication (BHR). A fundamental problem with BHR is thatit assumes sampling is done with replacement. Hence, BHR cannot reflect the increase inprecision due to sampling a large proportion of a finite population. For most surveys, wherethe sampling rates are small, the increase in precision will be small and can be safely ignored.However, in SASS the public surveys (school, principal, teacher, library, and librarian) aredesigned for reliable state estimates. This necessarily implies large sampling rates, which canlead to very large variance overestimates with BHR. Likewise, some of the private surveys(school, principal, and teacher) are designed to produce detailed private association estimates,which also imply large sampling rates, and variance overestimation with BHR.
42
54

1994-95 Teacher Follow up SurveyTechnical Notes
To overcome this problem, a bootstrap variance estimator was implemented for the1993-94 SASS. The bootstrap variance reflects the increase in precision due to largesampling rates..
The idea behind bootstrap variance estimation" is to use the distribution of the sampleweights to generate a bootstrap frame. Bootstrap samples can be selected from the bootstrapframe, replicate weights computed, and variances estimated with standard BHR software. Thebootstrap replicate basic weights (inverse of the probability of selection) were subsequentlyreweighted by processing each set of replicate basic weights through the full-sampleweighting procedure.
Further analysis of the bootstrap replicate basic weights revealed that approximately6% of SASS school replicate weights fell outside a 95% confidence interval. This is onlyslightly higher than the expected 5% and indicates the bootstrap replicate weights are close tonormally distributed.
Public schools. The SASS public school data files contain a set of 48 bootstrapweights, which can be used with any BHR software package. If the package requiresspecifying a variance methodology, BHR can be specified. At this point, variancecomputation is similar to the previous SASS and TFS rounds. The difference is in the use ofbootstrap methods to produce the replicate weights.
Public school principal replicate weights are the same as the school replicate weights.
Private schools. For private schools, the list frame used the bootstrap methodology asdescribed above. For the area frame, the PSU sampling rates were very small, negating theadvantage of using bootstrap.
BHR methodology was employed in the area frame as it has been for all previousSASS. Half-samples are defined by pairing sample PSUs within each sampling stratum,forming variance strata. The final product is a set of 48 replicate weights. After the variancestrata were assigned, an orthogonal matrix was used to form the 48 balanced half-samplereplicates. Thus, the same methodology can be applied to both the list frame and the areaframe replicate weights to compute variances.
18For more information about bootstrap variance methodology and how it applies to SASS and TFS, see:Efron, B (1982), The Jackknife, the Bootstrap and Other Resampling Plans, SIAM No. 38; Kaufman , S. (1992),"Balanced Half-sampled Replication with Aggregation Units," Proceedings of the Section on Survey ResearchMethods, American Statistical Association, 1992. Alexandria, VA: American Statistical Association. Kaufman,S. (1993), "A Bootstrap Variance Estimator for the Schools and Staffing Survey," Proceedings of the Section onSurvey Research Methods, American Statistical Association, 1993. Alexandria, VA: American StatisticalAssociation. "Properties of the Schools and Staffing Survey's Bootstrap Variance Estimator," Proceedings ofthe Section on Survey Research Methods, American Statistical Association, 1994. Alexandria, VA: AmericanStatistical Association. Sitter, R.R. (1990), "Comparing Three Bootstrap Methods for Survey Data," TechnicalReport Series of the Laboratory for Research in Statistics and Probability, Carlton University.
5543

1999-95 Teacher Follow up SurveyTechnical Notes
Teacher replicates. The teacher replicate weights are generally equal to the schoolbootstrap replicate weights times the inverse of the conditional probability of selection of theteacher given the school was selected in the SASS school sample. These adjusted bootstrapreplicate weights are provided on the file. BIM methodology was employed rather thanbootstrap in two instances. First, if a school was selected with certainty and, subsequently,teachers were not sampled with certainty, no bootstrap replicate weights were available, sorecords were sorted by school stratum, order of selection, and control number, and thenassigned variance stratum and panel.
The second instance was in the private area frame. These teacher sample records wereassigned replicate weights by multiplying the school BHR replicate weights by the teacher'sconditional probability of selection given the school was selected in the SASS school sample.
TFS teachers. Since the TFS sample was a proper subsample of the SASS teachersample, the SASS teacher replicates were used for the TFS sample. The TFS basic weight foreach TFS teacher was multiplied by each of the 48 SASS replicate weights divided by theSASS teacher full-sample intermediate weight for that teacher. To calculate 48 replicateweights which should be used for variance calculations, these TFS replicate basic weightswere processed through the remainder of the TFS weighting system.
A variance estimate is obtained by first calculating the estimate for each replicate, thensumming the squared deviations of the replicate estimates from the full-sample estimate, andfinally dividing by the number of replicates:
A AE (yk-y)2/48k
where k = 1, 2 48,Ayk = kth replicate estimate
A
and y = full sample estimate.
When calculating variance estimates for some small subdomains of interest (e.g.,vocational education teachers), sparseness of the data may result in there being no data fromsome replicates. This can result in either an extremely large variance estimate or failure ofthe software used to calculate the variance, with possibly a warning message.
WESTAT, Inc. has developed a PC-based replication program, WesVarPC.WesVarPC is available on the World Wide Web. The URL for WESTAT, Inc. ishttp://www.westat.com. There is a link on the WESTAT home page to the WesVarPC homepage. WesVarPC version 2.1, along with the documentation, is available for download at nocharge.
44v8

1994-95 Teacher Follow up SurveyTechnical Notes
IX. Reinterview Program
The purpose of the reinterview for the TFS was to evaluate response variance.Measuring response variance allows us to determine the degree of variability between theoriginal interview responses and the reinterview responses. If the degree of variability ishigh, questions that need improvement can be determined. A sample of 1,545 cases wasselected, expecting 1,000 completed reinterviews. Oversampling occurred to account forpotential nonresponse based on the 1991-92 TFS. In actuality we obtained 870 completedreinterviews.
We used two reinterview questionnairesthe TFS-3(R) for mail cases and the TFS-3(R)T for telephone cases. Each questionnaire contained a subset of questions from theoriginal questionnaire.
The TFS reinterview took place from February 21, 1995 through June 16, 1995. Ananalysis of the reinterview data is in progress.
X. Confidentiality Protection Measures
The 1994-95 TFS data are released in accordance with the provisions of the GeneralEducation Provisions Act (GEPA) (20 USC 1221e-1) and the Carl D. Perkins VocationalEducation Act. GEPA ensures privacy by ensuring that respondents will never beindividually identified.
Under Public Law 100-297, the NCES is responsible for protecting the confidentialityof individual respondents and is releasing data to the public to use for statistical purposesonly. Record matching or deductive disclosure by any user is prohibited.
To ensure that the confidentiality provisions contained in PL 100-297 have been fullyimplemented, procedures for disclosure avoidance were used in preparing the data tape in thisrelease. Every effort has been made to provide the maximum research information consistentwith reasonable confidentiality protections.
To prevent disclosure of the identities of teachers on the public use data tapes, stateidentifiers (for the public school teachers) and state, regional, and detailed affiliation andassociation codes (for the private school teachers) have been removed. In addition,continuous variables on the questionnaire that would permit disclosure of a teacher's identity(age and salary) have been coded into categories. The new categories for recoded variablesare defined for the appropriate source codes on the attached tape record layouts. A few itemshave been deleted from the files altogether because of disclosure problems. These will bemissing on the record layouts.
45

1994-95 Teacher Followup SurveyTechnical Notes
Difference between public and restricted use file. To protect the confidentiality ofresponding teachers, certain categories were collapsed on the public use file so that teacherscannot be identified. These included base academic year salary, teacher's age, totalenrollment, percent minority enrollment, and the community type (rural, small town, urban,and central city) of the school. State identifiers and school affiliation were deleted from thepublic use file.
XI. Changes to TFS Content from 1991-92 to 1994-95
Some changes to wording and the order of specific items has occurred. Also, a newsection was added to the Questionnaire for Current Teachers (TFS-3) to collect data onteaching methods. These new questions are Items 31-50.
XII. Caution Concerning the Measurement of Change Using 1991-92 and 1994-95 TFS
Changes in question wording. Caution must used in the interpretation of changeestimates between 1991-92 and 1994-95 TFS since specific questions are not always wordedthe same in both surveys.
XIII. User Notes and Comments
We are interested in your reaction to the information presented here about the TeacherFollowup Survey (TFS) data collection system as well as the microdata files we release. Wewelcome your recommendations for improving our survey work and data products. If youhave suggestions or comments or want more information about this report, please contact:
Teacher Followup SurveyNational Center for Education Statistics555 New Jersey Avenue, NWWashington, DC 20208-5651
We are also interested in the research you do using the TFS data sets. We would be pleasedto receive copies of reports, working papers, and published articles you write, which use datafrom the TFS. Send them to the address above.
THANK YOU FOR TAKING THE TIME TO RESPOND!
46
58

1994-95 Teacher Follow up SurveyAppendix AStandard Error Tables
Appendix A
Standard Error Tables
A-1
59

1994-95 Teacher Followup SurveyAppendix A- Standard Error Tables
Table Al.-Standard errors for attrition rates from the teaching profession, by main field of assignment:From 1987-88 to 1988-89, from 1990-91 to 1991-92, and from 1993-94 to 1994-95 (table 1)
Base year's mainfield of assignment
Public Private
From 87-88 From 90-91 From 93-94to 88-89 to 91-92 to 94-95
From 87-88 From 90-91 From 93-94to 88-89 to 91-92 to 94-95
Total 0.30 0.36 0.34 0.85 0.80 0.70
Kindergarten 0.69 1.56 0.72 2.65 2.74 3.02General elementary 0.64 0.61 0.78 1.23 1.28 1.02Art/music 0.79 1.44 1.54 4.38 3.26 2.40Bilingual/ESL 3.11 2.04 1.55 11.21Business 2.27 3.64 1.57 24.45 7.65 --English /language arts 1.76 1.09 1.49 3.38 3.12 2.26Health 0.81 0.85 1.25 2.99 4.37 2.49Home economics 2.35 1.08 2.83 19.44 -Industrial arts .1.27 0.87 1.61 - - 22.29Math 0.74 1.29 1.44 2.64 2.89 3.02Reading 1.25 1.22 1.01 3.13 13.49 3.04Social studies 1.73 1.22 0.78 2.86 3.66 3.02
Science total 1.21 1.96 1.43 2.25 2.08 2.06Biology 0.94 1.17 2.03 5.05 3.55 3.94Chemistry/physics 2.06 2.38 0.67 4.12 3.28 5.75General science/earth science 2.09 3.71 2.49 3.75 3.05 3.61
Special education total 1.23 0.93 1.09 9.21 3.95 3.52Mentally retarded 4.24 1.72 4.42 15.84 -- -Learning disabled 0.65 0.92 2.25 10.34 2.57 2.82Other special education 2.51 1.26 1.55 18.13 6.91 4.32
Vocational education 2.47 1.67 2.54 0.00 30.80
Foreign languages ++ 0.44 1.23 ++ 3.69 2.01
Physical science 2.79 ** ** 2.46
All others* 0.78 1.01 2.40 3.64 3.03 2.78
--Too few cases for a reliable estimate.++Foreign languages in 1987-88 was included in the "All others" category.*Includes computer science, remedial education, religion, gifted, prekindergarten, and all others (andforeign languages in 1987-88).**No equivalent category in 1987-88 or 1990-91.NOTE: Base years in this table are 1987-88, 1990-91, and 1993-94.
SOURCE: U.S. Department of Education, National Center for Education Statistics, Teacher FollowupSurvey, 1988-89, 1991-92, and 1994-95.
A-2
60

1994-95 Teacher Followup SurveyAppendix A-Standard Error Tables
Table A2. Standard errors for attrition rates from the teaching profession, by selected teachercharacteristics: From 1987-88 to 1988-89, from 1990-91 to 1991-92, and from 1993-94to 1994-95 (table 2)
Public Private
Base year's teacher From 87-88 From 90-91 From 93-94characteristics to 88-89 to 91-92 to 94-95
From 87-88to 88-89
From 90-91to 91-92
From 93-94to 94-95
Total 0.30 0.36 0.34 0.85 0.80 0.70
SexMale 0.52 0.60 0.32 1.72 1.91 1.20Female 0.39 0.48 0.44 0.92 0.84 0.78Not reported 6.96
AgeLess than 25 0.91 2.30 1.05 3.79 4.91 4.1925 to 29 1.18 1.21 1.25 2.42 2.27 1.3530 to 39 0.59 0.76 0.94 1.59 1.65 1.5440 to 49 0.32 0.31 0.54 1.63 1.03 1.0250 to 59 0.82 0.95 0.77 2.45 1.91 1.5360 to 64 4.90 4.30 4.78 5.93 4.62 2.7465 or more 8.48 13.80 7.79 3.16 5.83 8.67Not reported 7.24 5.56
Full-time teaching experienceLess than 1 year 3.22 6.15 2.53 6.30 4.38 3.991 to 3 years 0.93 0.99 0.86 1.68 1.58 1.31
1 year 1.51 1.71 1.15 3.35 2.71 2.732 years 1.89 1.51 1.47 2.96 3.10 2.253 years 1.52 1.17 1.59 2.80 2.60 1.82
4 to 9 years 0.80 0.96 0.93 1.86 1.56 1.3810 to 19 years 0.50 0.37 0.63 1.85 1.09 1.1520 to 24 years 2.23 0.77 0.93 2.94 2.00. 1.2725 years or more 1.63 1.16 0.94 1.97 3.24 2.24Not reported 4.43 14.48
Degree earnedLess than bachelor's 1.07 11.61 1.87 5.65 5.93 3.40Bachelor's 0.44 0.47 0.49 1.20 0.98 0.80Master's 0.55 0.48 0.53 1.43 1.32 1.17Education specialist 0.98 1.23 1.99 7.61 6.63 7.23Doctorate or professional 2.36 8.34 3.20 5.21 3.68 6.59
Race/ethnicityWhite, non-Hispanic 0.32 0.37 0.36 0.90 0.86 0.69Total minority 1.21 0.84 0.92 4.73 3.05 2.75
Am. Indian, Aleut, Eskimo 1.70 0.77 1.06 15.61 18.44 20.33Asian or Pacific Islander 2.77 5.37 0.71 10.39 6.51 8.67Black, non-Hispanic 1.84 1.45 1.48 8.35 6.76 4.52Hispanic 0.84 0.99 2.14 6.46 4.32 4.31
Not reported 2.23 13.71
LevelElementary 0.41 0.40 0.55 1.03 1.07 0.91Secondary 0.39 0.54 0.45 1.30 1.24 0.99
--Too few cases for a reliable estimate.'''The 1987-88 data were not imputed; 1990-91 and 1993-94 data were imputed.NOTE: Base years in this table are 1987-88,1990-91, and 1993-94.
SOURCE: U.S. Department of Education, National Center for Education Statistics, Teacher Followup Survey, 1988-89,1991-92, and 1994-95.
61A-3

1994-95 Teacher Followup SurveyAppendix A-Standard Error Tables
Table A3.-Standard errors for percentage of public school stayers, movers, and leavers, by selected teacher characteristics:From 1987-88 to 1988-89, from 1990-91 to 1991-92, and from 1993-94 to 1994-95 (table 3)
Base year's teachercharacteristics
From 1987-88 to 1988-89 From 1990-91 to 1991-92 From 1993-94 to 1994-95Stayers Movers Leavers Stayers Movers Leavers Stayers Movers Leavers
Total 0.46 0.41 0.30 0.49 0.34 0.36 0.52 0.35 0.34
SexMale 0.92 0.80 0.52 1.01 0.77 0.60 0.75 0.66 0.32Female 0.61 0.51 0.39 0.62 0.46 0.48 0.58 0.37 0.44Not reported 24.94 19.38 6.96
AgeLess than 25 2.98 2.68 0.91 3.69 3.24 2.30 3.12 2.88 1.0525 to 29 1.71 1.32 1.18 1.74 1.47 1.21 1.86 1.38 1.2530 to 39 0.98 0.79 0.59 1.19 0.96 0.76 1.35 0.97 0.9440 to 49 0.92 0.86 0.32 0.64 0.47 0.31 0.83 0.56 0.5450 to 59 0.74 0.73 0.82 1.20 0.59 0.95 1.07 0.67 0.7760 to 64 5.46 2.89 0.82 4.51 0.88 4.30 5.10 0.88 4.7865 or more 8.48 0.00 4.90 48.87 9.07 13.80 8.82 - 7.79Not reported 7.33 3.10 7.24 ..,
Full-time teachingexperience
Less than 1 year 6.71 4.31 3.22 9.63 8.82 6.15 4.03 2.67 2.531 to 3 years 1.37 1.14 0.93 1.29 0.96 0.99 1.48 1.03 0.86
1 year 1.98 1.42 1.51 2.29 1.72 1.71 1.79 1.35 1.152 years 2.48 2.01 1.89 2.15 1.74 1.51 2.68 2.04 1.473 years 2.42 1.60 1.52 1.84 1.51 1.17 2.16 1.37 1.59
4 to 9 years 1.28 0.96 0.80 1.33 1.00 0.96 1.08 0.87 0.9310 to 19 years 0.83 0.71 0.50 0.79 0.65 0.37 1.01 0.70 0.6320 to 24 years 1.03 1.00 0.25 1.06 0.65 0.77 1.20 0.59 0.9325 years or more 1.65 1.11 1.63 1.30 0.62 1.16 1.32 0.74 0.94Not reported 13.93 11.35 4.43
Degree earnedLess than bachelor's 1.19 - 1.07 11.88 1.98 11.61 3.59 2.36 1.87Bachelor's 0.64 0.48 0.44 0.73 0.46 0.47 0.75 0.48 0.49Master's 0.94 0.80 0.55 0.73 0.65 0.48 0.77 0.55 0.53Education specialist 2.14 1.62 0.98 2.68 2.11 1.23 2.71 1.84 1.99Doctorate orprofessional 7.60 5.83 2.36 8.36 - 8.34 5.86 4.37 3.20
Race/ethnicityWhite, non-Hispanic 0.55 0.49 0.32 0.50 0.35 0.37 0.54 0.37 0.36Total minority 1.67 0.98 1.21 1.47 1.08 0.84 1.52 1.08 0.92
Am. Indian, Aleut,Eskimo 2.13 1.13 1.70 1.62 1.41 0.77 2.74 2.21 1.06Asian or PacificIslander 12.88 11.50 2.77 7.43 4.08 5.37 3.88 3.48 0.71Black, non-Hispanic 2.32 1.18 1.84 2.33 1.80 1.45 1.95 1.14 1.48Hispanic 2.89 2.36 0.84 1.87 1.36 0.99 3.15 2.06 2.14
Not reported 4.43 3.61 2.23
LevelElementary 0.71 0.61 0.41 0.59 0.50 0.40 0.72 0.45 0.55Secondary 0.56 0.48 0.39 0.75 0.48 0.54 0.77 0.52 0.45
- Too few cases for a reliable estimate.*The 1987-88 data were not imputed; 1990-91 and 1993-94 data were imputed.
NOTE: Base years in this table are 1987-88,1990-91, and 1993-94. Stayers are teachers who were teaching in the same school in thecurrent school year as in the base year. Movers are teachers who were still teaching in the current sch000l year but had moved to a differentschool after the base year. Leavers are teachers who left the teaching profession after the base year.
SOURCE: U.S. Department of Education, National Center for Education Statistics, Teacher Followup Survey, 1988-89,1991-92, and 1994-95.
A-462

1994-95 Teacher Followup SurveyAppendix A-Standard Error Tables
Table A4.-Standard errors for percentage of private school stayers, movers, and leavers, by selected teacher characteristics:From 1987-88 to 1988-89, from 1990-91 to 1991-92, and from 1993-94 to 1994-95 (table 4)
Base year's teacher From 1987-88 to 1988-89 From 1990-91 to 1991-92 From 1993-94 to 1994-95
characteristics Stayers Movers Leavers Stayers Movers Leavers Stayers Movers Leavers
Total 1.31 0.70 0.85 0.90 0.51 0.80 0.79 0.35 0.70
SexMale 2.20 1.13 1.72 2.01 0.80 1.91 1.66 0.83 1.20
Female 1.38 0.75 0.92 1.03 0.65 0.84 0.84 0.39 0.78
Not reported 0.00 0.00**
AgeLess than 25 6.82 4.79 3.79 5.29 3.15 4.91 5.00 2.72 4.19
25 to 29 3.99 2.25 2.42 2.89 1.63 2.27 1.67 0.96 1.35
30 to 39 2.34 1.37 1.59 1.94 1.15 1.65 1.87 0.92 1.54
40 to 49 2.15 1.18 1.63 1.51 1.20 1.03 1.22 0.59 1.02
50 to 59 3.19 1.90 2.45 2.28 1.08 1.90 1.59 0.42 1.53
60 to 64 6.73 1.85 5.93 4.87 0.86 4.62 2.67 0.80 2.74
65 or more 4.26 2.07 3.16 6.50 2.16 5.83 8.81 - 8.67
Not reported 11.87 8.26 5.56 ** ** **
Full-time teaching experienceLess than 1 year 7.15 1.94 6.30 4.57 1.32 4.38 3.76 1.35 3.99
1 to 3 years 2.53 1.64 1.68 1.72 1.00 1.58 1.32 0.94 1.31
1 year 4.61 3.08 3.35 3.08 2.20 2.71 2.78 1.70 2.73
2 years 4.19 2.44 2.96 3.36 1.28 3.10 2.75 2.07 2.25
3 years 4.19 2.36 2.80 3.10 1.83 2.60 2.46 1.49 1.82
4 to 9 years 2.46 1.28 1.86 2.24 1.53 1.56 1.70 0.94 1.38
10 to 19 years 2.47 1.45 1.85 1.41 0.78 1.09 1.16 0.37 1.15
20 to 24 years 5.33 4.44 2.94 2.29 0.86 2.00 1.47 0.64 1.27
25 years or more 2.69 1.77 1.97 3.44 0.68 3.24 2.42 0.66 2.24
Not reported 20.42 8.61 14.48 **
Degree earnedLess than bachelor's 8.23 6.39 5.65 6.14 1.57 5.93 4.34 1.97 3.40
Bachelor's 1.81 0.90 1.20 1.15 0.74 0.98 1.01 0.57 0.80
Master's 1.76 1.02 1.43 1.33 0.70 1.32 1.25 0.60 1.17
Education specialist 9.99 4.04 7.61 7.93 4.04 6.63 7.39 0.81 7.23
Doctorate or professional 5.45 - 5.21 3.70 - 3.68 6.62 - 6.59
Race/ethnicityWhite, non-Hispanic 1.32 0.68 0.90 1.02 0.55 0.86 0.77 0.39 0.69
Total minority 5.85 2.87 4.73 3.60 2.32 3.05 2.96 - 2.75
Am. Indian, Aleut, Eskimo 31.19 24.35 15.61 18.44 - 18.44 - - 20.33
Asian or Pacific Islander 11.78 - 10.39 6.95 1.35 6.51 9.04 - 8.67
Black, non-Hispanic 7.93 9.08 8.35 6.92 1.61 6.76 5.06 - 4.52
Hispanic 7.65 3.45 6.46 5.19 4.44 4.32 5.38 - 4.31
Not reported 15.76 7.80 13.71 ** ** ** IN *Or
LevelElementary 1.38 0.85 1.03 1.30 0.88 1.07 1.05 0.53 0.91
Secondary 1.83 1.05 1.30 1.31 0.65 1.24 0.99 0.47 0.99
- Too few cases for a reliable estimate.**The 1987-88 data were not imputed; 1990-91 and 1993-94 data were imputed.
NOTE: Base years in this table are 1987-88,1990-91, and 1993-94. Stayers are teachers who were teaching in the same school in thecurrent school year as in the base year. Movers are teachers who were still teaching in the current school year but had moved to adifferentschool after the base year. Leavers are teachers who left the teaching profession after the base year.
SOURCE: U.S. Department of Education, National Center for Education Statistics, Teacher Followup Survey, 1988-89,1991-92, and 1994-95.
A-5
63

1994-95 Teacher Followup SurveyAppendix A-Standard Error Tables
Table A5.-Standard errors for percentage of public school stayers, movers, and leavers, by selected school characteristics:From 1987-88 to 1988-89, from 1990-91 to 1991-92, and from 1993-94 to 1994-95 (table 5)
Base year's schoolcharacteristics
From 1987-88 to 1988-89 From 1990-91 to 1991-92 From 1993-94 to 1994-95Stayers Movers Leavers Stayers Movers Leavers Stayers Movers Leavers
Total 0.46 0.41 0.30 0.49 0.34 0.36 0.52 0.35 0.34
School levelElementary 0.69 0.55 0.39 0.61 0.45 0.45 0.77 0.50 0.53
Secondary 0.87 0.79 0.42 0.97 0.65 0.62 0.73 0.46 0.53
Combined 1.78 1.12 1.35 3.28 3.14 1.25 1.87 1.42 1.04
Not reported 2.30 1.51 1.85 1.69 1.38 0.84 1.56 1.46 0.71
School sizeLess than 150 2.47 1.93 0.98 2.26 1.79 1.06 3.45 2.03 3.60150-299 2.03 1.86 0.54 1.71 1.42 0.78 1.20 0.84 0.91
300-499 1.13 0.83 0.73 1.17 0.91 0.83 1.02 0.76 0.74
500-749 1.15 0.74 0.77 0.95 0.73 0.68 1.02 0.74 0.67
750 or more 0.95 0.83 0.47 0.66 0.41 0.54 0.92 0.64 0.57
Not reported 2.30 1.51 1.85 1.69 1.38 0.84 1.56 1.46 0.71
Minority statusLess than 5% 1.04 0.84 0.56 0.88 0.61 0.57 1.06 0.54 0.93
5 to 19% 1.24 0.92 0.74 0.86 0.77 0.74 1.07 0.64 0.71
20 to 49% 1.08 0.80 0.64 1.30 0.97 0.73 0.96 0.73 0.82
50% or more 1.34 1.08 0.66 0.95 0.68 0.66 1.15 0.86 0.72
Not reported 2.30 1.51 1.85 1.69 1.38 0.84 1.56 1.46 0.71
Community typeCentral city * * ' 0.99 0.77 0.65 1.12 0.78 0.64Urban fringe/large town * * * 0.94 0.67 0.75 0.97 0.64 0.70
Rural/small town * * * 0.70 0.52 0.39 0.70 0.41 0.60
RegionNortheast 1.06 0.74 0.72 1.09 0.92 0.64 1.31 0.69 0.88
Midwest 1.18 0.82 0.71 0.81 0.66 0.55 0.95 0.66 0.74
South 0.74 0.68 0.54 0.92 0.71 0.58 0.74 0.55 0.50
West 1.30 1.10 0.72 0.98 0.75 0.92 1.09 0.79 0.69"Community types for 1987-88,1990-91, and 1993-94 are not comparable. In the 1987-88 SASS, respondents reported whether they lived ina rural, suburban, urban or other type of community. In the 1990-91 and 1993-94 SASS, the community type of the school was defined byLOCALE codes created by Johnson. Johnson, F. (1989), "Assigning Type of Locale Codes to the 1987-88 CCD Public School Universe,"Technical Report, Data Series: SP-CCD-87188-7.4, CS 89-194 (Washington, D.C.: U.S. Department of Education, National Center forEducation Statistics.
NOTE: Base years in this table are 1987-88,1990-91, and 1993-94. Stayers are teachers who were teaching in the same school in thecurrent school year as in the base year. Movers are teachers who were still teaching in the current school year but had moved to adifferent school after the base year. Leavers are teachers who left the teaching profession after the base year.
SOURCE: U.S. Department of Education, National Center for Education Statistics, Teacher Followup Survey, 1988-89,1991-92, and 1994-95.
3EST COPY AVAILABLE
A-6 64

1994-95 Teacher Follow up SurveyAppendix A-Standard Error Tables
Table A6.-Standard errors for percentage of private school stayers, movers, and leavers, by selected school characteristics:From 1987-88 to 1988-89, from 1990-91 to 1991-92, and from 1993-94 to 1994-95 (table 6)
Base year's schoolcharacteristics
From 1987-88 to 1988-89 From 1990-91 to 1991-92 From 1993-94 to 1994-95Stayers Movers Leavers Stayers Movers Leavers Stayers Movers Leavers
Total 1.31 0.70 0.85 0.90 0.51 0.80 0.79 0.35 0.70
School levelElementary 1.49 1.07 0.99 0.93 0.75 1.02 1.08 0.50 0.96
Secondary 3.11 1.39 2.38 1.91 0.86 1.51 1.77 0.83 1.51
Combined 2.41 1.29 2.20 2.35 1.34 1.80 2.25 0.90 1.84
Not reported 3.20 2.72 2.60 3.37 1.41 3.45 3.04 1.26 2.80
School sizeLess than 150 4.16 2.69 2.69 2.97 1.76 2.43 2.00 1.05 1.70
150-299 2.21 1.19 1.63 1.59 0.75 1.49 1.90 1.13 1.48
300-499 3.08 1.50 2.15 1.39 0.99 1.26 1.50 0.64 1.46
500-749 2.37 1.56 1.74 2.68 1.37 2.11 1.56 0.80 1.27
750 or more 4.00 1.74 3.14 2.61 0.78 2.58 1.77 1.22 1.18
Not reported 3.20 2.72 2.60 3.37 1.41 3.45 3.04 1.26 2.80
Minority statusLess than 5% 2.33 1.25 1.67 1.58 1.21 1.47 1.29 0.69 1.06
5 to 19% 2.07 1.20 1.37 1.66 0.86 1.40 1.23 0.53 1.07
20 to 49% 5.08 2.23 4.18 2.13 0.98 2.01 2.61 1.29 2.2850% or more 4.05 2.54 2.85 2.83 2.13 2.35 2.59 1.53 2.15
Not reported 3.20 2.72 2.60 3.36 1.42 3.44 3.04 1.26 2.80
Community typeCentral city 1.41 0.52 1.40 0.94 0.49 0.75Urban fringe/large town 1.64 0.92 1.21 1.58 0.79 1.32
Rural/small town 2.13 1.62 1.81 1.87 1.08 1.46
RegionNortheast 2.43 1.77 1.43 1.77 0.80 1.52 1.49 0.91 1.30
Midwest 1.72 1.18 1.15 1.85 0.91 1.66 1.48 0.56 1.20
South 2.14 1.28 1.59 1.84 0.72 1.79 1.60 0.48 1.45
West 4.07 1.73 3.39 2.24 1.97 1.16 2.35 1.60 1.79'Community types for 1987 - 88,1990-91, and 1993-94 are not comparable. In the 1987-88 SASS, respondents reported whether they lived ina rural, suburban, urban or other type of community. In the 1990-91 and 1993-94 SASS, the community type of the school was defined byLOCALE codes created by Johnson. Johnson, F. (1989), 'Assigning Type of Locale Codes to the 1987-88 CCD Public School Universe;Technical Report, Data Series: SP-CCD-87188-7.4, CS 89-194 (Washington, D.C.: U.S. Department of Education, National Center forEducation Statistics).
NOTE: Base years in this table are 1987-88, 1990-91, and 1993-94. Stayers are teachers who were teaching in the same school in thecurrent school year as in the base year. Movers are teachers who were still teaching in the current school year but had moved to a differentschool after the base year. Leavers are teachers who left the teaching profession after the base year.
SOURCE: U.S. Department of Education, National Center for Education Statistics, Teacher Followup Survey, 1988-89, 1991-92, and 1994-95.
65 A-7

1994-95 Teacher Followup SurveyAppendix A Standard Error Tables
Table A7.Standard errors for movement of base year teachers across sector. From 1987-88to 1988-89, from 1990-91 to 1991-92, and from 1993-94 to 1994-95 (table 7)
TFS sector
PublicFrom 87-88 From 90-91 From 93-94
to 88-89 to 91-92 to 94-95
PrivateFrom 87-88 From 90-91 From 93-94
to 88-89 to 91-92 to 94-95
SectorPublic 1.83 1.62 1.33 2.96 3.94 3.98Private 0.56 1.62 1.33 3.02 3.94 3.98Not reported 1.76 * * 2.15
*The 1987-88 data were not imputed; 1990-91 and 1993-94 data were imputed.
NOTE: Base years in this table are 1987-88,1990-91, and 1993-94.
SOURCE: U.S. Department of Education, National Center for Education Statistics, Teacher Followup Survey, 1988-89,1991-92,and 1994-95.
A-8 66

1994-95 Teacher Follow up SurveyAppendix' A-Standard Error Tables
Table A8.--Standard errors for current primary occupational status of base year teacherswho left the teaching profession: 1988-89,1991-92, and 1994-95 (table 8)
Public PrivatePrimary occupational status 1988-89 1991-92 1994-95 1988-89 1991-92 1994-95
Retired 2.43 2.53 2.01 1.47 1.95 1.99
Homemaking and/or child rearing 3.23 3.19 2.64 3.18 2.13 2.03
Working in an elementary or secondaryschool with an assignment other thanteaching 2.51 2.13 2.71 1.65 1.52 1.98
Working in an occupation outside ofelementary or secondary education 1.73 2.03 2.17 2.54 3.65 2.83
Other 1.44 2.23 2.55 2.49 3.02 2.41
Attending a college or university 0.69 1.57 0.42 1.62 2.23 1.68
Disabled 0.19 0.34 0.79 0.23 0.18 0.95
NOTE: Similar estimates across tables 8 through 11 may vary due to the reference period for different survey items.Tables 8 and 9 reflect the former teachers reported status in the followup year. Table 10 shows data on the factors thataffected the fomer teachers' decisions to leave the classroom. Table 11 is based on all teachers' base-year expectations forthe next year. Base years in this table are 1987-88,1990-91, and 1993-94.
SOURCE: U.S. Department of Education, National Center for Education Statistics, Teacher Followup Survey, 1988-89,1991-92, and 1994-95.
A-9

1994-95 Teacher Followup SurveyAppendix AStandard Error Tables
Table A9.--Standard errors for current primary occupational status of base year teacherswho left the teaching profession and are working in an occupation outside ofelementary or secondary education: 1988-89,1991-92, and 1994-95 (table 9)
Public PrivateJob 1988-89 1991-92 1994-95 1988-89 1991-92 1994-95
Employee of a private company, business,or individual for wages, salary, orcommission 3.62 6.94 4.81 3.70 5.44 3.77
Federal/State/Local government employee 2.40 4.40 4.11 2.67 3.66 3.01
Self-employed in own business,professional practice, or farm 2.56 4.75 1.97 2.77 4.67 3.34
Working without pay in a family businessor farm 0.99 0.00
--Too few cases for a reliable estimate.
NOTE: Similar estimates across tables 8 through 11 may vary due to the reference period for different survey items. Tables 8and 9 reflect the former teachers reported status in the followup year. Table 10 shows data on the factors that affected the formerteachers' decisions to leave the classroom. Table 11 is based on all teachers' base-year expectations for the next year. Baseyears in this table are 1987-88,1990-91, and 1993-94.
SOURCE: U.S. Department of Education, National Center for Education Statistics, Teacher Followup Survey, 1988-89,1991-92,and 1994-95.
A-10 68

1994-95 Teacher Followup SurveyAppendix A-Standard Error Tables
Table A10.--Standard errors for main reason why base year teachers left the teaching profession:1988-89,1991-92, and 1994-95 (table 10)
Public Private
Reason 1988-89 1991-92 1994-95 1988-89 1991-92 1994-95
To retire 2.42 2.63 2.34 1.37 1.84 1.81
Pregnancy/child rearing 2.86 2.30 2.03 3.34 1.88 1.75
Family or personal move 1.51 2.49 1.97 2.60 2.10 2.13
School staffing action 0.80 2.40 0.65 1.31 2.10 1.79
Dissatisfied with teaching as acareer 1.25 1.99 1.05 1.58 1.40 1.24
To pursue another career 2.39 1.64 1.78 1.78 2.47 1.75
To take courses to improve careeropportunities in the field ofeducation 0.58 1.57 1.79 1.64 0.83 1.68
Other family or personal reason 1.32 1.36 1.70 1.62 2.57 1.47
Health 0.39 1.51 1.32 0.51 1.05 0.87
For better salary or benefits 0.91 0.67 0.91 1.36 1.74 1.23
To take a sabbatical or otherbreak from teaching 1.53 0.45 1.06 1.71 0.77 1.44
To take courses to improve careeropportunities outside the fieldof education 0.40 0.56 0.24 0.89 2.07 0.39
Not reported 0.33 ** ** 0.35 ** *IF
*The 1987-88 data were not imputed; 1990-91 data were imputed.
NOTE: Similar estimates across tables 8 through 11 may vary due to the reference period for different survey items. Tables 8 and 9reflect the former teachers reported status in the followup year. Table 10 shows data on the factors that affected the former teachers'
decisions to leave the classroom. Table 11 is based on all teachers' base-year expectations for the next year. Base years in this
table are 1987-88,1990-91, and 1993-94.
SOURCE: U.S. Department of Education, National Center for Education Statistics, Teacher Followup Survey, 1988-89,1991-92, and
1994-95.
6 9 A-11

1994-95 Teacher Followup SurveyAppendix A-Standard Error Tables
Table Al 1.-Standard errors for what base year teachers expected their main activity would be duringthe next school year, by current teaching status: 1987-88,1990-91, and 1993-94 (table 11)
Current teachers Former teachersActivity 1987-88 1990-91 1993-94 1987-88 1990-91 1993-94
Public
Teaching any of grades K-12 0.71 0.46 0.34 2.24 2.51 2.10
Working in non-teaching occupationin education 0.32 0.27 0.22 2.32 2.27 2.72
Retired 0.30 0.24 0.20 2.25 2.87 1:92
Homemaking and/or child rearing 0.16 0.21 0.10 2.45 2.02 2.68
Working outside the field of education 0.22 0.13 0.16 1.26 1.74 1.66
Attending a college or university 0.13 0.12 0.10 0.89 1.40 0.61
Unemployed and seeking work 0.10 0.08 0.01 0.23 0.49 0.86
Teaching at pre-K or post-sec level 0.06 0.07 0.09 0.62 1.32 0.55
Other 0.36 0.03 0.08 1.70 2.00 2.30
Military 0.00 0.00 0.00 0.00 0.00
Not reported 0.12 Ite 0.24 f
Private
Teaching any of grades K-12 1.39 0.73 0.66 2.36 2.59 2.46
Working in non-teaching occupationin education 0.54 0.38 0.38 1.62 1.97 1.66
Retired 0.40 0.16 0.14 1.32 1.64 2.07.
Homemaking and/or child rearing 0.73 0.33 0.39 3.25 1.73 1.92
Working outside the field of education 0.56 0.30 0.19 1.87 3.07 2.20
Attending a college or university 0.52 0.32 0.20 1.96 1.51 0.96
Unemployed and seeking work 0.04 0.32 0.67 1.11 0.21
Teaching at pre-K or post-sec level 0.25 0.17 0.37 2.04 1.14
Other 0.70 0.17 0.12 2.46 2.63 1.59
Military 0.00 0.00 0.00
Not reported 0.38 0.38--Too few cases for a reliable estimate.**The 1987-88 data were not imputed; 1990-91 and 1993-94 data were imputed.
NOTE: Similar estimates across tables 8 through 11 may vary due to the reference period for different survey items. Tables 8 and 9 reflectthe former teachers reported status in the followup year. Table 10 shows data on the factors that affected the former teachers' decisions to leavethe classroom. Table 11 is based on all teachers' base-year expectations for the next year. Base years in this table are 1987-88,1990-91, and1993-94.
SOURCE: U.S. Department of Education, National Center for Education Statistics, Teacher Followup Survey, 1988-89,1991-92, and 1994-95.
A-12 BEST COPY AVAILABLE
70

1994-95 Teacher Followup SurveyAppendix A-Standard Error Tables
Table Alt. -- Standard errors for percentage of base year teachers who reported "dissatisfaction withteaching as a career" as one of three main reasons for leaving the profession, by main areaof dissatisfaction: 1988-89, 1991-92, and 1994-95 (table 12)
Public PrivateArea of dissatisfaction 1988-89 1991-92 1994-95 1988-89 1991-92 1994-95
Inadequate support fromadministration 4.32 6.76 3.71 6.07 6.43 3.66
Poor student motivation to learn 6.62 4.52 5.36 4.54 8.80 2.24
Intrusions on teaching time ++ 6.06 1.44 ++ 1.35
Lack of control over own classrooms 0.91 7.66 1.56
Student discipline problems 1.92 2.45 3.13 4.46 2.48 3.37
Inadequate time to prepare lesson plans ++ 3.20 0.91 ++ 2.46 4.42
Poor opportunity for professionaladvancement 3.98 1.41 1.28 3.69 6.88
Lack of influence over schoolpolicies and practices 1.84 1.27 1.53 1.62 3.29 2.80
Lack of community support for schools ++ 1.60 ++ ++ 0.00 ++
Unsafe working environment 0.64 2.33 ++ 0.00 ++
Interference from others regardingwhat I taught ++ 0.84 ++ ++ 0.99 ++
Class sizes too large 1.09 0.57 0.48 1.71
Generally poor working conditions 1.13 0.58 ++ 3.43 ++
Poor salary 1.96 0.35 4.59 4.35 6.42 2.61
Lack of professional competence ofcolleagues 0.93 0.25 ++ 2.12 ++
Lack of recognition and support fromadministration
++ ++ 2.52 ++ ++ 7.40
Lack of resources and materials/equipment for your classroom
++ ++ 1.02 ++ ++ 0.00
Not reported 1.03 2.87 **
--Too few cases for a reliable estimate.++Not asked on either the 1988-89,1991-92, or 1994-95 Teacher Followup Survey.**The 1987-88 data were not imputed; 1990-91 and 1993-94 data were imputed.
NOTE: Base years in this table are 1987-88,1990-91, and 1993-94.
SOURCE: U.S. Department of Education, National Center for Education Statistics, Teacher Followup Survey, 1988-89,1991-92,and 1994-95.
A-13

1994-95 Teacher Follow up SurveyAppendix A-Standard Error Tables
Table A13.-Standard errors for percentage of base year teachers who reported "dissatisfaction withprevious school" as one of three main reasons for changing schools, by main area of
dissatisfaction: 1988-89,1991-92, and 1994-95 (table 13)
Public PrivateArea of dissatisfaction 1988-89 1991-92 1994-95 1988-89 1991-92 1994-95
Inadequate support fromadrrinistration 4.37 6.34 4.05 5.54 9.45 5.53
Unsafe working environment 1.02 7.35 4-I- - - 4-I-
Lack of professional corrpetence ofcolleagues 1.96 2.55 ++ 2.50 2.16 4-1-
Gass sizes too large 1.71 2.61 - - 0.00 0.00
Lack of community support for schools ++ 2.04 -1-1- ++
Poor student motivation to learn 1.96 2.08 6.65 0.00
Generally poor working concitions 1.62 1.59 44- 2.33 4.32 +I-
Student discipline problems 1.16 1.41 2.71 1.27 - -Interference from others regardingwhat I taught -14 1.64 1-1- ++ 4.06 ++
Lack of influence over schoolpolicies and practices 1.98 1.50 3.43 1.37 4.05 2.00
Poor opportunity for professionaladvancement 5.46 1.37 2.20 2.54 7.97 10.73
Lack of control over own classrooms 1.23 1.59 1.56 - - -Poor salary 1.27 0.93 1.11 5.53 2.67 4.11
Inadequate time to prepare lesson plans ++ 1.01 1.10 ++ 0.00 0.00
Intrusions on teaching time ++ 0.77 0.50 ++ 0.00 -Lack of recognition and support fromadministration ++ -1-r- 4.45 ++ -14 11.22
Lack of resources and materials/equipment for your dassroom ++ ++ 1.05 1.58
Not reported 0.98 0.72-Too few cases for a reliable estimate.
44Not asked on either the 1988 - 89,1991 -62, and 1994-95 Teacher Followup Survey.
"The 1987-88 data ware not impled; 1990-91 and 1993-94 data were imputed.
NOTE: Base years in this table are 1987-88, 1993-91, and 1993-94.
SOURCE: U.S. Department of Education, National Center for Education Statistics, Teacher Follomp Survey, 1985-89, 1991-92, and 1994-S5.
A-14 BEST COPY AVAILABLE
7 2
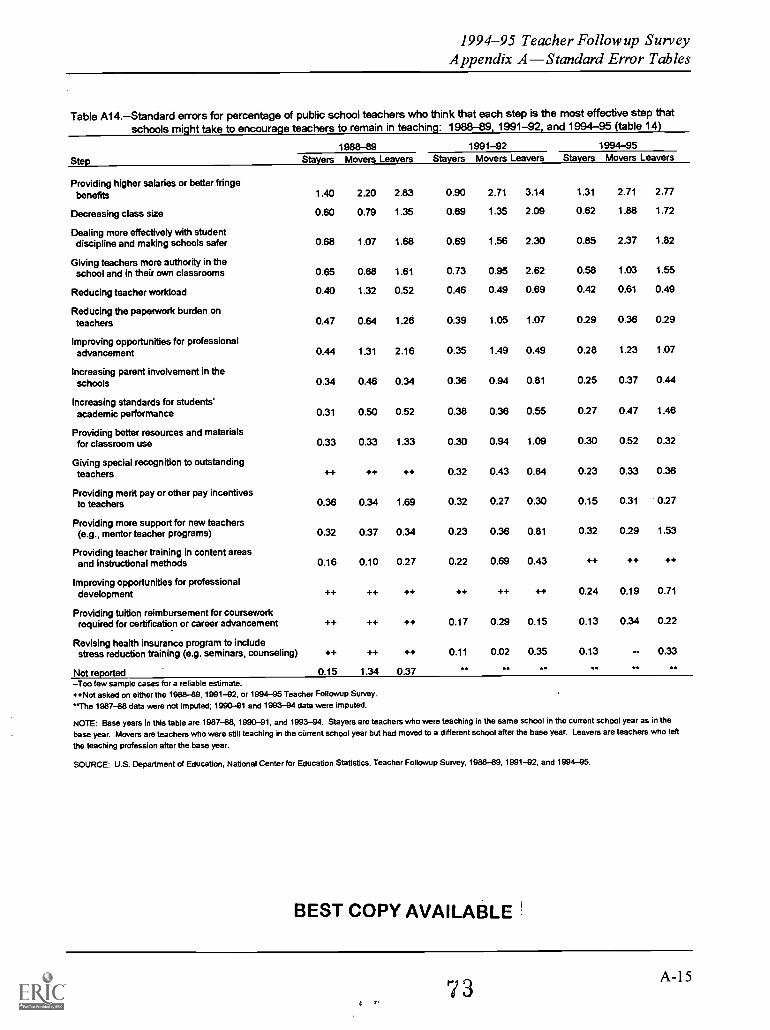
1994-95 Teacher Followup SurveyAppendix A-Standard Error Tables
Table A14.-Standard errors for percentage of public school teachers who think that each step is the most effective step thatschools might take to encouragrs to remain in teaching: 1988-89,1991-92, and 1994-95 (table 14)
1988-89 1991-92 1994-95
Step Stayers Movers Leavers Stayers Movers Leavers Stayers Movers Leavers
Providing higher salaries or better fringebenefits 1.40 2.20 2.83 0.90 2.71 3.14 1.31 2.71 2.77
Decreasing class size 0.60 0.79 1.35 0.69 1.35 2.09 0.62 1.88 1.72
Dealing more effectively with studentdiscipline and making schools safer 0.68 1.07 1.68 0.69 1.56 2.30 0.85 2.37 1.82
Giving teachers more authority in theschool and in their own classrooms 0.65 0.68 1.61 0.73 0.95 2.62 0.58 1.03 1.55
Reducing teacher workload 0.40 1.32 0.52 0.46 0.49 0.69 0.42 0.61 0.49
Reducing the paperwork burden onteachers 0.47 0.64 1.26 0.39 1.05 1.07 0.29 0.36 0.29
Improving opportunities for professionaladvancement 0.44 1.31 2.16 0.35 1.49 0.49 0.28 1.23 1.07
Increasing parent involvement in theschools 0.34 0.46 0.34 0.36 0.94 0.81 0.25 0.37 0.44
Increasing standards for students'academic performance 0.31 0.50 0.52 0.38 0.36 0.55 0.27 0.47 1.46
Providing better resources and materialsfor classroom use 0.33 0.33 1.33 0.30 0.94 1.09 0.30 0.52 0.32
Giving special recognition to outstandingteachers ++ ++ ++ 0.32 0.43 0.64 0.23 0.33 0.36
Providing merit pay or other pay incentivesto teachers 0.36 0.34 1.69 0.32 0.27 0.30 0.15 0.31 0.27
Providing more support for new teachers(e.g., mentor teacher programs) 0.32 0.37 0.34 0.23 0.36 0.81 0.32 0.29 1.53
Providing teacher training in content areasand instructional methods 0.16 0.10 0.27 0.22 0.69 0.43 ++ ++ ++
Improving opportunities for professionaldevelopment ++ ++ ++ ++ ++ ++ 0.24 0.19 0.71
Providing tuition reimbursement for courseworkrequired for certification or career advancement ++ ++ ++ 0.17 0.29 0.15 0.13 0.34 0.22
Revising health insurance program to includestress reduction training (e.g. seminars, counseling) ++ ++ ++ 0.11 0.02 0.35 0.13 - 0.33
Not reported 0.15 1.34 0.37 .-Too few sample cases for a reliable estimate.++Not asked on either the 1988-89,1991-92, or 1994-95 Teacher Followup Survey.*The 1987-88 data were not imputed; 1990-91 and 1993-94 data were imputed.
NOTE: Base years in this table are 1987-88,1990-91, and 1993-94. Stayers are teachers who were teaching in the same school in the current school year as in the
base year. Movers are teachers who were still teaching in the current school year but had moved to a different school after the base year. Leavers are teachers who left
the teaching profession after the base year.
SOURCE: U.S. Department of Education, National Center for Education Statistics, Teacher Followup Survey, 1988-89,1991-92, and 1994-95.
BEST COPY AVAILABLE
7 3A-15

1994-95 Teacher Followup SurveyAppendix A- Standard Error Tables
Table A15.-Standard errors for percentage of private school teachers who think that each step is the most effective step that schools mighttake to encourage teachers to remain in teaching: 1988-89, 1991-92, and 1994-95 (table 15)
Step
Providing higher salaries or better fringebenefits
Decreasing class size
Dealing more effectively with studentdiscipline and making schools safer
Giving teachers more authority in theschool and in their own classrooms
Reducing teacher workload
Reducing the paperwork burden onteachers
Improving opportunities for professionaladvancement
Increasing parent involvement in theschools
Increasing standards for students'academic performance
Providing better resources and materialsfor classroom use
Giving special recognition to outstandingteachers
Providing merit pay or other pay incentivesto teachers
Providing more support for new teachers(e.g., mentor teacher programs)
Providing teacher training in contentareas and instructional methods
Improving opportunities for professionaldevelopment
Providing tuition reimbursement for courseworkrequired for certification or career advancement
Revising health insurance program to includestress reduction training (e.g. seminars, counseling)
Not reported
1988-89 1991-92 1994-95Stayers Movers Leavers Stayers Movers Leavers Stayers Movers Leavers
2.35 4.03 2.82 1.62 3.55 3.61 1.50 3.31 2.63
0.66 1.81 0.61 0.82 1.67 1.06 0.79 1.00 1.42
1.01 2.70 2.14 1.11 2.13 2.60 0.99 1.46 2.11
1.42 1.25 0.93 0.60 2.92 1.29 0.58 1.12 1.71
0.64 0.88 2.27 0.51 0.88 1.27 0.60 1.17 0.44
0.94 1.84 0.70 0.51 1.78 1.16 0.52 0.50 1.19
1.11 0.63 0.70 0.51 1.72 1.06 0.47 2.54 0.87
0.51 0.91 1.47 0.70 1.49 0.99 0.39 0.75 0.65
0.67 0.38 0.90 0.58 1.14 1.73 0.39 2.23 0.94
0.63 0.32 0.29 0.55 0.60 1.09 0.24 1.24 0.62
++ ++ ++ 0.35 0.58 1.22 0.34 0.82 1.36
0.83 0.63 0.33 0.52 0.82 1.09 0.56 0.33 0.43
0.40 0.73 0.69 0.43 0.85 0.71 0.48 0.93 0.66
0.41 0.23 0.45 0.29 0.89 2.08 ++ ++ ++
++ ++ ++ ++ ++ ++ 0.33 0.42
++ ++ ++ 0.39 4.03 0.55 0.42 0.41
+4. +4. - 1.08 0.17
0.55 2.95 0.33 f
-Too few cases for a reliable estimate.++Not asked on either the 1988-89,1991-92, or 1994-95 Teacher Followup Survey.**The 1987-88 data were not imputed; 1990-91 and 1993-94 data were imputed.
NOTE: Base years in this table are 1987-88,1990-91, and 1993-94. Stayers are teachers who were teaching in the same school in the current school year asin thebase year. Movers are teachers who were still teaching in the current school year but had moved to a different school after the base year. Leavers are teachers who leftthe teaching profession after the base year.
SOURCE: U.S. Department of Education, National Center for Education Statistics, Teacher Followup Survey, 1988-89,1991-02, and 1994-95.
A-1674

1994-95 Teacher Follow up SurveyAppendix BQuestionnaire for Current Teachers
Appendix B
Teacher Followup Survey Questionnaire for Cu rent Teachers
75B-1
OMB No. 1850-0617: Approval Expires 12/31/95
NOTICE This report is authorized by law (20 U.S. Code 1221e). Your answers will be kept strictlyconfidential. Results from this survey will appear in summary or statistical form only, so that individualscannot be identified.
FORM TFS-3(t-3-951 U.S. Department of Education
National Center for Education Statistics
TEACHER FOLLOW-UP SURVEYQUESTIONNAIRE FOR CURRENT TEACHERS
1994 - 1995
002
1 1;Xl OFFICE USE ONLY
Conducted by:
U.S. Department of CommerceBureau of the Census
TFS
THIS SURVEY HAS BEEN ENDORSED BY:American Association for Counseling and DevelopmentAmerican Association of School AdministratorsAmerican Federation of TeachersBureau of Indian AffairsCouncil for American Private EducationCouncil of Chief State School OfficersNational Association of Elementary School PrincipalsNational Association of Independent SchoolsNational Association of Secondary School PrincipalsNational Catholic Educational AssociationNational Education Association

INSTRUCTIONSMost of the items on this questionnaire are arranged so that the answer categories or spaces for written answersare under the questions. Please answer the questions by marking the appropriate answer category with an X, orrecording your answer in the space provided. We suggest that you use a pencil, rather than a pen or marker.
Notice that at the end of some answer categories and answer spaces, there are instructions to skip to laterquestions or to continue with the next question on the questionnaire.If you are unsure about how to answer a question, please give the best answer you can and make a commentin the "Notes" space. Please include the item number.If you have any questions, call the Bureau of the Census, toll free, at 1-800-221-1204.Return your completed questionnaire to the Bureau of the Census in the enclosed preaddressed envelope.Please return it within two weeks.Please keep count of the time you spend completing this questionnaire.At the end of the survey, you are asked to record the amount of time spent.
Aregrades
003
you currently teaching - full-time, part-time, or as a long-term substitute - inK through 12?
Yes('PLEASE CONTINUE with this survey.
No OD RETURN THIS FORM to the Bureau of the Census in the enclosed envelope. Youwill be sent another form for teachers who are still teaching.
1
2
SECTION 1- MAIN ACTIVITYEDUCATION FIELDS
(Use codes to answer items la, lb, Z 3a, and 3b)
01 Teaching in an elementary or secondary school 04 Attending a college or university02 Working in an elementary or secondary school 05 Caring for family members
with an assignment OTHER THAN teaching 06 Retired03 Working in an occupation outside of elementary 07 Other
or secondary education
1a.
090
b.
092
Is your time EQUALLY DIVIDED between two of the above listed activities?Yes111
2 M No
t ; lfpit' '52 II,r *'-ri4
What are the codes from
and 093
the list above?
nr4i,1*, sr--4wi tv.,...., _j
Code Code
2.
094
What codetime on during
from the list above best describes the activity you spend most of yourthe work week; that is, what is your main activity?
Main activityCode
3a.095
b.
096
Do you spend time on any other activity from the list above?111 Yes1
rillNo
What code from the list above best describes this other activity?'-1 ,7
Other activityI
Code
Page 2 FORM TFS-3 (1-3.95
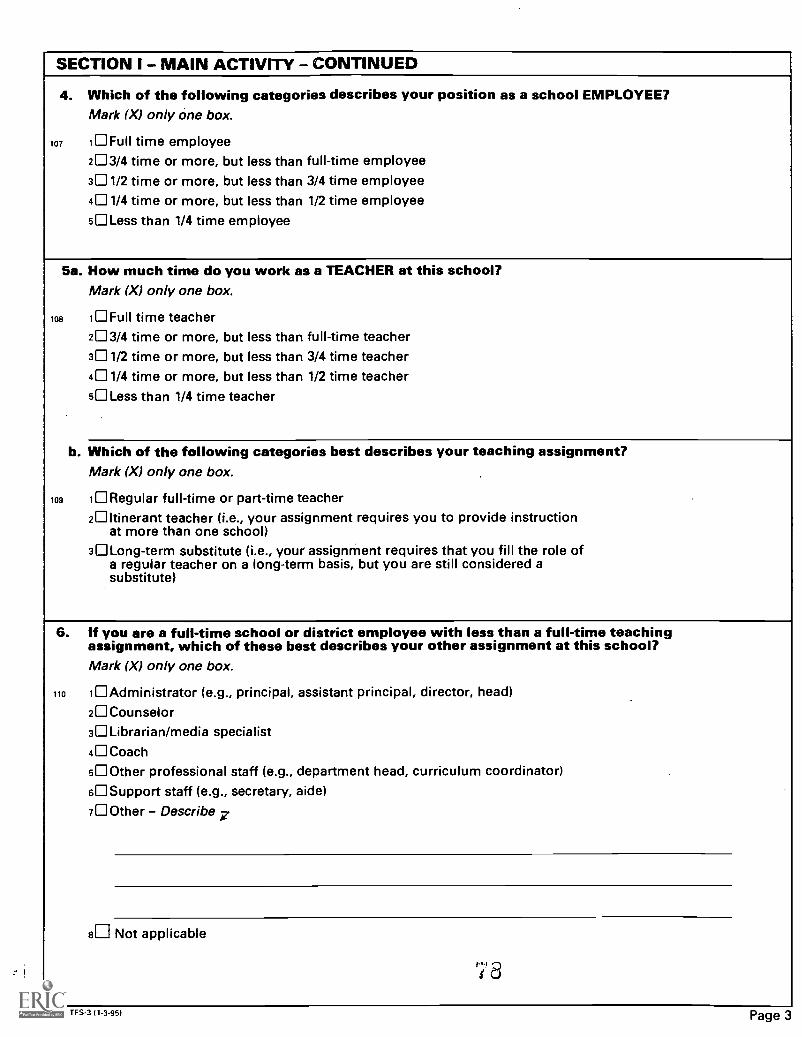
SECTION I MAIN ACTIVITY CONTINUED
4. Which of the following categories describes your position as a school EMPLOYEE?Mark (X) only one box.
107 1 Full time employee2N 3/4 time or more, but less than full-time employee3 1/2 time or more, but less than 3/4 time employee4 1/4 time or more, but less than 1/2 time employee5 Less than 1/4 time employee
5a. How much time do you work as a TEACHER at this school?Mark (X) only one box.
108 1 Full time teacher2 3/4 time or more, but less than full-time teacher3 1/2 time or more, but less than 3/4 time teacher4 1/4 time or more, but less than 1/2 time teacher5 Less than 1/4 time teacher
b. Which of the following categories best describes your teaching assignment?Mark (X) only one box.
109 1 Regular full-time or part-time teacher2 Itinerant teacher (i.e., your assignment requires you to provide instruction
at more than one school)30Long-term substitute (i.e., your assignment requires that you fill the role of
a regular teacher on a long-term basis, but you are still considered asubstitute)
6. If you are a full-time school or district employee with less than a full-time teachingassignment, which of these best describes your other assignment at this school?Mark (X) only one box.
110 1 Administrator (e.g., principal, assistant principal, director, head)20Counselor30 Librarian/media specialist40Coach500ther professional staff (e.g., department head, curriculum coordinator)6Support staff (e.g., secretary, aide)700ther - Describe 7
8 Not applicable
FORM TFS-3 (1-3-951 Page 3

SECTION I - MAIN ACTIVITY - CONTINUEDTEACHING ASSIGNMENT FIELD CODES FOR QUESTIONS 7a and b
01 Prekindergarten02 Kindergarten03 General elementary
Special areas86 American Indian/Native American studies10 Art12 Basic skills and remedial education13 Bilingual education17 Computer science18 Dance19 Drama/theater21 English/language arts23 English as a second language26 Gifted28 Home economics16 Journalism33 Mathematics35 Military science37 Music39 Philosophy40 Physical education, health43 Reading44 Religion47 Social studies/social science
Foreign languages51 French52 German53 Latin54 Russian55 Spanish56 Other foreign language
Science57 Biology/life science58 Chemistry59 Geology/Earth science/Space science60 Physics61 General and all other science
Vocational education05 Accounting06 Agriculture14 Business, marketing27 Health occupations30 Industrial arts49 Trade and industry50 Technical83 Other vocational education
Special education67 Special education, general68 Emotionally disturbed69 Mentally retarded70 Speech/language impaired71 Deaf and hard-of-hearing72 Visually handicapped73 Orthopedically impaired74 Mildly handicapped75 Severely handicapped76 Specific learning disabilities77 Other special education
84 All others
112
113
114
7a. What is your MAIN teaching assignment at this school, that is, the field in whichyou teach the most classes?Enter your main teaching assignment field and the two-digit code from the list above. If yourteaching schedule is divided equally between two fields, record either field as your mainassignment for this item, mark box 1, and enter the code for the other field in question 7b.
Code Main assignment field
i Teaching assignment equally divided between two fields
b. Do you teach classes in OTHER fields at this school?
Yes2 0 NO --I. 1,43040 MOM: 88;.:
In what field do you teach the second most classes?Use the assignment field codes listed above.
Code
7 9
Page 4FORM TFS-3 11-3-E

SECTION I - MAIN ACTIVITY - CONTINUED8a. Do you have a teaching certificate in this state in your MAIN teaching
assignment field?
115 - 1 0Yes2No
116
117
b. What type of certificate do you hold in this field?Mark (X) only one box.
1Advanced professional certificate2 Regular or standard state certificate3The certificate offered in your state to persons who HAVE COMPLETED
what the state calls an "alternative certification program"40 Provisional or other type given to persons who are still participating in
what the state calls an "alternative certification program"5 Probationary certificate (the initial certificate issued after satisfying all
requirements except the completion of a probationary period)6Temporary certificate (requires some additional college coursework and/or
student teaching before regular certification can be obtained)70 Emergency certificate or waiver (issued to persons with insufficient teacher
preparation who must complete a regular certification program in order tocontinue teaching)
c. In what year were you certified in your main teaching assignment field by this state?
1 9
9a. Do you have a teaching certificate in'this state in your OTHER teachingassignment field at this school?
o0 Not applicable; I do not have a second teaching assignment field 1GO:to itenriS5411Yes
v2No
118
119
120
54`VagVit'
b. What type of certificate do you hold in this field?Mark (X) only one box.
10Advanced professional certificate2Regular or standard state certificate3The certificate offered in your state to persons who HAVE COMPLETED
what the state calls an "alternative certification program"4DProvisional or other type given to persons who are still participating in
what the state calls an "alternative certification program"5Probationary certificate (the initial certificate issued after satisfying all
requirements except the completion of a probationary period)6Temporary certificate (requires some additional college coursework and/or
student teaching before regular certification can be obtained)70Emergency certificate or waiver (issued to persons with insufficient teacher
preparation who must complete a regular certification program in order tocontinue teaching)
c. In what year were you certified in this field by this state?
9
FORM TFS-3 11-3-951
BEST COPY AVAILABLEPage 5
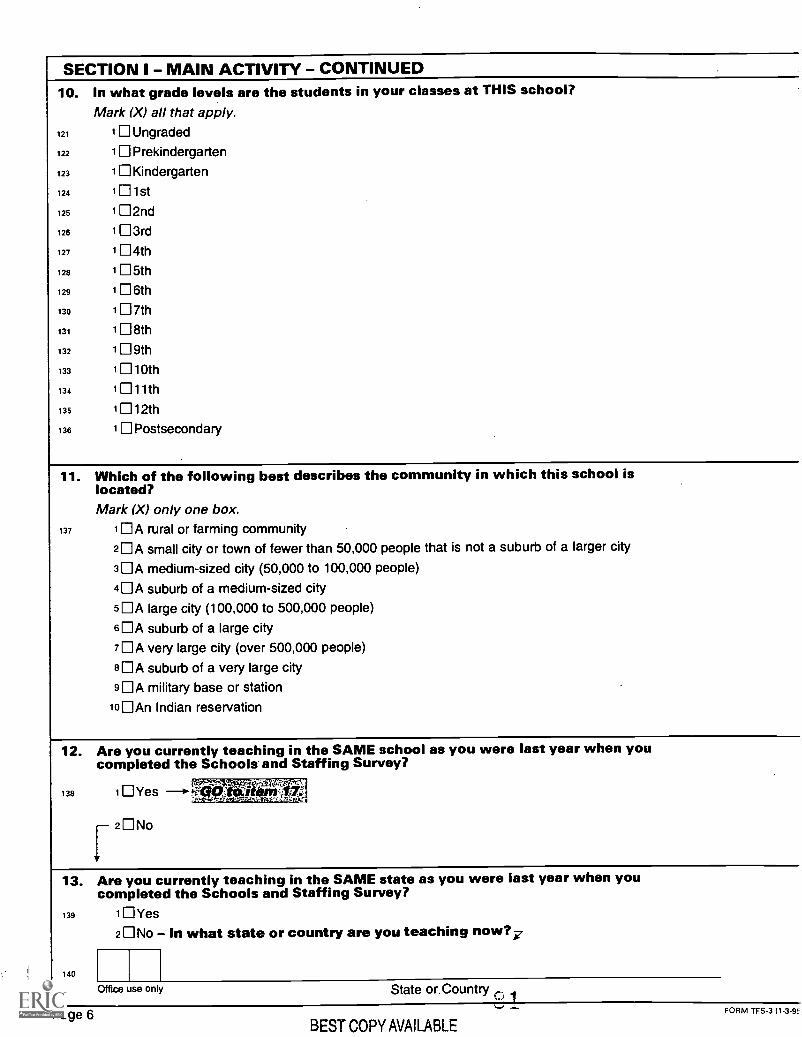
SECTION I - MAIN ACTIVITY - CONTINUED10. In what grade levels are the students in your classes at THIS school?
Mark (X) all that apply.121 1 Ungraded
122 1 1 Prekindergarten
123 1 Kindergarten
124 1 1 1St
125 1 12nd
126 1 3rd
127 1 1 4th
128 1 5th
129 1 1 6th
130 1 17th
131 1 1 8th
132 1 09th133 1 110th
134 1 1 11th
135 1 .1 12th
136 1 Postsecondary
11. Which of the following best describes the community in which this school islocated?Mark (X) only one box.
137 1 A rural or farming communitycity or town of fewer than 50,000 people that is not a suburb of a larger city2 A small
city (50,000 to 100,000 people)3 NIA medium-sized
of a medium-sized city4 A suburb
city (100,000 to 500,000 people)51 A large
612A suburb of a large city
71 A very large city (over 500,000 people)
of a very large city8 A suburb
base or station91 A military
reservation101 An Indian
12. Are you currently teaching in the SAME school as you were last year when youcompleted the Schools and Staffing Survey?
.P 44'- "Qt;.1 Yes
138
tilp, ,,,,,,
2.,
13. Are you currently teaching in the SAME state as you were last year when youcompleted the Schools and Staffing Survey?
139 1 1 Yes
In what state or country are you teaching now?,721 No
140
Office use only State or.Country
Page 6BEST COPY AVAILABLE
FORM TFS-3 (1-3-9E

SECTION I - MAIN ACTIVITY - CONTINUED
14. Which of the following best describes your move fromthis year's school?Mark (X) only one box.
141 1 Moved from one public school to another publicschool in the SAME school district
last year's school to
- GO-to item .16:
1r
2 Moved from one public school district to anotherpublic school district
3 Moved from a private school to a public school
schoolis4 Moved from one private school to another private
Moved from a public school to a private school
-:
15. Is the private school in which you currently teach affiliated with the RomanCatholic Church or another religious organization, or is it non-religious?Mark (X) only one box.
142 1 Religious - Roman Catholic2O Religious - Non-Roman Catholic3 Non-Religious
POSSIBLE REASONS FOR LEAVING PREVIOUS SCHOOL(Use codes to answer items 16a, b; and c.)
01 Family or personal move02 For better salary or benefits03 For a better teaching assignment (subject area or grade level)04 School staffing action (e.g., reduction-in-force, lay-off, school closing, school
reorganization, reassignment)05 Dissatisfied with the previous school
16a. What was your main reason for leaving the school in which you taught last year?Enter code from above.
143
b.
144
Code Main reason
Did you have
-- , YesNo
a second reason for leaving?
-d......R.,7:677,tic2
What was
__,..your second reason? Enter code, then continue with item 16c.
145
c.
146
Code
Did you have a third reason for leaving?
1 Yes,.. 2 . No
What was your third reason? Enter code.
147
CodeS 2
FORM TFS-3 (1-3-95) BEST COPY A Page 7

SECTION 1- MAIN ACTIVITY - CONTINUED16d. Did you enter code 05 for one of your reasons in question 16a, b, or c?
148 OYes
,Gatotanr1
POSSIBLE AREAS OF DISSATISFACTION(Use codes to answer items 16e, f, and g.)
01 Poor opportunity for professional advancement
02 Lack of recognition and support from administration
03 Lack of resources and materials/equipment for your classroom
04 Inadequate support from administration
05 Lack of influence over school policies and practices
06 Lack of control over own classroom
07 Intrusions on teaching time (i.e., not enough time working directly with teaching students)
08 Inadequate time to prepare lesson/teaching plans
09 Poor student motivation to learn
10 Class sizes too large
11 Student discipline problems
12 Poor salary
16e. What was your main area of dissatisfaction with teaching in your previous school?Enter code from above.
149
Code Main dissatisfaction
f. Did you have a second area of dissatisfaction?
150 1 0 YesNo
151What was your second area? Enter code, then continue with item 16g.
Code
g. Did you have a third area of dissatisfaction?
152 1 Yesr2(=1No
What was your third area? Enter code.
153
Code
0Cc.; J
Page 8 BEST COPY AVAILABLEFORM TFS-3 (1-3-9:
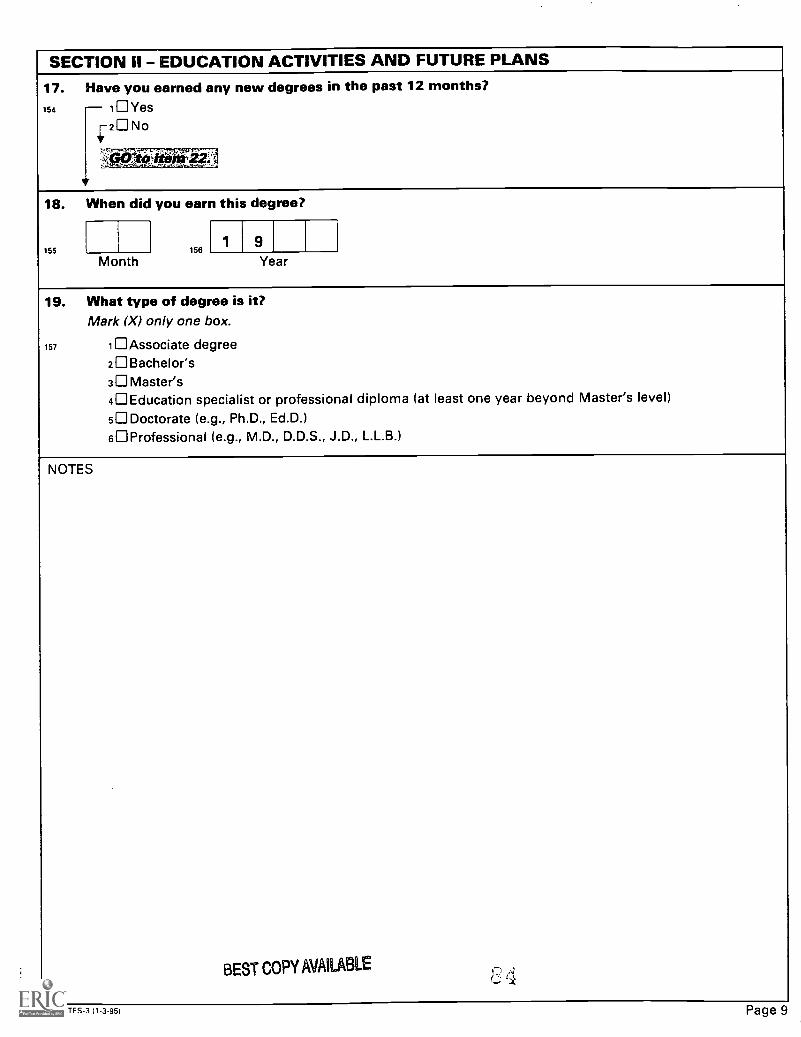
SECTION II - EDUCATION ACTIVITIES AND FUTURE PLANS17.154
Have1 1.
v2ONo
you earned any new degrees in the past 12 months?Yes
--.7tPT* fit' .:
.
18. When did you earn this degree?
155 1561 9
Month Year
19. What type of degree is it?Mark (X) only one box.
157 1 Associate degree2 0 Bachelor's3 Master's40 Education specialist or professional diploma (at least one year beyond Master's level)5 Doctorate (e.g., Ph.D., Ed.D.)6 (e.g., M.D., D.D.S., J.D., L.L.B.)Professional
NOTES
BEST COPY AVAILABLE ,.c., ,1
FORM TFS3 11-3-95) age

SECTION II - EDUCATION ACTIVITIES AND FUTURE PLANS - CONTINUED
MAJOR FIELD OF STUDY CODES FOR QUESTIONS 20 and 24
EDUCATIONGeneral education01 Pre-elementary/early childhood education03 Elementary education04 Secondary education
Subject area education07 Agricultural education11 Art education13 Bilingual education15 Business, commerce, and distributive education89 Crosscultural education22 English education23 English as a second language24 Foreign languages education29 Home economics education88 American Indian/Native American education30 Industrial arts, vocational and technical, trade
and industry education34 Mathematics education38 Music education40 Physical education/health education43 Reading education45 Religious education46 Science education48 Social studies/social sciences education
Special education67 Special education, general68 Emotionally disturbed69 Mentally retarded70 Speech/language impaired71 Deaf and hard-of-hearing72 Visually handicapped73 Orthopedically impaired74 Mildly handicapped75 Severely handicapped76 Specific learning disabilities77 Other special education
Other education78 Curriculum and instruction79 Educational administration80 Educational psychology81 Counseling and guidance82 Other education
GENERAL06 Agriculture and natural resources86 American Indian/Native American studies87 Other area and ethnic studies08 Architecture and environmental design10 Art, fine and applied14 Business and management16 Communications and journalism17 Computer and information sciences19 Drama, theater20 Engineering21 English (literature, letters, speech, classics)25 General studies27 Health professions and occupations28 Home economics85 Humanities31 Law32 Library science33 Mathematics35 Military science36 Multi/interdisciplinary studies37 Music39 Philosophy41 Psychology42 Public affairs and services44 Religion, theologyForeign languages51 French52 German53 Latin54 Russian55 Spanish56 Other foreign languagesNatural sciences57 Biology/life science58 Chemistry59 Geology/earth science60 Physics61 Other natural sciencesSocial sciences62 Economics63 History64 Political science and government65 Sociology66 Other social sciences84 All others
20. What is the major field of study for your NEW degree?Enter the field and two-digit code from the list above.
158
Code Major field
21. For what purpose did you earn this degree? Mark (X) only one box.
159 1 To increase salary2 For professional development in current field3 0To teach in a different field than the one taught last year40For a nonteaching position in elementary or secondary education5For an occupation outside elementary or secondary education other than current job6 Other - Specify 7
Page 10C;
FORM TFS-3 (1-3-951

SECTION II - EDUCATION ACTIVITIES AND FUTURE PLANS - CONTINUED
22. Are you currently enrolled in a degree program?Mark (X) only one box.
N160 1 cs ---s i!t," 4.........-- 4
2OYes, as a full-time student3 Yes, as a part-time student
1
23. What type of degree are you pursuing?Mark (X) only one box.
181 1 Associate degree2 Bachelor's3O Master's4 III Education specialist or professional diploma (at least one year beyond Master's level)5 1. Doctorate (e.g., Ph.D., Ed.D.)
611 Professional (e.g., M.D., D.D.S., J.D., L.L.B.)
24. What is the major field of study for the degree you are pursuing?Enter the field and two-digit code from the list on page 10.
162
Code Major field
25. For whatMark
163 1
211
3
a5
6
purpose are you pursuing this degree?(X) only one box.
To increase teacher salaryFor professional development in current teaching field
111 To teach in another field
For a nonteaching position in elementary or secondary educationIII For an occupation outside elementary or secondary education
Other - Specify 7
26.
164
How longMark (X)
1
do you plan to remain in teaching?only one box.
DAs long as I am ableE Until I am eligible for retirement
better.Will probably continue unless something beer comes alongDefinitely plan to leave teaching as soon as I canUndecided at this time
2
3
4
5.0.030.
27. In how many years do you plan to retire from teaching?
165 Years
FORM TFS-3 (1-3-951 6 0BEST COPY AVAILABLE
Page 11

SECTION II - EDUCATION ACTIVITIES AND FUTURE PLANS - CONTINUED
28.
166
WhatMark
do you expect your MAIN activity will be during the NEXT SCHOOL YEAR (1995 -96)?
(X) only one box.in this schoolin another school in this school systemin another public school systemin a private schoolin a preschoolat the postsecondary level
Working as a substitute teacherat a college or universityin a nonteaching occupation in the field of educationin an occupation outside the field of education
for family membersUnemployed and seeking workMilitary service
1 Teaching2 III Teaching3(1:Teaching4 Teaching5 111 Teaching6 Teaching7 illsOStudent9WorkingioWorkingii Caring12
13 114 Retired
SECTION III - YOUR OPINIONSPOSSIBLE STEPS SCHOOLS MIGHT TAKE TO ENCOURAGE TEACHERS TO REMAIN IN TEACHING
(Use codes to answer items 29a, b, and c.)01 Providing higher salaries and/or better fringe benefits02 Improving opportunities for professional advancement03 Dealing more effectively with student discipline and making schools safer04 Giving teachers more authority in the school and in their own classrooms05 Increasing standards for students' academic performance06 Providing better resources and materials for classroom use07 Decreasing class size08 Giving special recognition and/or special assignments to excellent or outstanding teachers09 Reducing the paperwork burden on teachers10 Providing more support for new teachers (e.g., mentor teacher programs)11 Increasing parent involvement in the schools12 Reducing teacher workload13 Providing merit pay or other pay incentives to teachers14 Improving opportunities for professional development15 Providing tuition reimbursement for coursework required for certification or career advancement16 Revising health insurance program to include stress reduction seminars, counseling, and
physical fitness options
29a.
167
b.
168
c.
169
What wouldencourageEnter code
be the most effective step that schools might take toteachers to remain in teaching?
from above.
Most effective stepCode
What wouldEnter code
be the second most effective step?from above.
Second stepCode
What wouldEnter code
be the third most effective step?from above.
Third stepCode
Page 12FORM TFS-3 (1-3-9:

SECTION III - YOUR OPINIONS - CONTINUED
30. How satisfied are you with EACH of the followingaspects of teaching? Are you (a) Very satisfied, (b)Somewhat satisfied, (c) Somewhat dissatisfied, or(d) Very dissatisfied with -
a. Salary
Verysatisfied
(a)
Somewhatsatisfied
(b)
Somewhatdissatisfied
(c)
Verydissatisfied
(d)
170 1 2 3 4
b. Opportunities for professional advancement 171 1 2 3 4
c. Opportunities for professional development 172 1 2 3 4
d. Recognition and support from administrators 173 1 2 3 4
e. Safety of school environment 174 1 2 3n 4
f. Your influence over school policies and practices 175 1 2 3 4
g. Autonomy or control over your own classroom 176 1 2 43
h. Professional prestige 177 1 2 3 4
i. Benefits 178 1 2 3 4
j. Procedures for performance evaluation 179 1 2 3 4
k. Teaching load 180 1 2 3 4
I. Availability of resources and materials/equipment for yourclassroom 181 1 2 3 4
m. General work conditions 182 1 2 3 4
n. Job security 183 1 2 3 4
o. Professional caliber of colleagues 184 1 2 3 4
p. Intellectual challenge 185 1 2 3 4
q. Student motivation to learn 186 1 2 3 4
r. School learning environment 187 1 2 3 4
S. Student discipline and behavior 188 1 2 3 4
t. Class size 189 1 3 42 III
u. Support from parents 190 1 2 3 4
v. The esteem of society for the teaching profession 191 1 2 3 4
w. Overall job satisfaction 192 1 2 3 4
FORM TFS-3 11-3-951 Page 13

SECTION IV - TEACHING METHODS
This section asks about the teaching strategies, instructional practices, and organizational techniques youuse in teaching. The information you provide is intended to describe students' educational experiencesand inform future national surveys of school processes.
Think of the class for which you had primary responsibility last semester or grading period whenanswering the following questions. If you were responsible for a single group of students all day (such asan elementary teacher might have been), think of them as the designated class. If you were responsiblefor multiple classes or groups of students (such as a content area or special education teacher might havebeen), select your first instructional class or group of the day (not homeroom). Think of this as the"DESIGNATED" class.
TEACHING ASSIGNMENT FIELD CODES FOR QUESTION 31
General01 Prekindergarten02 Kindergarten03 General elementary
Special areas86 American Indian/Native
American studies10 Art12 Basic skills and remedial
education13 Bilingual education17 Computer science18 Dance19 Drama/Theater21 English/Language arts23 English as a second language26 Gifted28 Home economics16 Journalism33 Mathematics35 Military science37 Music39 Philosophy40 Physical education, health43 Reading44 Religion47 Social studies/social science
(including history)
Foreign language51 French52 German53 Latin54 Russian55 Spanish56 Other foreign language
Science57 Biology/Life science58 Chemistry59 Geology/Earth science/Space
science
09 Physical science60 Physics61 General and all other science
Vocational-technical education05 Accounting06 Agriculture14 Business, marketing27 Health occupations30 Industrial arts49 Trade and industry50 Technical83 Other vocational-technical
education
Special education67 Special education, general68 Emotionally disturbed69 Mentally retarded70 Speech/Language impaired71 Deaf and hard-of-hearing72 Visually handicapped73 Orthopedically impaired74 Mildly handicapped75 Severely handicapped76 Specific learning disabilities77 Other special education
84 All others
31. What was the subject matter of your DESIGNATED CLASS last semester or grading period?Record the two digit code from the list above and the field name.
193
Code Main assignment field
Page 14 L3FORM TFS-3 11-3-9E

SECTION IV - TEACHING METHODS - CONTINUED32. In what grade levels are the students in your DESIGNATED CLASS?
Mark (X) all that apply.194 1 Ungraded 202 1 6th
195 1 Prekindergarten 203 1 7th
196 1 Kindergarten 204 1 8th197 1 1St 205 1 9th
198 1 2nd 206 1 10th
199 1 3rd 207 1 11th
200 1 4th 208 1 12th
201 1 5th 209 1 Postsecondary
33. Which of the following describe your DESIGNATED CLASS?Mark (X) all that apply.
210 1 Heterogeneous 216 7 Advanced placement/college credit
211 2 Homogeneous 217 8 Honors course
212 3 Remedial 218 9 Vocational
213 4 Special education 219 10 Bilingual
214 5 Gifted 220 11 None of the above
215 6 Academic/college preparatory
34. Write in your estimate of the percentage of students in your DESIGNATED CLASS who were ateach level of academic ability for their age and grade. (Numbers should total 100.)
221CYOMuch above the NATIONAL average
222CYOSomewhat above the NATIONAL average
223 At the NATIONAL average
224 Somewhat below the NATIONAL average
225 Much below the NATIONAL average %
226 1 Not applicable
35. Write in your estimate of the percentage of students in your DESIGNATED CLASS who were ateach level of academic ability for their age and grade. (Numbers should total 100.)
227 Much above the SCHOOL average
228 Somewhat above the SCHOOL average
229 At the SCHOOL average
230 Somewhat below the SCHOOL average %
231 Much below the SCHOOL average
232 1 Not applicable
l'N -FORM TFS-3 (1-3-95) Page 15

SECTION IV - TEACHING METHODS - CONTINUED36. Over the past semester, how often did YOU use each of
the following instructional strategies with yourDESIGNATED CLASS? The strategy need not have takenthe entire class period.Mark (X) one response on each line.
a. Provide instruction to the class as a whole
Almosteveryday(a)
Once ortwice aweek
lb)
Once ortwice amonth
(c)
Once ortwice a
semester(d)
Never
(e)
233 1 2 II 3M 4 5
b. Facilitate a discussion 234 1 2 30 4 5
c. Demonstrate a concept using the board or overhead projector 235 1 2 3 4 5M
d. Work with individual students 236 1 2 3 4 5
e. Demonstrate a concept using a computer, videotape, or otherelectronic medium 237 1 2 3 4 5 II
f. Lecture 238 1 2 3 4 5
g. Work with small groups of students 239 1 1111 2 111 3 4 5
h. Lead question-and-answer session 240 1 2 31 4 5
i. Demonstrate a concept using manipulatives, models, othertools or objects 241 1 21 3 4 5
j. Administer a test or quiz for less than a full period 242 1 2 3 4 51
k. Administer a test or quiz for a full period 4243 1 2 3 s
37. In your DESIGNATED CLASS over the last semester, howoften did planned in-class activities require that STUDENTS:Mark (X) one response on each line.
a. Respond orally to questions testing recall 244 1 II 2 3 4 51
b. Use school- or student-owned calculators 245 1 2 3 4 sc. Lead whole group discussions 246 1 2 31 4 sd. Listen to or observe teacher presentations 2 El247 1
3 4 5
e. Use hands-on materials or objects 248 1 2 3 4 5
f. Complete a worksheet or workbook emphasizing routine practice 249 1 2 3 4 sg. Use a textbook 250 1 2 31 4 s
h. Engage in discussion primarily with the teacher 251 1 2 3 4 51
i. Use school computers for writing 252 1 2 3 4 5111
j. Use supplementary printed materials other than textbooks 253 1 2 31 4 51
k. Engage in discussion primarily with other students 254 1 2 3 4 5 III
I. Respond orally to open-ended questions 40255 1 2 3 III 5
m. Work on a performing arts project 256 1 2 31 4 51
Page 16g 1
FORM TFS-3 (1-3-9

SECTION IV - TEACHING METHODS - CONTINUED38. Indicate the frequency with which STUDENTS did the
following in your DESIGNATED CLASS during the lastsemester.Mark (X) one response on each line.
a. Explained how what they learned in class related to the real world
Almosteveryday(a)
Once ortwice aweek
(b)
Once ortwice amonth
(C)
Once ortwice a
semester(d)
Never
le)
2257 1 31 4E 5M
b. Worked individually on projects or presentations 2258 1 31 41 51
c. Worked on projects that required at least one week to complete 259 1 2 31 4M 5E
d. Evaluated and improved their own work 260 1 21 31 41 51.
e. Worked on problems for which there were several appropriateanswers 261 1 2 3 41 5
f. Worked on problems for which there were several appropriatemethods of solution 262 1 21 31 41 5
g. Worked as part of a group on projects or presentations to earnindividual grades 263 1 2 3 41 5
h. Evaluated the work of other students 264 1 21 3 41 5IE
i. Worked as part of a group on projects or presentations to earn agroup grade 2 3D265 1 5
j. Put events or things in order and explained why they wereorganized that way 266 1 2111 31 41 51
k. Discussed with the whole class solutions developed in small groups 267 1 2 3 41 5111
I. Conferred with other students about their work 268 1 21 31 41 51
39. Over the last semester, how often did you emphasizethe following with these students?Mark (X) one response on each line.
a. Generalizing from patterns or examples 269 1 21 31 4E 51
b. Analyzing and interpreting information 270 1 21 31 41 51
c. Organizing, summarizing, or displaying information 271 1 2 31 41 511I
40. During a class discussion in your DESIGNATED CLASS if astudent gave an incorrect response how frequently did youdo each of the following?Mark (X) one response on each line.
a. Call on other students to get their responses and then discusswhat is correct 272 1 2 3 41 51111
b. Ask the student another question to help him or her get thecorrect response 273 1 21 3 4 501
C. Call on another student likely to give the correct response 274 1 21 31 4 51
d. Provide the correct response yourself 275 1 2 3 4 5
FOAM TFS-3 11-3-95)
c 2Page 17

SECTION IV - TEACHING METHODS - CONTINUED41. This following is a list of ACTIVITIES TO COMPLETE AT
HOME or homework you might have assigned yourstudents. Although the list is not exhaustive, mostactivities could be considered variations of those listedbelow. For each activity described below, indicate thefrequency with which you assigned each over the lastsemester in your DESIGNATED CLASS.Mark 'never" for activities you did not assign during the lastsemester.Mark (X) one response on each line.
a. Write a journal entry
Almosteveryday(a)
Once ortwice aweek
(D)
Once ortwice amonth
(c1
Once ortwice a
semester(d)
Never
(e)
276 1 2 3 4 5
b. Prepare a written report 277 1 2 31 41 5
c. Work on problems for which there is no obvious method of solution 278 1 2 3 4 51
d. Read the textbook or other assigned reading 279 1 2 3 4 5
e. Apply concepts or principles to different or unfamiliar situation 2280 1 31 4 S
f. Read supplementary material 281 1 2 3 4 5
g. Complete routine exercises or problems from worksheet,workbook, or text 282 1 2 3 III 4 5111
h. Work on a project, gather data, conduct an experiment 283 1 2 3 4 5
i. Prepare an oral report 2 40284 1 3 5
II. Complete a short writing assignment 285 1 2 III 3 4 51
42. When students in your DESIGNATED CLASS wereassigned written homework or activities to complete athome, how often did YOU do each of the following?Mark "never" for activities you did not assign during the lastsemester.Mark (X) one response on each line.
a. Record only whether assignment was completed
Always
(a)
Often
(b)
Some-times
(c)
Rarely
(d)
Never
lel
.
286 1 2 3 4 5
b. Collect, correct, and keep assignments 287 1 2 31 4 5 111
C. Keep items in a student portfolio 288 1 2 3 4 5
d. Collect, correct, and return assignment to students 289 1 2 3 4 5
e. Have students exchange assignments and correct them in class 290 1 2 3 4 5f. Have students correct their own assignments in class 50291 1 2 3 4
g. Use assignment as a basis for class discussion 292 1 2 31 4 5
h. Use assignment as a basis for grading students 293 1 2 III 3 4 5
I Use assignment as a basis for lesson planning 294 1 3 402 5
Page 18 FORM TFS-311-3-95

SECTION IV - TEACHING METHODS - CONTINUED43. Estimate the amount of time, in minutes, an average student
doing homework or activities you assigned students in yourcomplete at home during an average WEEK.Mark (X) only one box.
in your class spentDESIGNATED CLASS to
295 1 0 minutes2 1-30 minutes3 31-60 minutes4 61-90 minutes5 91-120 minutes6 121-150 minutes7 151-180 minutes8 181-210 minutesa 211-240 minutes
44. How often do you use assessment information for thefollowing purposes in your DESIGNATED CLASS?Mark (X) one response on each line.
a. Determining student grades or other formal progress reports
Always
(a)
Often
(b)
Some-times
(c)
Rarely
(d)
Never
(e)
296 1 2 3 4 5
b. Providing feedback to students 297 1 2 3 4 5
c. Diagnosing student learning problems 2981 2 3 4 5
d. Reporting to parents 299 1 2 3 4 5
e. Assigning students to different programs or tracks 300 1 2 3 4 5
f. Planning for future lessons 301 1 2 3 5
NOTES
cl 4FORM TFS-3 (1-3-95) Page 19

SECTION IV - TEACHING METHODS - CONTINUED45. In determining student grades or other formal progress
reports for students in your DESIGNATED CLASS,indicate the importance you gave to each of thefollowing.Mark (X) one response on each line.
a. Effort
Extremelyimportant
(a)
Veryimportant
(b)
Somewhatimportant
(c)
Notimportant
(d)
302 1 2 E 3 4 MI
b. Individual improvement or progress over past performance 303 1 III 2 3 4
c. Absolute level of achievement 304 1 2 3 4
d. Achievement relative to the rest of the class 305 1 2 3 4
e. Class participation 306 1 2 3 4
f. Regular completion of homework assignments 4D307 1 2 3
g. Consistent attendance 308 1 2 3 111 4
h. Results of standardized tests produced outside the school 309 1 2 3 4 Ill
i. Results of tests with open-ended items 310 1 2 3 4
j. Results of tests with multiple choice or true-false items made byyou or other teachers 311 1 2 3 4
k. Performance on projects or practical exercises 312 1 2 3 4
I. Your own observations of students 313 1 2 III 3 4
m. Items collected in student portfolios 314 1 2 3 4
The following questions ask about your classroom use of studentstudent-generated artifacts that provide evidence over the semesterindividual student performance and growth. Please answer the followingsemester or grading period with your DESIGNATED CLASS.
46. In what content areas were PORTFOLIOS used with your DESIGNATED
If portfolios were not used with your designated class, mark "None".
Mark (X) all that apply.
_
PORTFOLIOS.or year about
questions
Portfoliosthe range
about
CLASS?
are a collectionand extent
portfolio use
ofoflast
315 1 English/language arts316 2 Math317 3 Reading318 4 Social studies319 5 Science320 6 Art321 7 MUSiC
322 8 Home economics323 9 Foreign language324 10 Other325 0 None GatOieni 61 ;
C, --e..; 3
Page 20FORM TFS-3 (1-3-1

SECTION IV - TEACHING METHODS - CONTINUED47. What types of student work were included in portfolios?
Mark (X) all that apply.
326 1 Worksheets327 2 Open-ended problems328 3 Exploratory investigations329 4 Long-term projects330 5 Inter-disciplinary problems331 6 Journal entries332 7 Regularly assigned homework333 8 0 Self-reflective writing334 9 Narrative writing335 10 Audio or video examples336 11 Group work337 12 Independent work338 13 Tests and assessments
48. How were decisions made about the types of items that wentportfolio? Selecting from those options listed below, indicatedirectives and suggestions that guided the selection processyour DESIGNATED CLASS. Directives are mandated and suggestionsMark (X) all that apply.
Mark as "NA" those that do not apply.
a. School administration
into a student'sthe source of
for portfolios inare not.
Directive Suggestion N/A
339 1 2 3
b. School committee or task force 340 1 2 3
c. District staff 341 1 2 3
d. District committee or task force 342 1 2 3
e. State administration 343 1 2 3
f. State committee or task force 344 1 2 3
g. Classroom teacher 345 1 2 3
h. Students 346 1 2 3
i. Other 347 1 2 3
NOTES
cr .,
FORM TFS-3 (1-3-95) Page 21

SECTION IV - TEACHING METHODS - CONTINUED49. How often did you use student portfolios in your DESIGNATED
or grading period for the following purposes?Mark (X) one response on each line.
a. Training students to reflect upon and/or assess eachpiece of work
CLASS last semester
Almosteveryday(a)
Once ortwice aweek
(b)
Once ortwice amonth
(c)
Once ortwice a
semester(d)
Never
le)
3348 1 2 4 5
b. Training students to reflect upon and/or assess theiroverall progress 3349 1 2 4 5
c. Communicating student progress to parents 3350 1 2 4 5
d. Determining student grades or other formal progress reports 3351 1 2 4 5
e. Planning for future lessons 3352 1 2 4 5
f. Diagnosing student learning problems 3353 1 2 4 5
g. Making informed decisions about student placement 3354 1 2 4 5
h. Making informed decisions about student graduation 3355 1 2 4 5
i. Providing information for program or school accountability 3356 1 2 4 5
50. Listed below are statements about portfolio use in the classroom.DESIGNATED CLASS last semester or grading period, pleasestrongly agree, somewhat agree, somewhat disagree, or stronglystatement.Mark (X) one response on each line.
a. Criteria about types of work to be included or excludedin the portfolio were explicitly defined and were known bystudents
indicateFor your
whetherdisagree
youwith each
Stronglyagree
Cal
Somewhatagree
(b)
Somewhatdisagree
(c)
Stronglydisagree
(d)
357 1 2 3 4
b. Criteria and process for evaluating work in the portfoliowere explicity defined and were known by students 358 1 1.1 2 3 4
C. Process to encourage students to reflect upon and revisework included in portfolio was explicitly defined and was knownby students 359 1 2 3 4
d. Process to encourage student and teacher to workcollaboratively on portfolios was explicitly definedand was known by students 360 1 2 3 4
e. Process to identify the amount and type of supportstudent receives in completing each piece was explicitlydefined and was known by students 361 1 2 3 4
Page 22 FORM TFS-3 (1 -3 -95

SECTION V - INCENTIVES AND COMPENSATION51. The following questions refer to your before-tax earnings from teaching and other
employment from the summer of 1994 through the end of the 1994-95 school year.Record earnings in whole dollars.
a. DURING THE SUMMER OF 1994, did you have any earnings from -(1) Teaching summer school in this or any other school?
362 10 Yes How much? 363 $ .00
2 0 No
(2) Working in a nonteaching job in this or any other school?
364 10 Yes - How much? 365 .00
2 0 No
(3) Working in any NONSCHOOL job?
3661 Yes - How much? 367 .00
2 0 No
b. DURING THE CURRENT SCHOOL YEAR -(1) What is your academic year base salary for teaching in this school?
368 .00 per year
(2) Do you, or will you, earn any additional compensation from your school for extracurricularor additional activities such as coaching, student activity sponsorship, or evening classes?
3891 Yes - How much? 370 .00
2 No
371
(3) Do you, or will you, earn additional compensation from working in any job outside thisschool system?
10 Yes How much?No
A
372 .00
Which of these best describes this job outside the school system? Mark (X) only one box.
3731 Teaching or tutoring2 Nonteaching, but education related3 Not related to education
(4) Have you EARNED income from any other sources this year, e.g4, a bonus, statesupplement, etc.?
3741 Yes - How much? 375 $ .00
2 0 No
376
c. What will be your total EARNED income from all sources from the summer of 1994 throughthe end of this school year? Your answer should equal the sum of your answers to questions51a(1)-b(4).
.00
FORM TFS-3 (1-3.95)
3 3Page 23

SECTION VI - BACKGROUND INFORMATION
52. DoMark
377
378
379
380
381
382
383
you receive(X) all
any income-in-kind in addition to or in lieu of your school salary?that apply.
or housing expenses
for your children
care
tuition for yourself
expenses
of the above
1 II Housing
2M Meals
311 Tuition
40 Child5 College6 III Car/transportation
0 None
53. WhichFAMILYnetanyMark
384
category represents the total combined income (include your own income) of ALLMEMBERS age 14 and older in your household during 1994? Include money from jobs,
business or farm income, pensions, dividends, interest, rent, Social Security payments, andother income received by family members in your household.
(X) only one box.1 Less than $10,000 5 $25,000 - $29,999 s $50,000 $59,9992 $10,000 - $14,999 611 $30,000 $34,999 1o $60,000 $74,9993 $15,000 $19,999 7 11$35,000 $39,999 11 i $75,000 $99,9994111 $20,000 - $24,999 8 $40,000 $49,999 121111 $100,000 or more
54. What385
is your current marital status?
divorced, or separatedmarried
1 Ill Married20 Widowed,30 Never
55. Howthan
388
rChildren
manyhalf of
oCD NoneOR
children do you have who are dependent on you (and your spouse) for moretheir financial support?
Fg::7W
supported
56. Whatthan
387
wasone year,
the age of your youngest child on his/her last birthday? (If child is lessplease enter "0.")
Age of youngest child
57a.
388
b.
389
Domore
you havethan
persons other than your spouse or children who are dependent on you forhalf of their financial support?
ill Yes-2 No
,. ....:1_,...fig
Howmore
manythan
persons other than your spouse or children are dependent on you forhalf of their financial support?
Number of persons supported
Page 24 FORM TFS-3 (1-3-9!

SECTION VII - RESPONDENT INFORMATIONThe survey you have completedgain information on currentinformation would assist
58. Please PRINT your name,telephone number, and
may involve a brief follow-up at a later time in order toteachers' movements in the labor force. The following
us in contacting you if you move or change jobs.
your spouse's name (if applicable), your home address,the most convenient time to reach you.
labelno i Same as address
391 Your name Telephone number Include area code
( )
Spouse's full name Days/times convenient to reach you
Street address In whose name is the telephone number listed?Mark (X) only one.
1 No phone2 My name3 Other - Specify7
City t State ZIP Code
59. What are the names and addresses of two other people who will know where to get intouch with you during the coming years? List no more than one person who now liveswith you. Remember to record the relationship of these persons to you (for example,parent, friend, sister, cousin, etc.).
392 Name Telephone number Include area code
( )
Relationship to you
Street address In whose name is the telephone number listed?Mark (X) only one.
1 No phone2 Name entered above3 Other Specify7
City State ZIP Code
393 Name Telephone number Include area code
( )
Relationship to you
Street address In whose name is the telephone number listed?Mark (X) only one.
i No phone2 Name entered above3 Other - Specify?
City State ZIP Code
60. Not counting interruptions, how long did it take
394 Minutes
to complete this survey?
THIS COMPLETES THE QUESTIONNAIRE.THANK YOU FOR ASSISTING US IN THIS IMPORTANT RESEARCH.
YOUR TIME AND EFFORT ARE APPRECIATED.FORM TFS-3 (1.3-951 Page 25

THANK YOU FOR ASSISTING US IN THIS IMPORTANT SURVEY.YOUR TIME AND EFFORT ARE APPRECIATED.
PLEASE RETURN THE QUESTIONNAIRE IN THE ENCLOSED ENVELOPE TO:
Bureau of the CensusCurrent Projects Branch1201 East 10th StreetJeffersonville, IN 47132-0001
1 0Page 26 FORM TFS-3 (1-3-951

(Ple
ase
corr
ect a
ny e
rror
in n
ame,
add
ress
, and
ZIP
Cod
e.)

1994-95 Teacher Followup SurveyAppendix CQuestionnaire for Former Teachers
Appendix C
Teacher Followup SurveyQuestionnaire for Former Teachers
103 C-1

OMB No. 1850-0617: Approval Expires 12/31/95
NCITIICIE',-This report is authorized by law (20 U.S. Code 1221e). Your answers will be kept strictlyconfidential. Results from this survey will appear in summary or statistical form only so that individualscannot *identified.
U.S. Department of EducationNational Center for Education Statistics
TEACHER FOLLOW-UP SURVEYUESTIONNAIRE FOR FORMER TEACHERS
1994 1995
Conducted by:
U.S. Department of CommerceBureau of the Census
TFS
THIS SURVEY HAS BEEN ENDORSED BY:American Association for Counseling and DevelopmentAmerican Association of School AdministratorsAmerican Federation of TeachersBureau of Indian AffairsCouncil for American Private EducationCouncil of Chief State School OfficersNational Association of Elementary School PrincipalsNational Association of Independent SchoolsNational Association of Secondary School PrincipalsNational Catholic Educational AssociationNational Education Association
002
3 OFFICE USE ONLY
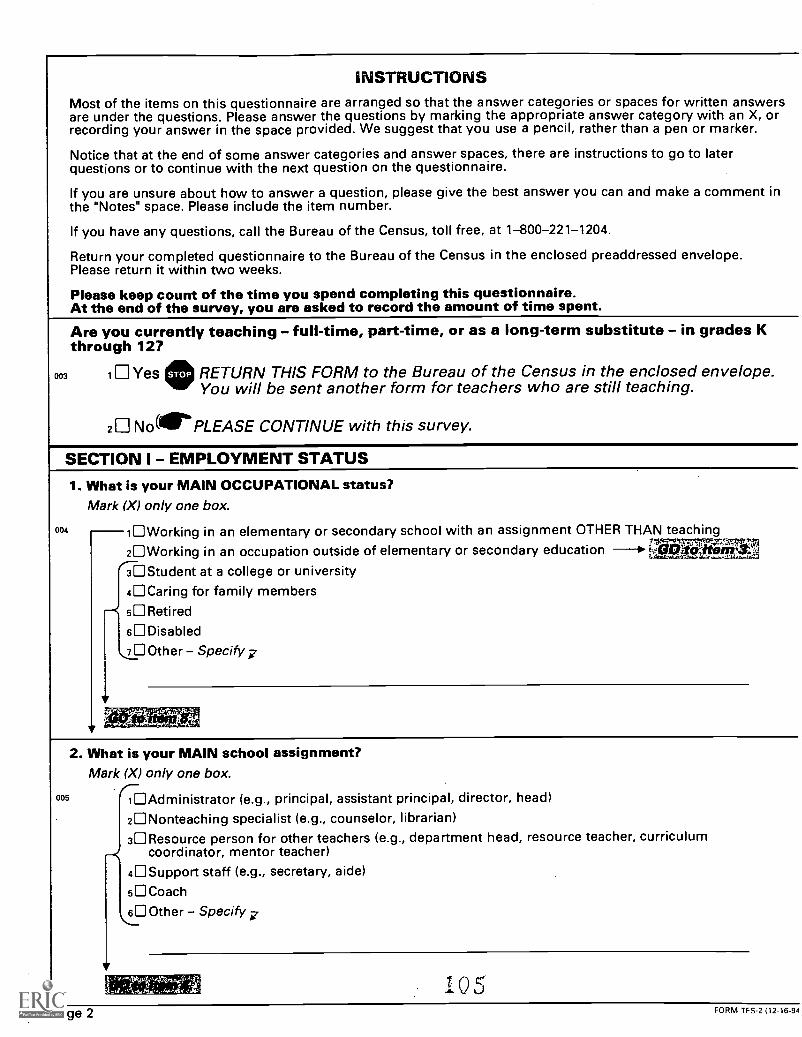
INSTRUCTIONSMost of the items on this questionnaire are arranged so that the answer categories or spaces for written answersare under the questions. Please answer the questions by marking the appropriate answer category with an X, orrecording your answer in the space provided. We suggest that you use a pencil, rather than a pen or marker.
Notice that at the end of some answer categories and answer spaces, there are instructions to go to laterquestions or to continue with the next question on the questionnaire.
If you are unsure about how to answer a question, please give the best answer you can and make a comment inthe "Notes" space. Please include the item number.
If you have any questions, call the Bureau of the Census, toll free, at 1-800-221-1204.
Return your completed questionnaire to the Bureau of the Census in the enclosed preaddressed envelope.Please return it within two weeks.
Please keep count of the time you spend completing this questionnaire.At the end of the survey, you are asked to record the amount of time spent.Are you currently teaching - full-time, part-time, or as a long-term substitute - in grades Kthrough 12?
003 1 Yes 4:) RETURN THIS FORM to the Bureau of the Census in the enclosed envelope.You will be sent another form for teachers who are still teaching.
2 NoArb PLEASE CONTINUE with this survey.
SECTION I - EMPLOYMENT STATUS
1. What is your MAIN OCCUPATIONAL status?Mark (X) only one box.
004 10Working in an elementary or secondary school with an assignment OTHER THAN teaching2Working in an occupation outside of elementary or secondary education ----0.W174it 1A23 Student at a college or university0 Caring for family members
5 III Retired
160Disabled7 70 Other - Specify 7
,tht. 3. A' "-2. What is your MAIN school assignment?
Mark (X) only one box.
I. Administrator (e.g., principal, assistant principal, director, head)2ONonteaching specialist (e.g., counselor, librarian)3Resource person for other teachers (e.g., department head, resource teacher, curriculum
.t1
coordinator, mentor teacher)4 Support staff (e.g., secretary, aide)
5 Ill Coach
600ther Specify 7
vtu .,....60,,,z46.?",,,..:4a,,,,i
0Page 2 FORM TFS-2 (12-16-9e

SECTION I EMPLOYMENT STATUS - CONTINUED
NOTE: Answer questions 3a-e ONLY if you marked box 2 in answer to question 1 on page 2.3a. For whom do you work? Record the name of the company, business, or organization. ,
b. What kind of business or industry is this? For example, retail shoe store, State LaborDepartment, bicycle manufacturer, farm.,
Office use only
c. What kind of work do you do? Please record your job title; for example, electricalengineer, cashier, typist, farmer, loan officer. 7
Office use only
d. What are your most important activities or duties at this job? For example, typing,selling cars, driving delivery truck, caring for livestock., -
e. How would you classify yourself on this job?Mark (X) only one box.
008 1 An employee of a PRIVATE company, business, or individual for wages, salary, or commission2A FEDERAL government employee3A STATE government employee4A LOCAL government employee5SELF-EMPLOYED in your own business, professional practice, or farm6Working WITHOUT PAY in a family business or farm7Working WITHOUT PAY in a volunteer job
4. Which of these best describes your position as an EMPLOYEE?Mark (X) only one box.
009 1 OFull time employee23/4 time or more, but less than full-time employee301/2 time or more, but less than 3/4 time employee401/4 time or more, but less than 1/2 time employee5Less than 1/4 time employee
5. Altogether, how much do you usually earn at this job before taxes?
010 $Dollars
011 1 Hour20Day3Week40 Biweekly5Month6Year7 0ther - Specify
Cents
FORM TFS-2 (12-16-94) Page 3

SECTION I - EMPLOYMENT STATUS - CONTINUEDO. How long do you plan to remain in this job?
Mark (X) only one box.012 .-1 0 As long as I am able
2 Until I am eligible for retirement
f530Will probably continue unless something better comes along40 Definitely plan to leave as soon as I can0 Undecided at this time
013
7. In how many years do you plan to retire?
Years
8. What do you expect your MAIN activity will be NEXT SCHOOL YEAR (1995-96)?Mark (X) only one box.
014 11:Teach i ng any of grades K-122Teaching at the prekindergarten or postsecondary level3Student at a college or university40 Working in a nonteaching occupation in the field of education5Working in an occupation outside the field of education6Caring for family members7Unemployed and seeking work80 Military service9Retiredio0Other - Specify7
SECTION II - EDUCATIONAL ACTIVITIES AND FUTURE PLANS9. Have you earned any new degrees in the past 12 months?
015 1 Yes;2No
1-1.
; , It',..
10. When did you earn this degree?
016
Month017 1 9
Year
11. What type of degree is it?Mark (X) only one box.
018 1 Associate degree20 Bachelor's30 Master's4Education specialist or professional diploma (at least one year beyond Master's level)5DDoctorate (e.g., Ph.D., Ed.D.)6Professional (e.g., M.D., D.D.S., J.D., L.L.B.)
Page 4 BEST COPY AVAILABLEFORM TFS-2 (12-16-94

SECTION II - EDUCATIONAL ACTIVITIES AND FUTURE PLANS - CONTINUEDMAJOR FIELD OF STUDY CODES FOR QUESTIONS 12 and 16EDUCATION
General education01 Pre-elementary/early childhood education03 Elementary education04 Secondary education
Subject area education07 Agricultural education11 Art education13 Bilingual education15 Business, commerce, and distributive education89 Crosscultural education22 English education23 English as a second language24 Foreign languages education29 Home economics education88 American Indian/Native American education30 Industrial arts, vocational and technical, trade
and industry education34 Mathematics education38 Music education40 Physical education/health education43 Reading education45 Religious education46 Science education48 Social studies/social sciences education
Special education67 Special education, general68 Emotionally disturbed69 Mentally retarded70 Speech/language impaired71 Deaf and hard-of-hearing72 Visually handicapped73 Orthopedically impaired74 Mildly handicapped75 Severely handicapped76 Specific learning disabilities77 Other special education
Other education78 Curriculum and instruction79 Educational administration80 Educational psychology81 Counseling and guidance82 Other education
GENERAL06 Agriculture and natural resources86 American Indian/Native American studies87 Other area and ethnic studies08 Architecture and environmental design10 Art, fine and applied14 Business and management16 Communications and journalism17 Computer and information sciences19 Drama, theater20 Engineering21 English (literature, letters, speech, classics)25 General studies27 Health professions and occupations28 Home economics85 Humanities31 Law32 Library science33 Mathematics35 Military science36 Multi/interdisciplinary studies37 Music39 Philosophy41 Psychology42 Public affairs and services44 Religion, theologyForeign languages51 French52 German53 Latin54 Russian55 Spanish56 Other foreign languagesNatural sciences57 Biology/life science58 Chemistry59 Geology/earth science60 Physics61 Other natural sciencesSocial sciences62 Economics63 History64 Political science and government65 Sociology66 Other social sciences84 All others
12. What is the major field of study for your NEW degree?Enter the field and two-digit code from the list above.
019
Code Major field
13. For what purpose did you earn this degree? Mark (X) only one box.020 1 OTo increase salary
20For professional development in current field3DTo teach in a different field than the one taught last year40 For a nonteaching position in elementary or secondary eduCation60For an occupation outside elementary or secondary education other than current job60 Other - Specify 7
FORM TFS-2 (12-16-941
108 Page 5

SECTION 11 - EDUCATIONAL ACTIVITIES AND FUTURE PLANS - CONTINUED
14. Are you currently enrolled in a degree program?Mark (X) only one box.
----i ::. ,dir4021 10No2 0Yes, as a full-time student3 0Yes, as a part-time student
v15. What type of degree are you pursuing?
Mark (X) only one box.022 1 Associate degree
2 Bachelor's
3 Master's4 Education specialist or professional diploma (at least one year beyond Master's level)
5 0 Doctorate (e.g., Ph.D., Ed.D.)6Professional (e.g., M.D., D.D.S., J.D., LL.B.)
16. What is the major field of study for the degree you are pursuing?Enter the field and two-digit code from the list on page 5.
023
Code Major field
17. ForMark
024 1
2
3
4For5
600ther
what purpose are you pursuing this degree?(X) only one box.To increase current salaryFor professional development in current fieldTo teach in a different field than the one taught last year
a nonteaching position in elementary or secondary education
For an occupation outside elementary or secondary education other than current job
- Specify?
. .
18.
025
DoMark
1
2
3
you plan to return to teaching?(X) only one box.UndecidedYes
,..r:....tzt;,4 07-,4E 'No --- .,,e4: ,;).
19. How soon might you return to teaching?Mark (X) only one box.
026 1 Later this school year
. 20 Next year3Within five years4 More than five years from now5 Undecided 10 9 BEST COPY AVAILABLE
Page 6 FORM TFS-2 (12-16-S

SECTION II - EDUCATIONAL ACTIVITIES AND FUTURE PLANS - CONTINUED
20.
027
At which level would you teach?Mark (X) all that apply.1 0Prekindergarten
028 2 Elementary (including kindergarten)029 30Junior high/middle school030 4 Senior high
031 5 III Postsecondary
21. Has there been a change in your teacher certification status since last year?Mark (X) all that apply.
032 1 No change
033 2 Yes, certification has lapsed034 3 111Yes, certification-has been upgraded from temporary or emergency to a regular certificate
035 4 Yes, certified in a different field038 5 Other change - Specify 7
22. Do you plan to maintain or reinstate your teaching certificate?037 1 Yes
2 No
30 Undecided
NOTES
FORM TFS-2 112-16-94) J. Page 7

SECTION III - YOUR OPINIONSPOSSIBLE REASONS FOR LEAVING THE TEACHING PROFESSION
(Use codes to answer items 23a, b, and c.)
01 Family or personal move02 Pregnancy/child rearing
03 Health
04 To retire05 To pursue another career06 For better salary or benefits07 To take courses to improve career opportunities in the field of education08 To take courses to improve career opportunities outside the field of education09 School staffing action (e.g., reduction-in-force, lay-off, school closing, school reorganization,
reassignment)10 To take a sabbatical or other break from teaching11 Dissatisfied with teaching as a career
. 12 Other family or personal reason
23a. What was your main reason for leaving the teaching profession?Enter code from above.
039
Code Main reason
b. Did you have a second reason for leaving?
1-10Yes2 0 NO --to
041
042
043
(.4
What was your second reason? Enter code, then continue with item 23c.
Code
c. Did you have a third reason for leaving?
-10Yesr2 0 NO
What was your third reason? Enter code.
Code
d. Did you enter code 11 for one of your reasons in question 23a, b, or c?OU 1 Yes
fzNo
BEST COPY AVAILABLE
Page 8 FORM TFS-2 (12-16-9-

SECTION III - YOUR OPINIONS - CONTINUED
POSSIBLE AREAS OF DISSATISFACTION(Use codes to answer items 23e, f, and g.)
01 Poor opportunity for professional advancement02 Lack of recognition and support from administration03 Lack of resources and material/equipment for your classroom.04- Inadequate support from administrationOS Lack of influence over school policies and practices06 Lack of control over own classroom07 Intrusions on teaching time (i.e., not enough time working directly with teaching students)
08 Inadequate time to prepare lesson/teaching plansOS Poor student-motivation to learn10 Class sizes too large11 Student discipline problems12 Poor salary
3e. What was your main area of dissatisfaction with the teaching profession?Enter code from above.
048
Code Main dissatisfaction
f. Did you have a second area of dissatisfaction?
048 ti Yes2 0NO
047
What was your second area? Enter code, then continue with item 23g.
Code
g. Did you have a third area of dissatisfaction?
(is i Yes20 NO --00
049
V4#4.1.4A1
What was your third area? Enter code.
Code
FORM TFS-2 112-16-94) L. Page 9

SECTION - YOUR OPINIONS - CONTINUED
POSSIBLE STEPS SCHOOLS MIGHT TAKE TO ENCOURAGETEACHERS TO REMAIN IN TEACHING(Use codes to answer items 24a, b, and c.)
01 Providing higher salaries and/or better fringe benefits02 Improving opportunities for professional advancement03 Dealing more effectively with student discipline and making schools safer04- Giving teachers more authority in the school and in their own classrooms05 Increasing standards for students' academic performance06 Providing better resources and materials for classroom use
07 Decreasing class size08 Giving special recognition and/or special assignments to excellent or outstanding teachers09 Reducing the paperwork burden on teachers10 Providing more support for new teachers (e.g., mentor teacher programs)11 Increasing parent involvement in the schools12 Reducing teacher workload13 Providing merit pay or other pay incentives to teachers14 Improving opportunities for professional development15 Providing tuition reimbursement for coursework required for certification or career advancement16 Revising health insurance program to include stress reduction seminars, counseling, and
physical fitness options
24a. What would be the most effective step that schools might take toencourage teachers to remain in teaching?Enter code from above.
050 Most effective stepCode
b. What wouldEnter code
be the second most effective step?from above.
051 Second stepCode
c. What wouldEnter code
be the third most effective step?from above.
052 Third stepCode
113Page 10 FORM TFS-2 112-16-941

SECTION III - YOUR OPINIONS - CONTINUED
25.
053
v
Is your MAIN occupational status "working" (i.e., box 1 or 2 markedquestion 11?
in
1M Yes;2No
.
26.
a.
b.
C.
d.
e.
f.
g.
h.
i.
j.
k.
I.
m.
n.
o.
p.
q.
r.
How would you rate teaching relative to your currentMAIN occupation in terms of EACH of the followingaspects? Please indicate (a) Better in teaching, (b)Better in current position, or (c) No difference.
Salary
Better inteaching
(a
Better incurrentposition
(b)
Nodifference
(c
054 1 32 III
Opportunities for professional advancement 055 1 2 3
Opportunities for professional development 056 1 2 3
Opportunities for learning from colleagues 057 1 2 3
Recognition and support from administrators/managers 058 1 2 3
Safety of environment 059 1 2 3
Influence over workplace policies and practices 060 1 2 3
Autonomy or control over your own work 061 1 2 3
Professional prestige 062 1 2 3
Benefits 063 1 2 3
Procedures for performance evaluation .064 1 2 3
Manageability of workload 065 1 2 3
Availability of resources and materials/equipment for doing job 066 1 2 3
General work conditions 067 1 2 3
Job security 2 3068 1
Professional caliber of colleagues 0 069 1 2 3
Intellectual challenge 070 1 2 3
Overall job satisfaction 071 1 2 3
FORM TFS-2 112-16-941BEST COPY AVAILABLE
Page 11

SEOTIO Jill- YOUR OPINIONS CONTINUEDSatisfied are you with EACH of the following
Qspecte of your CURRENT job? Are you (a) Veryiitithifliith:(b) Somewhat satisfied, (c) Somewhatlihisathilled,-or (d) Very dissatisfied with -
. ,
Wary
Verysatisfied
(a)
Somewhatsatisfied
(b)
Somewhatdissatisfied
(c)
Verydissatisfied
(d) ,
072 1 2 3 4
.... -. .
. pportunibes for professional advancement 073 1 2 3 4
iiition and support from administrators/managers 074 1 2 3
ety of environment 075 1 2 3 4
. , our influence over workplace. policies and practices 076 1 2 3 4
AtitOnomy or control over your own work 077 1 2 3 4
Professional prestige 2 3 4078 1 II
Benefits 079 1 2 3 4
I. : Procedures for performance evaluation 080 1 2 3 4
j. Manageability of work 081 1 2 3 4
k. Availability of resources and materials for doing job 082 1 2 3 4
I. General work conditions 083 1 2 3 4
m. Job security 084 1 2 3 4
n. Professional caliber of colleagues 085 1 2 3 4
o. Intellectual challenge 086 1 2 El 3 4
p. Overall job satisfaction 087 1 2 43
NOTES
BEST COPY AVAILABLE
15Page 12 FORM TFS-2 112-16-94)

SECTION IV - BACKGROUND INFORMATION
28..
088
INhichcategoryFAMILYnet businessany otherMark (X)
represents the total combined income (include your own income) of ALLMEMBERS age 14 and older in your household during 1994? Include money from jobs,
or farm income, pensions, dividends, interest, rent, Social Security payments, andincome received by family members in your household. .
only one box.Less than $10,000
$10,000 - $14,999
$15,000 - $19,999
$20,000 - $24,999
$25,000 - $29,999
$30,000 $34,999$35,000.-- $39,999_ ..
640,000 '- t49,999
$59,999
$60,000 - $74,999
$75,000 - $99,999
$100,000 or more
1
2
3
e6
7
8
60$50,000,--ioii12
29.089
What is your current marital status?MarriedWidowed, divorced, or separatedNever married
123 III
30.
090
091
How manythan half
children do you have who are dependent on you (and your spouse) for moreof their financial support?
,...vNone---b.0
on
Children supported
31.
092
What wasthan one
the age of your youngest child on his/her last birthday? If child is lessyear, please enter "0.
Age of youngest child
32a.
093
b.
094
Do youmore than
have persons other than your spouse or children who are dependent on you forhalf of their financial support?
YesNo
ill1r20
' '-'''
How manymore than
persons other than your spouse or children are dependent on you forhalf of their financial support?
Number of persons supported
FORM TFS-2 112-16-941 BLE Page 13

SECTION V - RESPONDENT INFORMATIONThe survey you have completedgain information on formerinformation would assist
33. Please PRINT your name,telephone number, and
may involve a brief follow-up at a later time in order toteachers' movements in the labor force. The following
us in contacting you if you move or change jobs.
your spouse's name (if applicable), your home address,the most convenient time to reach you.
label096 1 111 Same as address
096 Your name Telephone number Include area code
( )
Spouse's full name Days/times convenient to reach you
Street address In whose name is the telephone number listed?Mark (X) only one.
i No phone2 My name3D Other - Specify?
City State ZIP Code
34. Whatare the names and addresses of two other people who will know where to get intouch with you during the coming years? List no more than one person who now liveswith you. Remember to record the relationship of these persons to you (for example,parent, friend, sister, cousin, etc.).
097 Name Telephone number Include area code
( )
Relationship to you
Street address In whose name is the telephone number listed?Mark (X) only one.
i No phone2 Name entered above3 Other - Specify?
City State ZIP Code
098 Name Telephone number Include area code
( )
Relationship to you
Street address In whose name is the telephone number listed?Mark (X) only one.
i No phone2O Name entered above3 Other - Specify?
City State ZIP Code
35. Not counting interruptions, how long did it take
099 Minutes
to complete this survey?
THIS COMPLETES THE QUESTIONNAIRE.THANK YOU FOR ASSISTING US IN THIS IMPORTANT RESEARCH.
YOUR TIME AND EFFORT ARE APPRECIATED.Page 14 t
FORM TFS-2 (12-16-S

THANK YOU FOR ASSISTING US IN THIS IMPORTANT SURVEY.YOUR TIME AND EFFORT ARE APPRECIATED.
PLEASE RETURN THE QUESTIONNAIRE IN THE ENCLOSED ENVELOPE TO:
Bureau of the CensusCurrent Projects Branch1201 East 10th StreetJeffersonville, IN 47132-0001
FORM TFS-2 112-16-94)
1/8Page 15

.
(Ple
ase
corr
ect a
ny e
rror
in n
ame,
add
ress
, and
ZIP
Cod
e.)
1994-95 Teacher Follow up SurveyAppendix D SA SS and TFS Data Products
Appendix D
SASS and TFS Data Products
120 D-1

1994-95 Teacher Followup SurveyAppendix DSA SS and TFS Data Products
SCHOOLS AND STAFFING SURVEY (SASS) AND TEACHER FOLLOWUP SURVEY (TFS)DATA PRODUCTS
The following SASS data products may be obtained free of charge while supplies last from:
U.S. Department of EducationNational Center for Education StatisticsSASS Data Products555 New Jersey Avenue, NW, Room 422Washington, DC 20208-5651
Reports
The Effects of Professionalization on Teachers: A Multi-Level Analysis, 1990-91 (NCES97-069)
The State of Teaching as a Profession, 1990-91 (NCES 97-104)
Time Spent Teaching Core Academic Subjects in Elementary Schools: Comparisons AcrossCommunity School, Teacher, and Student Characteristics (NCES 97-293)
Student Records Questionnaire: School Year 1993-94, With Special Emphasis on AmericanIndians and Alaska Native Students (E.D. Tab, NCES 97-449)
Characteristics of Stayers, Movers, and Leavers: Results from the Teacher Followup Survey,1994-95 (E.D. Tab, NCES 97-450)
Characteristics of American Indian and Alaska Native Education, Results from the 1993-94DSDD (NCES 97-451)
Public and Private School Principals In The United States: A Statistical Profile, 1987-88 to1993-94 (NCES 97-455)
A Profile of Administration Policies and Practices for Limited English Proficiency Students:Screening Methods, Teacher Training, and Program Support, 1993-94 (NCES 97-472)
The Schools and Staffing Survey Recommendation for the Future (NCES 97-596)
Out-of-Field Teaching and Educational Equality (NCES 96-040)
Schools and Staffing in the United States: A Statistical Profile: 1993-94 (NCES 96-124)
Private School Universe Survey, 1993-94 (NCES 96-143)
SASS by State, 1993-94 Schools and Staffing Survey: Selected State Results (NCES 96-312)
Comparing Key Organizational Qualities of American Public and Private Secondary Schools(NCES 96-322)
D-2
121

1994-95 Teacher Followup SurveyAppendix D SA SS and TFS Data Products
Reports (continued)
Schools and Staffing in the United States: Selected Data for Public and Private Schools,1993-94 (E.D. Tab, NCES 95-191)
Private Schools in the United States: A Statistical Profile, 1990-91 (NCES 95-330)
Teacher Supply in the U.S.: Sources of Newly Hired Teachers in Public and Private Schools,1988-1991 (NCES 95-348)
Characteristics of American Indian and Alaska Native Education, Results from the 1990-91SASS (NCES 95-735)
Teacher Supply, Teacher Qualifications and Teacher Turnover, Aspects of Teacher Supply andDemand in the U.S., 1990-91 (NCES 95-744)
The Patterns of Teacher Compensation (NCES 95-829)
Characteristics of Stayers, Movers, and Leavers: Results from the Teacher Followup Survey,1991-92 (E.D. Tab, NCES 94-337)
SASS by State (NCES 94-343)
Private School Universe Survey, 1991-92 (NCES 94-350)
Qualifications of the Public School Teacher Workforce: 1988 and 1991 (NCES 94-665)
America's Teachers: Profile of a Profession (NCES 93-025)
Private School Universe Survey, 1989-90 (NCES 93-122)
Selected Tables on Teacher Supply and Demand (E.D. Tab, NCES 93-141)
Schools and Staffing in the United States: A Statistical Profile, 1990-91 (NCES 93-146)
Schools and Staffing in the United States: Selected Data for Public and Private Schools,1990-91 (E.D. Tab, NCES 93-453)
Schools and Staffing in the United States: A Statistical Profile, 1987-88 (NCES 92-120)
Characteristics of Stayers, Movers, and Leavers: Results from the Teacher Followup Survey,1988-89 (E.D. Tab, NCES 91-128)
Forthcoming Reports
America's Teachers: Profile of a Profession, 1993-94
Job Satisfaction Among America's Teachers: Effects of Workplace, Conditions, BackgroundCharacteristics, and Teacher Compensation, 1993-94
122D-3

1994-95 Teacher Follow up SurveyAppendix DSA SS and TFS Data Products
Forthcoming Reports (continued)
Private Schools in the U.S.: A Statistical Profile, 1993-94
Sources of Newly Hired Teachers in Public and Private Schools, 1988-94
Characteristics of Public School Districts, 1993-94
Issue Briefs
Schools Serving Family Needs: Extended-Day Programs in Public and Private Schools (IssueBrief, NCES 97-590)
Programs for Aspiring Principals: Who Participates? (Issue Brief, NCES 97-591)
Credentials and Tests in Teacher Hiring: What Do Districts Require? (Issue Brief, NCES97-592)
Are Limited English Proficient (LEP) Students Being Taught by Teachers with LEP Training?(Issue Brief, NCES 97-907)
How Widespread is Site-Based Decisionmaking in Public Schools? (Issue Brief, NCES97-908)
Public School Choice Programs, 1993-94: Availability and Student Participation (Issue Brief,NCES 97-909)
Teachers' Sense of Community: How Do Public and Private Schools Compare? (Issue Brief,NCES 97-910)
Are High School Teachers Teaching Core Subjects Without College Majors or Minors inThose Subjects? (Issue Brief, NCES 96-839)
Where Do Minority Principals Work? (Issue Brief, NCES 96-840)
What Academic Programs are Offered Most Frequently in Schools Serving American Indianand Alaska Native Students? (Issue Brief, NCES 96-841)
How Safe are the Public Schools: What Do Teachers Say? (Issue Brief, NCES 96-842)
Extended Day Programs in Elementary and Combined Schools (Issue Brief, NCES 96-843)
What Criteria are Used in Considering Teacher Applicants? (Issue Brief, NCES 96-844)
Private School Graduation Requirements (Issue Brief, NCES 95-145)
How Much Time Do Public and Private School Teachers Spend in Their Work? (Issue Brief,NCES 95-709)
D-4 123
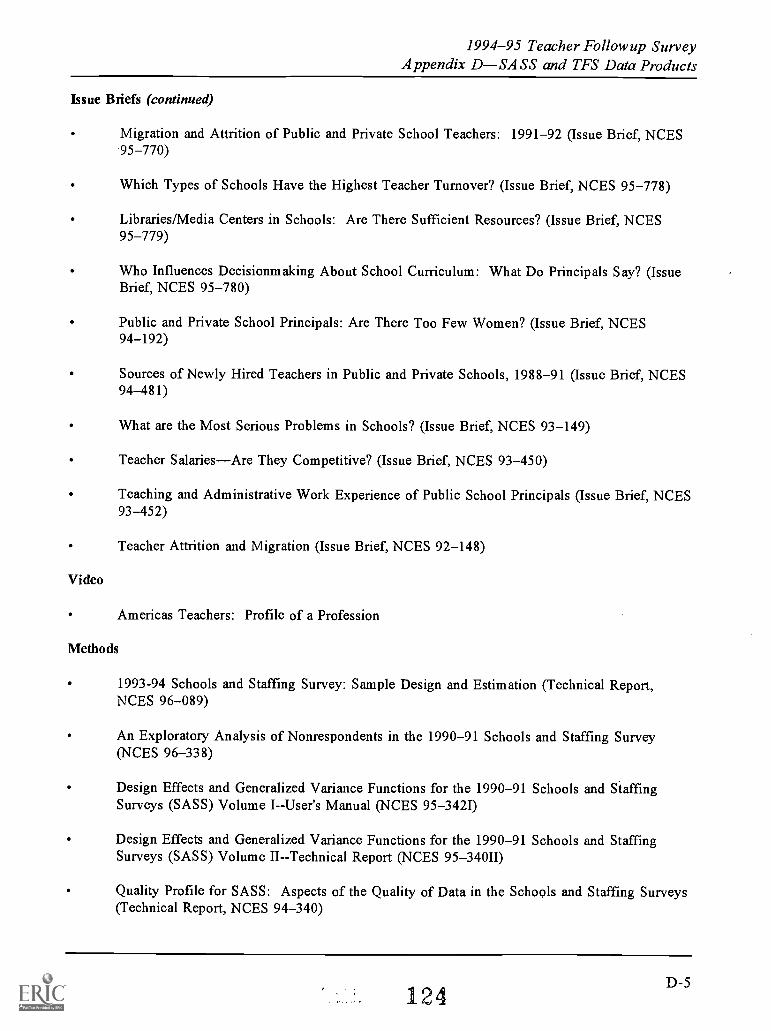
1994-95 Teacher Follow up SurveyAppendix D SA SS and TFS Data Products
Issue Briefs (continued)
Migration and Attrition of Public and Private School Teachers: 1991-92 (Issue Brief, NCES-95-770)
Which Types of Schools Have the Highest Teacher Turnover? (Issue Brief, NCES 95-778)
Libraries/Media Centers in Schools: Are There Sufficient Resources? (Issue Brief, NCES95-779)
Who Influences Decisionmaking About School Curriculum: What Do Principals Say? (IssueBrief, NCES 95-780)
Public and Private School Principals: Are There Too Few Women? (Issue Brief, NCES94-192)
Sources of Newly Hired Teachers in Public and Private Schools, 1988-91 (Issue Brief, NCES94-481)
What are the Most Serious Problems in Schools? (Issue Brief, NCES 93-149)
Teacher SalariesAre They Competitive? (Issue Brief, NCES 93-450)
Teaching and Administrative Work Experience of Public School Principals (Issue Brief, NCES93-452)
Teacher Attrition and Migration (Issue Brief, NCES 92-148)
Video
Americas Teachers: Profile of a Profession
Methods
1993-94 Schools and Staffing Survey: Sample Design and Estimation (Technical Report,NCES 96-089)
An Exploratory Analysis of Nonrespondents in the 1990-91 Schools and Staffing Survey(NCES 96-338)
Design Effects and Generalized Variance Functions for the 1990-91 Schools and StaffingSurveys (SASS) Volume I--User's Manual (NCES 95-3421)
Design Effects and Generalized Variance Functions for the 1990-91 Schools and StaffingSurveys (SASS) Volume II--Technical Report (NCES 95-34011)
Quality Profile for SASS: Aspects of the Quality of Data in the Schools and Staffing Surveys(Technical Report, NCES 94-340)
D-54

1994-95 Teacher Follow up SurveyAppendix DSA SS and TFS Data Products
Methods (continued)
1990-91 Schools and Staffing Survey: Sample Design and Estimation (Technical Report,NCES 93-449)
Modeling Teacher Supply and Demand, with Commentary (Research and DevelopmentReport, NCES 93-461)
1987-88 Schools and Staffing Survey: Sample Design and Estimation (Technical Report,NCES 91-127)
CD-ROMs
Schools and Staffing Survey: 1993-94 Electronic Codebook and Public Use Data
Schools and Staffing Survey: 1990-91 Electronic Codebook and Public Use Data
Schools and Staffing Survey, 1987-88 Microdata and Documentation
Questionnaires
SASS and PSS Questionnaires 1993-1994 (NCES 94-674)
SASS and TFS Questionnaires 1990-1991
SASS and TFS Questionnaires 1987-1988
User's Manuals
1993-94 Schools and Staffing Survey, Data File User's Manual Volume I: SurveyDocumentation (NCES 96-142)
1993-94 Schools and Staffing Survey, Data File User's Manual Volume II: Restricted-UseCodebook (NCES 96-142II)
1990-91 Schools and Staffing Survey: Data File User's Manual Volume I: SurveyDocumentation (NCES 93-144I)
1990-91 Schools and Staffing Survey: Data File User's Manual Volume II: Restricted-Usecodebook (NCES 93-144II)
1990-91 Schools and Staffing Survey: Data File User's Manual Volume III: Public-Usecodebook (NCES 93-144III)
1990-91 Schools and Staffing Survey: Data File User's Manual Volume IV: Bureau of IndianAffairs (BIA) Restricted-Use Codebooks: Administrator, Schools, and Teachers (NCES93-144IV)
D-6
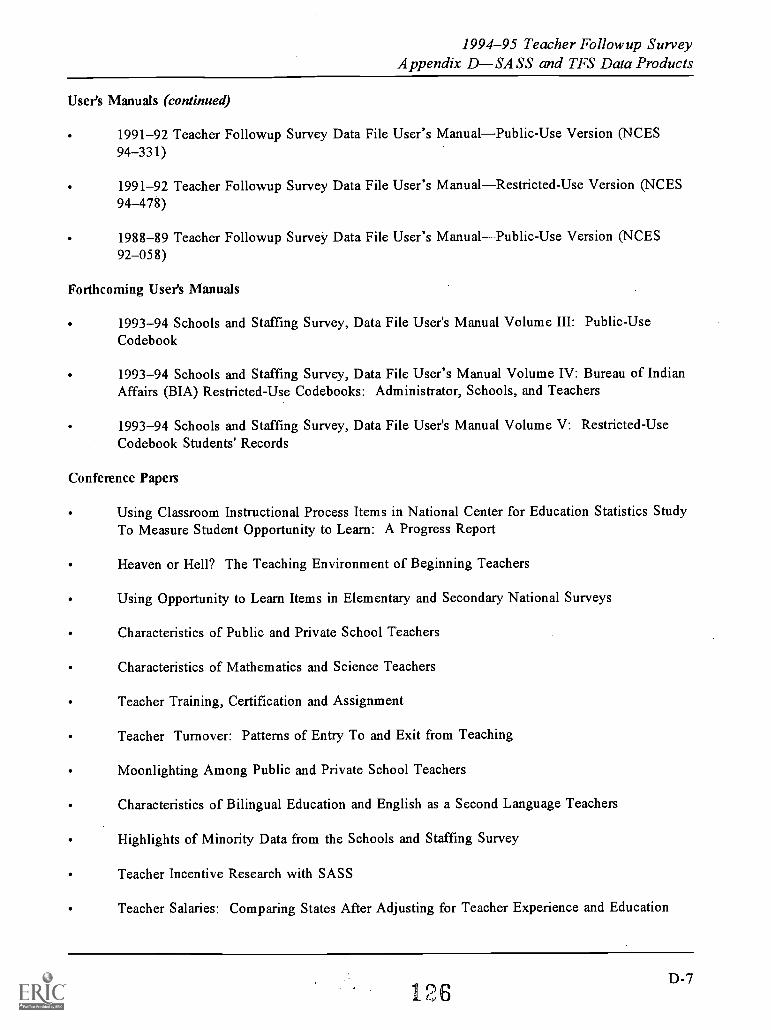
1994-95 Teacher Follow up SurveyAppendix D SA SS and TFS Data Products
User's Manuals (continued)
1991-92 Teacher Followup Survey Data File User's ManualPublic-Use Version (NCES94-331)
1991-92 Teacher Followup Survey Data File User's ManualRestricted-Use Version (NCES94-478)
1988-89 Teacher Followup Survey Data File User's ManualPublic-Use Version (NCES92-058)
Forthcoming User's Manuals
1993-94 Schools and Staffing Survey, Data File User's Manual Volume III: Public-UseCodebook
1993-94 Schools and Staffing Survey, Data File User's Manual Volume IV: Bureau of IndianAffairs (BIA) Restricted-Use Codebooks: Administrator, Schools, and Teachers
1993-94 Schools and Staffing Survey, Data File User's Manual Volume V: Restricted-UseCodebook Students' Records
Conference Papers
Using Classroom Instructional Process Items in National Center for Education Statistics StudyTo Measure Student Opportunity to Learn: A Progress Report
Heaven or Hell? The Teaching Environment of Beginning Teachers
Using Opportunity to Learn Items in Elementary and Secondary National Surveys
Characteristics of Public and Private School Teachers
Characteristics of Mathematics and Science Teachers
Teacher Training, Certification and Assignment
Teacher Turnover: Patterns of Entry To and Exit from Teaching
Moonlighting Among Public and Private School Teachers
Characteristics of Bilingual Education and English as a Second Language Teachers
Highlights of Minority Data from the Schools and Staffing Survey
Teacher Incentive Research with SASS
Teacher Salaries: Comparing States After Adjusting for Teacher Experience and Education
126D-7

1994-95 Teacher Followup SurveyAppendix DSA SS and TFS Data Products
Conference Papers (continued)
What are the Characteristics of Principals Identified as Effective by Teachers
Schools at Risk: Results of the 1987-88 Schools and Staffing Survey
Destinations of Movers and Leavers: Where Do They Go?
Teacher Salaries: Comparing States After Adjusting for Teacher Experience and Education
Classroom Environment and Support of Beginning Teachers: A Test of the "Crucible versusCradle" Theory of Teacher Induction
Why do Teachers Leave Teaching? Reasons for Teacher Attrition from the Teacher FollowupSurvey
NCES Working Papers Related to SASS
WP 94-01 Schools and Staffing Survey (SASS). Papers Presented at the Meetings of the AmericanStatistical Association
Section on Survey Research Methods, August 1992
a. "The Schools and Staffing Survey: Research Issues"b. "The Schools and Staffing Survey: How Reinterview Measures Data Quality"c. "Mail Versus Telephone Response in the 1991 Schools and Staffing Surveys"d. "Questionnaire Research in the Schools and Staffing Survey: A Cognitive Approach"e. "Balance Half-Sample Replication with Aggregation Units"f. "Characteristics of Nonrespondents in the Schools and Staffing Surveys' School Sample"g. "Improving Reliability and Comparability on NCES Data on Teachers and Other Education
Staff'
Establishment Surveys Conference, June 1993
a. "Sampling Frames at the United States National Center for Education Statistics"b. "Monitoring Data Quality in Education Surveys"
Section on Survey Research Methods, August 1993
a. "Generalization Variance Functions for the Schools and Staffing Surveys"b. "A Bootstrap Variance Estimator for the Schools and Staffing Survey"c. "Adjusting for Nonresponse Bias of Correlated Items Using Logistic Regression"d. "Comparisons of School Locale Setting: Self-Reported Versus Assigned"e. "Characteristics of Nonrespondents to the 1990-91 Schools and Staffing Survey"
D-8

1994-95 Teacher Follow up SurveyAppendix D SASS and TFS Data Products
NCES Working Papers Related to SASS (continued)
Social Statistics Section, August 1993
a. "Implicit Markets for Teacher Quality and School Attributes"b. "Who Decides? Principals' and Teachers' Views on Decision-Making"c. "Determinants of Pupil-Teacher Ratios at School Sites: Evidence from the Schools and
Staffing Survey"
WP 94-02 Generalized Variance Estimates for Schools and Staffing Survey (SASS)
WP 94-03 1991 Schools and Staffing Survey (SASS) Reinterview Response Variance Report
WP 94-04 The Accuracy of Teachers' Self-report on Their Postsecondary Education: TeacherTranscript Study, Schools and Staffing Survey
WP 94-06 Six Papers on Teachers from the 1990-91 Schools and Staffing Survey and OtherRelated Surveys
a. "The Results of the 1993 Teacher List Validation Study (TLVS)"b. "Designing the Teacher Follow-up Survey (TFS): Issues and Content)"c. "Understanding the Supply of Elementary and Secondary Teachers: The Role of the School
and Staffing Survey and the Teacher Followup Survey"d. "Teacher Retention/Attrition: Issues for Research"e. "Reflections on a SASS Longitudinal Study"f. "Whither Didst Thou Go? Retention, Reassignment, Migration, and Attrition of Special and
General Education Teachers in National Perspective"
WP 95-01 Schools and Staffing Survey: 1994. Papers Presented at the 1994 Meeting of theAmerican Statistical Association (95-01)
Estimation Issues in School Surveys
a. "Intersurvey Consistency in School Surveys"b. "Estimation Issues Related to the Student Component of the SASS"c. "Properties of the Schools and Staffing Survey's Bootstrap Variance Estimator"d. "Optimal Periodicity of a Survey: Sampling Error, Data Deterioration, and Cost"
Response and Coverage Issues in School Surveys
a. "Some Data Issues in School-Based Surveys"b. "The 1991-92 Teacher Follow-up Survey Reinterview and Extensive Reconciliation"c. "Improving Coverage in a National Survey of Teachers"d. "Improving the Coverage of Private Elementary-Secondary Schools"
D-9
128

1994-95 Teacher Follow up SurveyAppendix DSA SS and TFS Data Products
NCES Working Papers Related to SASS (continued)
Education Research Using the Schools and Staffing Surveys and the National EducationLongitudinal Study
a. "Adding Value to the Value-Added Educational Production Function Specification"b. "Teacher Quality in Public and Private Schools"c. "Teacher Shortages and Teacher Quality"d. "Work Experience, Local Labor Markets, and Dropping out of High School"
WP 95-02 QED Estimates of the 1990-91 Schools and Staffing Survey: Deriving and ComparingQED School Estimates with CCD Estimates
WP 95-03 Schools and Staffing Survey: 1990-91 SASS Cross-Questionnaire Analysis
WP 95-08 CCD Adjustment to the 1990-91 SASS: A Comparison of Estimates
WP 95-09 The Results of the 1993 Teacher List Validation Study (TLVS)
WP 95-10 The Results of the 1991-92 Teacher Follow-up Survey (TFS) Reinterview and ExtensiveReconciliation
WP 95-11 Measuring Instruction, Curriculum Content, and Instructional Resources: The Status ofRecent Work
WP 95-15 Classroom Instructional Processes: A Review of Existing Measurement Approaches andTheir Applicability for the Teacher Followup Survey
WP 95-16 Intersurvey Consistency in NCES Private School Surveys
WP 95-17 Estimates of Expenditures for Private K-12 Schools
WP 95-18 An Agenda for Research on Teachers and Schools: Revisiting NCES" Schools andStaffing Survey
WP 96-01 Methodological Issues in the Study of Teachers' Careers: Critical Features of a TrulyLongitudinal Study
WP 96 -02. Selected papers presented at the meeting of the 1995 American Statistical Association(96-02)
Overcoming the Bureaucratic Paradigm: Memorial Session in Honor of Roger Herriot
a. "1995 Roger Herriot Award Presentation"b. "Space/Time Variations in Survey Estimates"c. "Out of the Box: Again and Again, Roger Herriot at the Census Bureau"
D-10
1'9
1994-95 Teacher Followup SurveyAppendix DSA SS and TFS Data Products
NCES Working Papers Related to SASS (continued)
Design and Estimation Issues for School Based Surveys
a. "Improving the Coverage of Private Elementary-Secondary Schools"b. "Improving GLS Estimation in NCES Surveys"c. "Optimal Periodicity of a Survey: Alternatives under Cost and Policy Constraint"d. "Properties of the Schools and Staffing Survey's Bootstrap Variance Estimator"
Data Quality and Nonresponse in Education Surveys
a. "Assessing Quality of CCD Data Using a School-Based Sample Survey"b. "Documentation of Nonresponse and Consistency of Data Categorization Across NCES
Surveys"c. "Multivariate Modeling of Unit Nonresponse for 1990-91 Schools and Staffing Surveys"d. "Evaluation of Imputation Methods for State Education Finance Data"e. "Variance Estimates Comparison by Statistical Software"f. "Teacher Supply and Demand in the U.S."
WP 96-05 Cognitive Research on the Teacher Listing Form for the Schools and Staffing Survey
WP 96-06 The Schools and Staffing Survey (SASS) for 1998-99; Design Recommendations toInform Broad Education Policy
WP 96-07 Should SASS Measure Instructional Processes and Teacher Effectiveness?
WP 96-09 Making Data Relevant for Policy Discussions: Redesigning the School AdministratorQuestionnaire for the 1998-99 SASS
WP 96-10 1998-99 Schools and Staffing Survey: Issues Related to Survey Depth
WP 96-11 Towards an Organizational Data Base on America's Schools: A Proposal for the Futureof SASS, with Comments on School Reform, Governments, and Finance
WP 96-12 Predictors of Retention, Transfer, and Attrition of Special and General EducationTeachers: Data from the 1989 Teacher Followup Survey
WP 96-15 Nested Structures: District Level Data in the SASS
WP 96-16 Strategies for Collecting Finance Data from Private Schools
WP 96-23 Linking Student Data to SASS: Why, When, How
WP 96-24 National Assessments of Teacher Quality
WP 96-25 Measures of Inservice Professional Development: Suggested Items for the 1998-99SASS
WP 96-26 Improving the coverage of Private Elementary-Secondary Schools
130 D-11

1994-95 Teacher Follow up SurveyAppendix D SA SS and TFS Data Products
NCES Working Papers Related to SASS (continued)
WP 96-27 Intersurvey Consistency in NCES Private School Surveys for 1993-94
WP 96-28 Student Learning, Teaching Quality, and Professional Development: TheoreticalLinkages, Current Measurement, and Recommendations for Future Data Collection
WP 97-01 Selected Papers on Education Surveys: Papers Presented at the 1996 Meeting of theAmerican Statistical Association
Developing Questionnaires for Education Surveys
a. "Teacher Quality and Educational Inequality"b. "Using Qualitative Methods to Validate Quantitative Survey Instruments"c. "Revising the NCES Private School Survey: A Method to Design a Systematic
Classification of Private Schools in the United States"
Data Quality in Education Surveys
a. "An Analysis of Response Rates of SASS 1993-94"b. "An Overview of NCES Surveys Reinterview Programs"c. "Estimating Response Bias in an Adult Education Survey"
Design and Estimation in School-Based Surveys
a. "Optimal Periodicity of a Survey: Extensions of Probable-Error Models"b. "Estimating the Variance in the Presence of Imputation Using a Residual"c. "Where Will It All End? Some Alternative SASS Estimation Research Opportunities"d. "Estimating State Totals from the Private School Universe Survey"
Policy Analysis with Education and Defense Manpower Survey Data
a. "Effect of High School Programs on Out-Migration of Rural Graduates"
WP 97-07 The Determinants of Per-Pupil Expenditures in Private Elementary and SecondarySchools: An Exploratory Analysis.
43'
D-12

9
SBN
780160
0 16 049079-0
111490798
132
0000
BEST COPY AVAILABLE

(9192)
U.S. DEPARTMENT OF EDUCATIONOffice of Educational Research and improvement (OERI)
Educational Resources information Center (ERIC)
NOTICE
REPRODUCTION BASIS
I ERIC 1
This document is covered by a signed "Reproduction Release(Blanket)" form (on file within the ERIC system), encompassing allor classes of documents from its source organization and, therefore,does not require a "Specific Document" Release form.
This document is Federally-funded, or carries its own permission toreproduce, or is otherwise in the public domain and, therefore, maybe reproduced by ERIC without a signed Reproduction Releaseform (either "Specific Document" or "Blanket").