Embed Size (px)
Citation preview
1350 IEEE TRANSACTIONS ON POWER SYSTEMS, VOL. 25, NO. 3, AUGUST 2010
A Self-Adaptive RBF Neural NetworkClassifier for Transformer Fault Analysis
Ke Meng, Member, IEEE, Zhao Yang Dong, Senior Member, IEEE, Dian Hui Wang, Senior Member, IEEE, andKit Po Wong, Fellow, IEEE
Abstract—A new hybrid self-adaptive training approach-basedradial basis function (RBF) neural network for power transformerfault diagnosis is presented in this paper. The proposed methodis able to generate RBF neural network models based on fuzzyc-means (FCM) and quantum-inspired particle swarm optimiza-tion (QPSO), which can automatically configure network structureand obtain model parameters. With these methods, the numberof neuron, centers and radii of hidden layer activated functions,as well as output connection weights can be automatically calcu-lated. This learning method is proved to be effective by applying theRBF neural network in the classification of five benchmark testingdata sets, and power transformer fault data set. The results clearlydemonstrated the improved classification accuracy compared withother alternatives and showed that it can be used as a reliable toolfor power transformer fault analysis.
Index Terms—Computational methods, particle swarm opti-mization, power transformer fault diagnosis, radial basis function(RBF) neural network.
I. INTRODUCTION
P OWER system stability depends on the reliable opera-tion of various individual components within the network.
Power transformer is one of the necessary and significant unitsin the transmission and distribution levels of a power system;however, it is subjected to many different types of faults whichmay cause interruptions in power supply, consequently result inserious economic losses as well as social impacts. As a result,effective fault diagnosis approaches are warrant to detect andanalyze the power transformer internal faults, and eliminate theassociated impacts to the lowest possible level.
To understand the phenomena of transformer faults, differentmethods have been suggested and reported [1]–[9]. Dissolvedgas analysis (DGA) method has been widely accepted and used
Manuscript received May 26, 2009; revised October 29, 2009. First publishedFebruary 22, 2010; current version published July 21, 2010. Paper no. TPWRS-00379-2009.
K. Meng and Z. Y. Dong are with the Department of Electrical Engineering,The Hong Kong Polytechnic University, Hong Kong (e-mail: [email protected]; [email protected]; [email protected]).
D. H. Wang is with the Department of Computer Science and ComputerEngineering, La Trobe University, Melbourne, VIC 3086, Australia (e-mail:[email protected]).
K. P. Wong is with the Department of Electrical Engineering, The Hong KongPolytechnic University, Hong Kong, and also with the School of Electrical, Elec-tronic, and Computer Engineering, University of Western Australia, Perth, Aus-tralia (e-mail: [email protected]).
Color versions of one or more of the figures in this paper are available onlineat http://ieeexplore.ieee.org.
Digital Object Identifier 10.1109/TPWRS.2010.2040491
in the internal faults diagnosis of power transformers for years[1]. Because once the internal faults occur, the rate of celluloseand oil degradation will increase significantly. These fault gasesare produced by degradation of transformer oil and solid insu-lating materials. However, the key gas and ratio techniques aremainly built on the knowledge/experience gained from previousfault diagnosis, which might vary from utility to utility, and nogeneral mathematical rule can be summarized. Fortunately, theartificial intelligence-based methods provide a perfect solutionto the deficiency, which include expert systems [2], fuzzy logics[3], [4], artificial neural networks (ANNs) [5]–[8], and supportvector machine (SVM) [9]. The expert systems and fuzzy logicapproaches involve human expertise, and have many successfulapplications. However, the major challenge is how to acquireexpert experience, and transform this prior human knowledgeinto decision rules and membership functions. Furthermore, thefinal accuracy largely depends on the completeness and repre-sentation of accumulated human experience/knowledge. ANNsand SVMs have attracted widespread attention due to the maturetheory background as well as satisfactory analysis performance.ANNs for power transformer fault analysis have been shown asbeing able to give effective and reliable performance [5], [7].The detailed studies of ANNs and SVMs for transformer faultdiagnosis are carried out in the following sections.
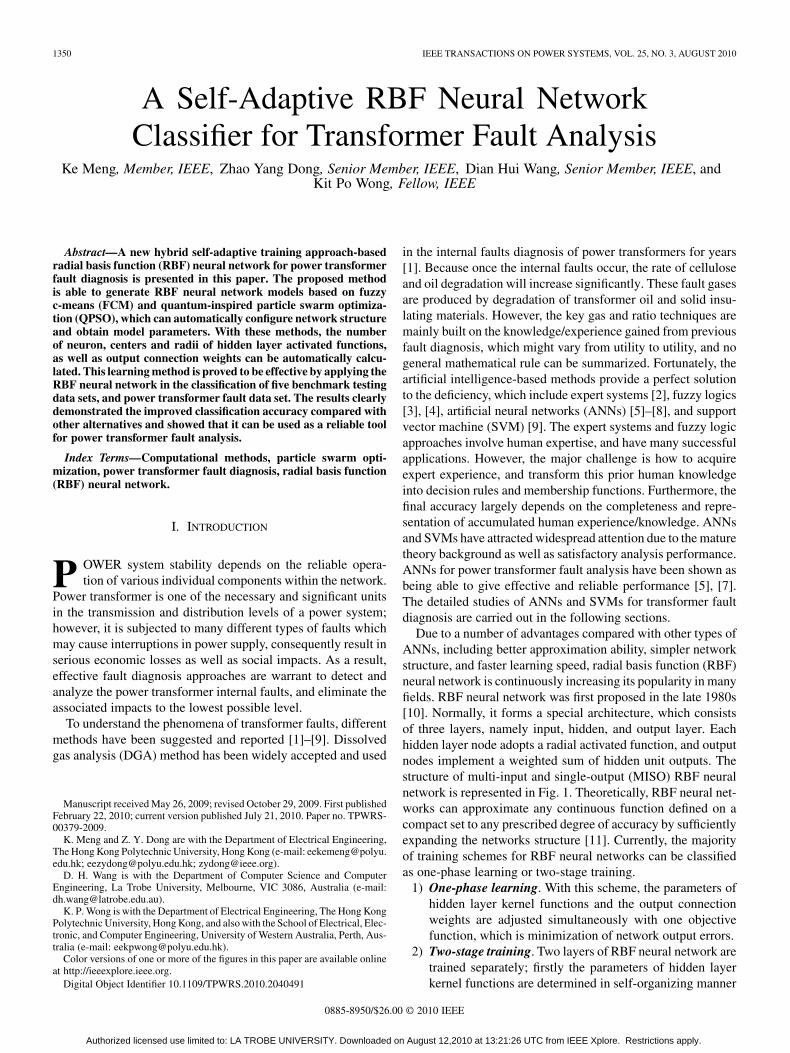
Due to a number of advantages compared with other types ofANNs, including better approximation ability, simpler networkstructure, and faster learning speed, radial basis function (RBF)neural network is continuously increasing its popularity in manyfields. RBF neural network was first proposed in the late 1980s[10]. Normally, it forms a special architecture, which consistsof three layers, namely input, hidden, and output layer. Eachhidden layer node adopts a radial activated function, and outputnodes implement a weighted sum of hidden unit outputs. Thestructure of multi-input and single-output (MISO) RBF neuralnetwork is represented in Fig. 1. Theoretically, RBF neural net-works can approximate any continuous function defined on acompact set to any prescribed degree of accuracy by sufficientlyexpanding the networks structure [11]. Currently, the majorityof training schemes for RBF neural networks can be classifiedas one-phase learning or two-stage training.
1) One-phase learning. With this scheme, the parameters ofhidden layer kernel functions and the output connectionweights are adjusted simultaneously with one objectivefunction, which is minimization of network output errors.
2) Two-stage training. Two layers of RBF neural network aretrained separately; firstly the parameters of hidden layerkernel functions are determined in self-organizing manner
0885-8950/$26.00 © 2010 IEEE
Authorized licensed use limited to: LA TROBE UNIVERSITY. Downloaded on August 12,2010 at 13:21:26 UTC from IEEE Xplore. Restrictions apply.
MENG et al.: A SELF-ADAPTIVE RBF NEURAL NETWORK CLASSIFIER FOR TRANSFORMER FAULT ANALYSIS 1351
Fig. 1. Typical MISO RBF neural network structure.
or assigned randomly, followed by the output connectionweights adjusted through various supervised techniques.
However, how to choose suitable network structures hasalways been the problem which limits their wider applications.A small network may never converge or take very long timeto converge, while a large one may converge very fast but lackgeneralization ability. How to select the suitable structure forneural network is still largely built on a trial and error basis.Consequently, the key element for their further acceptance is todevelop a scheme which is able to automatically generate opti-mally structured neural networks by any given sample, whichensures both strong learning and generalization capabilities.However, one-phase learning scheme requires strong abilityfor algorithm itself, due to the difficulties involved in highdimension optimization problems, therefore comparativelytwo-stage training method is preferable.
Normally, in a two-stage training approach for RBF neuralnetworks, the kernel function centers are determined by clus-tering approach. The popular clustering techniques are the hardc-means (HCM) and fuzzy c-means (FCM), which belong tounsupervised clustering approaches on the basis of computingdistance [12]. FCM is a data clustering technique in which eachdata point belongs to a cluster, providing a method that showshow to group the data that populate multidimensional space intoa specific number of different clusters [13]. It starts with a setof initial guesses for cluster centers, which are intended to markthe mean location of each cluster. With these initial cluster cen-ters, it assigns every data point a membership grade to eachcluster. By iteratively updating the cluster centers as well as themembership grades for each data point, FCM moves the clustercenters to the right location within the data set. However, it isworth noting that the unsupervised clustering algorithms are notpreferable in determining the number of hidden layer clusters,especially when dealing with complex data distribution. In thispaper, based on FCM, a fuzzy clustering method is adopted.
When it comes to the calculation of output layer connectionweights, existing approaches mainly fall into three categories:matrix inversion technique [14], gradient-based training method[15], and global optimization approaches [16], [17]. The matrixinversion method mainly deals with linear weights optimizationand it often suffers from the “curse of dimensionality” problemwhen the network size is very large and sometimes the inversematrix does not exist at all. The gradient-based training methodsare quite fast provided that the gradient information of the error
surface is known; however, most of them often easily fall intolocal optima. The global optimization techniques are mainlythe evolutionary algorithms (EAs), such as genetic algorithm(GA), differential evolution (DE), and particle swarm optimiza-tion (PSO). They can be used to train neural networks due totheir global optimization capabilities. Although these methodsdo not always guarantee discovering the globally optimal so-lutions in finite time, they often provide reasonably good solu-tions. GA ensures population evolves and solution changes con-tinually, however, they often lack a strong capacity of producingthe best offspring individuals and may experience slow conver-gence when approaching global optimum. DE is with no doubta very powerful method, but the greedy updating scheme andintrinsic differential property may lead the evolution process betrapped by local optima [18], [19]. PSO converges very quickly,but has a slow fine-tuning ability of the solution. Once it getsstuck into local optima, it is very hard to jump off it. Generallyspeaking, each approach has its own advantages and drawbacks.Many attempts try to merge some of their individual implemen-tations together into a hybrid algorithm to overcome individualdisadvantages and to maximize their various advantages. Com-pared with other techniques, PSO is computationally inexpen-sive in terms of memory and speed. The most attractive featuresof PSO can be summarized as, simple concept, easy implemen-tation, fast speed, and robust capability [20]. In this paper, sev-eral concepts from quantum computing and immunology areadopted to improve the search capability of conventional PSO,and then quantum-inspired particle swarm optimization (QPSO)[21] is introduced.
The paper is organized as follows: after introduction, FCMand QPSO will be reviewed for completeness, followed by thedetailed steps of proposed approach. Then numerical simula-tions are presented and this methodology is tested with fivebenchmark classification data sets, and power transformer faultdata set. Conclusions and further developments are given in thelast section.
II. CONFIGURATIONS OF RBF NEURAL NETWORK
A. RBF Neural Network Structure
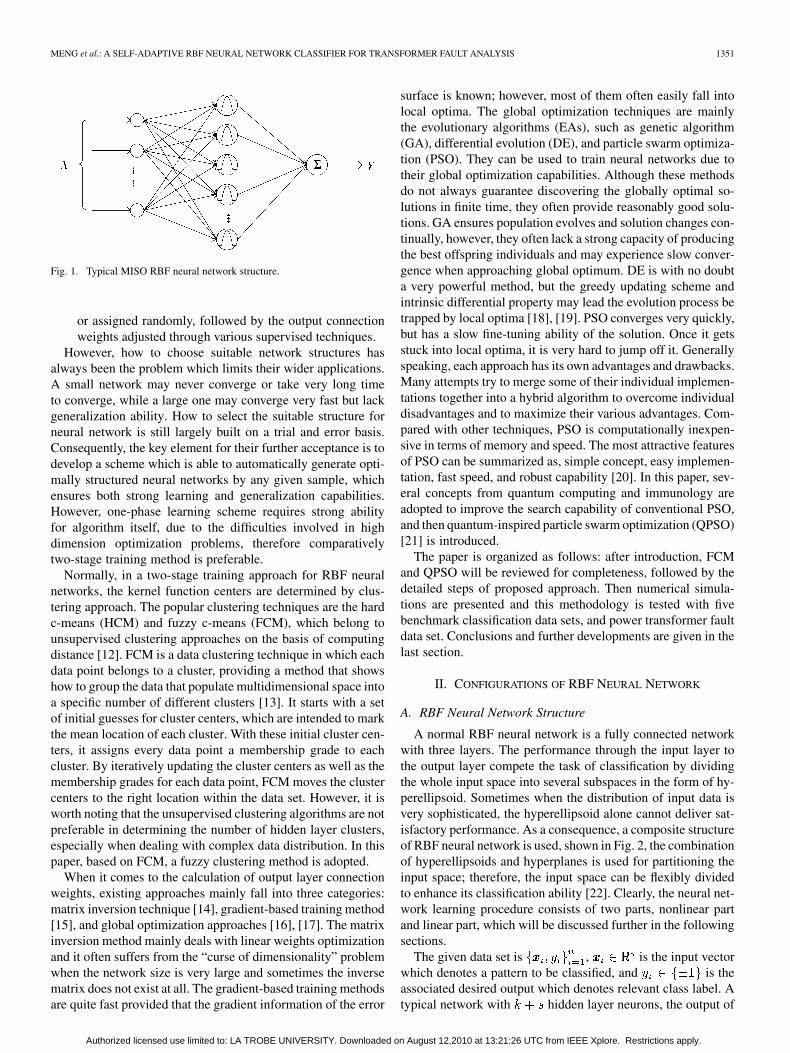
A normal RBF neural network is a fully connected networkwith three layers. The performance through the input layer tothe output layer compete the task of classification by dividingthe whole input space into several subspaces in the form of hy-perellipsoid. Sometimes when the distribution of input data isvery sophisticated, the hyperellipsoid alone cannot deliver sat-isfactory performance. As a consequence, a composite structureof RBF neural network is used, shown in Fig. 2, the combinationof hyperellipsoids and hyperplanes is used for partitioning theinput space; therefore, the input space can be flexibly dividedto enhance its classification ability [22]. Clearly, the neural net-work learning procedure consists of two parts, nonlinear partand linear part, which will be discussed further in the followingsections.
The given data set is , is the input vectorwhich denotes a pattern to be classified, and is theassociated desired output which denotes relevant class label. Atypical network with hidden layer neurons, the output of
Authorized licensed use limited to: LA TROBE UNIVERSITY. Downloaded on August 12,2010 at 13:21:26 UTC from IEEE Xplore. Restrictions apply.
1352 IEEE TRANSACTIONS ON POWER SYSTEMS, VOL. 25, NO. 3, AUGUST 2010
Fig. 2. Hybrid RBF neural network structure.
hidden layer th Gauss kernel neuron for input vector can beexpressed as
(1)
where are the kernel centers, and is the kernel width.The output for input vector can be calculated by
(2)
where are the output connection weights, and is the outputerror bias.
B. Fuzzy C-Means
The number of hidden layer neurons is a major problem forneural networks, also a matter for experimentation. For someclustering methods, including FCM, the number of clustersneeds to be given in advance. Until now there are two main op-tions: validity measures and compatible clustering merging. Inthe former one, samples must be clustered several times, eachtime with a different number of clusters, . The latterone starts with a large number of clusters, then proceeding bygradually merging similar clusters to obtain fewer clusters. Here
should be large enough so that the nonlinearity of systemcould be captured accurately. However, cluster number essen-tially depends on nonlinear extent of given data sample. Whenlacking of enough prior knowledge, trial and error method isusually used to choose proper value step by step, therefore, thecomputation burden is undoubtedly aggravated.
In this paper, based on FCM, a fuzzy clustering approach isadopted, where we can specify the range of hidden layer neu-rons. Let be the data of patterns represented in featurespace. Start cluster number at , then judge whethernew center should be added according to network performance.If the result is not satisfactory, choosing a new cluster center
from the remaining samples which is different from the
existed ones . Update membership matrix, startalgorithm with new centers. Repeat the above steps until satis-factory result or maximum neuron is reached. Here thiscluster range is an experience value.
The FCM algorithm performs clustering by solving
(3)
(4)
Step 1) For given data set, fix ; admissible error; initial cluster center ; fuzzification con-
stant , which denotes the degree of fuzzification. If , the membership degrees
of any pattern to any cluster tend to be either 0 or 1,and approaches hard c-means; on the other hand; if
, the membership degrees of any pattern toany cluster tend to be equal to , thus producingthe highest level of fuzziness. Although no theoret-ically optimal value has been determined, the mostcommon choice is .
Step 2) Calculate . is the member-ship value of vector to clusters centre ;
is the Euclidean distance between and:
(5)
Step 3) Calculate . And is the arrayof clusters centers; for
(6)
Step 4) If maximum of iterations is reached or stop criterionis met, then stop; otherwise,
jump to step 2.Another critical component of kernel-based learning method
is the choice of appropriate cluster radii. Experimentally, it isoften treated as a constant according to the farthest distance be-tween cluster centers and the number of clusters in a practicalproblem to be solved. In this paper, the cluster radii are calcu-lated by QPSO, together with the output connection weights.
C. Quantum-Inspired Particle Swarm Optimization
QPSO has stronger search ability and quicker convergencespeed since it not only introduces the concepts of quantum bitand rotation gate, but also the distinguished implementations ofself-adaptive probability selection and chaotic sequences muta-tion. In QPSO, the state of a particle is depicted by quantum bitand angle, instead of particle position and velocity in the con-ventional PSO. These concepts are defined as below.
Authorized licensed use limited to: LA TROBE UNIVERSITY. Downloaded on August 12,2010 at 13:21:26 UTC from IEEE Xplore. Restrictions apply.
MENG et al.: A SELF-ADAPTIVE RBF NEURAL NETWORK CLASSIFIER FOR TRANSFORMER FAULT ANALYSIS 1353
Quantum bit, the smallest unit in QPSO, is defined as a pairof numbers:
(7)
The modulus and give the probabilities thatthe quantum bit exists in states “0” and “1”, respectively, whichshould satisfy
(8)
A string of quantum bits consist of a quantum bit individual,which can be defined as
(9)
A quantum bit is able to represent a linear superposition of allpossible solutions by its probabilistic representations [23]–[25].
Because of the normalization condition, the quantum anglecan be represented as
(10)
Therefore, the quantum bit individual can be represented inthe form of quantum angle:
(11)
The fundamental update mechanism of QPSO is evolvingquantum bits and angles, by which the updated quantum bitsshould still satisfy the normalization condition. The quantumrotation gate update equation could be calculated by
(12)
where
cognitive and social components;
random numbers in (0,1);
inertia weight;
angles change;
current angles;
local best angles;
global best angles.
(13)
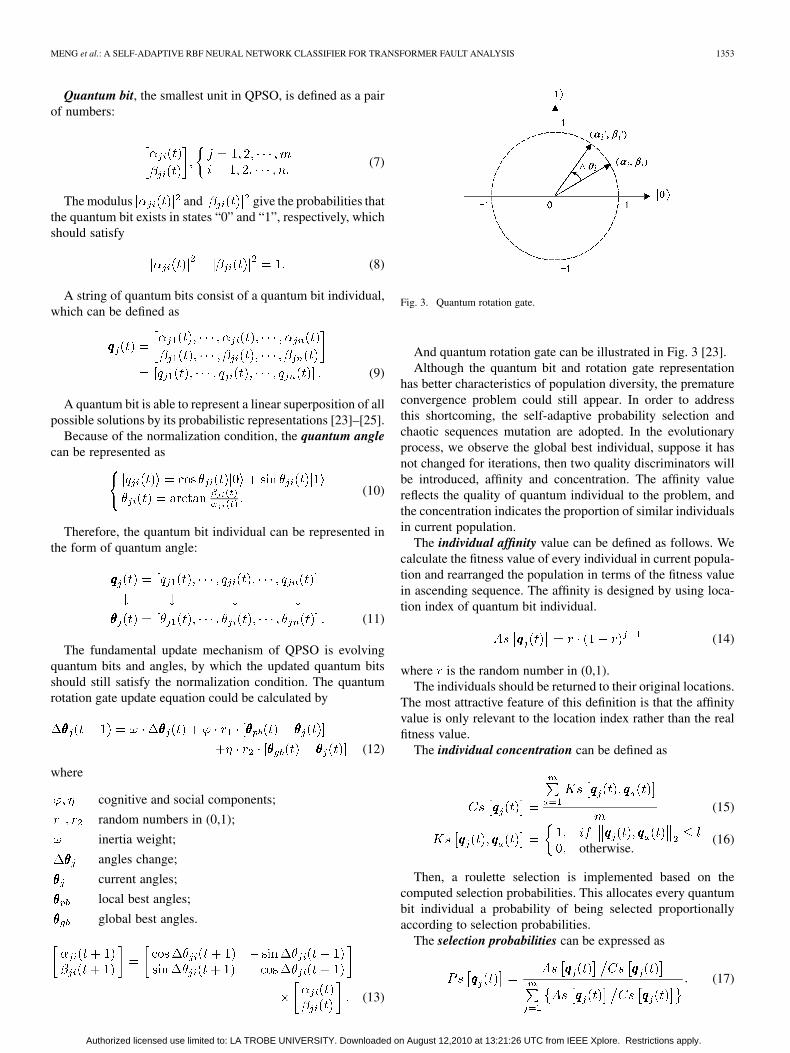
Fig. 3. Quantum rotation gate.
And quantum rotation gate can be illustrated in Fig. 3 [23].Although the quantum bit and rotation gate representation
has better characteristics of population diversity, the prematureconvergence problem could still appear. In order to addressthis shortcoming, the self-adaptive probability selection andchaotic sequences mutation are adopted. In the evolutionaryprocess, we observe the global best individual, suppose it hasnot changed for iterations, then two quality discriminators willbe introduced, affinity and concentration. The affinity valuereflects the quality of quantum individual to the problem, andthe concentration indicates the proportion of similar individualsin current population.
The individual affinity value can be defined as follows. Wecalculate the fitness value of every individual in current popula-tion and rearranged the population in terms of the fitness valuein ascending sequence. The affinity is designed by using loca-tion index of quantum bit individual.
(14)
where is the random number in (0,1).The individuals should be returned to their original locations.
The most attractive feature of this definition is that the affinityvalue is only relevant to the location index rather than the realfitness value.
The individual concentration can be defined as
(15)
otherwise.(16)
Then, a roulette selection is implemented based on thecomputed selection probabilities. This allocates every quantumbit individual a probability of being selected proportionallyaccording to selection probabilities.
The selection probabilities can be expressed as
(17)
Authorized licensed use limited to: LA TROBE UNIVERSITY. Downloaded on August 12,2010 at 13:21:26 UTC from IEEE Xplore. Restrictions apply.

1354 IEEE TRANSACTIONS ON POWER SYSTEMS, VOL. 25, NO. 3, AUGUST 2010
Therefore, the quantum bit individuals can be selected ac-cording to individuals selection probabilities, guaranteeing thatthe individuals having high affinity values could be selected; andthe one that has high concentration value could be rejected.
After that, the chaotic sequences mutation is implemented. Awidely used system evidencing chaotic behavior is the logisticmap, which can be expressed as follows:
(18)
The mutation implementation can be defined as
(19)
Notice that there is a user-defined control variable , muta-tion control constant. Selection of this value largely depends onpractical problem. Here according to our experience, the range[0.1, 0.5] is a suitable option.
D. Steps of the Proposed Algorithm
The proposed learning scheme for RBF neural networks canbe described as follows.Step 1) Each data set is randomly and proportionally divided
into three parts (training/validation/testing), whichare selected to evaluate the proposed network per-formance.
Step 2) Cluster range , initial cluster center ,admissible error for FCM ; maximum iteration
; cognitive and social componentsand ; inertia weight .
Step 3) Iteratively calculate and update the membership ma-trix and cluster center matrix in FCM. If the admis-sible error is reached or maximum iteration is met,the processes of clustering stop.
Step 4) Calculate output connection weights and cluster radiiby QPSO, and save the best feasible solutions withtraining and validation data sets.
In order to compare the performance, the following criteria isadopted, namely root mean squared error (RMSE):
(20)
where is the true value, and is the network output.If RMSE cannot reach given accuracy, then let , go
to step 5; otherwise stop the algorithm and jump to step 6.Step 5) According to the existing membership matrix ,find new cluster center vector by computing
(21)
Based on the new centers , jumps tostep 3.Step 6) The model that has the minimum error is selected asthe best model; calculate network output results of testingdata.
The general steps are shown in Fig. 4.
Fig. 4. Flowchart for the proposed approach.
III. BENCHMARK CLASSIFICATION DATA SETS
In order to test the performance of the proposed method, fivebenchmark classification data sets are introduced here, namelyfisher iris data set, teaching assistant evaluation data set, thyroiddata set, haberman’s survival data set, and glass identificationdata set [26].
1) Given data sets are randomly divided into three parts. Thetraining part is used in network learning, the validation partis adopted to prevent over-fitting, and the testing part isapplied to test generalization ability.
2) In order to carry out comparisons, SVM [27], RVM[28], NEWRB RBF (Con.) [29], QPSO RBF (Hyb.),FCM-QPSO RBF (Con.), and FCM-SDE RBF (Hyb.) arealso used in the case studies in the following sections; seeTable I.
3) Note that each approach is typically associated with a fewmodel parameters that need to be provided before trainingfor best performance. The parameters of the first three ap-proaches are optimized by DE [18].
4) In the test, the last four methods are run to get the optimalhidden node number firstly, and then the remaining 49 trialsare all carried with this structure.
5) For 50 trials in each case study, all the output results arerounded to the nearest integers.
6) All the programs are run on a 2.13-GHz, Intel Core 2, with2G RAM PC.
A. Fisher Iris Data Set
The constructed RBF neural network is checked by the fisheriris data set [30], which includes 150 data with four input fea-tures and three classes.
In this case study, 75/25/50 vectors are selected randomly fortraining/validation/testing, respectively. Based on the data ob-
Authorized licensed use limited to: LA TROBE UNIVERSITY. Downloaded on August 12,2010 at 13:21:26 UTC from IEEE Xplore. Restrictions apply.
MENG et al.: A SELF-ADAPTIVE RBF NEURAL NETWORK CLASSIFIER FOR TRANSFORMER FAULT ANALYSIS 1355
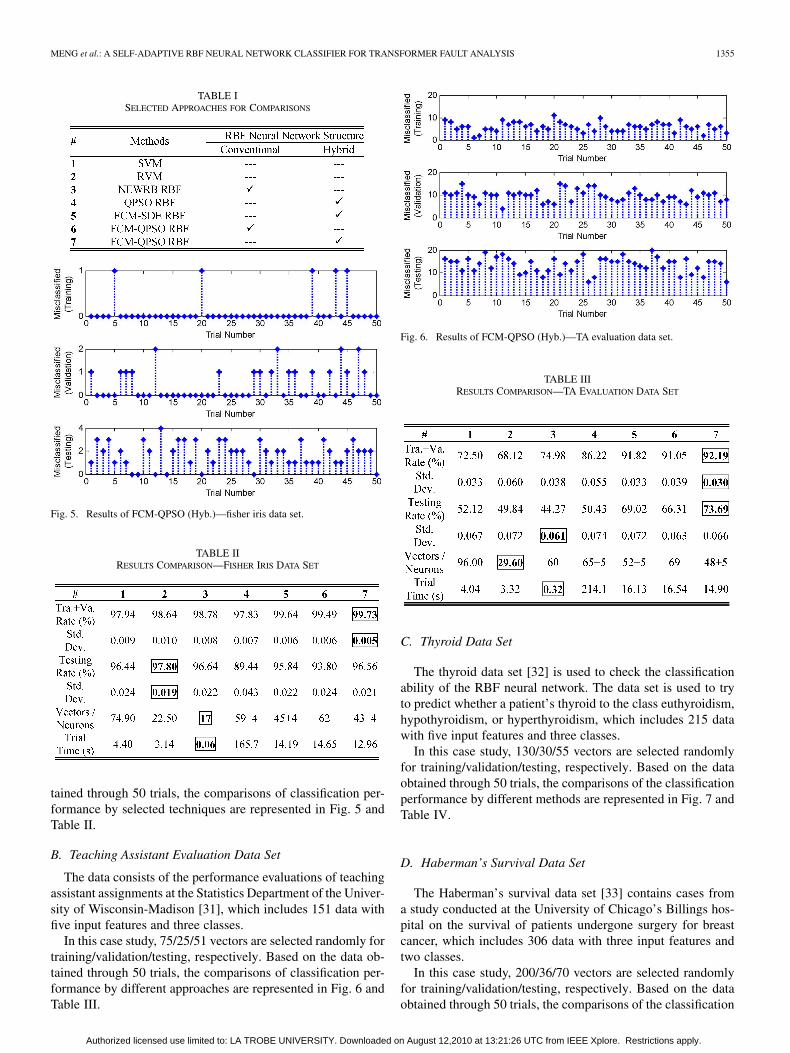
TABLE ISELECTED APPROACHES FOR COMPARISONS
Fig. 5. Results of FCM-QPSO (Hyb.)—fisher iris data set.
TABLE IIRESULTS COMPARISON—FISHER IRIS DATA SET
tained through 50 trials, the comparisons of classification per-formance by selected techniques are represented in Fig. 5 andTable II.
B. Teaching Assistant Evaluation Data Set
The data consists of the performance evaluations of teachingassistant assignments at the Statistics Department of the Univer-sity of Wisconsin-Madison [31], which includes 151 data withfive input features and three classes.
In this case study, 75/25/51 vectors are selected randomly fortraining/validation/testing, respectively. Based on the data ob-tained through 50 trials, the comparisons of classification per-formance by different approaches are represented in Fig. 6 andTable III.
Fig. 6. Results of FCM-QPSO (Hyb.)—TA evaluation data set.
TABLE IIIRESULTS COMPARISON—TA EVALUATION DATA SET
C. Thyroid Data Set
The thyroid data set [32] is used to check the classificationability of the RBF neural network. The data set is used to tryto predict whether a patient’s thyroid to the class euthyroidism,hypothyroidism, or hyperthyroidism, which includes 215 datawith five input features and three classes.
In this case study, 130/30/55 vectors are selected randomlyfor training/validation/testing, respectively. Based on the dataobtained through 50 trials, the comparisons of the classificationperformance by different methods are represented in Fig. 7 andTable IV.
D. Haberman’s Survival Data Set
The Haberman’s survival data set [33] contains cases froma study conducted at the University of Chicago’s Billings hos-pital on the survival of patients undergone surgery for breastcancer, which includes 306 data with three input features andtwo classes.
In this case study, 200/36/70 vectors are selected randomlyfor training/validation/testing, respectively. Based on the dataobtained through 50 trials, the comparisons of the classification
Authorized licensed use limited to: LA TROBE UNIVERSITY. Downloaded on August 12,2010 at 13:21:26 UTC from IEEE Xplore. Restrictions apply.

1356 IEEE TRANSACTIONS ON POWER SYSTEMS, VOL. 25, NO. 3, AUGUST 2010
Fig. 7. Results of FCM-QPSO (Hyb.)—thyroid data set.
TABLE IVRESULTS COMPARISON—THYROID DATA SET
Fig. 8. Results of FCM-QPSO (Hyb.)—Haberman’s survival data set.
performance by different methods are represented in Fig. 8 andTable V.
E. Glass Identification Data Set
The study of classification of types of glass was motivated bycriminological investigation. This data set totally includes 214data with nine input features and seven classes [34].
In this case study, 130/30/54 vectors are selected randomlyfor training/validation/testing, respectively. Based on the data
TABLE VRESULTS COMPARISON—HABERMAN’S SURVIVAL DATA SET
Fig. 9. Results of FCM-QPSO (Hyb.)—glass identification data set.
obtained through 50 trials, the comparisons of the classificationperformance by different methods are represented in Fig. 9 andTable VI.
F. Results Analysis
1) Note that each approach is typically associated with afew model parameters that need to be provided beforetraining for best performance. Specifically, like the SVMand RVM, the Gaussian kernels and associated parametersshould be provided; in addition, for SVM, the regulariza-tion parameter should be given. Compared to SVM, RVMdoes not need the tuning of a regularization parameterduring training phase. For the normal neural networktraining schemes, the number of hidden layer neurons, andassociated parameters need to be fixed in advance. We sug-gest that in order to get superior computing performance,these parameters should have problem-oriented values.
2) Obviously, as is shown in the above tables, we can con-clude that the proposed method demonstrates superiorperformance in classification accuracy, as compared toother selected alternatives in majority of the cases. It notonly achieves higher training accuracies, but also main-tains stronger generalization ability. Moreover, with thehybrid structure, the required hidden layer nodes and thecomputation time are reduced accordingly.
Authorized licensed use limited to: LA TROBE UNIVERSITY. Downloaded on August 12,2010 at 13:21:26 UTC from IEEE Xplore. Restrictions apply.
MENG et al.: A SELF-ADAPTIVE RBF NEURAL NETWORK CLASSIFIER FOR TRANSFORMER FAULT ANALYSIS 1357
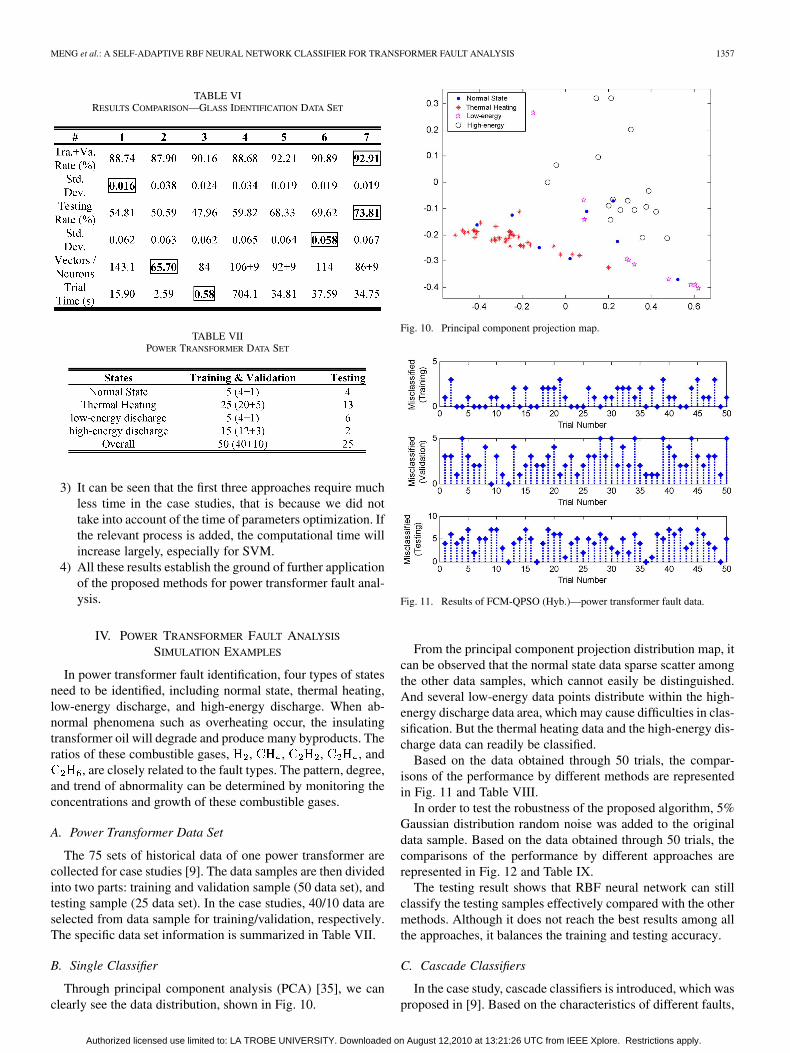
TABLE VIRESULTS COMPARISON—GLASS IDENTIFICATION DATA SET
TABLE VIIPOWER TRANSFORMER DATA SET
3) It can be seen that the first three approaches require muchless time in the case studies, that is because we did nottake into account of the time of parameters optimization. Ifthe relevant process is added, the computational time willincrease largely, especially for SVM.
4) All these results establish the ground of further applicationof the proposed methods for power transformer fault anal-ysis.
IV. POWER TRANSFORMER FAULT ANALYSIS
SIMULATION EXAMPLES
In power transformer fault identification, four types of statesneed to be identified, including normal state, thermal heating,low-energy discharge, and high-energy discharge. When ab-normal phenomena such as overheating occur, the insulatingtransformer oil will degrade and produce many byproducts. Theratios of these combustible gases, , , , , and
, are closely related to the fault types. The pattern, degree,and trend of abnormality can be determined by monitoring theconcentrations and growth of these combustible gases.
A. Power Transformer Data Set
The 75 sets of historical data of one power transformer arecollected for case studies [9]. The data samples are then dividedinto two parts: training and validation sample (50 data set), andtesting sample (25 data set). In the case studies, 40/10 data areselected from data sample for training/validation, respectively.The specific data set information is summarized in Table VII.
B. Single Classifier
Through principal component analysis (PCA) [35], we canclearly see the data distribution, shown in Fig. 10.
Fig. 10. Principal component projection map.
Fig. 11. Results of FCM-QPSO (Hyb.)—power transformer fault data.
From the principal component projection distribution map, itcan be observed that the normal state data sparse scatter amongthe other data samples, which cannot easily be distinguished.And several low-energy data points distribute within the high-energy discharge data area, which may cause difficulties in clas-sification. But the thermal heating data and the high-energy dis-charge data can readily be classified.
Based on the data obtained through 50 trials, the compar-isons of the performance by different methods are representedin Fig. 11 and Table VIII.
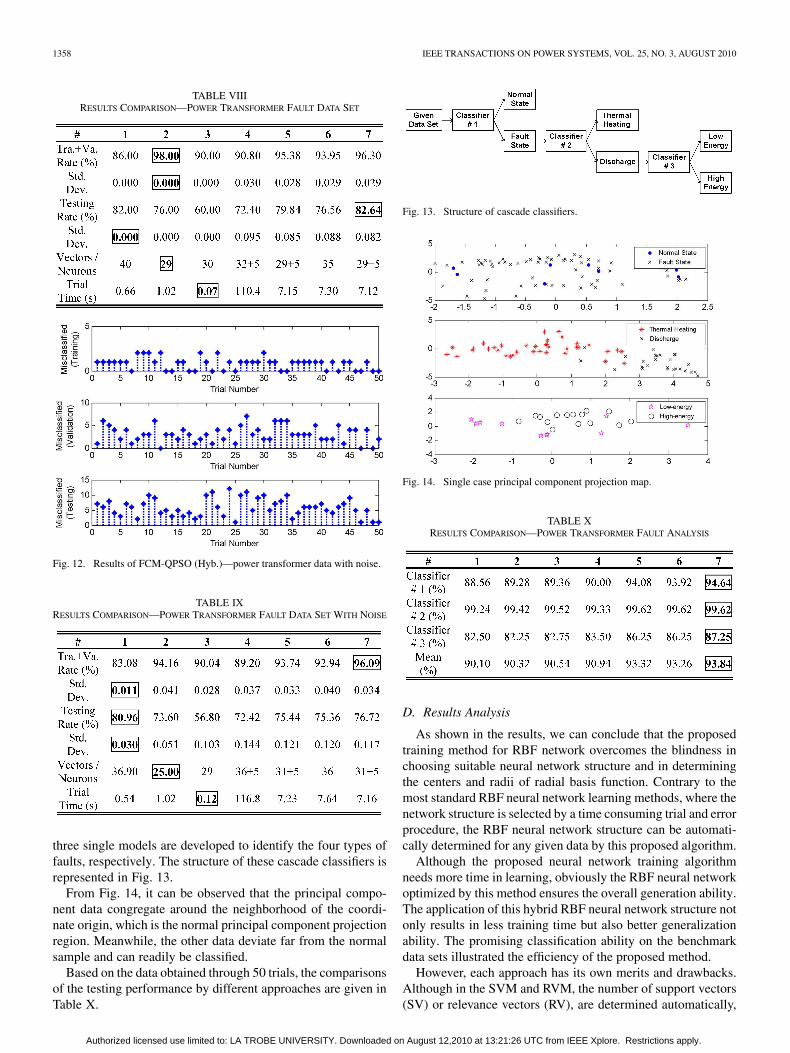
In order to test the robustness of the proposed algorithm, 5%Gaussian distribution random noise was added to the originaldata sample. Based on the data obtained through 50 trials, thecomparisons of the performance by different approaches arerepresented in Fig. 12 and Table IX.
The testing result shows that RBF neural network can stillclassify the testing samples effectively compared with the othermethods. Although it does not reach the best results among allthe approaches, it balances the training and testing accuracy.
C. Cascade Classifiers
In the case study, cascade classifiers is introduced, which wasproposed in [9]. Based on the characteristics of different faults,
Authorized licensed use limited to: LA TROBE UNIVERSITY. Downloaded on August 12,2010 at 13:21:26 UTC from IEEE Xplore. Restrictions apply.
1358 IEEE TRANSACTIONS ON POWER SYSTEMS, VOL. 25, NO. 3, AUGUST 2010
TABLE VIIIRESULTS COMPARISON—POWER TRANSFORMER FAULT DATA SET
Fig. 12. Results of FCM-QPSO (Hyb.)—power transformer data with noise.
TABLE IXRESULTS COMPARISON—POWER TRANSFORMER FAULT DATA SET WITH NOISE
three single models are developed to identify the four types offaults, respectively. The structure of these cascade classifiers isrepresented in Fig. 13.
From Fig. 14, it can be observed that the principal compo-nent data congregate around the neighborhood of the coordi-nate origin, which is the normal principal component projectionregion. Meanwhile, the other data deviate far from the normalsample and can readily be classified.
Based on the data obtained through 50 trials, the comparisonsof the testing performance by different approaches are given inTable X.
Fig. 13. Structure of cascade classifiers.
Fig. 14. Single case principal component projection map.
TABLE XRESULTS COMPARISON—POWER TRANSFORMER FAULT ANALYSIS
D. Results Analysis
As shown in the results, we can conclude that the proposedtraining method for RBF network overcomes the blindness inchoosing suitable neural network structure and in determiningthe centers and radii of radial basis function. Contrary to themost standard RBF neural network learning methods, where thenetwork structure is selected by a time consuming trial and errorprocedure, the RBF neural network structure can be automati-cally determined for any given data by this proposed algorithm.
Although the proposed neural network training algorithmneeds more time in learning, obviously the RBF neural networkoptimized by this method ensures the overall generation ability.The application of this hybrid RBF neural network structure notonly results in less training time but also better generalizationability. The promising classification ability on the benchmarkdata sets illustrated the efficiency of the proposed method.
However, each approach has its own merits and drawbacks.Although in the SVM and RVM, the number of support vectors(SV) or relevance vectors (RV), are determined automatically,
Authorized licensed use limited to: LA TROBE UNIVERSITY. Downloaded on August 12,2010 at 13:21:26 UTC from IEEE Xplore. Restrictions apply.
MENG et al.: A SELF-ADAPTIVE RBF NEURAL NETWORK CLASSIFIER FOR TRANSFORMER FAULT ANALYSIS 1359
there are still some parameters are need to provided in advance.Furthermore, in order to get superior computing performance,these parameters should have problem-oriented values.
The drawback of the proposed scheme is the computationalspeed, because of long selection procedure for suitable numberof hidden layer nodes. There are three options to improve thecomputational speed. 1) Try to reduce the range of hidden layerneurons; 2) Compute the kernel function width with effectivemathematical methods, like the nelder-mead simplex method ormaximum likelihood method; 3) Faster EAs can be designed toaccelerate the optimization process.
V. CONCLUSION
This paper has presented a self-adaptive RBF neuralnetwork-based DGA methods for power transformer fault diag-nosis. The proposed learning approach is able to generate RBFneural network models based on specially designed FCM andQPSO, which can auto-configure the structure of networks andobtain the model parameters. The availability of this methodis proved by applying RBF neural network in classificationof five famous benchmark data sets, and power transformerhistory faults dataset. The result suggests that the proposedtraining algorithms have good performance on data clustering,improving stability and generalization ability of RBF neuralnetworks. The promising neural network performance on thevalidation data sets illustrates the improved accuracy of theproposed method when compared to the other alternatives andshowed that it could be used as a reliable tool for transformerfault analysis.
REFERENCES
[1] J. J. Kelly, “Transformer fault diagnosis by dissolved-gas analysis,”IEEE Trans. Ind. Appl., vol. IA-16, no. 6, pp. 777–782, Nov. 1980.
[2] C. E. Lin, J. M. Ling, and C. L. Huang, “An expert system fortransformer fault diagnosis using dissolved gas analysis,” IEEE Trans.Power Del., vol. 8, no. 1, pp. 231–238, Jan. 1993.
[3] Q. Su, C. Mi, L. L. Lai, and P. Austin, “A fuzzy dissolved gas analysismethod for the diagnosis of multiple incipient faults in a transformer,”IEEE Trans. Power Syst., vol. 15, no. 2, pp. 593–598, May 2000.
[4] H. T. Yang, C. C. Liao, and J. H. Chou, “Fuzzy learning vector quan-tization networks for power transformer condition assessment,” IEEETrans. Dielectr. Insul., vol. 8, no. 1, pp. 143–149, Feb. 2001.
[5] Y. Zhang, X. Ding, Y. Liu, and P. J. Griffin, “An artificial neuralnetwork approach to transformer fault diagnosis,” IEEE Trans. PowerDel., vol. 11, no. 4, pp. 1836–1841, Oct. 1996.
[6] Z. Y. Wang, Y. L. Liu, and P. J. Griffin, “A combined ANN and expertsystem tool for transformer fault diagnosis,” IEEE Trans. Power Del.,vol. 13, no. 4, pp. 1224–1229, Oct. 1998.
[7] Y. C. Huang, “Evolving neural nets for fault diagnosis of power trans-formers,” IEEE Trans. Power Del., vol. 18, no. 3, pp. 843–848, Jul.2003.
[8] Y. C. Huang, “A new data mining approach to dissolved gas analysisof oil-insulated power apparatus,” IEEE Trans. Power Del., vol. 18, no.4, pp. 1257–1261, Oct. 2003.
[9] G. Y. Lv, H. Z. Cheng, H. B. Zhai, and L. X. Dong, “Fault diagnosis ofpower transformer based on multilayer SVM classifier,” Elect. PowerSyst. Res., vol. 74, no. 1, pp. 1–7, Apr. 2005.
[10] T. Poggio and F. Girosi, “Networks for approximation and learning,”Proc. IEEE, vol. 78, no. 9, pp. 1481–1497, Sep. 1990.
[11] J. Park and I. W. Sandberg, “Universal approximation using radial basisfunction networks,” Neural Comp., vol. 3, no. 2, pp. 246–257, Jun.1991.
[12] R. O. Duda and P. E. Hart, Pattern Classification and Scene Analysis.New York: Wiley, 1974.
[13] J. Bezdek, R. Ehrlich, and W. Full, “FCM: The fuzzy c-means clus-tering algorithm,” Comput. Geosci., vol. 10, no. 2–3, pp. 191–203,1984.
[14] A. Staiano, R. Tagliaferri, and W. Pedrycz, “Improving RBF networksperformance in regression tasks by means of a supervised fuzzyclustering,” Neurocomputing, vol. 69, no. 13–15, pp. 1570–1581, Aug.2006.
[15] E. S. Chng, S. Chen, and B. Mulgrew, “Gradient radial basis functionnetworks for nonlinear and nonstationary time series prediction,” IEEETrans. Neural Netw., vol. 7, no. 1, pp. 190–194, Jan. 1996.
[16] S. Chen, Y. Wu, and B. L. Luk, “Combined genetic algorithm opti-mization and regularized orthogonal least squares learning for radialbasis function networks,” IEEE Trans. Neural Netw., vol. 10, no. 5, pp.1239–1243, Sep. 1999.
[17] C. M. Huang and F. L. Wang, “An RBF network with OLS and EPSOalgorithms for real-time power dispatch,” IEEE Trans. Power Syst., vol.22, no. 1, pp. 96–104, Feb. 2007.
[18] K. P. Wong and Z. Y. Dong, “Differential evolution, an alternative ap-proach to evolutionary algorithm,” in Modern Heuristic OptimizationTechniques: Theory and Applications to Power Systems, K. Y. Lee andM. El-Sharkawi, Eds. New York: Wiley, 2008, invited book chapter.
[19] G. Y. Yang, Z. Y. Dong, and K. P. Wong, “A modified differentialevolution algorithm with fitness sharing for power system planning,”IEEE Trans. Power Syst., vol. 23, no. 2, pp. 514–522, May 2008.
[20] J. B. Park, K. S. Lee, J. R. Shin, and K. Y. Lee, “A particle swarmoptimization for economic dispatch with non-smooth cost functions,”IEEE Trans. Power Syst., vol. 20, no. 1, pp. 34–42, Feb. 2005.
[21] K. Meng, H. G. Wang, Z. Y. Dong, and K. P. Wong, “Quantum-inspiredparticle swarm optimization for valve-point economic load dispatch,”IEEE Trans. Power Syst., to be published.
[22] D. Huang and T. W. S. Chow, “A people-counting system using a hy-brid RBF neural network,” Neural Process. Lett., vol. 18, no. 2, pp.97–113, Oct. 2003.
[23] K. H. Han and J. H. Kim, “Quantum-inspired evolutionary algorithmfor a class of combinatorial optimization,” IEEE Trans. Evol. Comput.,vol. 6, no. 6, pp. 580–593, Dec. 2002.
[24] K. H. Han and J. H. Kim, “Quantum-inspired evolutionary algorithmswith a new termination criterion, Hc Gate, and two-phase scheme,”IEEE Trans. Evol. Comput., vol. 8, no. 2, pp. 156–169, Apr. 2004.
[25] J. G. Vlachogiannis and K. Y. Lee, “Quantum-inspired evolutionaryalgorithm for real and reactive power dispatch,” IEEE Trans. PowerSyst., vol. 23, no. 4, pp. 1627–1636, Nov. 2008.
[26] A. Asuncion and D. J. Newman, UCI Machine Learning Repository.Irvine, CA, Univ. California, Sch. Inf. and Comput. Sci., 2007. [On-line]. Available: http://www.ics.uci.edu/~mlearn/MLRepository.html.
[27] V. N. Vapnik, The nature of statistical learning theory. New York:Springer-Verlag, 1995.
[28] M. E. Tipping, “Sparse Bayesian learning and relevance vector ma-chine,” J. Mach. Learn. Res., vol. 1, no. 3, pp. 211–244, Sep. 2001.
[29] Matlab Neural Network Toolbox. [Online]. Available: http://www.mathworks.com/.
[30] R. A. Fisher, “The Use of multiple measurements in taxonomic prob-lems,” Annu. Eugenics, vol. 7, pt. II, pp. 179–188, 1936.
[31] H. R. Barbara and H. R. Frederick, “Concept learning and the recogni-tion and classification of exemplars,” J. Verbal Learn. Verbal Behav.,vol. 16, no. 3, pp. 321–338, Jun. 1977.
[32] D. Coomans, M. Broeckaert, M. Jonckheer, and D. L. Massart, “Com-parison of multivariate discriminant techniques for clinical data—Ap-plication to the thyroid functional state,” Meth. Inf. Med., vol. 22, no.2, pp. 93–101, Apr. 1983.
[33] S. J. Haberman, “Generalized residuals for log-linear models,” in Proc.9th Int. Biomet. Conf., 1976, pp. 104–122.
[34] T. Denoeux, “A neural network classifier based on Dempster-Shafertheory,” IEEE Trans. Syst., Man, Cybern., vol. 30, no. 2, pt. A, pp.131–150, Mar. 2000.
[35] J. E. Jackson, “Quality control methods for two related variables,” Ind.Qual. Control, vol. 12, no. 7, pp. 4–8, 1956.
Ke Meng (M’10) received the M.E. degree from the East China University ofScience and Technology, Shanghai, China, in 2007. He is pursuing the Ph.D.degree at the School of Information Technology and Electrical Engineering, TheUniversity of Queensland, St. Lucia, Australia.
He is now a research fellow at the Department of Electrical Engineering, TheHong Kong Polytechnic University, Hong Kong. His research interest includesintelligent algorithms, power system stability analysis, and control.
Authorized licensed use limited to: LA TROBE UNIVERSITY. Downloaded on August 12,2010 at 13:21:26 UTC from IEEE Xplore. Restrictions apply.
1360 IEEE TRANSACTIONS ON POWER SYSTEMS, VOL. 25, NO. 3, AUGUST 2010
ZhaoYang Dong (M’99–SM’06) received the Ph.D. degree from The Univer-sity of Sydney, Sydney, Australia, in 1999.
He is currently with the Hong Kong Polytechnic University, Hong Kong. Be-fore coming to Hong Kong, he was a System Planning Manager with TransendNetworks, Tasmania, Australia, and an Associate Professor with the Universityof Queensland, St. Lucia, Australia. His research interest includes power systemplanning, power system stability and control, electricity market, and computa-tional intelligence and its application in power engineering.
Dian Hui Wang (M’02–SM’03) received the Ph.D. degree from NortheasternUniversity, China, in March 1995.
From 1995 to 1997, he worked as a Postdoctoral Fellow at Nanyang Techno-logical University, Singapore, then as a Research Associate and Research Fellowat The Hong Kong Polytechnic University, Hong Kong, until 2001. Since July2001, he has been with the Department of Computer Science and ComputerEngineering at La Trobe University, Melbourne, Australia, and currently as aReader and Associate Professor. His current work includes intelligent systemsfor bioinformatics, information retrieval, and engineering applications.
Dr. Wang is serving as an Associate Editor for Information Sciences, Neuro-computing, and International Journal of Applied Intelligence.
Kit Po Wong (M’87–SM’90–F’02) received the M.Sc., Ph.D., and D.Eng. de-grees from the University of Manchester, Institute of Science and Technology,Manchester, U.K., in 1972, 1974, and 2001, respectively.
He was with The University of Western Australia, Perth, Australia, from 1974until 2004 and is now an Adjunct Professor there. Since 2002, he has been ChairProfessor, and previously Head, of the Department of Electrical Engineering,The Hong Kong Polytechnic University, Kowloon, Hong Kong. His current re-search interests include computation intelligence applications to power systemanalysis, planning and operations, as well as power market analysis.
Prof. Wong received three Sir John Madsen Medals (1981, 1982, and 1988)from the Institution of Engineers Australia, the 1999 Outstanding EngineerAward from IEEE Power Chapter Western Australia, and the 2000 IEEE ThirdMillennium Award. He was a Co-Technical Chairman of the IEEE ICMLC2004 Conference and General Chairman of IEEE/CSEE PowerCon2000.He was an Editor-in-Chief of IEE Proceedings in Generation, Transmissionand Distribution and Editor (Electrical) of the Transactions of Hong KongInstitution of Engineers. He is a Fellow of IET, HKIE, and IEAust.
Authorized licensed use limited to: LA TROBE UNIVERSITY. Downloaded on August 12,2010 at 13:21:26 UTC from IEEE Xplore. Restrictions apply.