Embed Size (px)
Citation preview

1.4 Graph Using Intercepts• Name the x and y intercepts as an ordered pair in the
graph below
• When you are looking for the x intercept, the y coordinate is ______
• When you are looking for the y intercept, the x coordinate is ________.
Substitute 0 for y.
Write original equation.
To find the x-intercept, substitute 0 for y and solve for x.
SOLUTION
Find the x-intercept and the y-intercept of the graph of 2x + 7y = 28.
Find the intercepts of the graph of an equationEXAMPLE 1
Solve for x.
2x + 7(0) = 28
x = = 14282
2x + 7y = 28

2(0) + 7y = 28
Find the intercepts of the graph of an equation
EXAMPLE 1
To find the y-intercept, substitute 0 for x and solve for y.
Write original equation.
Substitute 0 for x.
Solve for y.
ANSWER
The x-intercept is 14. The y-intercept is 4.
2x +7y = 28
y = 287 = 4

SOLUTION
Find the x-intercept and the y-intercept of the graph of the equation.
3x + 2(0) = 6
x = 2
1. 3x + 2y = 6
GUIDED PRACTICE for Example 1
1. 3x + 2y = 6 2. 4x – 2y = 10
3x +2y = 6
y =3
3(0) + 2y = 6
2. x =5/2 or 2.5 y = -5
SOLUTION
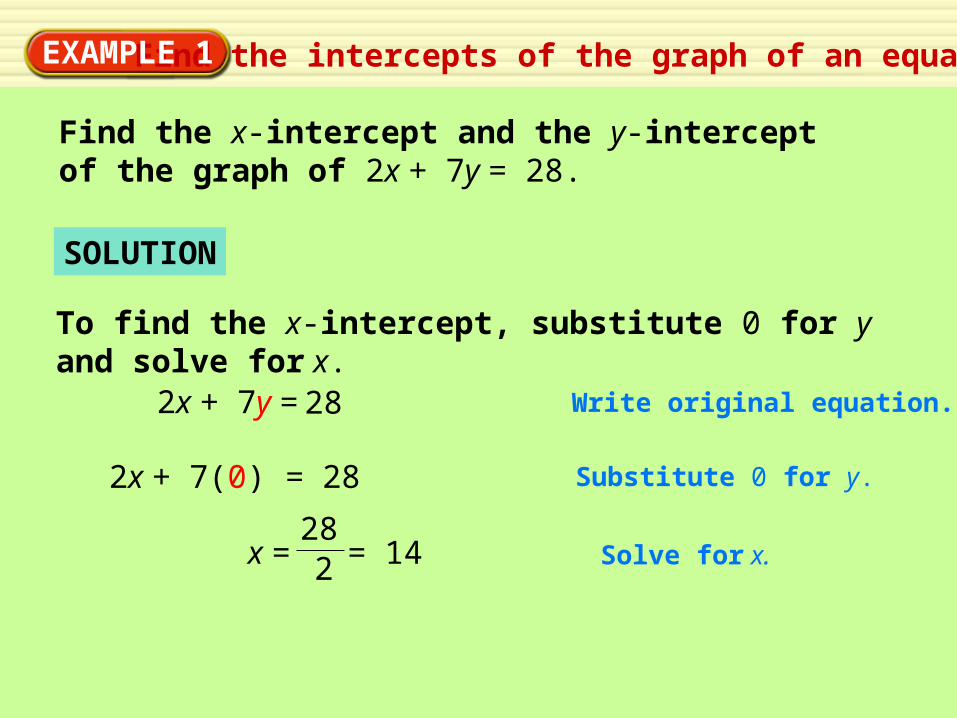
STEP 1
Use intercepts to graph an equationEXAMPLE 2
Graph the equation x + 2y = 4.
x + 2y = 4
x = x-intercept4
Find the intercepts.
x + 2(0) = 4 0 + 2y = 4
y = y-intercept2
x + 2y = 4

SOLUTION
STEP 1
Use intercepts to graph an equationEXAMPLE 2
6x + 7y = 42
x = x-intercept7
Find the intercepts.
6x + 7(0) = 42
6x + 7y = 42
6(0) + 7y = 42
y = y-intercept6
GUIDED PRACTICE for Examples 2 and 3
Graph the equation 6x + 7y = 42. Label the points where the line crosses the axes.
4.

EVENT PLANNING
Solve a multi-step problemEXAMPLE 4
You are helping to plan an awards banquet for your school, and you need to rent tables to seat 180 people. Tables come in two sizes. Small tables seat 4 people, and large tables seat 6 people. This situation can be modeled by the equation 4x + 6y = 180
where x is the number of small tables and y is the number of large tables.
• Find the intercepts of the graph of the equation.
• Give four possibilities for the number of eachsize table you could rent.
• Graph the equation.

SOLUTION
STEP 1
Solve a multi-step problemEXAMPLE 4
Find the intercepts.
4x + 6(0) = 180
x = x-intercept45
4x + 6y = 180
4(0) + 6y = 180
y = y-intercept30
4x + 6y = 180

Solve a multi-step problemEXAMPLE 4
STEP 3Find the number of tables. For this problem, only whole-number values of x and y make sense. You can see that the line passes through the points (0, 30),(15,20),(30, 10), and (45, 0).
So, four possible combinations of tables that will seat 180 people are: 0 small and 30 large, 15 small and 20 large, 30 small and 10 large,and 45 small and 0 large.

GUIDED PRACTICEEXAMPLE 2GUIDED PRACTICE for Example 4
6. WHAT IF? In Example 4, suppose the small tables cost $9 to rent and the large tables cost $14. Of the four possible combinations of tables given in the example, which rental is the least expensive? Explain.
So, 45 small tables and no large table; if you rent 45 small tables it costs $405, all other combinations are more expensive.
SOLUTION
(0, 30) = 0 9 + 30 14 = 0 + 420 = 420 (15, 20) = 15 9 + 20 14 = 135 + 280 = 415
(30, 10) = 30 9 + 10 14 = 270 + 140 = 410
(45, 0) = 45 9 + 0 14 = 405 + 0 = 405

SUBMERSIBLES
Use a linear modelEXAMPLE 5
e = 650t – 13,000
where t is the time (in minutes) since the submersible began to ascend.
A submersible designed to explore the ocean floor is at an elevation of – 13,000 feet (13,000 feet below sea level). The submersible ascends to the surface at an average rate of 650 feet per minute. The elevation e (in feet) of the submersible is given by the function
Graph the function and identify its domain and range.
Find the intercepts of the graph of the functionand state what the intercepts represent.

SOLUTION
Use a linear model
EXAMPLE 5
STEP 1
13,000 = 650t
650t – 13,0000 =
Find the intercepts.
= t20 t-intercept
= – 13,000e e-intercept
e = 650(0) – 13,000
The t-intercept represents the number of minutes the submersible takes to reach an elevation of 0 feet (sea level). The e-intercept represents the elevation of the submersible after 0 minutes (the time the ascent begins).

Use a linear model
EXAMPLE 5
Graph the function using the intercepts.
The submersible starts at an elevation of – 13,000 feet and ascends to an elevation of 0 feet. So, the range of the function is – 13,000 ≤ e ≤ 0. From the graph, you can see that the domain of the function is 0 ≤ t ≤ 20.
STEP 2

Use a linear model
EXAMPLE 5GUIDED PRACTICE for Example 5
What if? in example 5, suppose the elevation of a second submersible is given by e = 500t –10,000. graph the function and identify its domain and range.
7.
The submersible starts at an elevation of – 10,000 feet and ascends to an elevation of 0 feet. So, the range of the function is – 10,000 ≤ e ≤ 0. From the graph, you can see that the domain of the function is 0 ≤ t ≤ 20.
ANSWER