Embed Size (px)
Citation preview
4.A.14-1

4.A.14-2

Administration and Projects Committee STAFF REPORT
Meeting Date: June 2, 2016
Subject FY 2016-17 Proposed Budget for the Contra Costa Transportation
Authority and Congestion Management Agency (CMA)
Summary of Issues The FY 2016-17 Proposed Budget of $209.9 million is presented this
month for review and comment by the APC. The budget includes:
Expenditures of $209.9 million, including $116.4 million for
projects; $57 million for congestion management, planning, and
programs; $34.5 million for debt service; and $2 million for
administration.
Revenues of $121.5 million, including $35.7 million (17% of all
revenues) from Federal, State and local sources, $84.9 million of
sales tax revenues and $1 million of interest and other income.
Bond proceeds of $45.5 million for capital projects.
Other funding sources of $42.9 million, (prior year sales tax
revenue programmed for specific projects and programs), which
include $35.3 million for ongoing Measure J projects and
programs and $7.6 million for Measure C projects.
Recommendations Staff seeks APC recommendation for Authority approval of Resolution
16-32-A adopting the Authority’s FY 2016-17 Budget following a public
hearing on June 15, 2016.
Financial Implications As discussed herein.
Options The APC could direct revisions to the budget or request more
information.
Attachments (See APC
Packet dated 6/2/16)
A. Proposed Authority Budget for FY 2016-17
B. Resolution 16-32-A
Changes from The APC recommended approval of this item with minor updates to the
4.A.14-3

Administration and Projects Committee STAFF REPORT June 2, 2016 Page 2 of 12
Committee staff report.
Background
The budget is a fiscal plan of revenues and expenditures, including funding sources for annual
operations and capital expenditures consistent with the Authority’s adopted Measure C and
Measure J Strategic Plans. The Authority adopts an annual budget each June for the upcoming
fiscal year that begins on July 1st. The next step in the budget process is for the APC to receive
and recommend the Proposed Budget which includes two changes since the presentation in
May. The first change includes a reduction of $1,574,000 associated with the transfer of
Regional Measure 2 (RM2) grant funds related to the Caldecott Tunnel to be completed in FY
2015-16 and the change in title for the position of Program Manager to Director of Programs.
The Authority’s proposed budget is $209.9 million for FY 2016-17. Staff will present an overview
of the proposed budget, receive comments and return on June 15, 2016 to seek a
recommendation for approval by the Authority Board following a public hearing.
The Proposed Budget includes anticipated revenues and expenditures for next year in addition
to the appropriation of prior year bond proceeds, Measure C and Measure J funds programmed
to specific projects and programs.
Sources: FY 2016 FY 2017 Change
Sales Tax Revenues 82,400,000$ 84,872,000$ 2,472,000$
Federal Revenues 5,070,806 4,165,546 (905,260)
State Revenues 9,200,991 12,695,649 3,494,658
Local Revenues 45,398,826 18,798,720 (26,600,106)
Investment/Other Income 957,000 997,000 40,000
Bonds Proceeds 80,495,678 45,500,000 (34,995,678)
Other Sources 12,636,185 42,910,402 30,274,217
Total Sources 236,159,486$ 209,939,317$ (26,220,169)$
Uses:
Projects Section 142,138,163$ 116,405,741$ (25,732,422)$
Programs Section 54,488,676 51,975,910 (2,512,766)
Planning Section 7,915,963 5,014,681 (2,901,282)
Administration Section 2,171,684 2,063,785 (107,899)
Debt Service 29,445,000 34,479,200 5,034,200
Total Uses 236,159,486$ 209,939,317$ (26,220,169)$
Proposed FY 2016-17 Budget
4.A.14-4

Administration and Projects Committee STAFF REPORT June 2, 2016 Page 3 of 12
Additional detail of the above sources and uses are as follows:
Sources
Sales Tax Revenues – projected to be $84.9 million: This represents an increase of 3.0%
compared to the budgeted sales tax revenue of $82.4 million for FY 2015-16. The first half of
the fiscal year resulted in an increase of 6.2% over last year with growth in retail, construction
and heavy equipment, auto sales and restaurants as consumers increased spending. The
addition of sales tax associated with online sales continues to show improvement. However,
the reduction of gas prices remains to be an impact.
Based on sales tax trends and current economic drivers, sales tax increases are expected to
continue through calendar year 2016 and into 2017. The county is continuing to see increases in
population growth and a reduction in the unemployment rate to 4.5%. The Consumer Price
Index (CPI) increase was 3.2% for the calendar year 2015. Contra Costa County is poised for
continued growth in the retail, workforce and housing industries. The strong economy in Contra
Costa has resulted in consumers purchasing retail goods and larger items such as new
automobiles and home improvements. Although gas prices have reduced, we continue to see
increases in other categories.
Sales Tax Sectors FY2015 FY2016 $ Change % Change
Retail Stores 8,148,700$ 8,505,952$ 357,252$ 4.38%
Construction & Heavy Equipment 5,134,296 5,513,485 379,189 7.39%
Gas 3,958,806 3,387,353 (571,453) -14.43%
Auto 4,845,444 5,405,844 560,400 11.57%
Restaurant 3,780,775 4,206,359 425,583 11.26%
Non-retail 601,814 763,391 161,576 26.85%
Grocery 1,581,021 1,608,600 27,580 1.74%
Office Equipment & Furniture 2,187,559 2,353,424 165,864 7.58%
Public Util ities 1,591,638 1,619,222 27,584 1.73%
Top 15 31,830,054$ 33,363,628$ 1,533,575$ 4.82%
Remaining 85 9,567,308$ 10,598,332$ 1,031,023$ 10.78%
Total All 41,397,362$ 43,961,960$ 2,564,598$ 6.20%
Contra Costa Transportation Authority
Sales Tax Sectors
Year to Year Comparison of Six Months
4.A.14-5
Administration and Projects Committee STAFF REPORT June 2, 2016 Page 4 of 12
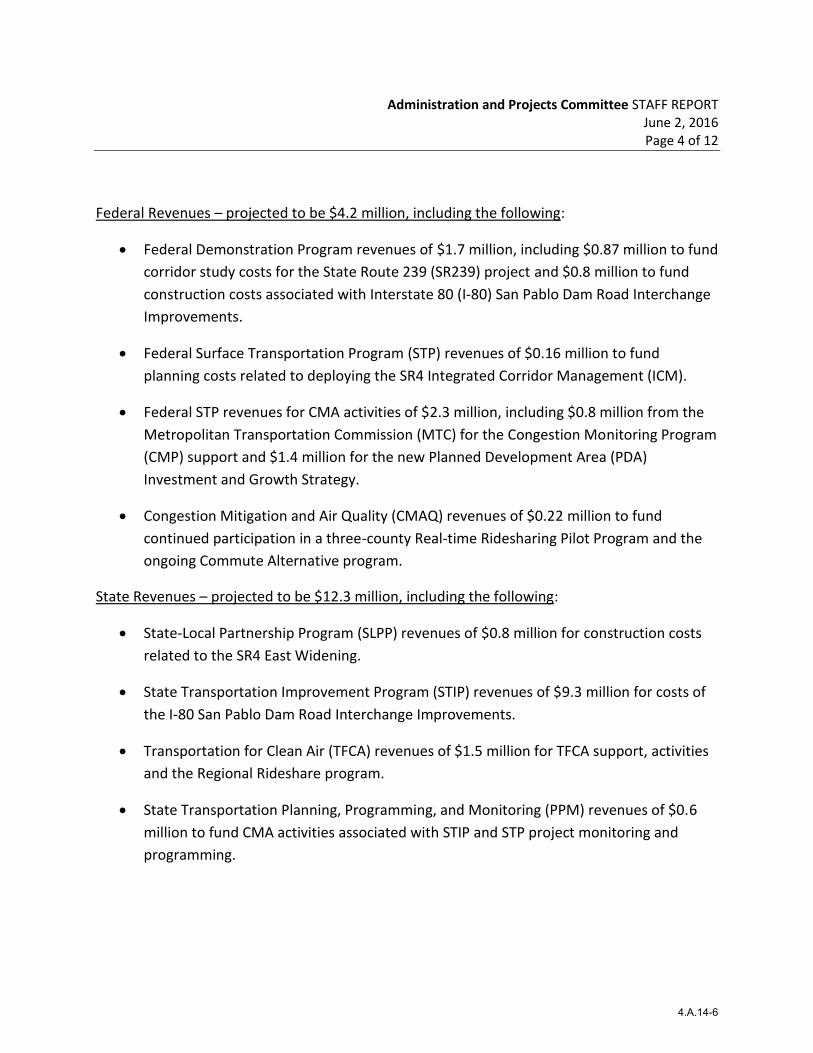
Federal Revenues – projected to be $4.2 million, including the following:
Federal Demonstration Program revenues of $1.7 million, including $0.87 million to fund
corridor study costs for the State Route 239 (SR239) project and $0.8 million to fund
construction costs associated with Interstate 80 (I-80) San Pablo Dam Road Interchange
Improvements.
Federal Surface Transportation Program (STP) revenues of $0.16 million to fund
planning costs related to deploying the SR4 Integrated Corridor Management (ICM).
Federal STP revenues for CMA activities of $2.3 million, including $0.8 million from the
Metropolitan Transportation Commission (MTC) for the Congestion Monitoring Program
(CMP) support and $1.4 million for the new Planned Development Area (PDA)
Investment and Growth Strategy.
Congestion Mitigation and Air Quality (CMAQ) revenues of $0.22 million to fund
continued participation in a three-county Real-time Ridesharing Pilot Program and the
ongoing Commute Alternative program.
State Revenues – projected to be $12.3 million, including the following:
State-Local Partnership Program (SLPP) revenues of $0.8 million for construction costs
related to the SR4 East Widening.
State Transportation Improvement Program (STIP) revenues of $9.3 million for costs of
the I-80 San Pablo Dam Road Interchange Improvements.
Transportation for Clean Air (TFCA) revenues of $1.5 million for TFCA support, activities
and the Regional Rideshare program.
State Transportation Planning, Programming, and Monitoring (PPM) revenues of $0.6
million to fund CMA activities associated with STIP and STP project monitoring and
programming.
4.A.14-6

Administration and Projects Committee STAFF REPORT June 2, 2016 Page 5 of 12
Local Revenues – projected to be $19.2 million, including the following:
RM2 revenues of $8.1 million, including construction costs of $1.1 million for SR4 East
Widening, $1.9 million for Caldecott Tunnel 4th Bore, $0.7 million for the I-80 San Pablo
Dam Road Interchange Improvements and $4.5 million for the I-680 Carpool Lane.
Bay Area Toll Authority (BATA) revenues of $3.6 million, including $0.6 million for
construction of SR4/SR160 Connector Ramps and $3 million for the I-680 Carpool Lane.
East Contra Costa Regional Fee and Financing Authority (ECCRFFA) revenues of $0.4
million for utilities and construction of SR4/Balfour Road Interchange.
Contributions from local Agency revenues of $6.1 million, including $5.9 million loan
payback from Danville’s Tri-Valley Transportation Development Funds on I-680 Auxiliary
Lane Segment 2 for the I-680/SR4 Interchange and $0.2 million from Contra Costa
County for the SR239 study.
Investment Income – projected to be $1.0 million or earnings on the Authority’s cash portfolios:
This represents an increase of $40,000 from the prior year.
Bond Proceeds – projected to be $45.5 million to fund Measure J capital project expenditures
not funded from other sources: The Authority issued the 2015A sales tax revenue bond in
October of 2015 generating $100 million in bond proceeds. Current projections estimate a
balance of $45.5 million in proceeds remaining for capital projects in FY 2016-17. Issuing bonds
is essential to accelerate project delivery compared to pay-as-you-go financing that otherwise
would require many years to accumulate the resources necessary to fund large projects.
Other Sources – projected to be $42.9 million, including prior year revenues of the following:
These other sources are the constant accumulation of sales tax revenue collected in prior years
programmed to specific projects and programs as outlined in the adopted Measure J and
Measure C strategic plans. The funds are tracked and restricted specifically for carrying out the
particular project or program. The FY 2016-17 projects, planning and programs have sufficient
resources available to fund these planned expenditures.
Measure J expenditures exceed current year revenue projections by $33.7 million and
will utilize current and prior year funding available and programmed for these specific
planned project and programs. The projects, programs and The highlights include:
4.A.14-7
Administration and Projects Committee STAFF REPORT June 2, 2016 Page 6 of 12
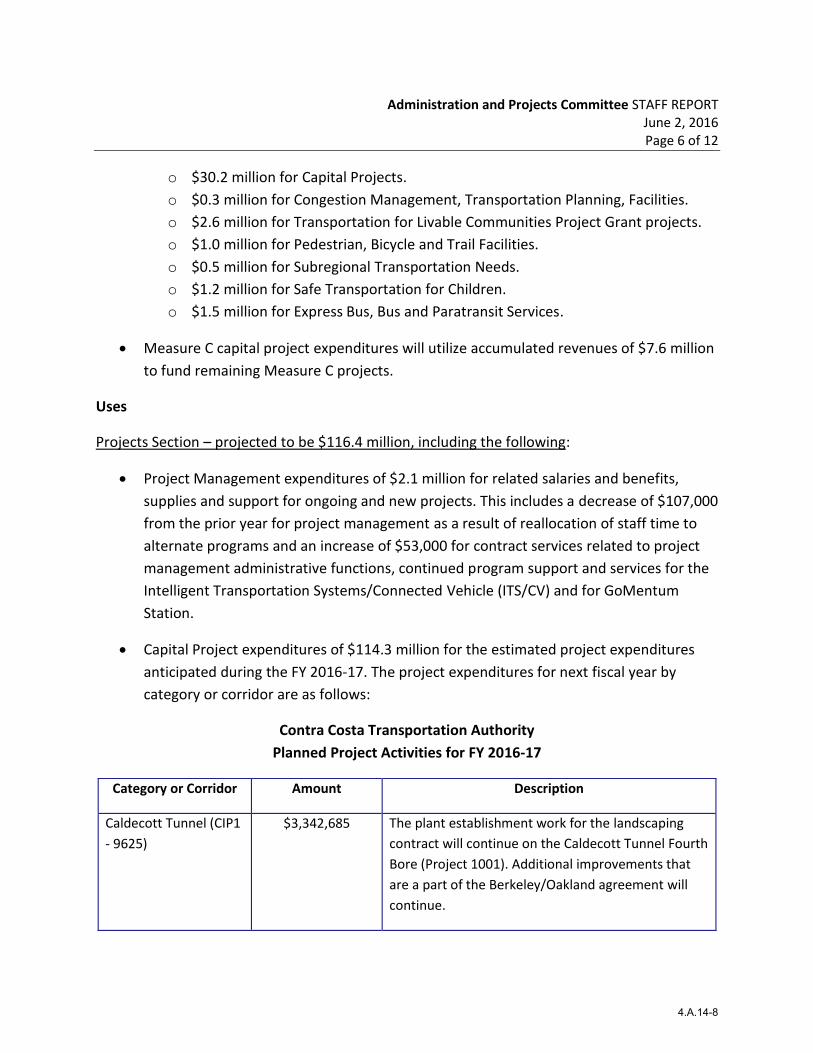
o $30.2 million for Capital Projects.
o $0.3 million for Congestion Management, Transportation Planning, Facilities.
o $2.6 million for Transportation for Livable Communities Project Grant projects.
o $1.0 million for Pedestrian, Bicycle and Trail Facilities.
o $0.5 million for Subregional Transportation Needs.
o $1.2 million for Safe Transportation for Children.
o $1.5 million for Express Bus, Bus and Paratransit Services.
Measure C capital project expenditures will utilize accumulated revenues of $7.6 million
to fund remaining Measure C projects.
Uses
Projects Section – projected to be $116.4 million, including the following:
Project Management expenditures of $2.1 million for related salaries and benefits,
supplies and support for ongoing and new projects. This includes a decrease of $107,000
from the prior year for project management as a result of reallocation of staff time to
alternate programs and an increase of $53,000 for contract services related to project
management administrative functions, continued program support and services for the
Intelligent Transportation Systems/Connected Vehicle (ITS/CV) and for GoMentum
Station.
Capital Project expenditures of $114.3 million for the estimated project expenditures
anticipated during the FY 2016-17. The project expenditures for next fiscal year by
category or corridor are as follows:
Contra Costa Transportation Authority
Planned Project Activities for FY 2016-17
Category or Corridor Amount Description
Caldecott Tunnel (CIP1
- 9625)
$3,342,685 The plant establishment work for the landscaping
contract will continue on the Caldecott Tunnel Fourth
Bore (Project 1001). Additional improvements that
are a part of the Berkeley/Oakland agreement will
continue.
4.A.14-8
Administration and Projects Committee STAFF REPORT June 2, 2016 Page 7 of 12
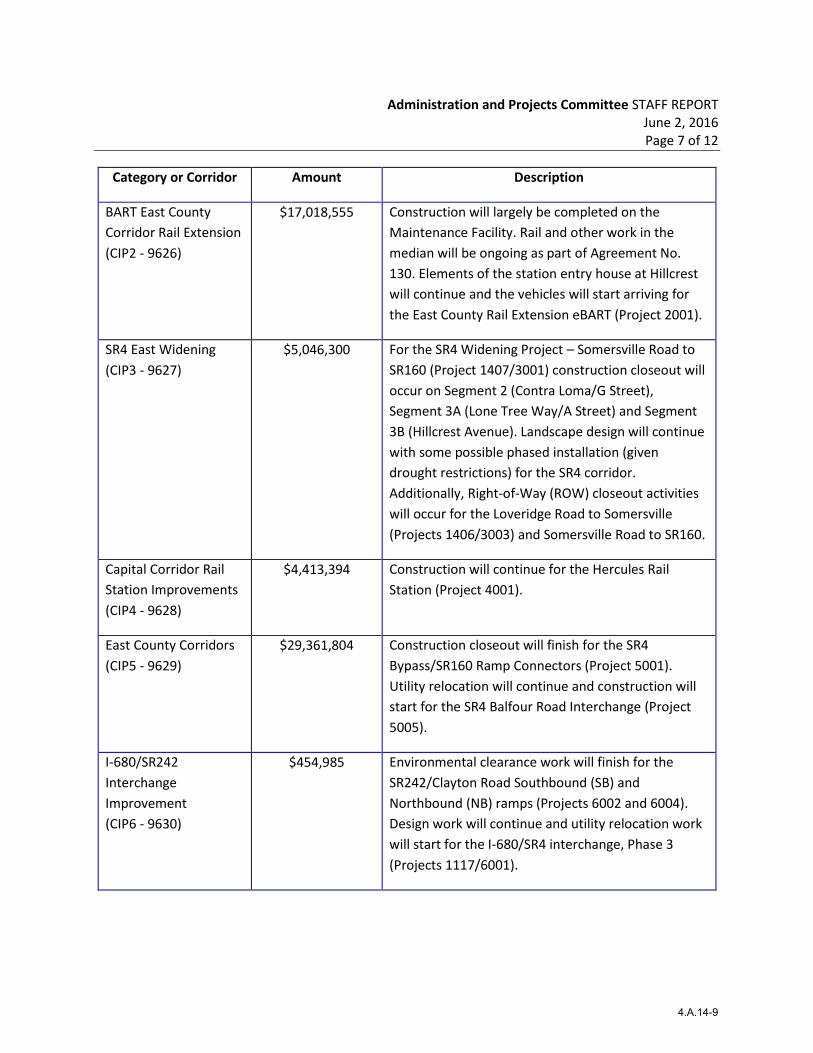
Category or Corridor Amount Description
BART East County
Corridor Rail Extension
(CIP2 - 9626)
$17,018,555 Construction will largely be completed on the
Maintenance Facility. Rail and other work in the
median will be ongoing as part of Agreement No.
130. Elements of the station entry house at Hillcrest
will continue and the vehicles will start arriving for
the East County Rail Extension eBART (Project 2001).
SR4 East Widening
(CIP3 - 9627)
$5,046,300 For the SR4 Widening Project – Somersville Road to
SR160 (Project 1407/3001) construction closeout will
occur on Segment 2 (Contra Loma/G Street),
Segment 3A (Lone Tree Way/A Street) and Segment
3B (Hillcrest Avenue). Landscape design will continue
with some possible phased installation (given
drought restrictions) for the SR4 corridor.
Additionally, Right-of-Way (ROW) closeout activities
will occur for the Loveridge Road to Somersville
(Projects 1406/3003) and Somersville Road to SR160.
Capital Corridor Rail
Station Improvements
(CIP4 - 9628)
$4,413,394 Construction will continue for the Hercules Rail
Station (Project 4001).
East County Corridors
(CIP5 - 9629)
$29,361,804 Construction closeout will finish for the SR4
Bypass/SR160 Ramp Connectors (Project 5001).
Utility relocation will continue and construction will
start for the SR4 Balfour Road Interchange (Project
5005).
I-680/SR242
Interchange
Improvement
(CIP6 - 9630)
$454,985 Environmental clearance work will finish for the
SR242/Clayton Road Southbound (SB) and
Northbound (NB) ramps (Projects 6002 and 6004).
Design work will continue and utility relocation work
will start for the I-680/SR4 interchange, Phase 3
(Projects 1117/6001).
4.A.14-9

Administration and Projects Committee STAFF REPORT June 2, 2016 Page 8 of 12
Category or Corridor Amount Description
I-80 Improvements
(CIP7 – 9631)
$14,195,775 Utility relocations will finish and construction for the
first phase will continue for the I-80/San Pablo Dam
Road Interchange Improvements (Project 7002).
Design will finish and construction will begin for the I-
80/Central Avenue Interchange Improvements
(Project 7003).
I-680 Corridor
(CIP8 - 9632)
$8,013,968 Design work will continue for the I-680 SB High
Occupancy Vehicle (HOV) Completion (Project 8001)
now combined with the I-680 Express Lanes Project.
Environmental work will finish and design work will
continue for the I-680 North Segment Express Lanes
Conversion (Project 8001).
Richmond Parkway
(CIP9 - 9633)
$881,237 Construction of Phase 2 for the Richmond Parkway
Lighting (Project 9002) will occur pending securing
additional funds.
BART Improvements
(CCMP10 - 9634)
$7,532,156 Construction work will begin on several BART
projects: Pleasant Hill BART Station Improvements
(Project 10001-07), Walnut Creek Station TOD
(Project 10001-08), Concord BART Plaza Redesign
(Project 10001-05) and El Cerrito del Norte BART
Station Modernization (Project 10002-07).
Subregional Major
Streets Improvements
(SPP24 - 9648)
$9,012,758 Design, ROW activities and/or construction will occur
on several projects: Kirker Pass NB Truck Climbing
Lane (Project 24004), Olympic Boulevard/Reliez
Station Road (Project 24010), Rheem Boulevard
Landslide Repair and Repaving (Project 24015),
Clayton Road Bridge Replacement (Project 24016),
Ivy Drive Pavement Rehabilitation (Project 24018),
Clayton Road/Treat Boulevard/Denkinger Road
Intersection Capacity Improvements (Project 24028),
and Alhambra Creek Bridge (Project 24031).
4.A.14-10

Administration and Projects Committee STAFF REPORT June 2, 2016 Page 9 of 12
Category or Corridor Amount Description
Subregional Martinez
Railroad
Improvements
(SPP27 – 9651)
$553,295 A portion of the Martinez Intermodal Station – Phase
3 (Projects 4002/27001) is also funded from this
category.
I-680 Corridor
(HAA1 - 9551)
$13,152,440 Work that was postponed (due to drought
restrictions) will finish on the landscaping phase of
the I-680 Auxiliary Lanes, Segment 2 (Project
1106S2). Design and ROW will continue and utility
relocation work will begin for the I-680/SR4
Interchange Improvements, Phase 3 (Projects
1117/6001). (Measure C).
Regional
Commuterway
(TRAN9 - 9572)
$102,500 The SR4 Widening, Somersville Road to SR160
(Projects 1407/3001) will finish the construction
closeout (a portion is funded from this category of
Measure C).
(Tran II or 9581) $636,870 Construction will begin on the Atlas Road Bridge
(Project 3111). (Measure C).
Program Section – projected to be $52 million: Program funding as outlined in the Expenditure
Plan for a range of programs including Bus Services 8.4%, Commute Alternatives 1.0%,
Paratransit 6.15%, Local Streets and Roads 20.09%, Express Bus 4.3%, and Safe Transportation
for Children 4.55%, Transportation for Livable Communities Project Grants (TLC) 4.0%,
Pedestrian, Bicycle and Trail Facilities (PBTF) 1.54%.
Planning Section – projected to be $5 million: Required services as the designated CMA for
Contra Costa County per a Joint Powers Agreement with local jurisdictions. The CMA budget
was approved by the Authority for circulation to the region’s Public Managers Association
(PMA) in April 2016 with the estimated local contribution to be $390 thousand. The PMA
approved the proposed CMA budget on April 14, 2016. The highlights of the CMA budget
include:
$0.3 million for public outreach related to the 2016 Countywide Transportation Plan
(CTP) and development of a new transportation expenditure plan;
4.A.14-11
Administration and Projects Committee STAFF REPORT June 2, 2016
Page 10 of 12
$0.1 million to update the Action Plans to address SB 743 requirements;
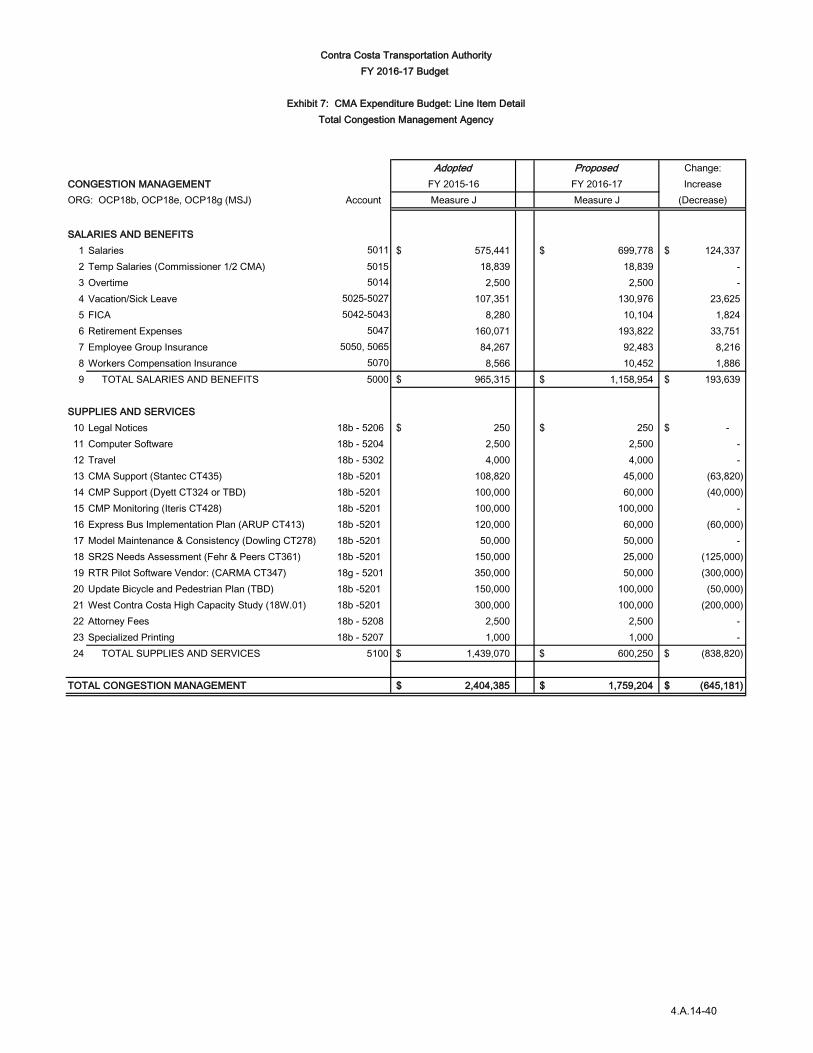
$0.16 million for CMP support and monitoring;
$0.14 million for the completion of the Countywide Express Bus Study, Safe Routes to
School (SR2S) Needs Assessment and Real Time Ride Sharing studies and programs;
$0.15 million for the completion of the 2016 CTP Update Environmental Impact Report
(EIR);
$1.5 million for PDA-related planning studies managed by CCTA on behalf of MTC.
Administrative Section – projected to be $2.1 million, including the following:
Administrative salaries and benefits of $688,185. This represents 0.81%, which is below
the 1.0% limitation on administrative salary and benefits costs established by Measure J.
Services and supplies of $1.4 million. The budget includes a $12,000 increase for the
annual increase in the office lease and a decrease in several categories: $50,000 for
professional services, $30,000 for temporary services and $10,000 in travel. The other
expenditure categories include consultants, attorney fees, staff development,
memberships, travel costs and office supplies.
Debt Service – projected to be $34.5 million to pay principal and interest on the Authority’s
bonds: The principal payment will be $15.3 million and the interest payment will be $19.2
million.
Staffing Budget Discussion
On April 15, 2015, the Authority approved Resolution (15-06-A) establishing the staff positions,
salary ranges, and benefits for July 1, 2015 through June 30, 2018. The budget has been
adjusted accordingly and increased by $0.17 million to $4.8 million for all Authority
administrative, projects and program staffing based on the following information:
Authorized full time equivalent positions remains at 20 (no new positions).
The Authority’s contribution rate for the employee’s CalPERS Pension and Other Post
Employment Health Care Benefits (OPEB) reflect no increases in contribution rates for
FY2016-17.
Authorized CPI increase to salary ranges (not actual salaries) of 3.2%. This represents an
increase of $0.17 million in salaries and benefits. Actual salary increases are approved
by the Executive Director during the annual employee review process that takes into
4.A.14-12

Administration and Projects Committee STAFF REPORT June 2, 2016
Page 11 of 12
account performance, job growth, added responsibilities and goals. This annual process
is completed in July.
Title change for the position of Program Manager to Director of Programs to clearly
define the role of this position within the Authority.
An allocation of staff time was developed for the budget (see Exhibit 8: Staff Budget Allocation).
The allocation plan estimates the proportion of each staff member’s time assigned to each of
the Authority tasks and funding source. Staff costs are apportioned to departments (or orgs),
such as administration, project management, programs, projects, and planning functions.
Budget Control Policy
The control threshold is 5% for operations and 10% for projects and programs consistent with
Resolution 98-05-A. For example, salaries and benefits (budget category level) cannot exceed
the salaries and benefits amount in the adopted budget by 5% (or $5,000, whichever is
greater). For projects and programs, the budget control is at the project category level since it
can include several contracts or agreements. For example, SR4 East Widening – CIP3 (project
category level) cannot exceed the final annual expenditures in CIP3 by the amounts set in the
budget by more than 10% (or $10,000, whichever is greater).
Description of Exhibits
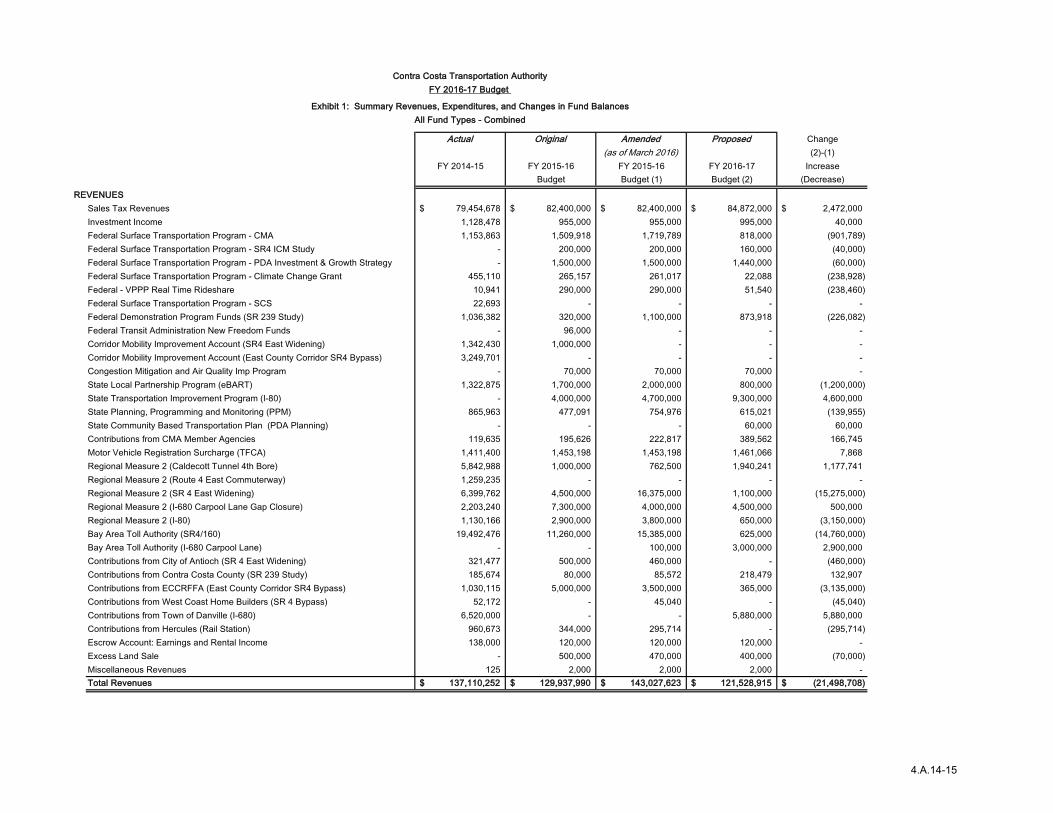
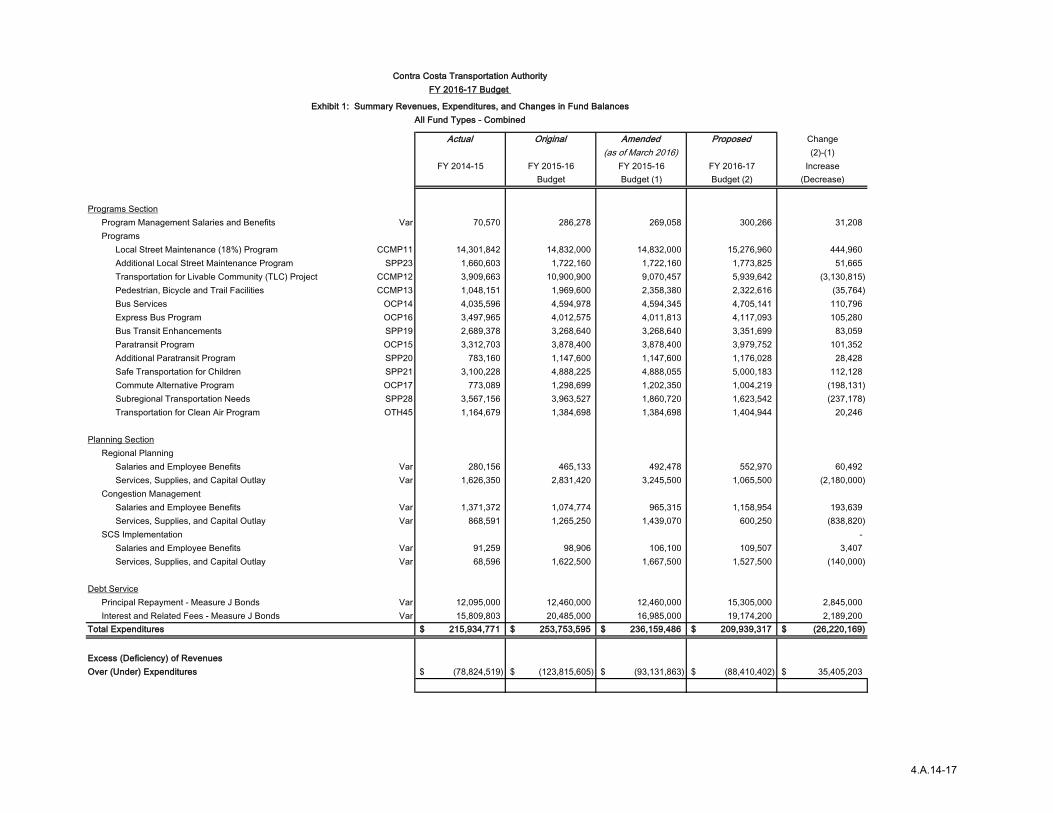
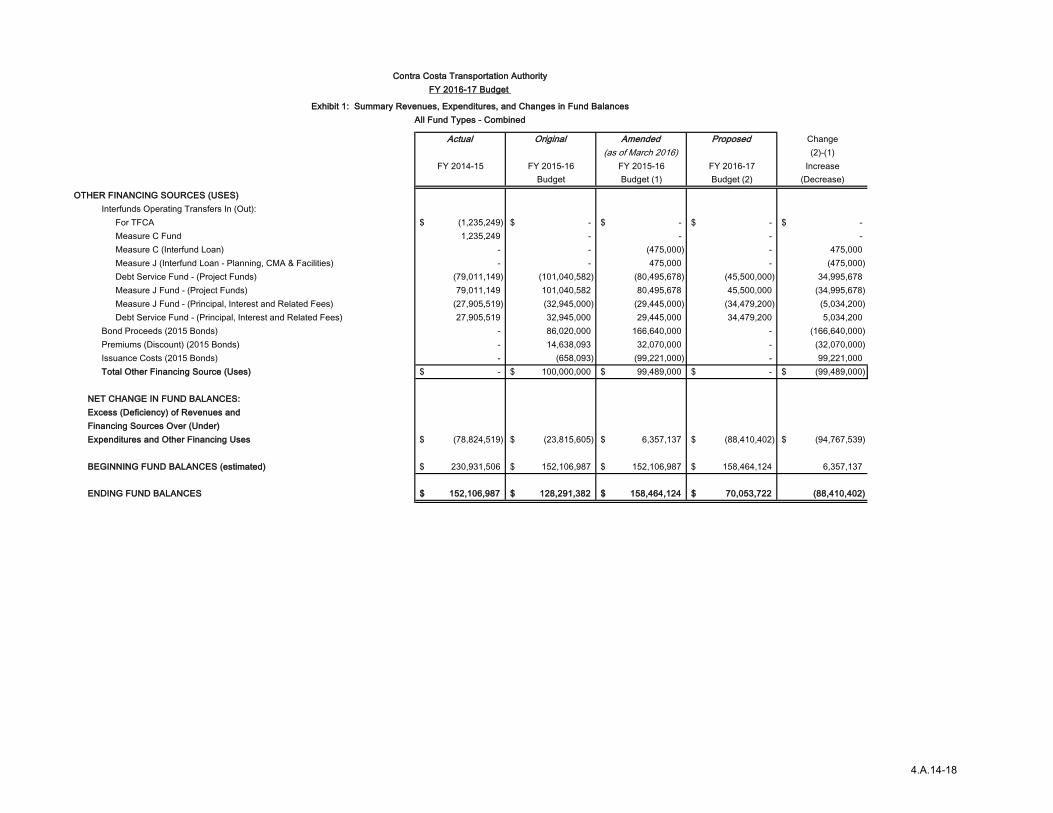
Exhibit 1 is a table showing Revenues, Expenditures, and Changes in Fund Balance for All Fund
Types combined.
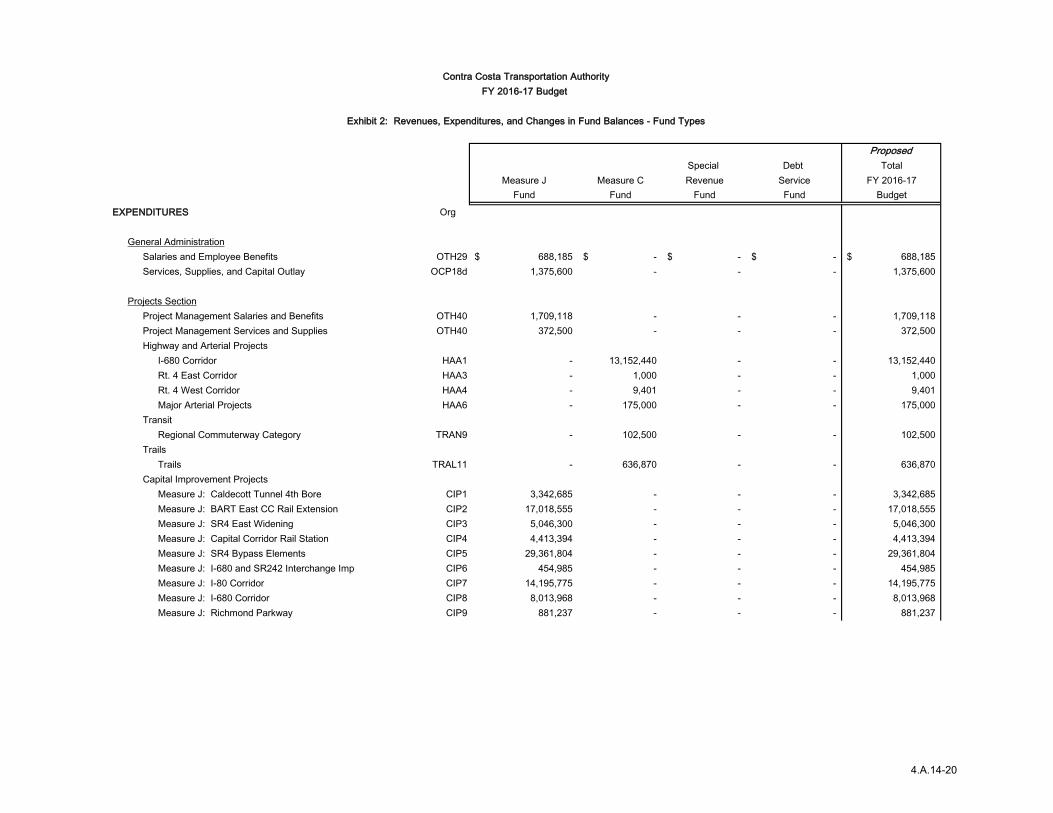
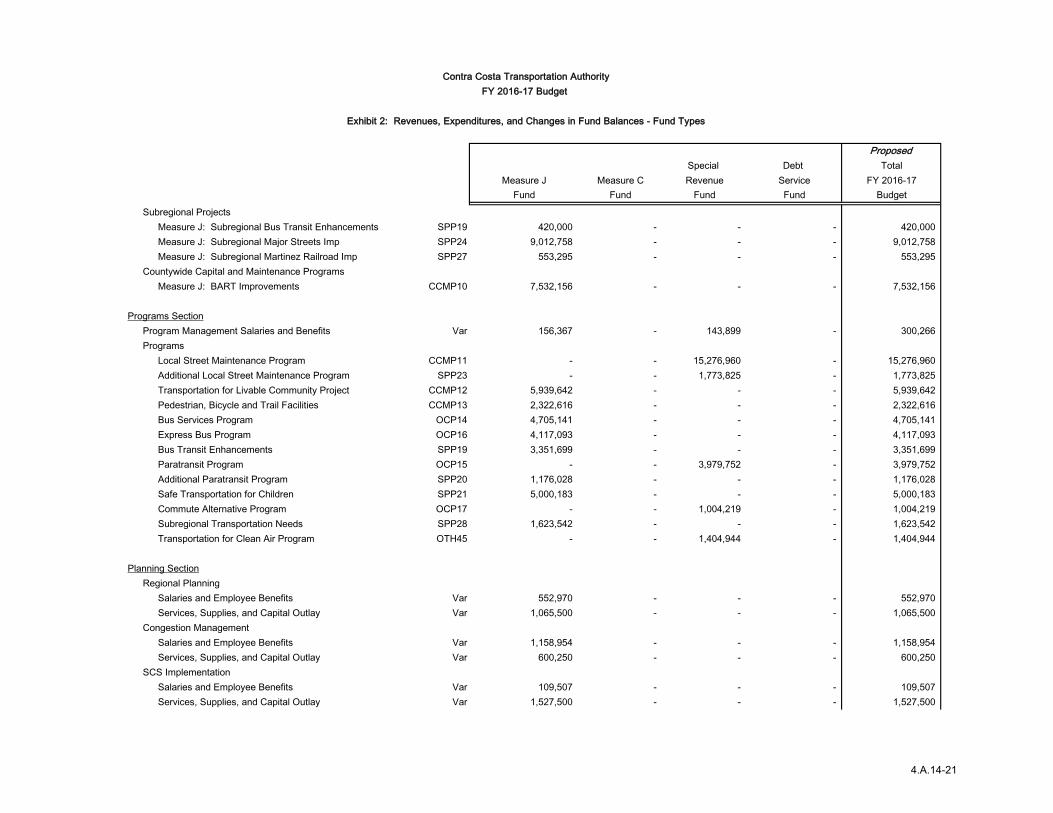
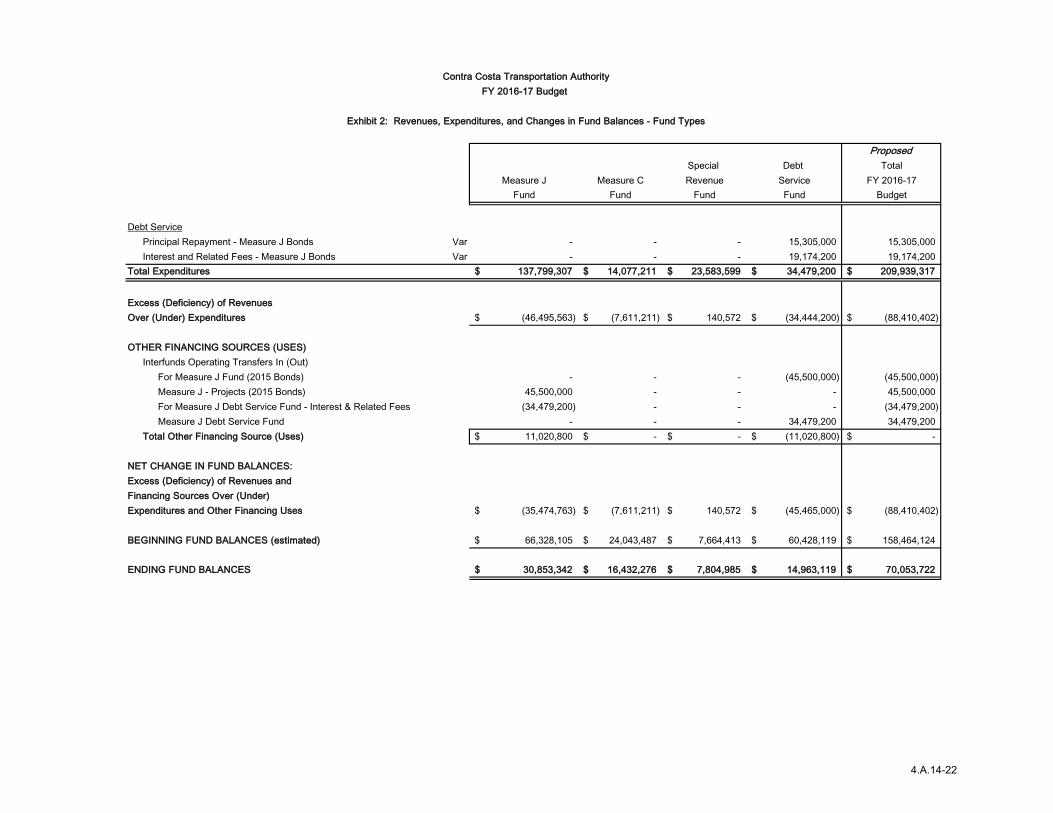
Exhibit 2 is a table showing Revenues, Expenditures, and Changes in Fund Balance by Each Fund
Type separately.
Exhibit 3 is a revenue line item budget detail for all funds.
Exhibit 4 is an expenditure line item budget detail for Programs including Local Street
Maintenance & Improvements – 18.0% return to source funds.
Exhibit 5 shows the line item expenditure budget detail for Projects. Measure C and Measure J
projects are shown separately.
Exhibit 6 is an expenditure line item budget detail for General Administration and Project
Management. Authority-wide Services, Supplies, and Fixed Assets are usually contained in the
Administration category.
4.A.14-13

Administration and Projects Committee STAFF REPORT June 2, 2016
Page 12 of 12
Exhibit 7 shows the line item expenditure budget detail for the CMA sections: Regional Planning
and Growth Management, Congestion Management, and SCS Implementation.
Exhibit 8 is the Staff Budget Allocation to the respective categories, funding source, and
budgeted amounts.
Exhibit 9 is the Salary & Benefits Budget Detail.
Next Steps
Following APC comments and direction, the Proposed Budget for FY 2016-17 will be presented
to the Authority Board on June 15th following a public hearing.
4.A.14-14
Contra Costa Transportation AuthorityFY 2016-17 Budget
Exhibit 1: Summary Revenues, Expenditures, and Changes in Fund BalancesAll Fund Types - Combined
Actual Original Amended Proposed Change(as of March 2016) (2)-(1)
FY 2014-15 FY 2015-16 FY 2015-16 FY 2016-17 IncreaseBudget Budget (1) Budget (2) (Decrease)
REVENUESSales Tax Revenues 79,454,678$ 82,400,000$ 82,400,000$ 84,872,000$ 2,472,000$ Investment Income 1,128,478 955,000 955,000 995,000 40,000 Federal Surface Transportation Program - CMA 1,153,863 1,509,918 1,719,789 818,000 (901,789) Federal Surface Transportation Program - SR4 ICM Study - 200,000 200,000 160,000 (40,000) Federal Surface Transportation Program - PDA Investment & Growth Strategy - 1,500,000 1,500,000 1,440,000 (60,000) Federal Surface Transportation Program - Climate Change Grant 455,110 265,157 261,017 22,088 (238,928) Federal - VPPP Real Time Rideshare 10,941 290,000 290,000 51,540 (238,460) Federal Surface Transportation Program - SCS 22,693 - - - - Federal Demonstration Program Funds (SR 239 Study) 1,036,382 320,000 1,100,000 873,918 (226,082) Federal Transit Administration New Freedom Funds - 96,000 - - - Corridor Mobility Improvement Account (SR4 East Widening) 1,342,430 1,000,000 - - - Corridor Mobility Improvement Account (East County Corridor SR4 Bypass) 3,249,701 - - - - Congestion Mitigation and Air Quality Imp Program - 70,000 70,000 70,000 - State Local Partnership Program (eBART) 1,322,875 1,700,000 2,000,000 800,000 (1,200,000) State Transportation Improvement Program (I-80) - 4,000,000 4,700,000 9,300,000 4,600,000 State Planning, Programming and Monitoring (PPM) 865,963 477,091 754,976 615,021 (139,955) State Community Based Transportation Plan (PDA Planning) - - - 60,000 60,000 Contributions from CMA Member Agencies 119,635 195,626 222,817 389,562 166,745 Motor Vehicle Registration Surcharge (TFCA) 1,411,400 1,453,198 1,453,198 1,461,066 7,868 Regional Measure 2 (Caldecott Tunnel 4th Bore) 5,842,988 1,000,000 762,500 1,940,241 1,177,741 Regional Measure 2 (Route 4 East Commuterway) 1,259,235 - - - - Regional Measure 2 (SR 4 East Widening) 6,399,762 4,500,000 16,375,000 1,100,000 (15,275,000) Regional Measure 2 (I-680 Carpool Lane Gap Closure) 2,203,240 7,300,000 4,000,000 4,500,000 500,000 Regional Measure 2 (I-80) 1,130,166 2,900,000 3,800,000 650,000 (3,150,000) Bay Area Toll Authority (SR4/160) 19,492,476 11,260,000 15,385,000 625,000 (14,760,000) Bay Area Toll Authority (I-680 Carpool Lane) - - 100,000 3,000,000 2,900,000 Contributions from City of Antioch (SR 4 East Widening) 321,477 500,000 460,000 - (460,000) Contributions from Contra Costa County (SR 239 Study) 185,674 80,000 85,572 218,479 132,907 Contributions from ECCRFFA (East County Corridor SR4 Bypass) 1,030,115 5,000,000 3,500,000 365,000 (3,135,000) Contributions from West Coast Home Builders (SR 4 Bypass) 52,172 - 45,040 - (45,040) Contributions from Town of Danville (I-680) 6,520,000 - - 5,880,000 5,880,000 Contributions from Hercules (Rail Station) 960,673 344,000 295,714 - (295,714) Escrow Account: Earnings and Rental Income 138,000 120,000 120,000 120,000 - Excess Land Sale - 500,000 470,000 400,000 (70,000) Miscellaneous Revenues 125 2,000 2,000 2,000 - Total Revenues 137,110,252$ 129,937,990$ 143,027,623$ 121,528,915$ (21,498,708)$
4.A.14-15

Contra Costa Transportation AuthorityFY 2016-17 Budget
Exhibit 1: Summary Revenues, Expenditures, and Changes in Fund BalancesAll Fund Types - Combined
Actual Original Amended Proposed Change(as of March 2016) (2)-(1)
FY 2014-15 FY 2015-16 FY 2015-16 FY 2016-17 IncreaseBudget Budget (1) Budget (2) (Decrease)
EXPENDITURES
General AdministrationSalaries and Employee Benefits OTH29/Admin17 2,834,289$ 703,632$ 709,084$ 688,185$ (20,899)$ Services, Supplies, and Capital Outlay OCP18d 1,408,817 1,522,600 1,462,600 1,375,600 (87,000)
Projects SectionProject Management Salaries and Benefits OTH40 1,178,833 1,637,018 1,816,508 1,709,118 (107,390) Project Management Services and Supplies OTH40 52,096 244,500 319,500 372,500 53,000 Highway and Arterial Projects
I-680 Corridor HAA1 5,017,374 8,768,000 5,076,365 13,152,440 8,076,075 Rt. 4 East Corridor HAA3 5,104 - - 1,000 1,000 Rt. 4 West Corridor HAA4 20,437 23,000 10,497 9,401 (1,096) Gateway/ Lamorinda Projects HAA5 88,081 20,000 173,641 - (173,641) Major Arterial Projects HAA6 - - 247,241 175,000 (72,241)
TransitRegional Commuterway Category TRAN9 3,514,279 819,000 1,269,907 102,500 (1,167,407)
TrailsRegional Bicycle and Pedestrian Trails TRAL11 - 500,000 - 636,870 636,870
Capital Improvement ProjectsMeasure J: Caldecott Tunnel 4th Bore CIP1 9,181,402 7,387,214 7,870,719 3,342,685 (4,528,034) Measure J: BART East CC Rail Extension CIP2 38,519,683 51,572,704 45,301,075 17,018,555 (28,282,520) Measure J: SR4 East Widening CIP3 21,032,290 22,653,786 21,630,374 5,046,300 (16,584,074) Measure J: Capitol Corridor Rail Station Imp CIP4 1,112,901 1,365,270 2,641,490 4,413,394 1,771,904 Measure J: SR4 Bypass Elements CIP5 28,951,767 25,124,853 25,696,936 29,361,804 3,664,868 Measure J: I-680 and SR242 Interchange Imp CIP6 1,253,475 1,163,980 1,005,184 454,985 (550,199) Measure J: I-80 Corridor CIP7 4,603,860 8,168,001 10,953,186 14,195,775 3,242,589 Measure J: I-680 Corridor CIP8 2,301,413 7,853,132 6,570,903 8,013,968 1,443,065 Measure J: Richmond Parkway CIP9 7,422,154 872,658 147,060 881,237 734,177
Subregional ProjectsMeasure J: Subregional Bus Transit Enhancements SPP19 - 20,000 35,000 420,000 385,000 Measure J: Subregional Major Streets Imp SPP24 10,924,770 7,822,675 8,044,352 9,012,758 968,406 Measure J: Subregional Martinez Railroad Imp SPP27 6,946 1,697,704 902,782 553,295 (349,487)
Countywide Capital and Maintenance ProgramsMeasure J: BART Improvements CCMP10 378,890 5,362,605 2,425,443 7,532,156 5,106,713
4.A.14-16
Contra Costa Transportation AuthorityFY 2016-17 Budget
Exhibit 1: Summary Revenues, Expenditures, and Changes in Fund BalancesAll Fund Types - Combined
Actual Original Amended Proposed Change(as of March 2016) (2)-(1)
FY 2014-15 FY 2015-16 FY 2015-16 FY 2016-17 IncreaseBudget Budget (1) Budget (2) (Decrease)
Programs SectionProgram Management Salaries and Benefits Var 70,570 286,278 269,058 300,266 31,208 Programs
Local Street Maintenance (18%) Program CCMP11 14,301,842 14,832,000 14,832,000 15,276,960 444,960 Additional Local Street Maintenance Program SPP23 1,660,603 1,722,160 1,722,160 1,773,825 51,665 Transportation for Livable Community (TLC) Project CCMP12 3,909,663 10,900,900 9,070,457 5,939,642 (3,130,815) Pedestrian, Bicycle and Trail Facilities CCMP13 1,048,151 1,969,600 2,358,380 2,322,616 (35,764) Bus Services OCP14 4,035,596 4,594,978 4,594,345 4,705,141 110,796 Express Bus Program OCP16 3,497,965 4,012,575 4,011,813 4,117,093 105,280 Bus Transit Enhancements SPP19 2,689,378 3,268,640 3,268,640 3,351,699 83,059 Paratransit Program OCP15 3,312,703 3,878,400 3,878,400 3,979,752 101,352 Additional Paratransit Program SPP20 783,160 1,147,600 1,147,600 1,176,028 28,428 Safe Transportation for Children SPP21 3,100,228 4,888,225 4,888,055 5,000,183 112,128 Commute Alternative Program OCP17 773,089 1,298,699 1,202,350 1,004,219 (198,131) Subregional Transportation Needs SPP28 3,567,156 3,963,527 1,860,720 1,623,542 (237,178) Transportation for Clean Air Program OTH45 1,164,679 1,384,698 1,384,698 1,404,944 20,246
Planning SectionRegional Planning
Salaries and Employee Benefits Var 280,156 465,133 492,478 552,970 60,492 Services, Supplies, and Capital Outlay Var 1,626,350 2,831,420 3,245,500 1,065,500 (2,180,000)
Congestion ManagementSalaries and Employee Benefits Var 1,371,372 1,074,774 965,315 1,158,954 193,639 Services, Supplies, and Capital Outlay Var 868,591 1,265,250 1,439,070 600,250 (838,820)
SCS Implementation - Salaries and Employee Benefits Var 91,259 98,906 106,100 109,507 3,407 Services, Supplies, and Capital Outlay Var 68,596 1,622,500 1,667,500 1,527,500 (140,000)
Debt ServicePrincipal Repayment - Measure J Bonds Var 12,095,000 12,460,000 12,460,000 15,305,000 2,845,000 Interest and Related Fees - Measure J Bonds Var 15,809,803 20,485,000 16,985,000 19,174,200 2,189,200
Total Expenditures 215,934,771$ 253,753,595$ 236,159,486$ 209,939,317$ (26,220,169)$
Excess (Deficiency) of RevenuesOver (Under) Expenditures (78,824,519)$ (123,815,605)$ (93,131,863)$ (88,410,402)$ 35,405,203$
4.A.14-17
Contra Costa Transportation AuthorityFY 2016-17 Budget
Exhibit 1: Summary Revenues, Expenditures, and Changes in Fund BalancesAll Fund Types - Combined
Actual Original Amended Proposed Change(as of March 2016) (2)-(1)
FY 2014-15 FY 2015-16 FY 2015-16 FY 2016-17 IncreaseBudget Budget (1) Budget (2) (Decrease)
OTHER FINANCING SOURCES (USES)Interfunds Operating Transfers In (Out):
For TFCA (1,235,249)$ -$ -$ -$ -$ Measure C Fund 1,235,249 - - - - Measure C (Interfund Loan) - - (475,000) - 475,000 Measure J (Interfund Loan - Planning, CMA & Facilities) - - 475,000 - (475,000) Debt Service Fund - (Project Funds) (79,011,149) (101,040,582) (80,495,678) (45,500,000) 34,995,678 Measure J Fund - (Project Funds) 79,011,149 101,040,582 80,495,678 45,500,000 (34,995,678) Measure J Fund - (Principal, Interest and Related Fees) (27,905,519) (32,945,000) (29,445,000) (34,479,200) (5,034,200) Debt Service Fund - (Principal, Interest and Related Fees) 27,905,519 32,945,000 29,445,000 34,479,200 5,034,200
Bond Proceeds (2015 Bonds) - 86,020,000 166,640,000 - (166,640,000) Premiums (Discount) (2015 Bonds) - 14,638,093 32,070,000 - (32,070,000) Issuance Costs (2015 Bonds) - (658,093) (99,221,000) - 99,221,000 Total Other Financing Source (Uses) -$ 100,000,000$ 99,489,000$ -$ (99,489,000)$
NET CHANGE IN FUND BALANCES:Excess (Deficiency) of Revenues and Financing Sources Over (Under)Expenditures and Other Financing Uses (78,824,519)$ (23,815,605)$ 6,357,137$ (88,410,402)$ (94,767,539)$
BEGINNING FUND BALANCES (estimated) 230,931,506$ 152,106,987$ 152,106,987$ 158,464,124$ 6,357,137
ENDING FUND BALANCES 152,106,987$ 128,291,382$ 158,464,124$ 70,053,722$ (88,410,402)
4.A.14-18
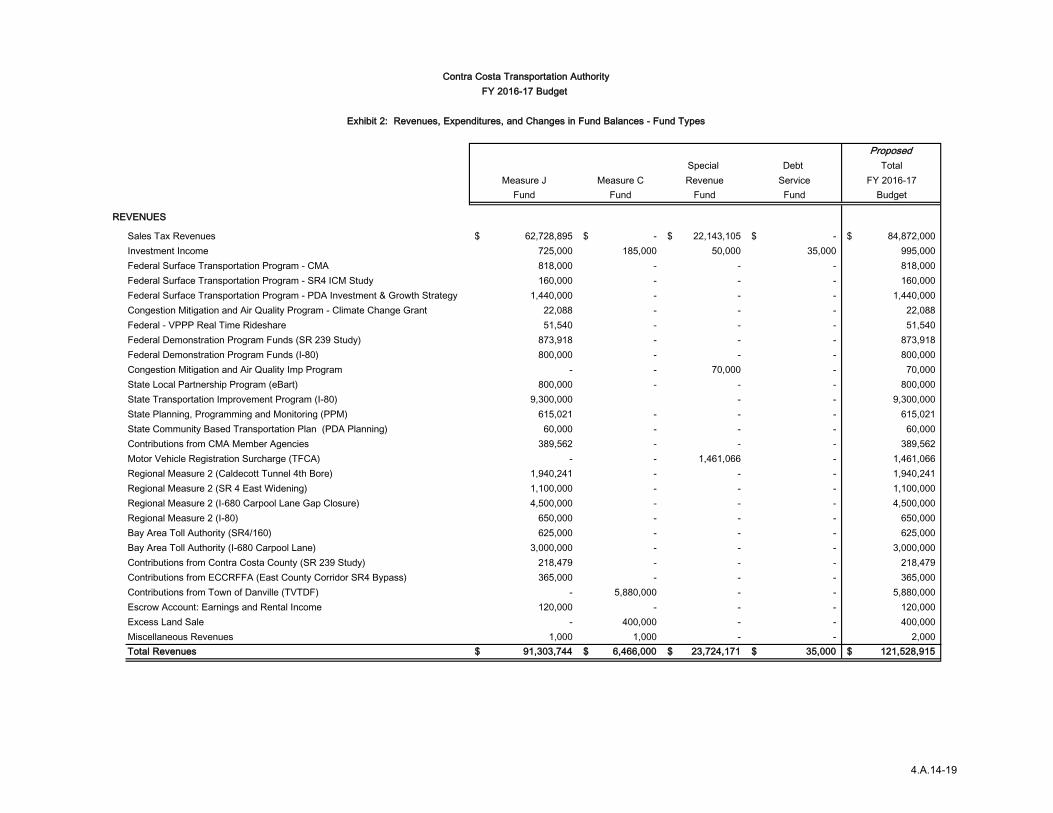
ProposedSpecial Debt Total
Measure J Measure C Revenue Service FY 2016-17Fund Fund Fund Fund Budget
REVENUES
Sales Tax Revenues 62,728,895$ -$ 22,143,105$ -$ 84,872,000$ Investment Income 725,000 185,000 50,000 35,000 995,000 Federal Surface Transportation Program - CMA 818,000 - - - 818,000 Federal Surface Transportation Program - SR4 ICM Study 160,000 - - - 160,000 Federal Surface Transportation Program - PDA Investment & Growth Strategy 1,440,000 - - - 1,440,000 Congestion Mitigation and Air Quality Program - Climate Change Grant 22,088 - - - 22,088 Federal - VPPP Real Time Rideshare 51,540 - - - 51,540 Federal Demonstration Program Funds (SR 239 Study) 873,918 - - - 873,918 Federal Demonstration Program Funds (I-80) 800,000 - - - 800,000 Congestion Mitigation and Air Quality Imp Program - - 70,000 - 70,000 State Local Partnership Program (eBart) 800,000 - - - 800,000 State Transportation Improvement Program (I-80) 9,300,000 - - 9,300,000 State Planning, Programming and Monitoring (PPM) 615,021 - - - 615,021 State Community Based Transportation Plan (PDA Planning) 60,000 - - - 60,000 Contributions from CMA Member Agencies 389,562 - - - 389,562 Motor Vehicle Registration Surcharge (TFCA) - - 1,461,066 - 1,461,066 Regional Measure 2 (Caldecott Tunnel 4th Bore) 1,940,241 - - - 1,940,241 Regional Measure 2 (SR 4 East Widening) 1,100,000 - - - 1,100,000 Regional Measure 2 (I-680 Carpool Lane Gap Closure) 4,500,000 - - - 4,500,000 Regional Measure 2 (I-80) 650,000 - - - 650,000 Bay Area Toll Authority (SR4/160) 625,000 - - - 625,000 Bay Area Toll Authority (I-680 Carpool Lane) 3,000,000 - - - 3,000,000 Contributions from Contra Costa County (SR 239 Study) 218,479 - - - 218,479 Contributions from ECCRFFA (East County Corridor SR4 Bypass) 365,000 - - - 365,000 Contributions from Town of Danville (TVTDF) - 5,880,000 - - 5,880,000 Escrow Account: Earnings and Rental Income 120,000 - - - 120,000 Excess Land Sale - 400,000 - - 400,000 Miscellaneous Revenues 1,000 1,000 - - 2,000 Total Revenues 91,303,744$ 6,466,000$ 23,724,171$ 35,000$ 121,528,915$
Contra Costa Transportation AuthorityFY 2016-17 Budget
Exhibit 2: Revenues, Expenditures, and Changes in Fund Balances - Fund Types
4.A.14-19
ProposedSpecial Debt Total
Measure J Measure C Revenue Service FY 2016-17Fund Fund Fund Fund Budget
Contra Costa Transportation AuthorityFY 2016-17 Budget
Exhibit 2: Revenues, Expenditures, and Changes in Fund Balances - Fund Types
EXPENDITURES Org
General AdministrationSalaries and Employee Benefits OTH29 688,185$ -$ -$ -$ 688,185$ Services, Supplies, and Capital Outlay OCP18d 1,375,600 - - - 1,375,600
Projects SectionProject Management Salaries and Benefits OTH40 1,709,118 - - - 1,709,118 Project Management Services and Supplies OTH40 372,500 - - - 372,500 Highway and Arterial Projects
I-680 Corridor HAA1 - 13,152,440 - - 13,152,440 Rt. 4 East Corridor HAA3 - 1,000 - - 1,000 Rt. 4 West Corridor HAA4 - 9,401 - - 9,401 Major Arterial Projects HAA6 - 175,000 - - 175,000
TransitRegional Commuterway Category TRAN9 - 102,500 - - 102,500
TrailsTrails TRAL11 - 636,870 - - 636,870
Capital Improvement ProjectsMeasure J: Caldecott Tunnel 4th Bore CIP1 3,342,685 - - - 3,342,685 Measure J: BART East CC Rail Extension CIP2 17,018,555 - - - 17,018,555 Measure J: SR4 East Widening CIP3 5,046,300 - - - 5,046,300 Measure J: Capital Corridor Rail Station CIP4 4,413,394 - - - 4,413,394 Measure J: SR4 Bypass Elements CIP5 29,361,804 - - - 29,361,804 Measure J: I-680 and SR242 Interchange Imp CIP6 454,985 - - - 454,985 Measure J: I-80 Corridor CIP7 14,195,775 - - - 14,195,775 Measure J: I-680 Corridor CIP8 8,013,968 - - - 8,013,968 Measure J: Richmond Parkway CIP9 881,237 - - - 881,237
4.A.14-20
ProposedSpecial Debt Total
Measure J Measure C Revenue Service FY 2016-17Fund Fund Fund Fund Budget
Contra Costa Transportation AuthorityFY 2016-17 Budget
Exhibit 2: Revenues, Expenditures, and Changes in Fund Balances - Fund Types
Subregional ProjectsMeasure J: Subregional Bus Transit Enhancements SPP19 420,000 - - - 420,000 Measure J: Subregional Major Streets Imp SPP24 9,012,758 - - - 9,012,758 Measure J: Subregional Martinez Railroad Imp SPP27 553,295 - - - 553,295
Countywide Capital and Maintenance ProgramsMeasure J: BART Improvements CCMP10 7,532,156 - - - 7,532,156
Programs SectionProgram Management Salaries and Benefits Var 156,367 - 143,899 - 300,266 Programs
Local Street Maintenance Program CCMP11 - - 15,276,960 - 15,276,960 Additional Local Street Maintenance Program SPP23 - - 1,773,825 - 1,773,825 Transportation for Livable Community Project CCMP12 5,939,642 - - - 5,939,642 Pedestrian, Bicycle and Trail Facilities CCMP13 2,322,616 - - - 2,322,616 Bus Services Program OCP14 4,705,141 - - - 4,705,141 Express Bus Program OCP16 4,117,093 - - - 4,117,093 Bus Transit Enhancements SPP19 3,351,699 - - - 3,351,699 Paratransit Program OCP15 - - 3,979,752 - 3,979,752 Additional Paratransit Program SPP20 1,176,028 - - - 1,176,028 Safe Transportation for Children SPP21 5,000,183 - - - 5,000,183 Commute Alternative Program OCP17 - - 1,004,219 - 1,004,219 Subregional Transportation Needs SPP28 1,623,542 - - - 1,623,542 Transportation for Clean Air Program OTH45 - - 1,404,944 - 1,404,944
Planning SectionRegional Planning
Salaries and Employee Benefits Var 552,970 - - - 552,970 Services, Supplies, and Capital Outlay Var 1,065,500 - - - 1,065,500
Congestion ManagementSalaries and Employee Benefits Var 1,158,954 - - - 1,158,954 Services, Supplies, and Capital Outlay Var 600,250 - - - 600,250
SCS ImplementationSalaries and Employee Benefits Var 109,507 - - - 109,507 Services, Supplies, and Capital Outlay Var 1,527,500 - - - 1,527,500
4.A.14-21
ProposedSpecial Debt Total
Measure J Measure C Revenue Service FY 2016-17Fund Fund Fund Fund Budget
Contra Costa Transportation AuthorityFY 2016-17 Budget
Exhibit 2: Revenues, Expenditures, and Changes in Fund Balances - Fund Types
Debt ServicePrincipal Repayment - Measure J Bonds Var - - - 15,305,000 15,305,000 Interest and Related Fees - Measure J Bonds Var - - - 19,174,200 19,174,200
Total Expenditures 137,799,307$ 14,077,211$ 23,583,599$ 34,479,200$ 209,939,317$
Excess (Deficiency) of RevenuesOver (Under) Expenditures (46,495,563)$ (7,611,211)$ 140,572$ (34,444,200)$ (88,410,402)$
OTHER FINANCING SOURCES (USES)Interfunds Operating Transfers In (Out)
For Measure J Fund (2015 Bonds) - - - (45,500,000) (45,500,000) Measure J - Projects (2015 Bonds) 45,500,000 - - - 45,500,000 For Measure J Debt Service Fund - Interest & Related Fees (34,479,200) - - - (34,479,200) Measure J Debt Service Fund - - - 34,479,200 34,479,200
Total Other Financing Source (Uses) 11,020,800$ -$ -$ (11,020,800)$ -$
NET CHANGE IN FUND BALANCES:Excess (Deficiency) of Revenues and Financing Sources Over (Under)Expenditures and Other Financing Uses (35,474,763)$ (7,611,211)$ 140,572$ (45,465,000)$ (88,410,402)$
BEGINNING FUND BALANCES (estimated) 66,328,105$ 24,043,487$ 7,664,413$ 60,428,119$ 158,464,124$
ENDING FUND BALANCES 30,853,342$ 16,432,276$ 7,804,985$ 14,963,119$ 70,053,722$
4.A.14-22
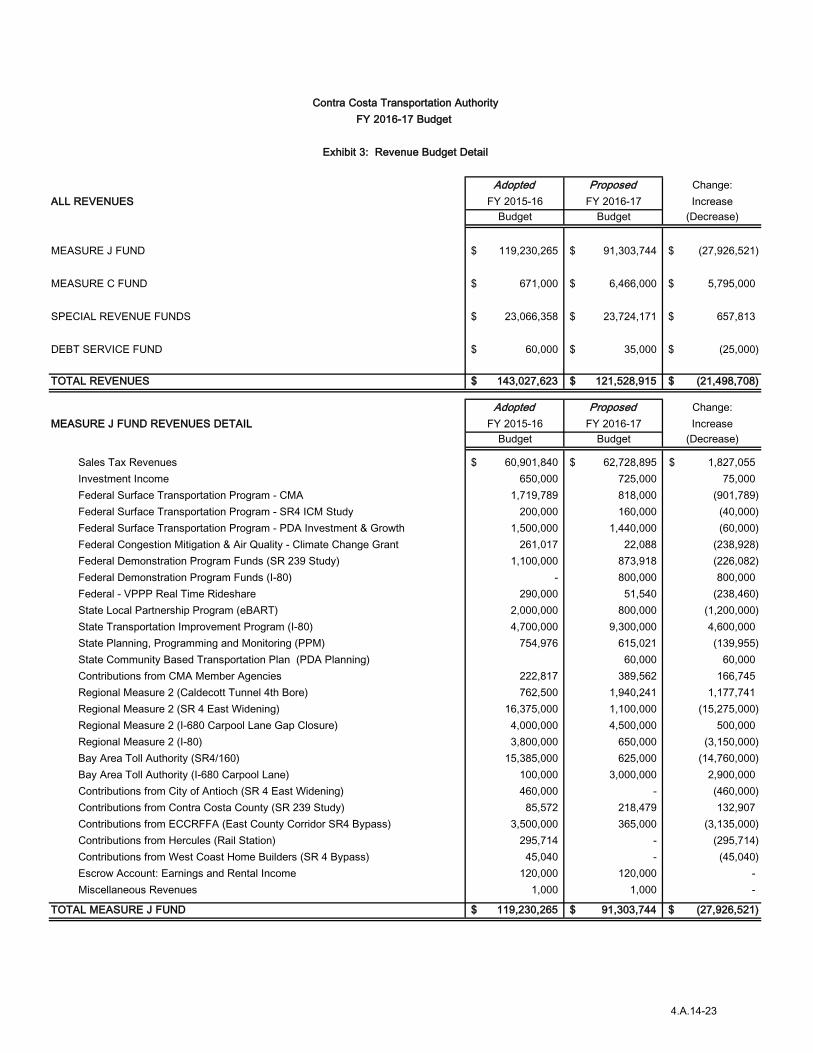
Adopted Proposed Change:ALL REVENUES FY 2015-16 FY 2016-17 Increase
Budget Budget (Decrease)
MEASURE J FUND 119,230,265$ 91,303,744$ (27,926,521)$
MEASURE C FUND 671,000$ 6,466,000$ 5,795,000$
SPECIAL REVENUE FUNDS 23,066,358$ 23,724,171$ 657,813$
DEBT SERVICE FUND 60,000$ 35,000$ (25,000)$
TOTAL REVENUES 143,027,623$ 121,528,915$ (21,498,708)$
Adopted Proposed Change:MEASURE J FUND REVENUES DETAIL FY 2015-16 FY 2016-17 Increase
Budget Budget (Decrease)
Sales Tax Revenues 60,901,840$ 62,728,895$ 1,827,055$ Investment Income 650,000 725,000 75,000 Federal Surface Transportation Program - CMA 1,719,789 818,000 (901,789) Federal Surface Transportation Program - SR4 ICM Study 200,000 160,000 (40,000) Federal Surface Transportation Program - PDA Investment & Growth 1,500,000 1,440,000 (60,000) Federal Congestion Mitigation & Air Quality - Climate Change Grant 261,017 22,088 (238,928) Federal Demonstration Program Funds (SR 239 Study) 1,100,000 873,918 (226,082) Federal Demonstration Program Funds (I-80) - 800,000 800,000 Federal - VPPP Real Time Rideshare 290,000 51,540 (238,460) State Local Partnership Program (eBART) 2,000,000 800,000 (1,200,000) State Transportation Improvement Program (I-80) 4,700,000 9,300,000 4,600,000 State Planning, Programming and Monitoring (PPM) 754,976 615,021 (139,955) State Community Based Transportation Plan (PDA Planning) 60,000 60,000 Contributions from CMA Member Agencies 222,817 389,562 166,745 Regional Measure 2 (Caldecott Tunnel 4th Bore) 762,500 1,940,241 1,177,741 Regional Measure 2 (SR 4 East Widening) 16,375,000 1,100,000 (15,275,000) Regional Measure 2 (I-680 Carpool Lane Gap Closure) 4,000,000 4,500,000 500,000 Regional Measure 2 (I-80) 3,800,000 650,000 (3,150,000) Bay Area Toll Authority (SR4/160) 15,385,000 625,000 (14,760,000) Bay Area Toll Authority (I-680 Carpool Lane) 100,000 3,000,000 2,900,000 Contributions from City of Antioch (SR 4 East Widening) 460,000 - (460,000) Contributions from Contra Costa County (SR 239 Study) 85,572 218,479 132,907 Contributions from ECCRFFA (East County Corridor SR4 Bypass) 3,500,000 365,000 (3,135,000) Contributions from Hercules (Rail Station) 295,714 - (295,714) Contributions from West Coast Home Builders (SR 4 Bypass) 45,040 - (45,040) Escrow Account: Earnings and Rental Income 120,000 120,000 - Miscellaneous Revenues 1,000 1,000 -
TOTAL MEASURE J FUND 119,230,265$ 91,303,744$ (27,926,521)$
Contra Costa Transportation AuthorityFY 2016-17 Budget
Exhibit 3: Revenue Budget Detail
4.A.14-23

Contra Costa Transportation AuthorityFY 2016-17 Budget
Exhibit 3: Revenue Budget Detail
Adopted Proposed Change:MEASURE C FUND DETAIL FY 2015-16 FY 2016-17 Increase
Budget Budget (Decrease)
Investment Income 200,000$ 185,000$ (15,000)$ Contributions from Town of Danville (TVTDF) - 5,880,000 5,880,000 Excess Land Sale 470,000 400,000 (70,000) Miscellaneous Revenues 1,000 1,000 -
TOTAL MEASURE C FUND REVENUE 671,000$ 6,466,000$ 5,795,000$
SPECIAL REVENUE FUNDS DETAIL
Sales Tax Revenues 21,498,160$ 22,143,105$ 644,945$ Investment Income 45,000 50,000 5,000 Congestion Mitigation and Air Quality Imp Program 70,000 70,000 - Motor Vehicle Registration Surcharge (TFCA) 1,453,198 1,461,066 7,868
TOTAL SPECIAL REVENUE FUNDS 23,066,358$ 23,724,171$ 657,813$
DEBT SERVICE FUNDS DETAIL
Investment Income 60,000$ 35,000$ (25,000)$
TOTAL DEBT SERVICE FUNDS 60,000$ 35,000$ (25,000)$
4.A.14-24

Adopted Proposed Change:FY 2015-16 FY 2016-17 Increase
Account Measure J Measure J (Decrease)
LOCAL STREET MAINTENANCE PROGRAM (18%)ORG: CCMP11
Contributions to Local Jurisdictions 6111 14,832,000$ 15,276,960$ 444,960$
Total Local Street Maintenance Program (18%) 14,832,000$ 15,276,960$ 444,960$
ADDITIONAL LOCAL STREET MAINTENANCE PROGRAM (2.09%)ORG: SPP23
Contributions to Local Jurisdictions 6111 1,722,160$ 1,773,825$ 51,665$
Total Additional Local Street Maintenance Program (2.09%) 1,722,160$ 1,773,825$ 51,665$
TRANSPORTATIONS FOR LIVABLE COMMUNITY PROJECT GRANTS (5.0%)ORG: CCMP12
Grants provided for Community Projects 6111 9,049,100$ 5,881,000$ (3,168,100)$ Project Management Tools & Monitoring 5201 21,357 58,642 37,285 Program Manager Salaries and Benefits 5000 26,990 39,128 12,138
FN 2: Estimated Fund Balance Available to Program N/A 7,987,145 11,888,164
Total Transportations for Livable Community Project Grants (5.0%) 9,097,447$ 5,978,770$ (3,118,677)$
PEDESTRIAN, BICYCLE AND TRAIL FACILITIES (1.5%)ORG: CCMP13
Grants provided for Community Projects 6111 2,352,000$ 2,305,100$ (46,900)$ Program Management 5201 6,380 17,516 11,136 Program Manager Salaries and Benefits 5000 26,990 39,128 12,138
FN 2: Estimated Fund Balance Available to Program N/A 3,306,379 4,052,568
Total Pedestrian, Bicycle and Trail Facilities (1.5%) 2,385,370$ 2,361,744$ (23,626)$
Contra Costa Transportation AuthorityFY 2016-17 Budget
Exhibit 4: Expenditure Budget DetailPrograms
4.A.14-25

Contra Costa Transportation AuthorityFY 2016-17 Budget
Exhibit 4: Expenditure Budget DetailPrograms
Adopted Proposed Change:FY 2015-16 FY 2016-17 Increase
Account Measure J Measure J (Decrease)
BUS SERVICES (5%)ORG: OCP14
Contributions to Bus Transit Providers 6111 4,470,745$ 4,577,833$ 107,088$ 3% Reserve 123,600 127,308 Program Manager Salaries and Benefits 5000 25,655 38,459 12,804
FN 2: Estimated Fund Balance Available to Program N/A 273,780 282,566
Total Bus Transit Improvement Program (5%) 4,620,000$ 4,743,600$ 119,892$
EXPRESS BUS (4.3%)ORG: OCP16
Contributions to Express Bus Transit Providers 6111 3,905,517$ 4,007,608$ 102,091$ 3% Reserve 106,296 109,485 Program Manager Salaries and Benefits 5000 31,387 32,403 1,016
FN 2: Estimated Fund Balance Available to Program N/A 138,179 146,767
Total Express Bus (4.3%) 4,043,200$ 4,149,496$ 103,107$
BUS TRANSIT ENHANCEMENTS (3.36%)ORG: SPP19
Contributions to Bus Transit Providers 6111 3,268,640$ 3,351,699$ 83,059$
Total Bus Transit Enhancement (3.36%) 3,268,640$ 3,351,699$ 83,059$
PARATRANSIT PROGRAM (4.1%)ORG: OCP15
Contributions to Paratransit Providers 6111 3,878,400$ 3,979,752$ 101,352$ Program Manager Salaries and Benefits 5000 54,657 56,427 1,770
FN 2: Estimated Fund Balance Available to Program N/A 5,983,828 6,523,871
Total Paratransit Program (4.1%) 3,933,057$ 4,036,179$ 103,122$
4.A.14-26

Contra Costa Transportation AuthorityFY 2016-17 Budget
Exhibit 4: Expenditure Budget DetailPrograms
Adopted Proposed Change:ADDITIONAL PARATRANSIT PROGRAM (1.15%) FY 2015-16 FY 2016-17 IncreaseORG: SPP20 Account Measure J Measure J (Decrease)
Contributions to Paratransit Providers 6111 1,147,600$ 1,176,028$ 28,428$
Total Additional Paratransit Program (1.15%) 1,147,600$ 1,176,028$ 28,428$
SAFE TRANSPORTATION FOR CHILDREN (4.545%)ORG: SPP21
Contributions to Safe Transportation for Children 6111 4,888,055$ 5,000,183$ 112,128$ Program Manager Salaries and Benefits 5000 7,025 7,249 224
FN 2: Estimated Fund Balance Available to Program N/A 2,037,216 3,607,062
Total Safe Transportation for Children (4.545%) 4,895,080$ 5,007,432$ 112,352$
COMMUTE ALTERNATIVES (1%)ORG: OCP17
Contributions for Other Programs - TDM 6111 809,950$ 834,219$ 24,269$ Contributions for Other Programs - CMAQ 6111 70,000 70,000 - Contributions for Programs - VPPP Real Time Rideshare 6111 322,400 100,000 (222,400) Program Manager Salaries and Benefits 5000 14,050 14,501 451
FN 2: Reimbursement (Use) of Reserves N/A 466,988 646,038
Total Commute Alternatives (1%) 1,216,400$ 1,018,720$ (197,680)$
SUBREGIONAL TRANSPORTATION NEEDS (1.53%)ORG: SPP28
Contributions for Other Programs - Subregional 6111 1,260,720$ 1,298,542$ 37,822$ Contributions for Studies (West, Central, SW) 5201/6111 600,000 325,000 (275,000)
Total Subregional Transportation (1.53%) 1,860,720$ 1,623,542$ (237,178)$
4.A.14-27

Contra Costa Transportation AuthorityFY 2016-17 Budget
Exhibit 4: Expenditure Budget DetailPrograms
Adopted Proposed Change:FY 2015-16 FY 2016-17 Increase
TRANSPORTATION FUNDING FOR CLEAN AIR (TFCA) Account Fund 220 TFCA Fund 220 TFCA (Decrease)
ORG: OTH45
SALARIES AND BENEFITSSalaries 5011 48,952$ 43,399$ (5,553)$ Overtime 5014 100 100 - Vacation/Sick Leave 5025 9,119 8,117 (1,002) FICA 5042 704 626 (78) Retirement Expenses 5044 13,741 11,902 (1,839) Employee Group Insurance 5050 8,959 8,178 (781) Workers Compensation Insurance 5070 729 649 (80) Total Salaries and Benefits 5000 82,304$ 72,971$ (9,333)$
CONTRIBUTIONS TO OTHER AGENCIESTFCA Program Funding Allocations 6111 1,384,698$ 1,404,944$ 20,246$ Total Contributions to Other Agencies 1,384,698$ 1,404,944$ 20,246$
Total TFCA 1,467,002$ 1,477,915$ 10,913$
TOTAL PROGRAMS BUDGET 54,488,676$ 51,975,910$ (2,512,766)$
FN:
Footnote 1:Adopted Proposed
FY 2015-16 FY 2016-17The following Measure J programs based on formula program distributions:
a. Local Street Maintenance Program 18.00% 14,832,000$ 15,276,960$ 444,960 b. Additional Local Street Maintenance Program 2.090% 1,722,160$ 1,773,825$ 51,665 c. Transportation for Livable Community Project Grants 3.559% 9,097,447$ 5,978,770$ (3,118,677) d. Additional Transportation for Livable Community Project Grants 0.400% -$ -$ - e. Pedestrian, Bicycle and Trail Facilities 1.500% 2,385,370$ 2,361,744$ (23,626) f. Additional Pedestrian, Bicycle and Trail Facilities 0.800% -$ -$ -
g. Bus Services: 5.000% 4,120,000$ 4,243,600$ 123,600 h. Express Bus: 4.300% 3,543,200$ 3,649,496$ 106,296 i. Bus Transit Enhancement 3.360% 2,768,640$ 2,851,699$ 83,059 j. Paratransit Program: 5.000% 4,120,000$ 4,243,600$ 123,600
Amount available to program $3,479,752 ($84.9 million * 4.1%)k. Additional Paratransit Program 1.150% 947,600$ 976,028$ 28,428 l. Safe Transportation for Children 4.545% 3,745,080$ 3,857,432$ 112,352
m. Commute Alternatives 1.000% 824,000$ 848,720$ 24,720 n. Subregional Transportation Needs 1.530% 1,260,720$ 1,298,542$ 37,822 o. Ferry Service (FN 4) 2.250% -$ -$ -
4.A.14-28

Contra Costa Transportation AuthorityFY 2016-17 Budget
Exhibit 4: Expenditure Budget DetailPrograms
Footnote 2: Change in Restricted Reserves6/30/2016 Net Reserves & 6/30/2017balance Payments estimated balance
Measure JTransportation for Livable Community Project Grants (a) 14,846,679$ (2,958,515)$ 11,888,164$ Pedestrian, Bicycle and Trail Facilities (b) 5,141,232$ (1,088,664)$ 4,052,568$ Bus Services (c) 782,566$ (500,000)$ 282,566$ Express Bus (c) 646,767$ (500,000)$ 146,767$ Paratransit Program (c), (d) 6,316,450$ 207,421$ 6,523,871$ Safe Transportation for Children (c) 4,757,062$ (1,150,000)$ 3,607,062$ Commute Alternatives 595,102$ 50,936$ 646,038$ Ferry Service (FN4) 11,294,453$ 1,909,620$ 13,204,073$
a. Transportation for Livable Community Project Grants are budgeted and allocated after approval of the guidelines by the Authority as authorized in the Strategic Plan.
b. Pedestrian, Bicycle and Trail Facilities Project Grants are budgeted and allocated after approval of the guidelines by the Authority as authorized in the Strategic Plan.
c. Providers are advanced 90% of their annual allocation on a quarterly basis. The final 10% is a clean up payment based on actualsales tax receipts exceeding advances. If sales tax receipts are more/less than the 10% clean up, then the following fiscal yearallocation is adjusted.
d. On April 16, 2008 the Board approved to set aside funds to begin building a reserve for the Paratransit Program. This reserve would be used to pay for the excess amounts when it is above 5% in FY 2025-26. Furthermore, the Board approved that the funds would accrueinterest income which would pay for management costs and a one time 3% annual allocation reserve. The management costs forFY 2015-16 is $54,657. The estimated ending balance is restricted by the Expenditure Plan.
Footnote 3:TFCA/TDM Salaries and Benefits Limitation is: 5.00% 73,053$ Budgeted Salaries and Benefits: Total 72,971 Residual to be funded by Planning Funds (82)$
Footnote 4:The Ferry Service Program per agreement between WETA, WCCTAC, City of Hercules and City of Richmond, it agreed to delaythe allocation start date for Measure J funds for West County Ferry Service, in return for advancing funding for theMarina Way Parkway Grade Separation project.
4.A.14-29

HIGHWAYS AND ARTERIALSAdopted Proposed Change:
I-680 CORRIDOR FY 2015-16 FY 2016-17 IncreaseORG: HAA1 (9551) Account Budget Budget (Decrease)
Engineering Design Management Services 5201 2,442,000$ 2,830,000$ 388,000$ Project Management Services 5201 124,403 152,440 28,037 Annual Project Expenses 6111 2,509,962 10,170,000 7,660,038 Total I-680 Corridor Annual Expenses 5,076,365$ 13,152,440$ 8,076,075$
Adopted Proposed Change:STATE ROUTE 4 EAST FY 2015-16 FY 2016-17 IncreaseORG: HAA3 (9553) Budget Budget (Decrease)
Engineering Design Management Services 5201 -$ 1,000$ 1,000$ Total Route 4 East Annual Expenses -$ 1,000$ 1,000$
Adopted Proposed Change:STATE ROUTE 4 WEST FY 2015-16 FY 2016-17 IncreaseORG: HAA4 (9554) Budget Budget (Decrease)
Engineering Design Management Services 5201 2,096$ 1,000$ (1,096)$ Project Management Services 5201 8,401 8,401 - Total Route 4 West Annual Expenses 10,497$ 9,401$ (1,096)$
Adopted Proposed Change:GATEWAY / LAMORINDA FY 2015-16 FY 2016-17 IncreaseORG: HAA5 (9555) Budget Budget (Decrease)
Annual Project Expenses 6111 173,641$ -$ (173,641)$ Total Gateway/ Lamorinda Annual Expenses 173,641$ -$ (173,641)$
Adopted Proposed Change:MAJOR ARTERIALS FY 2015-16 FY 2016-17 IncreaseORG: HAA6 (9556) Account Budget Budget (Decrease)
Annual Project Expenses 6111 247,241$ 175,000$ (72,241)$ Total Major Arterials Annual Expenses 247,241$ 175,000$ (72,241)$
MEASURE C PROJECTS
Contra Costa Transportation AuthorityFY 2016-17 Budget
Exhibit 5: Expenditure Budget DetailProjects
4.A.14-30

Contra Costa Transportation AuthorityFY 2016-17 Budget
Exhibit 5: Expenditure Budget DetailProjects
TOTAL HIGHWAY AND ARTERIAL PROJECTS BUDGET 5,507,744$ 13,337,841$ 7,830,097$
TRANSITAdopted Proposed Change:
REGIONAL COMMUTERWAY FY 2015-16 FY 2016-17 IncreaseORG: TRAN9 (9572) Budget Budget (Decrease)
Project Management Services 5201 30,407$ 12,500$ (17,907)$ Annual Project Expenses 6111 1,239,500 90,000 (1,149,500) Total Regional Commuterway Annual Expenses 1,269,907$ 102,500$ (1,167,407)$
TOTAL TRANSIT PROJECTS BUDGET 1,269,907$ 102,500$ (1,167,407)$
TRAILS AccountAdopted Proposed Change:
REGIONAL BICYCLE AND PEDESTRIAN TRAILS FY 2015-16 FY 2016-17 IncreaseORG: TRAL11 (9581) Budget Budget (Decrease)
Annual Project Expenses 6111 -$ 636,870$ 636,870$ Total Trails Annual Expenses -$ 636,870$ 636,870$
TOTAL TRAILS PROJECTS BUDGET -$ 636,870$ 636,870$
TOTAL ALL MEASURE C PROJECTS BUDGET 6,777,651$ 14,077,211$ 7,299,560$
4.A.14-31

Contra Costa Transportation AuthorityFY 2016-17 Budget
Exhibit 5: Expenditure Budget DetailProjects
CAPITAL IMPROVEMENT PROJECTSAdopted Proposed Change:
CALDECOTT TUNNEL 4TH BORE FY 2015-16 FY 2016-17 IncreaseORG: CIP1 (9625) Budget Budget (Decrease)
Project Management Services 5201 182,128$ 183,758$ 1,630$ Annual Project Expenses 5201 50,000 112,141 62,141 Annual Project Expenses 6111 7,638,591 3,046,786 (4,591,805) Total Caldecott Tunnel 4th Bore Annual Expenses 7,870,719$ 3,342,685$ (4,528,034)$
Adopted Proposed Change:BART EAST CC RAIL EXTENSION FY 2015-16 FY 2016-17 IncreaseORG: CIP2 (9626) Budget Budget (Decrease)
Project Management Services 5201 165,129$ 208,555$ 43,426$ Attorney Fees 5208 10,000 10,000 - Annual Project Expenses 5201 15,965,255 3,000,000 (12,965,255) Annual Project Expenses 6111 29,160,691 13,800,000 (15,360,691) Total BART East CC Rail Extension Annual Expenses 45,301,075$ 17,018,555$ (28,282,520)$
Adopted Proposed Change:SR 4 EAST WIDENING FY 2015-16 FY 2016-17 IncreaseORG: CIP3 (9627) Budget Budget (Decrease)
Engineering Design Management Services 5201 120,000$ 40,000$ (80,000)$ Project Management Services 5201 484,892 361,964 (122,928) Attorney Fees 5208 10,000 10,000 - Annual Project Expenses 5201 7,331,125 1,107,750 (6,223,375) Annual Project Expenses 6111 13,684,357 3,526,586 (10,157,771) Total SR 4 East Widening Annual Expenses 21,630,374$ 5,046,300$ (16,584,074)$
MEASURE J PROJECTS
4.A.14-32

Contra Costa Transportation AuthorityFY 2016-17 Budget
Exhibit 5: Expenditure Budget DetailProjects
Adopted Proposed Change:CAPITAL CORRIDOR RAIL STATION IMPROVEMENTS FY 2015-16 FY 2016-17 IncreaseORG: CIP4 (9628) Account Budget Budget (Decrease)
Project Management Services 5201 17,854$ 20,856$ 3,002$ Annual Project Expenses 6111 2,623,636 4,392,538 1,768,902 Total Capital Corridor Rail Station Improvements Annual Expenses 2,641,490$ 4,413,394$ 1,771,904$
Adopted Proposed Change:EAST COUNTY CORRIDORS - SR4 BYPASS ELEMENTS FY 2015-16 FY 2016-17 IncreaseORG: CIP5 (9629) Budget Budget (Decrease)
Project Management Services 5201 5,456,075$ 2,566,374$ (2,889,701)$ Project Management Services Authority Staff 5000 227,894 235,440 7,546 Study Services 5201 1,410,000 1,000,000 (410,000) Attorney Fees 5208 50,000 10,000 (40,000) Annual Project Expenses 5201 18,335,615 7,934,990 (10,400,625) Annual Project Expenses 6111 217,352 17,615,000 17,397,648 Total East County Corridors - SR4 Bypass Elements Annual Expenses 25,696,936$ 29,361,804$ 3,664,868$
Adopted Proposed Change:I-680 AND SR242 INTERCHANGE IMPROVEMENTS FY 2015-16 FY 2016-17 IncreaseORG: CIP6 (9630) Budget Budget (Decrease)
Engineering Design Management Services 5201 478,000$ 80,000$ (398,000)$ Project Management Services 5201 93,979 164,985 71,006 Annual Project Expenses 6111 433,205 210,000 (223,205) Total I-680 and SR242 Interchange Improvements Annual Expenses 1,005,184$ 454,985$ (550,199)$
Adopted Proposed Change:I-80 CORRIDOR FY 2015-16 FY 2016-17 IncreaseORG: CIP7 (9631) Budget Budget (Decrease)
Engineering Design Management Services 5201 860,069$ 1,000,000$ 139,931$ Project Management Services 5201 95,275 511,711 416,436 Attorney Fees 5208 10,000 60,000 50,000 Annual Project Expenses 5201 9,650,814 11,954,064 2,303,250 Annual Project Expenses 6111 337,028 670,000 332,972 Total I-80 Corridor Annual Expenses 10,953,186$ 14,195,775$ 3,242,589$
4.A.14-33

Contra Costa Transportation AuthorityFY 2016-17 Budget
Exhibit 5: Expenditure Budget DetailProjects
Adopted Proposed Change:I-680 CORRIDOR Account FY 2015-16 FY 2016-17 IncreaseORG: CIP8 (9632) Budget Budget (Decrease)
Engineering Design Management Services 5201 5,580,000$ 5,500,000$ (80,000)$ Project Management Services Authority Staff 5000 34,196 35,290 1,094 Project Management Services 5201 191,707 1,186,371 994,664 Annual Project Expenses 6111 765,000 1,292,307 527,307 Total I-680 Corridor Annual Expenses 6,570,903$ 8,013,968$ 1,443,065$
Adopted Proposed Change:RICHMOND PARKWAY FY 2015-16 FY 2016-17 IncreaseORG: CIP9 (9633) Budget Budget (Decrease)
Project Management Services 5201 17,590$ 22,216$ 4,626$ Annual Project Expenses 6111 129,470 859,021 729,551 Total Richmond Parkway Annual Expenses 147,060$ 881,237$ 734,177$
TOTAL CAPITAL IMPROVEMENT PROJECTS BUDGET 121,816,927$ 82,728,703$ (39,088,224)$
SUBREGIONAL PROJECTSAdopted Proposed Change:
SUBREGIONAL BUS TRANSIT ENHANCEMENTS FY 2015-16 FY 2016-17 IncreaseORG: SPP19 (9643) Budget Budget (Decrease)
Annual Project Expenses 6111 35,000$ 420,000$ 385,000$ Total Subregional Bus Transit Enhancements Annual Expenses 35,000$ 420,000$ 385,000$
Adopted Proposed Change:SUBREGIONAL MAJOR STREETS IMPROVEMENTS FY 2015-16 FY 2016-17 IncreaseORG: SPP24 (9648) Budget Budget (Decrease)
Engineering Design Management Services 6111 2,728,940$ 1,152,000$ (1,576,940)$ Project Management Services 5201 88,491 111,758 23,267 Annual Project Expenses 6111 5,226,921 7,749,000 2,522,079 Total Subregional Major Streets Improvements Annual Expenses 8,044,352$ 9,012,758$ 968,406$
4.A.14-34

Contra Costa Transportation AuthorityFY 2016-17 Budget
Exhibit 5: Expenditure Budget DetailProjects
Adopted Proposed Change:SUBREGIONAL MARTINEZ INTERMODAL IMPROVEMENTS FY 2015-16 FY 2016-17 IncreaseORG: SPP27 (9651) Account Budget Budget (Decrease)
Project Management Services 6111 2,782$ 3,514$ 732$ Annual Project Expenses 6111 900,000 549,781 (350,219) Total Subregional Martinez Railroad Improvements Annual Expenses 902,782$ 553,295$ (349,487)$
TOTAL SUBREGIONAL PROJECTS BUDGET 8,982,134$ 9,986,053$ 1,003,919$
COUNTYWIDE CAPITAL PROJECTS
Adopted Proposed Change:BART IMPROVEMENTS FY 2015-16 FY 2016-17 IncreaseORG: CCMP10 (9634) Budget Budget (Decrease)
Project Management Services 5201 46,081$ 57,014$ 10,933$ Annual Project Expenses 6111 2,379,362 7,475,142 5,095,780 Total BART Improvements Annual Expenses 2,425,443$ 7,532,156$ 5,106,713$
TOTAL COUNTYWIDE CAPITAL PROJECTS BUDGET 2,425,443$ 7,532,156$ 5,106,713$
TOTAL ALL MEASURE J PROJECTS BUDGET 133,224,504$ 100,246,912$ (32,977,592)$
TOTAL ALL MEASURE C and J PROJECTS BUDGET 140,002,155$ 114,324,123$ (25,678,032)$
4.A.14-35
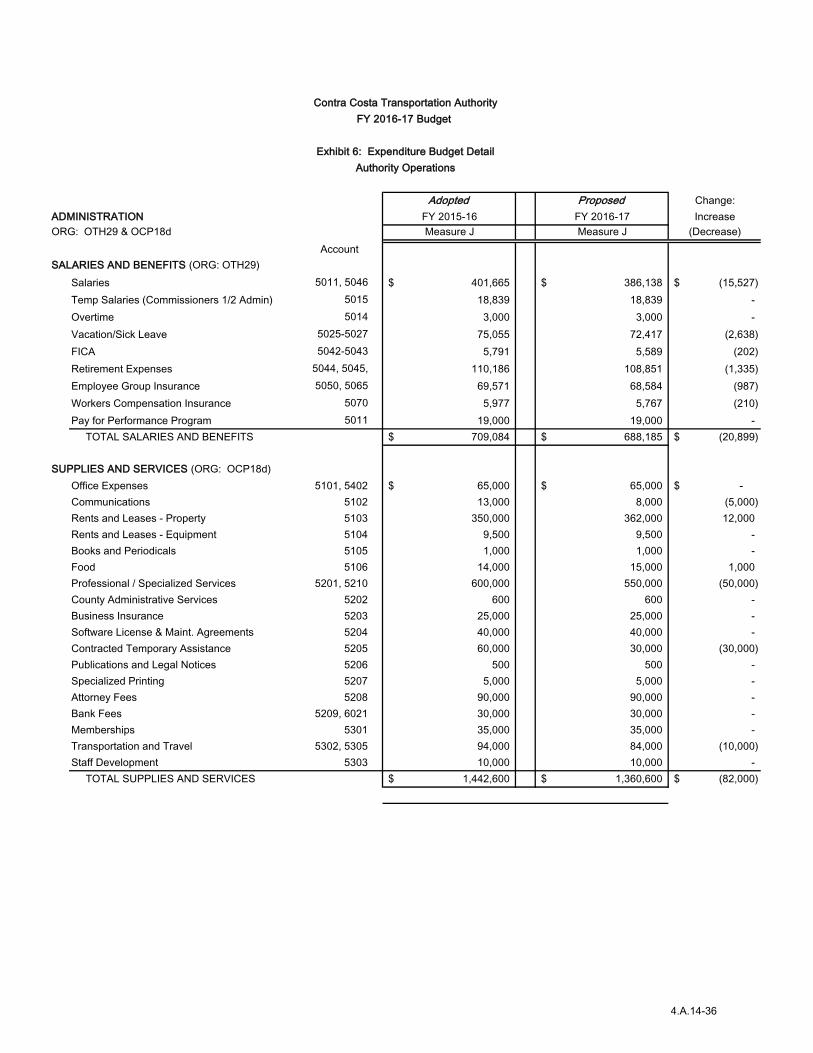
Adopted Proposed Change:ADMINISTRATION FY 2015-16 FY 2016-17 IncreaseORG: OTH29 & OCP18d Measure J Measure J (Decrease)
AccountSALARIES AND BENEFITS (ORG: OTH29)
Salaries 5011, 5046 # 401,665$ 386,138$ (15,527)$ Temp Salaries (Commissioners 1/2 Admin) 5015 # 18,839 18,839 - Overtime 5014 # 3,000 3,000 - Vacation/Sick Leave 5025-5027 # 75,055 72,417 (2,638) FICA 5042-5043 # 5,791 5,589 (202) Retirement Expenses 5044, 5045, # 110,186 108,851 (1,335) Employee Group Insurance 5050, 5065 # 69,571 68,584 (987) Workers Compensation Insurance 5070 # 5,977 5,767 (210) Pay for Performance Program 5011 19,000 19,000 - TOTAL SALARIES AND BENEFITS 5000 # 709,084$ 688,185$ (20,899)$
SUPPLIES AND SERVICES (ORG: OCP18d)Office Expenses 5101, 5402 # 65,000$ 65,000$ -$ Communications 5102 # 13,000 8,000 (5,000) Rents and Leases - Property 5103 # 350,000 362,000 12,000 Rents and Leases - Equipment 5104 # 9,500 9,500 - Books and Periodicals 5105 # 1,000 1,000 - Food 5106 # 14,000 15,000 1,000 Professional / Specialized Services 5201, 5210 # 600,000 550,000 (50,000) County Administrative Services 5202 23 600 600 - Business Insurance 5203 # 25,000 25,000 - Software License & Maint. Agreements 5204 # 40,000 40,000 - Contracted Temporary Assistance 5205 # 60,000 30,000 (30,000) Publications and Legal Notices 5206 # 500 500 - Specialized Printing 5207 # 5,000 5,000 - Attorney Fees 5208 # 90,000 90,000 - Bank Fees 5209, 6021 30,000 30,000 - Memberships 5301 # 35,000 35,000 - Transportation and Travel 5302, 5305 23 94,000 84,000 (10,000) Staff Development 5303 # 10,000 10,000 - TOTAL SUPPLIES AND SERVICES # 1,442,600$ 1,360,600$ (82,000)$
Contra Costa Transportation AuthorityFY 2016-17 Budget
Exhibit 6: Expenditure Budget DetailAuthority Operations
4.A.14-36

Contra Costa Transportation AuthorityFY 2016-17 Budget
Exhibit 6: Expenditure Budget DetailAuthority Operations
Adopted Proposed Change:ADMINISTRATION (Continued) Account FY 2015-16 FY 2016-17 IncreaseORG: OCP18d Measure J Measure J (Decrease)
FIXED ASSETS (over $5,000 in value) (ORG: OCP18d)Office Furniture and Equipment 5501 # 20,000$ 15,000$ (5,000)$ TOTAL FIXED ASSETS # 20,000$ 15,000$ (5,000)$
TOTAL ADMINISTRATION BUDGET 2,171,684$ 2,063,785$ (107,899)$
Adopted Proposed Change:PROJECT MANAGEMENT FY 2015-16 FY 2016-17 IncreaseORG: OTH40 Measure J Measure J (Decrease)
SALARIES AND BENEFITSSalaries 5011, 5046 # 1,122,246$ 1,051,026$ (71,220)$ Overtime 5015 # 3,000 3,000 - Vacation/Sick Leave 5014 # 209,654 196,880 (12,774) FICA 5025-5027 # 16,168 15,185 (983) Retirement Expenses 5042-5043 # 304,941 288,164 (16,777) Employee Group Insurance 5044, 5045, # 143,772 139,154 (4,618) Workers Compensation Insurance 5070 # 16,727 15,709 (1,018) TOTAL SALARIES AND BENEFITS 5000 # 1,816,508$ 1,709,118$ (107,390)$
SUPPLIES AND SERVICESAttorney Fees 5208 # 2,500$ 2,500$ -$ Contract Services 5201 275,000 350,000 75,000 Transportation and Travel 5302, 5304 23 42,000 20,000 (22,000) TOTAL SUPPLIES AND SERVICES # 319,500$ 372,500$ 53,000$
TOTAL PROJECT MANAGEMENT BUDGET 2,136,008$ 2,081,618$ (54,390)$
4.A.14-37
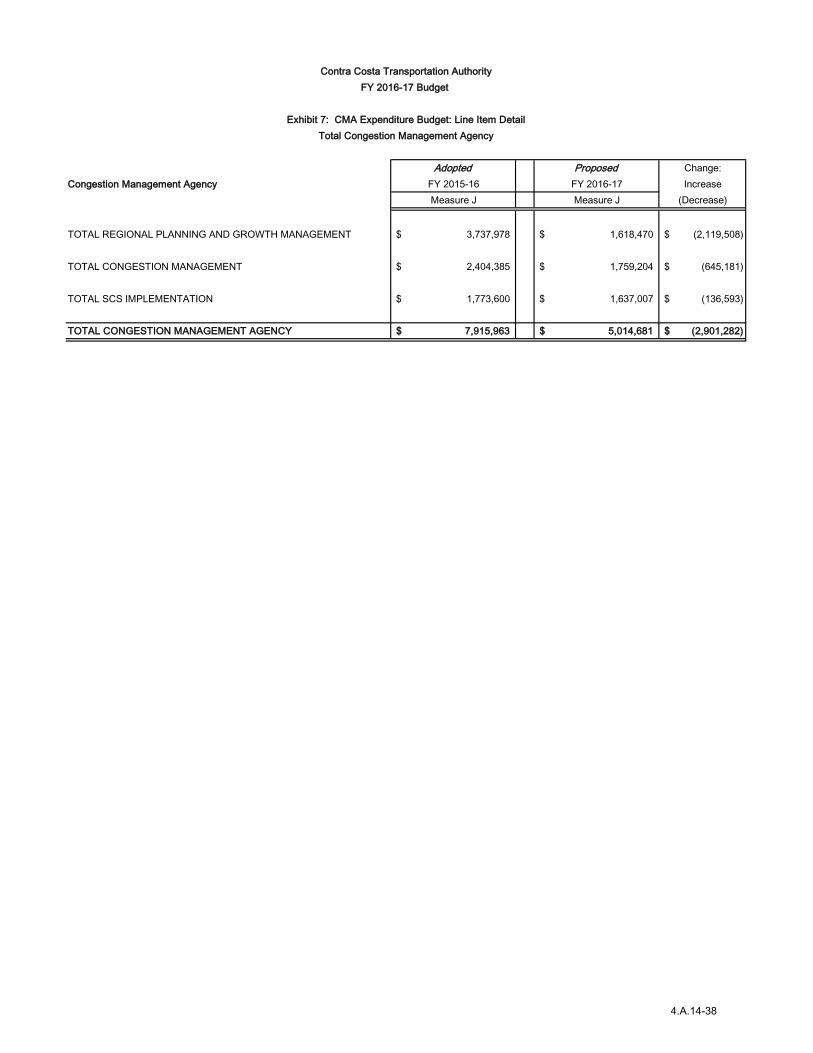
Adopted Proposed Change:Congestion Management Agency FY 2015-16 FY 2016-17 Increase
Measure J Measure J (Decrease)
TOTAL REGIONAL PLANNING AND GROWTH MANAGEMENT 3,737,978$ 1,618,470$ (2,119,508)$
TOTAL CONGESTION MANAGEMENT 2,404,385$ 1,759,204$ (645,181)$
TOTAL SCS IMPLEMENTATION 1,773,600$ 1,637,007$ (136,593)$
TOTAL CONGESTION MANAGEMENT AGENCY 7,915,963$ 5,014,681$ (2,901,282)$
Contra Costa Transportation AuthorityFY 2016-17 Budget
Exhibit 7: CMA Expenditure Budget: Line Item DetailTotal Congestion Management Agency
4.A.14-38

Contra Costa Transportation AuthorityFY 2016-17 Budget
Exhibit 7: CMA Expenditure Budget: Line Item DetailTotal Congestion Management Agency
Adopted Proposed Change:REGIONAL PLANNING AND GROWTH MANAGEMENT FY 2015-16 FY 2016-17 IncreaseORG: OCP18a (MSJ) Account Measure J Measure J (Decrease)
SALARIES AND BENEFITS1 Salaries 5011 295,070$ 331,256$ 36,186$ 2 Overtime 5014 2,500 2,500 - 3 Vacation/Sick Leave 5025-5027 55,001 61,956 6,955 4 FICA 5042-5043 4,242 4,779 537 5 Retirement Expenses
5047 82,417 91,525 9,108
6 Employee Group Insurance 5050, 5065 48,859 56,011 7,152 7 Workers Compensation Insurance 5070 4,389 4,943 554 8 TOTAL SALARIES AND BENEFITS 5000 492,478$ 552,970$ 60,492$
SUPPLIES AND SERVICES9 Computer Software and Maintenance 5204 3,000$ 3,000$ -$
10 Travel 5302 2,500 2,500 - 11 GMP Support / 2014 CTP Update (Dyett CT324 or TBD) 5201 75,000 125,000 50,000 12 Regional Planning Tasks (Stantec CT345) 5201 - 25,000 25,000 13 Action Plan Update (DKS 365) 5201 30,000 100,000 70,000 14 Project Modeling & Support (Dowling CT278) 5201 150,000 150,000 - 15 Action Plan MTSO Monitoring (Iteris CT428) 5201 50,000 50,000 - 16 2014 CTP Update EIR (L.G. CT394) 5201 325,000 150,000 (175,000)
17 2014 CTP Public Outreach (Gray Bowen CT366) 5201 2,100,000 250,000 (1,850,000) 18 I-680 Transit Relief Study (DKS CT426) 5201 225,000 - (225,000) 19 SR4 ICM Corridor Study (Stantec) 5201 115,000 25,000 (90,000) 20 Temporary Contract Planners (CT399, CT400) 5201 100,000 125,000 25,000 21 Attorney Fees 5208 60,000 50,000 (10,000) 22 Specialized Printing 5207 10,000 10,000 - 23 TOTAL SUPPLIES AND SERVICES 5100 3,245,500$ 1,065,500$ (2,180,000)$
TOTAL REGIONAL PLANNING AND GROWTH MANAGEMENT 3,737,978$ 1,618,470$ (2,119,508)$
4.A.14-39
Contra Costa Transportation AuthorityFY 2016-17 Budget
Exhibit 7: CMA Expenditure Budget: Line Item DetailTotal Congestion Management Agency
Adopted Proposed Change:CONGESTION MANAGEMENT FY 2015-16 FY 2016-17 IncreaseORG: OCP18b, OCP18e, OCP18g (MSJ) Account Measure J Measure J (Decrease)
SALARIES AND BENEFITS1 Salaries 5011 575,441$ 699,778$ 124,337$ 2 Temp Salaries (Commissioner 1/2 CMA) 5015 18,839 18,839 - 3 Overtime 5014 2,500 2,500 - 4 Vacation/Sick Leave 5025-5027 107,351 130,976 23,625 5 FICA 5042-5043 8,280 10,104 1,824 6 Retirement Expenses
5047 160,071 193,822 33,751
7 Employee Group Insurance 5050, 5065 84,267 92,483 8,216 8 Workers Compensation Insurance 5070 8,566 10,452 1,886 9 TOTAL SALARIES AND BENEFITS 5000 965,315$ 1,158,954$ 193,639$
SUPPLIES AND SERVICES10 Legal Notices 18b - 5206 250$ 250$ -$ 11 Computer Software 18b - 5204 2,500 2,500 - 12 Travel 18b - 5302 4,000 4,000 - 13 CMA Support (Stantec CT435) 18b -5201 108,820 45,000 (63,820) 14 CMP Support (Dyett CT324 or TBD) 18b -5201 100,000 60,000 (40,000) 15 CMP Monitoring (Iteris CT428) 18b -5201 100,000 100,000 - 16 Express Bus Implementation Plan (ARUP CT413) 18b -5201 120,000 60,000 (60,000) 17 Model Maintenance & Consistency (Dowling CT278) 18b -5201 50,000 50,000 - 18 SR2S Needs Assessment (Fehr & Peers CT361) 18b -5201 150,000 25,000 (125,000) 19 RTR Pilot Software Vendor: (CARMA CT347) 18g - 5201 350,000 50,000 (300,000) 20 Update Bicycle and Pedestrian Plan (TBD) 18b -5201 150,000 100,000 (50,000) 21 West Contra Costa High Capacity Study (18W.01) 18b -5201 300,000 100,000 (200,000) 22 Attorney Fees 18b - 5208 2,500 2,500 - 23 Specialized Printing 18b - 5207 1,000 1,000 - 24 TOTAL SUPPLIES AND SERVICES 5100 1,439,070$ 600,250$ (838,820)$
TOTAL CONGESTION MANAGEMENT 2,404,385$ 1,759,204$ (645,181)$
4.A.14-40

Contra Costa Transportation AuthorityFY 2016-17 Budget
Exhibit 7: CMA Expenditure Budget: Line Item DetailTotal Congestion Management Agency
Adopted Proposed Change:CONGESTION MANAGEMENT: SCS Implementation FY 2015-16 FY 2016-17 IncreaseORG: OCP18c, OCP18h (MSJ) Account Measure J Measure J (Decrease)
SALARIES AND BENEFITS1 Salaries 5011 64,097$ 66,395$ 2,298$ 2 Vacation/Sick Leave 5025-5027 11,932 12,404 472 3 FICA 5042-5043 920 957 37 4 Retirement Expenses
5047 18,371 18,574 203
5 Employee Group Insurance 5050, 5065 9,828 10,187 359 6 Workers Compensation Insurance 5070 952 990 38 7 TOTAL SALARIES AND BENEFITS 5000 106,100$ 109,507$ 3,407$
SUPPLIES AND SERVICES8 Legal Notices 18c - 5206 2,500 2,500 - 9 SCS Technical Support (Kittleson/EPS CT278) 18c - 5201 15,000 25,000 10,000
10 Update LUIS (EPS CT312) 18c - 5201 13,000 - (13,000) 11 Dyett and Bhatia (CT324) 18c - 5201 125,000 - (125,000) 12 PDA Planning Grant Consultants (CT422-425, CT438) 18h - 5201 1,500,000 1,500,000 - 13 Support SCS/OBAG Activities (EPS CT312) 18c - 5201 12,000 - (12,000) 14 TOTAL SUPPLIES AND SERVICES 5100 1,667,500$ 1,527,500$ (140,000)$
TOTAL CONGESTION MANAGEMENT: SCS Implementation 1,773,600$ 1,637,007$ (136,593)$
4.A.14-41

Department Administration
Funding Measure J (a) Measure J
DEMO, COUNTY, WCHB &
ECCRFFA RM2 Measure J STP & Local STP & Local PPM Measure J STP & Local
Category AdministrationProject
ManagementEast County
Corridor I-680 Corridor Total ProjectsRegional Planning CMA
CMA-Climate Change CMA-PPM
PDA Investment & Growth Strategy
SCS Implementation Total Planning
Positions:1 Executive Director 22.0% 41.0% 0.0% - 41.0% 5.0% 1.0% - 30.0% - - 36.0%2 Chief Deputy Executive Director 1.0% 70.0% 3.0% - 73.0% - - - 25.0% - - 25.0%3 Chief Financial Officer 38.9% 31.8% - - 31.8% 14.4% 14.9% - - - - 29.3%4 Deputy Executive Director, Planning - - 15.0% - 15.0% 30.0% 45.0% - - - 10.0% 85.0%5 Director, Projects - 30.0% 20.0% 10.0% 60.0% - - - 40.0% - - 40.0%6 Director of External Affairs 25.0% 15% - - 15% 10.0% - 5.0% 45.0% - - 60.0%7 Director of Programs 4.0% - - - - 3.0% 10.0% 5.0% - - - 18.0%8 Engineering Manager - 59.0% - 1.0% 60.0% - - - 40.0% - - 40.0%9 Senior Transportation Planner - - - - - 25.0% 30.0% - - 15.0% - 70.0%
10 Accounting Specialist 20.0% 59.0% - - 59.0% 4.0% 5.0% - - - - 9.0%11 Senior Accountant 43.0% 32.0% - - 32.0% 8.1% 16.9% - - - - 25.0%12 Associate Engineer - 70.0% - 2.0% 72.0% 10.0% - - 18.0% - - 28.0%13 Associate Transportation Planner - - 5.0% - 5.0% 35.0% 38.0% - - - 22.0% 95.0%14 Executive Assistant / Board Clerk 80.0% 10.0% - - 10.0% - 10.0% - - - - 10.0%15 Administrative Assistant, Projects 5.0% 95.0% - - 95.0% - - - - - - - 16 Administrative Assistant, Planning 10.0% - - - - 40.0% 40.0% - - - 5% 85.0%17 Administrative Assistant, Finance 35.0% 20.0% - - 20.0% 25.0% 15.0% - - - - 40.0%18 Senior Engineer (ITS CV/AV) - 75.0% - - 75.0% 25% - - - - - 25.0%19 Finance Manager 23.9% 50.1% - - 50.1% 7.0% 10.4% - - - - 17.4%20 Engineering Manager (Construction) - 45.0% 40.0% - 85.0% 15.0% - - - - - 15.0%
Authority Full Time Equivalent 2017 3.08 7.03 0.83 0.13 7.99 2.57 2.36 0.10 1.98 0.15 0.37 7.53Authority Full Time Equivalent 2016 3.23 7.56 0.85 0.13 8.54 2.37 2.71 0.10 1.25 0.15 0.37 6.95Authority Full Time Equivalent 2017 688,185$ 1,709,118$ 235,440$ 35,290$ 1,979,848$ 552,970$ 520,305$ 23,628$ 615,021$ 33,822$ 75,685$ 1,821,431$ Authority Full Time Equivalent 2016 709,084$ 1,816,508$ 227,894$ 34,196$ 2,078,598$ 492,478$ 579,936$ 22,881$ 362,498$ 32,763$ 73,337$ 1,563,893$
Notes:a. Administration subject to Measure J 1% limitation. For Fiscal Year 2016-17 the limit is $848,720; whereas, the the Administration budget is $688,185. The budget is below by $160,535 or 0.81% of the 1% limitation.
Project Mgmt Planning
Contra Costa Transportation AuthorityFY 2016-17 Budget
Exhibit 8: Staff Budget Allocation
4.A.14-42

Department
Funding
CategoryPositions:
1 Executive Director2 Chief Deputy Executive Director3 Chief Financial Officer4 Deputy Executive Director, Planning5 Director, Projects6 Director of External Affairs7 Director of Programs8 Engineering Manager9 Senior Transportation Planner
10 Accounting Specialist11 Senior Accountant12 Associate Engineer13 Associate Transportation Planner14 Executive Assistant / Board Clerk15 Administrative Assistant, Projects16 Administrative Assistant, Planning17 Administrative Assistant, Finance18 Senior Engineer (ITS CV/AV)19 Finance Manager20 Engineering Manager (Construction)
Authority Full Time Equivalent 2017Authority Full Time Equivalent 2016Authority Full Time Equivalent 2017Authority Full Time Equivalent 2016
Measure J Measure J Measure J Measure J Measure J Measure J Measure J Air Quality
TLCPed, Bike &
Trail Bus Transit Express Bus ParatransitSafe Trans for
ChildrenCommute
Alternatives TFCA Total Programs Total
- - - - - - - - - 0.99- - - - - - - - - 0.99- - - - - - - - - 1.00- - - - - - - - - 1.00- - - - - - - - - 1.00- - - - - - - - - 1.00- - 15.0% 13.0% 22.5% 2.5% 5.0% 20.0% 78.0% 1.00- - - - - - - - - 1.00
15.0% 15.0% - - - - - - 30.0% 1.001.0% 1.0% 2.0% 1.0% 2.0% 1.0% 2.0% 2.0% 12.0% 1.00
- - - - - - - - - 1.00- - - - - - - - - 1.00- - - - - - - - - 1.00- - - - - - - - - 1.00- - - - - - - - - 1.00- - - - - - - 5.0% 5.0% 1.00- - - - - - - 5.0% 5.0% 1.00- - - - - - - - - 1.00
2.0% 2.0% - - - - - 4.6% 8.6% 1.00- - - - - - - - - 1.00
0.18 0.18 0.17 0.14 0.25 0.04 0.07 0.37 1.39 19.980.13 0.13 0.12 0.14 0.25 0.04 0.07 0.42 1.29 20.00
39,128$ 39,128$ 38,459$ 32,403$ 56,427$ 7,249$ 14,501$ 72,971$ 300,266$ 4,789,730$ 26,990$ 26,990$ 25,655$ 31,387$ 54,657$ 7,025$ 14,050$ 82,304$ 269,058$ 4,620,633$
Contra Costa Transportation AuthorityFY 2016-17 Budget
Exhibit 8: Staff Budget Allocation
Programs
4.A.14-43
Adopted Proposed Change:FY 2015-16 FY 2016-17 Inc (Dec)
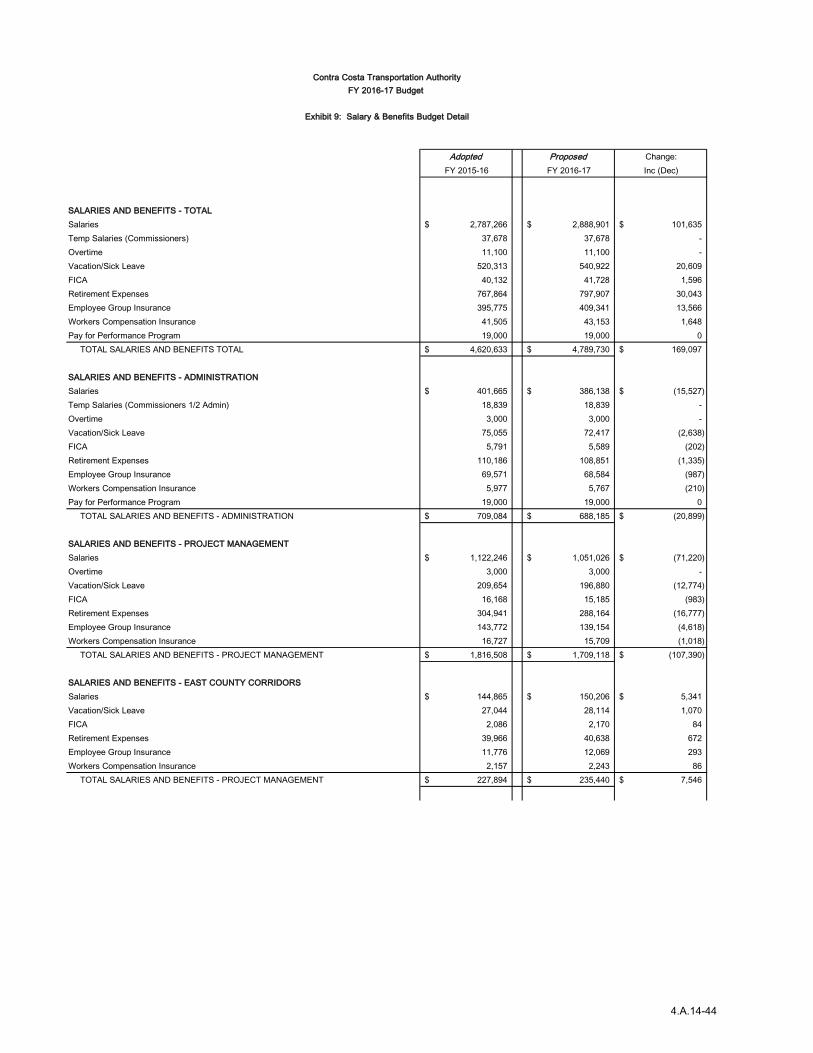
SALARIES AND BENEFITS - TOTALSalaries 2,787,266$ 2,888,901$ 101,635$ Temp Salaries (Commissioners) 37,678 37,678 - Overtime 11,100 11,100 - Vacation/Sick Leave 520,313 540,922 20,609 FICA 40,132 41,728 1,596 Retirement Expenses 767,864 797,907 30,043 Employee Group Insurance 395,775 409,341 13,566Workers Compensation Insurance 41,505 43,153 1,648Pay for Performance Program 19,000 19,000 0 TOTAL SALARIES AND BENEFITS TOTAL 4,620,633$ 4,789,730$ 169,097$
SALARIES AND BENEFITS - ADMINISTRATIONSalaries 401,665$ 386,138$ (15,527)$ Temp Salaries (Commissioners 1/2 Admin) 18,839 18,839 - Overtime 3,000 3,000 - Vacation/Sick Leave 75,055 72,417 (2,638) FICA 5,791 5,589 (202) Retirement Expenses 110,186 108,851 (1,335) Employee Group Insurance 69,571 68,584 (987)Workers Compensation Insurance 5,977 5,767 (210)Pay for Performance Program 19,000 19,000 0 TOTAL SALARIES AND BENEFITS - ADMINISTRATION 709,084$ 688,185$ (20,899)$
SALARIES AND BENEFITS - PROJECT MANAGEMENTSalaries 1,122,246$ 1,051,026$ (71,220)$ Overtime 3,000 3,000 - Vacation/Sick Leave 209,654 196,880 (12,774) FICA 16,168 15,185 (983) Retirement Expenses 304,941 288,164 (16,777) Employee Group Insurance 143,772 139,154 (4,618) Workers Compensation Insurance 16,727 15,709 (1,018) TOTAL SALARIES AND BENEFITS - PROJECT MANAGEMENT 1,816,508$ 1,709,118$ (107,390)$
SALARIES AND BENEFITS - EAST COUNTY CORRIDORSSalaries 144,865$ 150,206$ 5,341$ Vacation/Sick Leave 27,044 28,114 1,070 FICA 2,086 2,170 84 Retirement Expenses 39,966 40,638 672 Employee Group Insurance 11,776 12,069 293 Workers Compensation Insurance 2,157 2,243 86 TOTAL SALARIES AND BENEFITS - PROJECT MANAGEMENT 227,894$ 235,440$ 7,546$
Contra Costa Transportation AuthorityFY 2016-17 Budget
Exhibit 9: Salary & Benefits Budget Detail
4.A.14-44

Adopted Proposed Change:FY 2015-16 FY 2016-17 Inc (Dec)
Contra Costa Transportation AuthorityFY 2016-17 Budget
Exhibit 9: Salary & Benefits Budget Detail
SALARIES AND BENEFITS - I-680 CARPOOL LANE GAP CLOSURE/TRANSIT CORRIDOR IMPROV./EXPRESS LANE CONVERSIONSalaries 21,852$ 22,665$ 813$ Vacation/Sick Leave 4,080 4,241 161 FICA 315 327 12 Retirement Expenses 6,173 6,241 68 Employee Group Insurance 1,450 1,477 27 Workers Compensation Insurance 326 339 13 TOTAL SALARIES AND BENEFITS - PROJECT MANAGEMENT 34,196$ 35,290$ 1,094$
SALARIES AND BENEFITS - REGIONAL PLANNINGSalaries 295,070$ 331,256$ 36,186$ Overtime 2,500 2,500 - Vacation/Sick Leave 55,001 61,956 6,955 FICA 4,242 4,779 537 Retirement Expenses 82,417 91,525 9,108 Employee Group Insurance 48,859 56,011 7,152 Workers Compensation Insurance 4,389 4,943 554 TOTAL SALARIES AND BENEFITS REGIONAL PLANNING 492,478$ 552,970$ 60,492$
SALARIES AND BENEFITS - CONGESTION MANAGEMENT AGENCYSalaries 575,441$ 699,778$ 124,337$ Temp Salaries (Commissioners 1/2 CMA) 18,839 18,839 - Overtime 2,500 2,500 - Vacation/Sick Leave 107,351 130,976 23,625 FICA 8,280 10,104 1,824 Retirement Expenses 160,071 193,822 33,751 Employee Group Insurance 84,267 92,483 8,216 Workers Compensation Insurance 8,566 10,452 1,886 TOTAL SALARIES AND BENEFITS CONGESTION MANAGEMENT AGENCY 965,315$ 1,158,954$ 193,639$
SALARIES AND BENEFITS - SCS IMPLEMENTATIONSalaries 64,097$ 66,395$ 2,298$ Vacation/Sick Leave 11,932 12,404 472 FICA 920 957 37 Retirement Expenses 18,371 18,574 203 Employee Group Insurance 9,828 10,187 359 Workers Compensation Insurance 952 990 38 TOTAL SALARIES AND BENEFITS - T-PLUS 106,100$ 109,507$ 3,407$
SALARIES AND BENEFITS - TRANSPORTATIONS FOR LIVABLE COMMUNITY PROJECT (TLC)Salaries 16,148$ 23,518$ 7,370$ Vacation/Sick Leave 3,007 4,396 1,389 FICA 232 339 107 Retirement Expenses 4,649 6,621 1,972 Employee Group Insurance 2,714 3,903 1,189 Workers Compensation Insurance 240 351 111 TOTAL SALARIES AND BENEFITS TLC 26,990$ 39,128$ 12,138$
4.A.14-45

Adopted Proposed Change:FY 2015-16 FY 2016-17 Inc (Dec)
Contra Costa Transportation AuthorityFY 2016-17 Budget
Exhibit 9: Salary & Benefits Budget Detail
SALARIES AND BENEFITS - PEDESTRIAN, BICYCLE AND TRAIL FACILITIESSalaries 16,148$ 23,518$ 7,370$ Vacation/Sick Leave 3,007 4,396 1,389 FICA 232 339 107 Retirement Expenses 4,649 6,621 1,972 Employee Group Insurance 2,714 3,903 1,189 Workers Compensation Insurance 240 351 111 TOTAL SALARIES AND BENEFITS PEDESTRIAN, BICYCLE AND TRAIL FACILITIES 26,990$ 39,128$ 12,138$
SALARIES AND BENEFITS - BUS TRANSITSalaries 15,616$ 23,480$ 7,864$ Vacation/Sick Leave 2,913 4,393 1,480 FICA 225 339 114 Retirement Expenses 4,394 6,437 2,043 Employee Group Insurance 2,274 3,459 1,185 Workers Compensation Insurance 233 351 118 TOTAL SALARIES AND BENEFITS BUS TRANSIT 25,655$ 38,459$ 12,804$
SALARIES AND BENEFITS - EXPRESS BUSSalaries 19,080$ 19,771$ 691$ Vacation/Sick Leave 3,557 3,697 140 FICA 274 285 11 Retirement Expenses 5,351 5,411 60 Employee Group Insurance 2,842 2,944 102 Workers Compensation Insurance 283 295 12 TOTAL SALARIES AND BENEFITS EXPRESS BUS 31,387$ 32,403$ 1,016$
SALARIES AND BENEFITS - PARATRANSITSalaries 33,229$ 34,432$ 1,203$ Vacation/Sick Leave 6,196 6,442 246 FICA 478 497 19 Retirement Expenses 9,322 9,427 105 Employee Group Insurance 4,937 5,115 178 Workers Compensation Insurance 495 514 19 TOTAL SALARIES AND BENEFITS PARATRANSIT 54,657$ 56,427$ 1,770$
SALARIES AND BENEFITS - SAFE TRANSPORTATION FOR CHILDRENSalaries 4,286$ 4,440$ 154$ Vacation/Sick Leave 798 830 32 FICA 62 64 2 Retirement Expenses 1,211 1,224 13 Employee Group Insurance 605 625 20 Workers Compensation Insurance 63 66 3 TOTAL SALARIES AND BENEFITS SAFE TRANSPORTATION FOR CHILDREN 7,025$ 7,249$ 224$
4.A.14-46

Adopted Proposed Change:FY 2015-16 FY 2016-17 Inc (Dec)
Contra Costa Transportation AuthorityFY 2016-17 Budget
Exhibit 9: Salary & Benefits Budget Detail
SALARIES AND BENEFITS - COMMUTE ALTERNATIVESSalaries 8,571$ 8,879$ 308$ Vacation/Sick Leave 1,599 1,663 64 FICA 123 128 5 Retirement Expenses 2,422 2,449 27 Employee Group Insurance 1,207 1,249 42 Workers Compensation Insurance 128 133 5 TOTAL SALARIES AND BENEFITS COMMUTE ALTERNATIVES 14,050$ 14,501$ 451$
SALARIES AND BENEFITS - TRANSPORTATION FUNDING FOR CLEAN AIR (TFCA)Salaries 48,952$ 43,399$ (5,553)$ Overtime 100 100 - Vacation/Sick Leave 9,119 8,117 (1,002) FICA 704 626 (78) Retirement Expenses 13,741 11,902 (1,839) Employee Group Insurance 8,959 8,178 (781) Workers Compensation Insurance 729 649 (80) TOTAL SALARIES AND BENEFITS TFCA 82,304$ 72,971$ (9,333)$
4.A.14-47