Embed Size (px)
Citation preview
DECEMBER 2017 • VOL. 10 • ISSUE 12
1492 Vantage Point Newsletter
Welcome to 1492 Capital Management’s quarterly newsletter for the fourth quarter of 2017. In
each quarterly newsletter, we provide a small cap perspective on the most recent quarter, preview
what lies ahead, and offer a bit of market trivia.
Our corporate slogan is “Discovering Opportunity” which is our daily focus for our clients with
our Small Cap Growth, Small Cap Value, Small Cap Core Alpha, and Small Cap Dynamic Hedge
strategies and with our wealth management platform. Our investment professionals possess a
tremendous amount of experience navigating through multiple market cycles. This experience
was demonstrated again with a number of accolades that are highlighted in the table below for
both our 1492 Small Cap Core Alpha and our 1492 Small Cap Growth strategies for the four
quarters ending September 30, 2017 in Broadridge MarketPlace’s Best Money Managers(1).
The S&P 500 runs the table in 2017. The S&P 500 completed the year with a perfect 12-0 mark,
as it posted positive performance in every month of 2017 with all major indices hitting new all-
time highs as the year closed. This advance was made easier given the historically low volatility
environment which existed for much of the year. The largest drawdown during the year of -3.3%,
was one of the lowest of all-time. Additionally, the price of oil (higher) and tax reform
(completion), were major market drivers as we discussed last year at this time. Small cap stocks
ended the year higher but trailed the S&P 500 by over 7% for the year. However, since August
21st when President Trump initiated the tax reform push, the markets have rallied with small caps
rising nearly 14% and outperforming large caps by almost 300 basis points. Looking ahead to
2018, the market undoubtedly will be more volatile as mid-term elections come into focus and as
expectations for both the economy and stock market have elevated. 2018 may also be the first
year since the great recession that lacks an economic stimulus program to catalyze the stock
market. While most market observers have pointed to tax reform as the sole reason for the
market’s push higher, they’ve lost focus on a surprisingly strong U.S. economy. Please read on
to see our unique views of what’s on tap for 2018, what the key drivers will be, and indulge in
some stock market trivia.
For detailed performance information on 1492’s strategies, please click on these fact sheet links
(Small Cap Growth / Small Cap Value / Small Cap Core Alpha) to find gross and net of fee
performance information and the appropriate disclosures. If you would like to discuss any of these
strategies with us, please contact Tim Stracka at 414-238-3398.
4 Quarters Ending 9/30/2017
Asset Class Ranking Product Name
U.S. Growth & Value Equity Ranked 3 out of 569 1492 Small Cap Core Alpha
U.S. Small-cap Growth & Value Equity Ranked 3 out of 183 1492 Small Cap Core Alpha
U.S. Growth Equity Ranked 26 out of 523 1492 Small Cap Growth
U.S. Small-cap Equity Ranked 30 out of 464 1492 Small Cap Growth
U.S. Small-cap Growth Equity Ranked 17 out of 138 1492 Small Cap Growth
U.S. Equity (All Styles) Ranked 30 out of 1770 1492 Small Cap Core Alpha
U.S. Small-cap Equity Ranked 19 out of 464 1492 Small Cap Core Alpha
Review of 2017: Market Calm in Sharp Contrast to Hurricanes in Washington D.C., Florida, and Texas…………………....Page 2
Predictions and Prognostications in 2017- How Did We Do?.…. Page 5
2018 Outlook: Positives Outweigh the Negatives But Will the Market See it That Way……………………...Page 7
Thematic Investing: Industrial Automation-The Next Super Cycle… Page15
Thematic Investing: Bitcoin is All the Rage, but Blockchain is Where the Action is……………...Page 16 2018 Outlook: A Picture is Worth a Thousand Words ……………………………Page 16
Market Trivia…….…Page 19 CONTACT US 1492 CAPITAL MANAGEMENT 309 North Water St. Suite 505 Milwaukee, WI 53202 Main: 414-276-1492
www.1492CapitalManagement.com
IN THIS ISSUE: IN THIS ISSUE:

2
1492 VANTAGE POINT NEWSLETTER
A Review of 2017: Market Calm was in Sharp Contrast to Hurricanes in Washington D.C., Florida, and Texas
If you read the heading above closely, you’re probably saying to yourself, “I recall the Florida and Texas hurricanes but we
didn’t have a hurricane in Washington D.C.”. However, many have equated President Trump’s first year in office to a hurricane
pummeling Washington D.C. given his brash and, at times, unorthodox style. Despite the turmoil caused by these hurricanes,
both literally and figuratively, the stock market posted one of the least volatile years on record with the largest drawdown
during the year of -3.3%. Low stock market volatility environments are generally quite positive for stock market performance.
The chart below shows the lowest volatility years since 1945, and as you can see, 2017’s -3.3% maximum intra-year drawdown
was the second lowest over this period. As the second column highlights, the ten lowest drawdown years have produced
average returns of +25% for the S&P 500, which is quite comparable to 2017’s performance of nearly +22%. That said, as the
two columns on the right show, there is usually a reversal in the following year with higher volatility and lower overall returns
on average.
Source: Strategas Research
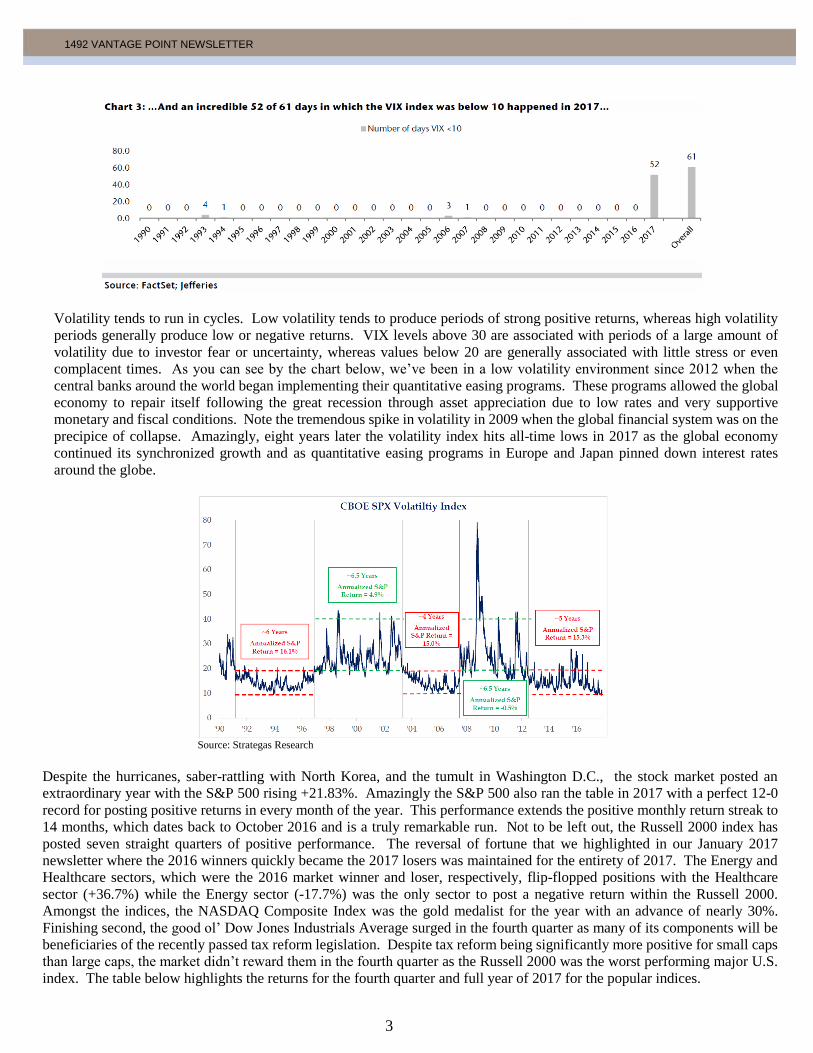
Without getting too technical, the Volatility Index or VIX, is a measure of the market's expectation of 30-day volatility. It
is constructed using the implied volatilities of a wide range of S&P 500 index options. This volatility is meant to be forward
looking, is calculated from both calls and puts, and is a widely used measure of market risk, often referred to as the "investor
fear gauge." The charts below show just how calm the markets were in 2017. The top chart below shows that the average
VIX index value for 2017 was just 11 versus the average since 1990 of 19. The second chart below shows the number of
times that the VIX index was below 10 during the year- an incredible 52 times compared to 61 times in total since 1990.
3
1492 VANTAGE POINT NEWSLETTER
Volatility tends to run in cycles. Low volatility tends to produce periods of strong positive returns, whereas high volatility
periods generally produce low or negative returns. VIX levels above 30 are associated with periods of a large amount of
volatility due to investor fear or uncertainty, whereas values below 20 are generally associated with little stress or even
complacent times. As you can see by the chart below, we’ve been in a low volatility environment since 2012 when the
central banks around the world began implementing their quantitative easing programs. These programs allowed the global
economy to repair itself following the great recession through asset appreciation due to low rates and very supportive
monetary and fiscal conditions. Note the tremendous spike in volatility in 2009 when the global financial system was on the
precipice of collapse. Amazingly, eight years later the volatility index hits all-time lows in 2017 as the global economy
continued its synchronized growth and as quantitative easing programs in Europe and Japan pinned down interest rates
around the globe.
Source: Strategas Research
Despite the hurricanes, saber-rattling with North Korea, and the tumult in Washington D.C., the stock market posted an
extraordinary year with the S&P 500 rising +21.83%. Amazingly the S&P 500 also ran the table in 2017 with a perfect 12-0
record for posting positive returns in every month of the year. This performance extends the positive monthly return streak to
14 months, which dates back to October 2016 and is a truly remarkable run. Not to be left out, the Russell 2000 index has
posted seven straight quarters of positive performance. The reversal of fortune that we highlighted in our January 2017
newsletter where the 2016 winners quickly became the 2017 losers was maintained for the entirety of 2017. The Energy and
Healthcare sectors, which were the 2016 market winner and loser, respectively, flip-flopped positions with the Healthcare
sector (+36.7%) while the Energy sector (-17.7%) was the only sector to post a negative return within the Russell 2000.
Amongst the indices, the NASDAQ Composite Index was the gold medalist for the year with an advance of nearly 30%.
Finishing second, the good ol’ Dow Jones Industrials Average surged in the fourth quarter as many of its components will be
beneficiaries of the recently passed tax reform legislation. Despite tax reform being significantly more positive for small caps
than large caps, the market didn’t reward them in the fourth quarter as the Russell 2000 was the worst performing major U.S.
index. The table below highlights the returns for the fourth quarter and full year of 2017 for the popular indices.

4
1492 VANTAGE POINT NEWSLETTER
Index Returns
Index Fourth Qtr. 2017
Return 2017 YTD
Return
Russell 2000 +3.34% +14.66%
Russell 2000 Growth +4.59% +22.18%
Russell 2000 Value +2.05% +7.84%
S&P 500 +6.64% +21.83%
Dow Jones Industrials +10.33% +25.08%
NASDAQ Composite +6.55% +29.64% Source: 1492 Capital Management, LLC and Factset
From a style perspective, the Russell 2000 Growth Index (+22.2%) trounced the Russell 2000 Value Index (+7.8%) for the
year and continued the flip-flop theme from 2016. As mentioned above, the Healthcare sector, due to a resurgence in biotech
stocks, propelled the strong performance in the growth index despite many of the traditional value sectors generally performing
well in the fourth quarter. Note the performance of the Energy sector in the month of December. Clearly the market is betting
that the year’s big loser will reverse course in 2018 as the price of oil has nearly reached $60/barrel. The first two tables below
highlight the performance of the Russell 2000 style indices by sector for the fourth quarter and full year 2017. Lastly, the third
table below shows that performance within the Russell 2000 was linearly worse as market cap declines. This trend has existed
since early 2014 with a brief respite in the second half of 2016 only to reappear in 2017.
Source: Jefferies
5
1492 VANTAGE POINT NEWSLETTER
The U.S. markets all advanced nicely during 2017, but the international and commodity markets didn’t all follow suit.
Interestingly, the European region ran out of steam during the fourth quarter and finished with rather pedestrian returns for the
year. European markets, in our opinion, are beginning to discount the end of the ECB’s quantitative easing program which has
recently been telegraphed by Mario Draghi. Despite having some of the best economic growth statistics in the world, China’s
stock markets were relatively soft as the government there is cracking down on pollution which is causing some indigestion in
their industrial driven economy. Japan, Brazil, and India were notable standouts on the year and signifies that the synchronized
global economic upturn is alive and well. Brazil is notable as demand for raw materials like iron ore, coal, and oil generally
drives their economy. Despite a stronger global economy, increasing signs of inflation, and a number of Fed rate hikes during
the year, bonds continued to gain as interest rates remain very low. As a general observation, commodities were also higher
in 2017, particularly in the metals complex, oil, and lumber. Oil was the biggest winner in the fourth quarter on the heels of
OPEC’s extension of their output reduction for at least nine more months.
Index Fourth Qtr. 2017 Return
2017 YTD
Return
France +-0.3% +9.3%
Germany +0.7% +9.6%
Brazil +2.8% +26.9%
India +8.9% +27.9%
China- A Shares -1.2% +6.6%
China- Shenzhen A Shares -4.5% -3.6%
Japan +11.8% +19.1%
Long-Term Treasuries (TLO) +2.6% +9.0%
Investment Grade Corp. Bonds +1.4% +6.6%
Gold +1.9% +13.7%
Volatility- VIX index +16.1% -21.4%
Oil +16.9% +12.5%
Natural Gas -1.8% -19.8%
Lumber +11.4% +41.5% Source: 1492 Capital Management, LLC
Predictions and Prognostications in 2017: How Did We Do?
While we aren’t in the business of making formal forecasts on the economy and on the stock market, we thought it would be
interesting to review our 2016 newsletters and see where our prognostications hit and missed the mark. Our
predictions/prognostications are in italics below.
Excerpts from our fourth quarter 2016 newsletter:
Regarding GDP Growth in 2017: With Trump’s cabinet appointments, many of whom are business people, and his focus
on tax reform, pro-growth regulatory environment, and cash repatriation, we expect that the combination of these new
policies will accelerate the economy to a 3% GDP environment.
We were spot on here as economic growth has accelerated through 2017 and exceeded 3% in both the June and September
quarter. It will likely exceed 3% in the fourth quarter as well.
Regarding the price of oil and its significance to the U.S. economy: The punchline is that when our domestic oil
producers are hurting, so too is our overall economy. However, a little more than two years after OPEC’s decision to let
oil drop, both OPEC and non-OPEC oil producers around the globe have agreed to cap production. This has had the

6
1492 VANTAGE POINT NEWSLETTER
effect of putting in a floor on the price of oil and has already started a meaningful pick up in the number of rigs that are
drilling for oil in the U.S., up 58% off the bottom. This is an important positive “rate of change” that will likely provide
benefits to the U.S. economy in the New Year. This is a topic that many economists have still yet to grasp.
Anyone that has read our quarterly newsletters over the past year knows that our outlook on the U.S. economy in 2017 was
almost entirely predicated on the price of oil. Although there were fits and starts during 2017, the price of oil currently stands
at $61.50/barrel and has driven capital expenditures higher as the year progressed. Subsequent to the remarks we made
above, we found the chart below which highlights how closely linked U.S. manufacturing is to the price of oil.
Source: Cornerstone Macro
Regarding potential headwinds to the economy in 2017: Potential headwinds- Rising Interest rates, end to global
quantitative easing, and strong U.S. dollar. ………. As we get to the latter part of 2017, it’s quite possible that the ECB
and Bank of Japan will signal a conclusion of their programs (negative rate of change). These stimulus measures have
been like a drug to the stock market and it remains to be seen what the withdrawal symptoms may be. Lastly, the U.S.
dollar is inextricably linked to the actions of our trading partners and given the interest rate differentials that exist between
the U.S. and the other major economic powers around the globe, the U.S. dollar may continue to strengthen, potentially
impacting those companies selling overseas.
We will call this one a split. We were correct in asserting that the global central banks would begin signaling the end of their
quantitative easing programs. In fact, the ECB did so in November, and the European stock markets saw negative returns in
the fourth quarter of 2017. Our assertion that the dollar may continue to strengthen was incorrect. In fact, it declined which
actually helped large cap, multinational stocks to outperform.
Regarding our outlook for the stock market in 2017: 2017 is probably more difficult to predict than most given the
unexpected move up in the markets late in 2016 and the turning over of administrations in Washington. However, at the
end of the day, markets are most influenced by earnings and we have a hard time coming up with a bad outcome given all
the positive developments highlighted above like tax reform, regulatory reform, confidence, and oil.
……………….However, the wild cards are Trump, foreign relations, and global stimulus. Therefore, our prediction is that
the market may pause early in the year and watch what the Trump administration’s major initiatives are and how quickly
they move on them. The bottom line is that there is still a relative valuation gap for small caps and with earnings growth
potentially greater than 15% (due to tax cuts and the energy sector no longer dragging down earnings), we wouldn’t be
surprised to see another 10% advance by year’s end.
At the time we wrote this, our call for a +10% market in 2017 was out of consensus. Therefore, we’ll take a victory lap on this
one as the Russell 2000 finished the year up +14.7% with most of this coming late in 2017 following Trump’s hard push on
tax reform.

7
1492 VANTAGE POINT NEWSLETTER
Excerpts from our first quarter 2017 newsletter:
Regarding synchronized global growth and its impact: The bottom line is that synchronized growth will slowly lead
the world’s central banks away from their ultra-accommodative policies over the next year or so without risk of implosion.
This will return us to more normalized business cycles with their inherent cyclicality and not the muted growth and
suppressed volatility that we’ve experienced for the past seven years. In an odd way, it will return the focus to company
fundamentals and valuations and away from indiscriminate investing through ETF’s that has made active managers lives
most difficult since the recession.
Still too early to claim victory on this one, but we’re certainly heading down the path of more normalized business cycles as
the world’s central banks are beginning to put an end to ultra-accommodative policies. The U.S. Fed has already begun the
process of interest rate normalization, and the ECB has indicated its intent to do so as well. Volatility remains muted as we
discussed earlier, but the cyclicality of the business cycle is likely to return in time. The synchronized global growth that we
referenced in early 2017 has only accelerated through the end of 2017 as the chart below shows in the first column on the left.
Regarding our prediction of a tech super cycle: After collecting a bevy of data points from our meetings with
management teams in the technology arena, we believe that 2017 is the start of a technology super cycle with a
variety of growth drivers for the group as a whole that put the internet focused 1999-2000 technology expansion
period to shame.
The market is seemingly coming around to this idea as technology was the best performing sector in the S&P 500 in 2017, and
there doesn’t appear to be an end to tech spending as its becoming embedded in so many parts of the global economy. See the
section below entitled “Thematic Investing: Industrial Automation-The Next Super Cycle”. While we can’t take a victory lap
on this one yet, we believe there are some fabulous trends in place or emerging that will make this tech cycle far more durable
than the 1999-2000 internet-induced tech bubble.
2018 Outlook: Positives Outweigh the Negatives, but Will the Market See it That Way
As we write this newsletter over the holiday season, we can’t help but feel optimistic about 2018. There are plenty of good
things that are happening in the economic world that will add fuel to the stock market fire. These items include tax reform,
deregulation, valuation (yes that’s a positive), and synchronized global growth. We’ll look at each one of these in more detail
and provide our take on each and what we’re watching. Then we’ll lay out what we’re concerned about or what could be
headwinds for the stock market in 2018.

8
1492 VANTAGE POINT NEWSLETTER
The Positives for 2018
Tax Reform- This reform is going to end up being a much bigger positive than most believe today. Tax rates for almost every
company and individual will be lower in 2018. Sure, there will be a few exceptions such as those individuals in the upper
income tax brackets who live in a state with very high state and local income taxes and property taxes. Think California, New
York, Connecticut, and New Jersey residents. The effect is going to start showing up in paychecks likely in late February for
the average worker as withholding rates will be lower. Additionally, over 40 major corporations have already decided to
increase pay for every employee by at least $1,000 or award bonuses which are tied to the windfall they’ll receive from lower
corporate taxes. Companies who’ve announced such plans include Boeing, Fifth Third Bancorp, Wells Fargo and Comcast
just to name a few. However, AT&T was the first to announce such a program, and it’s indicative of why this reform is going
to be a far bigger deal than most anticipate right now. They will award bonuses of $1,000 to more than 200,000 employees in
the U.S. and promised to invest an additional $1 billion in the U.S. in 2018. This single example is why tax reform is going
to be unlike any other stimulus measure implemented since the Great Recession. The two charts below put some numbers
behind tax reform. The chart on the left shows how much disposable personal income will rise by the end of 2018. The
increase is a whopping $84 billion or a +5.1% increase. The chart on the right shows the impact on consumers and small
businesses as a percent of GDP. So by 2019, tax reform could add nearly 1% to GDP growth.
Source: Cornerstone Macro Source: Strategas Research
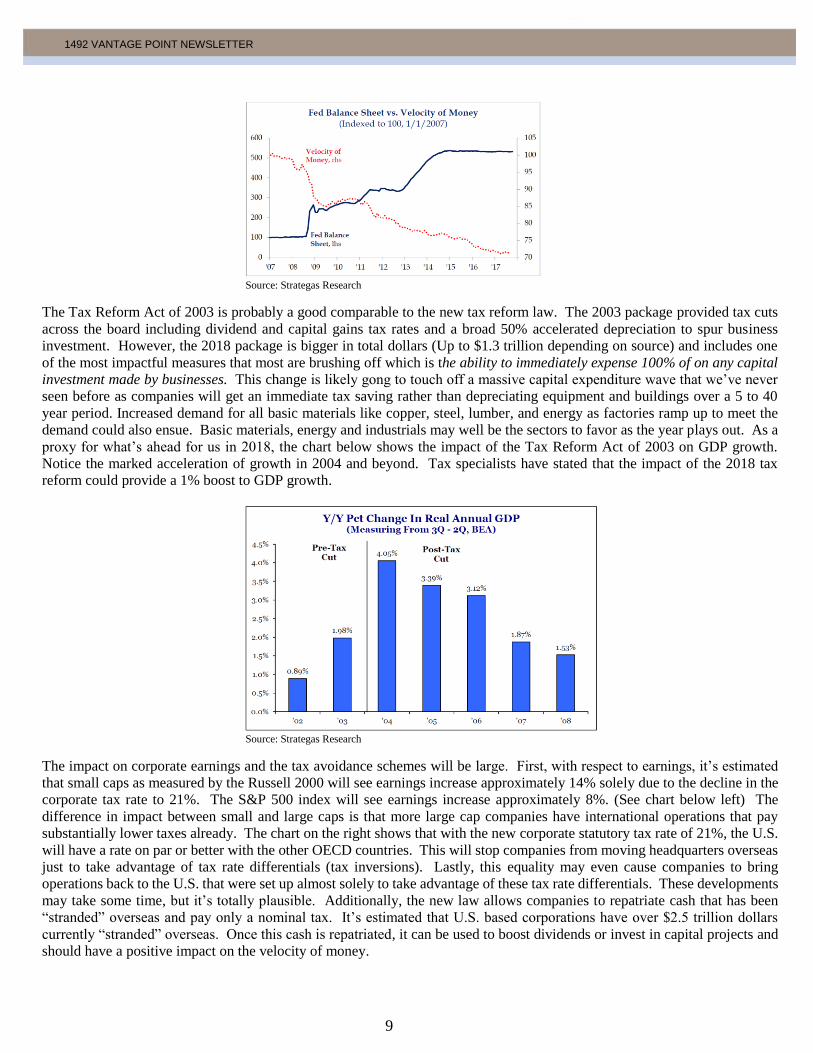
Since the Great Recession, stimulus programs implemented by governments around the world have excelled in providing a
short term backstop but with little follow through. They included the American Recovery and Reinvestment Act of 2009,
“Cash for Clunkers”, food stamps, extension of unemployment insurance benefits, Quantitative Easing 1,2 and 3, TARP,
TALF, etc. You get the picture. Most of these were giveaways with little long-term impact. Yes, they increased asset values,
namely the stock and bond markets but did little to increase the velocity of money. This impact can be seen graphically in the
chart below which shows that the Fed Balance sheet has ballooned since 2009 (blue line), particularly as Quantitative Easing
programs were deployed. However, the velocity of money (red line) has slowed precipitously and indicate that these actions
have caused people to hold money rather than increase spending or investment which would increase the velocity of money.
The AT&T example above is what will make the trajectory of the red line below inflect positively over time and why we think
that this reform is a much bigger deal than how it’s being portrayed currently.
9
1492 VANTAGE POINT NEWSLETTER
Source: Strategas Research
The Tax Reform Act of 2003 is probably a good comparable to the new tax reform law. The 2003 package provided tax cuts
across the board including dividend and capital gains tax rates and a broad 50% accelerated depreciation to spur business
investment. However, the 2018 package is bigger in total dollars (Up to $1.3 trillion depending on source) and includes one
of the most impactful measures that most are brushing off which is the ability to immediately expense 100% of on any capital
investment made by businesses. This change is likely gong to touch off a massive capital expenditure wave that we’ve never
seen before as companies will get an immediate tax saving rather than depreciating equipment and buildings over a 5 to 40
year period. Increased demand for all basic materials like copper, steel, lumber, and energy as factories ramp up to meet the
demand could also ensue. Basic materials, energy and industrials may well be the sectors to favor as the year plays out. As a
proxy for what’s ahead for us in 2018, the chart below shows the impact of the Tax Reform Act of 2003 on GDP growth.
Notice the marked acceleration of growth in 2004 and beyond. Tax specialists have stated that the impact of the 2018 tax
reform could provide a 1% boost to GDP growth.
Source: Strategas Research
The impact on corporate earnings and the tax avoidance schemes will be large. First, with respect to earnings, it’s estimated
that small caps as measured by the Russell 2000 will see earnings increase approximately 14% solely due to the decline in the
corporate tax rate to 21%. The S&P 500 index will see earnings increase approximately 8%. (See chart below left) The
difference in impact between small and large caps is that more large cap companies have international operations that pay
substantially lower taxes already. The chart on the right shows that with the new corporate statutory tax rate of 21%, the U.S.
will have a rate on par or better with the other OECD countries. This will stop companies from moving headquarters overseas
just to take advantage of tax rate differentials (tax inversions). Lastly, this equality may even cause companies to bring
operations back to the U.S. that were set up almost solely to take advantage of these tax rate differentials. These developments
may take some time, but it’s totally plausible. Additionally, the new law allows companies to repatriate cash that has been
“stranded” overseas and pay only a nominal tax. It’s estimated that U.S. based corporations have over $2.5 trillion dollars
currently “stranded” overseas. Once this cash is repatriated, it can be used to boost dividends or invest in capital projects and
should have a positive impact on the velocity of money.

10
1492 VANTAGE POINT NEWSLETTER
Source: Strategas Research
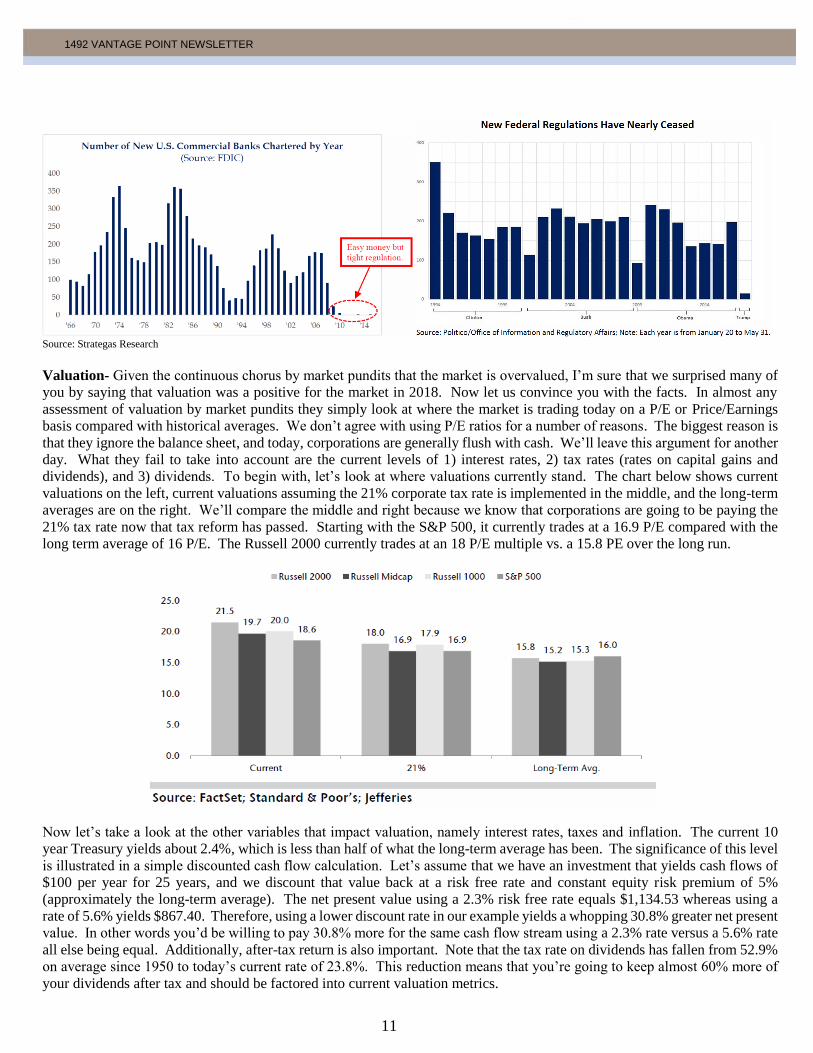
Deregulation- A year ago we wrote about the burden of increasing regulations on the U.S. economy that has been going on
for decades. There is a clear correlation between the regulatory burden, economic growth, and the increased cost of compliance.
The 40% increase in regulations that came to pass under the Obama administration is a major factor that prevented the U.S.
economy from growing greater than 3% annually since the recession in 2008. Below left is a chart that shows the number of
“economically significant” regulations enacted by year under each President. An economically significant regulation is one
that is estimated to cost more than $100 million annually to comply. On the right is a chart that shows the cost of implementing
the regulations on the economy. These totals in the graph are not cumulative but annual amounts to the economy. However,
the effect should be viewed on a cumulative basis. The way to think about this trend is that the average cost of new regulations
in the Obama years was $109 billion per year or a cumulative total of $872 billion over his eight years as President.
The impact to the economy can be seen in dollar terms, but they can also be viewed in terms of new business formations and
jobs. The chart below left is a chart that shows the number of new banks that were chartered by year since 1966. Following
the recession of 2008, new bank growth collapsed (some may say that’s a positive) due to the regulatory burden that was placed
on banks over the next several years. Based on our discussions with many of the banks that we own in our portfolios,
compliance cost has risen over five-fold since 2008. Clearly the regulatory burden placed on a new bank is prohibitive and
potentially stifling to the economy. The chart on the right shows that under the Trump administration, there has been a dramatic
pullback in the number of new regulations. On top of this decrease, he has already repealed 459 regulations through October
2017 according to the Washington Post. While the economic impact is hard to quantify, the rate of change from any regulatory
relief will yield positive results as productivity may accelerate and the cost (both compliance and enforcement) will drop.
11
1492 VANTAGE POINT NEWSLETTER
Source: Strategas Research
Valuation- Given the continuous chorus by market pundits that the market is overvalued, I’m sure that we surprised many of
you by saying that valuation was a positive for the market in 2018. Now let us convince you with the facts. In almost any
assessment of valuation by market pundits they simply look at where the market is trading today on a P/E or Price/Earnings
basis compared with historical averages. We don’t agree with using P/E ratios for a number of reasons. The biggest reason is
that they ignore the balance sheet, and today, corporations are generally flush with cash. We’ll leave this argument for another
day. What they fail to take into account are the current levels of 1) interest rates, 2) tax rates (rates on capital gains and
dividends), and 3) dividends. To begin with, let’s look at where valuations currently stand. The chart below shows current
valuations on the left, current valuations assuming the 21% corporate tax rate is implemented in the middle, and the long-term
averages are on the right. We’ll compare the middle and right because we know that corporations are going to be paying the
21% tax rate now that tax reform has passed. Starting with the S&P 500, it currently trades at a 16.9 P/E compared with the
long term average of 16 P/E. The Russell 2000 currently trades at an 18 P/E multiple vs. a 15.8 PE over the long run.
Now let’s take a look at the other variables that impact valuation, namely interest rates, taxes and inflation. The current 10
year Treasury yields about 2.4%, which is less than half of what the long-term average has been. The significance of this level
is illustrated in a simple discounted cash flow calculation. Let’s assume that we have an investment that yields cash flows of
$100 per year for 25 years, and we discount that value back at a risk free rate and constant equity risk premium of 5%
(approximately the long-term average). The net present value using a 2.3% risk free rate equals $1,134.53 whereas using a
rate of 5.6% yields $867.40. Therefore, using a lower discount rate in our example yields a whopping 30.8% greater net present
value. In other words you’d be willing to pay 30.8% more for the same cash flow stream using a 2.3% rate versus a 5.6% rate
all else being equal. Additionally, after-tax return is also important. Note that the tax rate on dividends has fallen from 52.9%
on average since 1950 to today’s current rate of 23.8%. This reduction means that you’re going to keep almost 60% more of
your dividends after tax and should be factored into current valuation metrics.

12
1492 VANTAGE POINT NEWSLETTER
Source: Strategas Research
Many pundits compare today’s stock market valuations to the internet bubble days of 2000. However, the chart below easily
pokes holes in that argument. The two slides show valuation of the largest 50 stocks in the S&P 500 today versus those in
March 2000 in the pane on the right. The P/E ratios are substantially different (19.7 vs. 31), and there are fewer outliers in
today’s market.
Source: Strategas Research
Lastly, the market is willing to pay a higher valuation depending upon where inflation and interest rates are as illustrated in the
two charts below. The chart on the left shows that when inflation is running between 0% and 4%, the market is willing to pay
the highest valuations on average. Today’s inflation rate is hovering right around 2%, which puts it right in the sweet spot for
maximum valuation. The chart on the right shows that the market has historically traded at a higher P/E multiple as long as
rates aren’t too high and the multiple actually has historically increased as long as rates don’t go too far above 5%. Today the
ten year is well below 5% of course, but if we had to place a bet today, we’d bet rates are going higher as the year progresses.

13
1492 VANTAGE POINT NEWSLETTER
Source: Strategas Research
Lastly, corporations are getting more efficient in operating their businesses as the chart below shows. More free
cash flow per dollar of sales is being generated since 2009 than durign the period prior to 2008. These efficiencis
also argues for higher valuations as this excess cash is available to buy back stock or pay dividends.
Synchronized Global Growth- We mentioned this growth briefly in the section above, but it bears repeating as it is a powerful
driver that we last saw in 2003. Couple this synchronization with the other positive drivers of GDP growth mentioned above,
and we could very well have one of the best years of growth in quite some time. The chart below shows the level of PMI
(Purchasing Managers Index) for each major country around the world. The real question is can they go much higher?

14
1492 VANTAGE POINT NEWSLETTER
The Negatives for 2018
Elections Again- It seems like we just got done with an election cycle, but in ten months we’ll be right back at the circus. This
mid-term election period has generally caused the market a bit of indigestion in prior cycles, and we wouldn’t expect this cycle
to be any different with the polarized views of the nation and media. The only thing that we should remember is to not trust
the polls. See our “Market Trivia” section below for some interesting election year market trivia.
Consensus has Embraced the Bull- From our vantage point, it appears to us that many of the naysayers of a year ago have
jumped on board the bull train. While we don’t have any charts to support this claim, our daily reading of analyst and economist
reports seems to reflect an incrementally more positive slant.
Stimulus Hangover- 2018 is the first year since the great recession where we don’t have an incremental stimulus program in
the pipeline. In fact, it may be the first year that we see a net decline in stimulus across the U.S, Europe, and Japan.
Unquestionably the new tax reform law and low interest rates from the quantitative easing programs of prior years will continue
to lend an accommodative hand to the economy in 2018, but for a stock market that always wants more, sooner, it may be a
disappointment. In addition, the U.S. Fed has signaled at least three rate hikes during 2018 if all goes as planned, and the ECB
has too signaled their intention to take their foot off the quantitative easing gas pedal. The chart below left shows the significant
growth in assets on the three major central banks balance sheets as a function of their respective quantitative easing programs.
It is almost a 5-fold increase since 2007. Note that the ongoing escalation since 2015 has occurred all the while the Federal
Reserve has remained flat since that time. The chart on the right shows the planned unwind of the U.S. Fed’s balance sheet.
Theoretically, as the unwind takes place, interest rates should rise as more supply hits the market.
Source: Strategas Research Source: Cornerstone Macro
Bringing it all back to small caps
While we’re not in the business of making predictions, we always present some directional views on where we think the market
will trend over the next year. Similar to last year, this year is probably more difficult to predict than most given the strong
returns posted in 2017, a mid-term election, and central banks tightening around the globe. However, at the end of the day,
markets are most influenced by earnings and we have a hard time coming up with a bad outcome given all the positive
developments highlighted above like tax reform, regulatory reform, confidence, and oil. Many of the things that have been
supportive to the economy will remain in place like historically low interest rates, low unemployment, and accelerating wages.
The environment should remain supportive of M&A activity given the low relative valuations of stocks that we highlighted
above. Small cap valuations relative to large caps remain below the long-term median level and are supportive of
outperformance. However, the wild cards are Trump, foreign relations, and global stimulus. Therefore, our prediction, in
contrast to last year, is that the market will likely be strong over the first half of the year and then pause as mid-term elections
play out and the market starts to look forward to 2019 earnings growth. It will calibrate if corporations will be able to tack on
much earnings growth to what should be a very robust earnings year in 2018. The bottom line is that there is still a relative
valuation gap for small caps and with earnings growth potentially greater than 15% (due to tax cuts and the energy sector no
longer dragging down earnings), we wouldn’t be surprised to see an advance of 5-10% by year’s end.

15
1492 VANTAGE POINT NEWSLETTER
Thematic Investing: Industrial Automation-The Next Super Cycle
What is a Super Cycle and why does it matter? A super cycle is a period of high global growth that lasts a generation or more,
and has growing trade, high rates of investment, urbanization and technology innovation. A report published by Standard
Chartered identifies three super cycles in history. The first was from 1870 to 1913 where global growth averaged 2.7% annually
and the U.S. became the world’s largest economy. The second cycle started at the close of WWII and continued through the
early 70’s until high inflation choked it off. Growth averaged 5% during this cycle, and Japan was a big winner capturing 10%
of the world economy. It is believed that the third cycle began in 2000. Despite the Great Recession, the total global economy
has grown from $32 trillion to over $78 trillion.
The U.S. is still the world’s largest economy at $19.4 trillion and is roughly the same size as the entire European Union and
65% larger than China in second place. In fact it has been the growth in China which has been and will continue to be the key
driver in the global economic expansion. In addition to China, we believe there is another key sub-theme at play within this
cycle. It is the industrial automation of manufacturing, specifically here in the U.S.
Capital spending took a downturn in late 2014 when the price of oil dropped precipitously and caused a recession in most
industrial related stocks through 2016. However beginning in 2017, on the heels of anticipated tax reform and a more business
friendly regulatory environment, companies started to invest money in capital equipment and modernizing factories. Increased
use of robotics and machine learning in factory automation have been enabled by better low cost sensing technology and the
proliferation of the internet of things (IOT).
The internet of things is a key driver behind lowering costs for factory automation. In addition, high performance processors,
sensors, analytic software, vision systems and wireless communication protocols are all key enablers of adoption.
Another key change is the adoption of open architecture systems where multi-vendor systems are interoperable. Gone are the
days where there is one behemoth stack of hardware and software that is dedicated to one vendor. The technology curve is
developing too fast for companies to commit all resources to one dedicated system that might become obsolete within a year
or two. This effect is also forcing vendors to modularize their technology where it can be easily inserted in the manufacturing
process with the least amount of disruption.
The rapid rise of IOT is also having an impact on edge devices. These edge devices operate away from the central processing
center and are located in what are called intelligent nodes. This distributed architecture allows for faster and more efficient
processing of information. As an example, sample or batch testing of production runs was the norm in the past. In-line or
continuous testing of manufacturing quality was too expensive and slowed down the production line. However, with demand
from customers for tighter tolerances, factories are now implementing more in-line, continuous testing which has been enabled
by faster, cheaper sensors that are being used in these intelligent nodes.
Smart sensors that have embedded software, not reliant on a central system, will proliferate the manufacturing process. The
software programs embedded in the sensors are more simple and elegant and, therefore, highly reliable. However, once again
due to IOT, these smart sensors are able to communicate with the central processing system to alert or self-correct on a real-
time basis.
Lastly, collaborative robots are becoming more affordable. The culmination of better software along with artificial intelligence
(machine-learning) and sensor technology is making the George Jetson fantasy of yesteryear a reality today. As we know, the
key to widespread adoption of any technology is price point. The rapid decline in robotics pricing to under $40,000 is opening
up the door for wide spread adoption for both industrial and personal use. A recent publication of Electrical Trends forecasts
that north of 30 million robots will be sold for personal use between 2016 and 2019, globally.
Wide spread rollout of machine learning, robotics and factory automation will not proceed without a hitch or two. However
as we address this key investment trend with our portfolio companies, our goal is to find out what stage management teams are
at on this topic. We believe that there is a window of opportunity over the next couple of years for early adopters to gain
market share. Production costs can be lowered significantly at a higher quality output. As we exited 2017, we’ve already
begun positioning the portfolios with companies that we believe are well positioned to take advantage of this long-term
investment trend, and we’ll be looking to add positions throughout the year.

16
1492 VANTAGE POINT NEWSLETTER
Thematic Investing: Bitcoin is All the Rage, but Blockchain Technology is Where the Action is. If you haven’t heard of Bitcoin and a slew of other cryptocurrencies, then you’ve probably been living under a rock. It’s been
all the rage in the latter of half of 2017 as the value of a Bitcoin surged over +1,300% in 2017. A number of other digital
currencies have also surged like Ripple, Bitcoin Cash, and Ethereum. While we still have a hard time understanding the
valuation of any digital currency that is basically created out of thin air and that can have wild moves day-to-day, the concept
of a digital currency does have merit. For example, transactions can be made globally between two parties without having to
exchange currencies. They also avoid the toll takers in the middle (i.e. banks) for the most part, but there are still some fees
associated with transacting in cryptocurrencies charged by the “miners” who do all of the processing of the transactions and
confirm that they’re valid. The sheer amount of electricity used by the “miners” computers to process these transactions is
mind-boggling. According to Canaccord Genuity, bitcoin mining is estimated to require 36 TWh/year, which would make it
the 57th largest energy consuming country, just behind New Zealand and Peru. However, there are still a number of drawbacks,
particularly for Bitcoin, which prevent it from being a truly transactional currency versus just a store of value similar to gold.
For example, currently it takes 66 minutes on average to have a transaction approved and the cost per transaction currently
averages $14.63. Clearly these figures are not ready for primetime kind of numbers.
Some of what’s going on in this cryptocurrency world wreaks of the internet bubble days of 1999 and 2000. We’re already
seeing companies change their names to take advantage of the bitcoin and blockchain hype similar to when companies added
the dotcom to their name in 1999. The most egregious so far is the unprofitable Long Island Iced Tea Corp. whose stock soared
289% after they changed the name of their company to Long Blockchain Corp. Simply crazy!! There’s a bit of the “greater
fool” theory in that each one of these currencies doesn’t have an easily ascertainable value or any value for that matter unless
someone who you want to sell it to or transact with says it does. The pure attraction is that they aren’t controlled by any
governmental entity (yet), and transactions can occur relatively anonymously. This feature sounds like a haven for criminals
and drug kingpins. Acceptance of these digital coins is clearly accelerating but there are many drawbacks as mentioned above,
particularly for Bitcoin which holds about 36% share of the cryptocurrency market today. Also, regulators haven’t intervened
yet, but we expect them to as there have been over 1,300 Initial Coin Offerings (ICO’s) completed in 2017. ICO’s are
essentially like an initial public offering (IPO) that doesn’t have to be approved by the SEC. We can’t imagine this trend goes
on for much longer as there are already stories that have surfaced where the ICO was a complete scam.
However, what is an investable thesis is the underlying blockchain technology upon which these cryptocurrencies were
developed. Blockchain is a more efficient way of verifying transactions. The term is often used interchangeably with the
terms distributed or decentralized ledger. This ledger system helps to spread the computing power needed for verification of
transactions across multiple nodes in the network. The decentralized approach allows nodes along the network to make
independent processing decisions without considering decisions of other nodes. All of these independent nodes then work
together to form a consensus which helps with the integrity of the database. The advantages of blockchain are that it improves
market transparency, security and efficiency, and everything can be transferred digitally. The structure of the blockchain
makes fraud and hacking almost impossible. The possibilities are nearly limitless in terms of where this technology can add
value from financial, insurance, and stock market transactions to voting systems and healthcare. Anything that would benefit
from more security and tamper resistance would be plausible opportunities for blockchain technology. While there are no true
pure plays in the public markets for blockchain technology yet, we’re certainly scouring the landscape looking for companies
who are using the technology to improve their cost structure and competitive positioning as a result. We’ll keep you posted
on this exciting area for future investment.
2018 Outlook: A Picture is Worth a Thousand Words
Above we articulated our 2018 outlook and the key issues and drivers for the stock market. However, we believe that there
are other topics that we haven’t spent a great deal of time on that deserve some mention. In order to provide you with a shorter
read, as everyone’s time is valuable, we decided to express it in pictures. As they say, a picture is worth a thousand words,
and we’ll let you interpret what we view as some compelling charts. We’ll provide a bullet point or two of explanation as to
why we think the chart or graphic is important.
17
1492 VANTAGE POINT NEWSLETTER
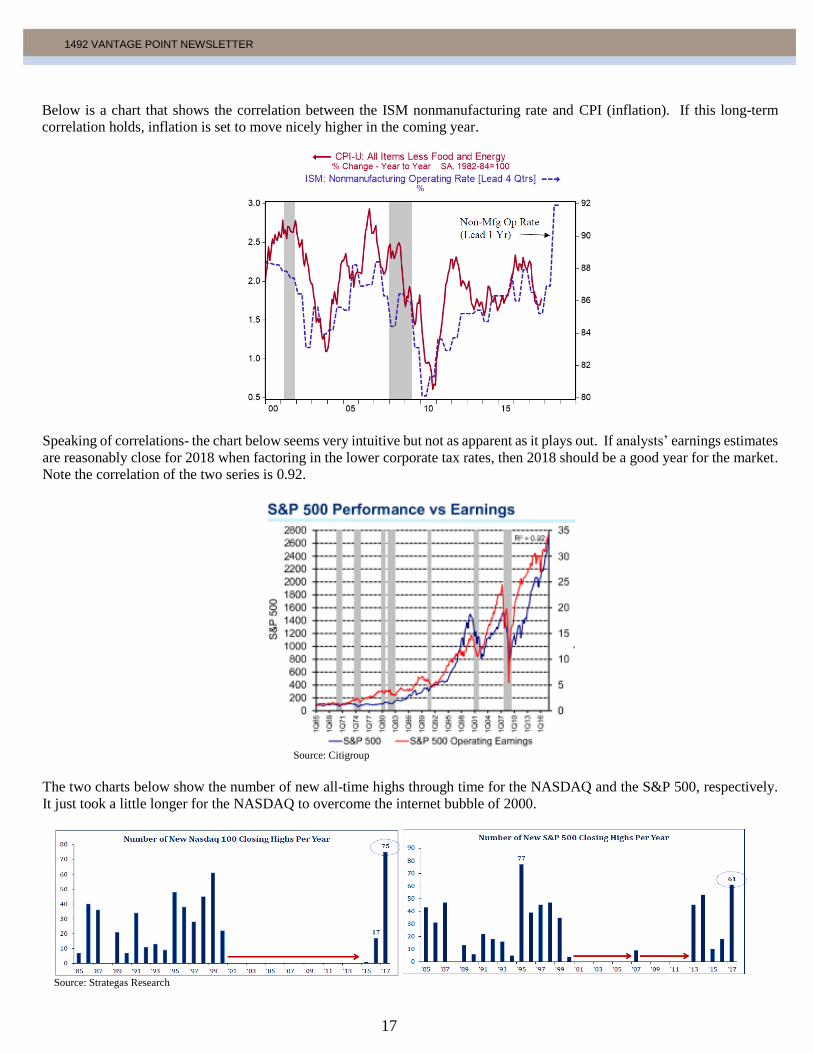
Below is a chart that shows the correlation between the ISM nonmanufacturing rate and CPI (inflation). If this long-term
correlation holds, inflation is set to move nicely higher in the coming year.
Speaking of correlations- the chart below seems very intuitive but not as apparent as it plays out. If analysts’ earnings estimates
are reasonably close for 2018 when factoring in the lower corporate tax rates, then 2018 should be a good year for the market.
Note the correlation of the two series is 0.92.
Source: Citigroup
The two charts below show the number of new all-time highs through time for the NASDAQ and the S&P 500, respectively.
It just took a little longer for the NASDAQ to overcome the internet bubble of 2000.
Source: Strategas Research

18
1492 VANTAGE POINT NEWSLETTER
Small businesses are feeling really good. Note the spike with the election of Trump and now the follow through with the
execution of the tax reform package.
Passive investing has been all the rage of late. If the pace of new ETF creations continues for a few more years there will be
more ETF’s than individual stocks.
Source: Strategas Research
Consumer confidence continues to build and is highly correlated with the new housing starts. Confidence will have to continue
to stay elevated to get housing starts back to their normal level.

19
1492 VANTAGE POINT NEWSLETTER
Market Trivia
Each quarter we offer a piece of market trivia that we believe is interesting or timely, or both. Earlier in the newsletter we
mentioned that mid-term elections could be a risk for the stock market. Below is a chart that shows that the average stock
market correction is -18% during years of mid-term elections. This correction is typically followed by a nice rebound in the
subsequent year as political uncertainty dies down for another two years.
Source: Strategas Research
If the Democrats take over Congress while we have a Republican President, we have the worst of all possible combinations
from a stock market performance standpoint. The best combination is the status quo as you can see by the chart below. 2017’s
performance validated these trends.

20
1492 VANTAGE POINT NEWSLETTER
Source: Strategas Research
We hope that you found our fourth quarter 2017 and 2018 outlook newsletter insightful and interesting. Should you have any
questions about anything discussed herein or would like more information about 1492 Capital Management, please call us at
414-276-1492.
Joe Frohna Rodney Hathaway Adam France Nancy Frohna Tim Stracka
Important Disclosures:
(1) The minimum criteria for inclusion in Best Money Managers: Performance must be calculated "net” of all fees and
brokerage commissions. This means after all fees have been deducted. This standard is somewhat controversial, as the SEC
requires that only "net” of fees numbers be presented publicly, while GIPS (Global Investment Performance Standards) prefers
that "gross” numbers be presented along with a fee schedule. Since the SEC is a regulatory authority, and since complete fee
schedule presentation would be impractical in this "ranking" format, we require "net” numbers. Performance must be
calculated inclusive of all cash reserves. To explain, any given investment portfolio will hold some level of cash over a
particular reporting period. Even equity portfolios which specifically seek to be fully invested in the market at all times will
temporarily have dividend payments and other ordinary cash flows which cannot instantaneously be invested in the market.
These cash holdings obviously will have an effect on the performance of the overall portfolio – negative when cash returns
are low relative to returns of the asset class, and positive if the opposite is true. While presentation of "equity-only” (for
example) returns may provide a valuable insight into the security selection skills of the manager, we require for comparability's
sake that performance results be inclusive of cash reserves for consideration in the rankings. Performance results must be
calculated in U.S. dollars, that is, from the perspective of a U.S.-based investor. Currency holdings can have a very significant
impact on the performance of a portfolio with international holdings. While this will always be the case (as we do not make
distinctions between hedged and unhedged portfolios), we require that performance must be translated into U.S. dollars to
ensure comparability to the point where these are all returns that would be seen by a U.S.-based investor. Performance results
must be calculated on an asset base which is at least $10 million in size for "traditional” U.S. asset classes (equity, fixed
income, and balanced accounts) or at least $1 million in the case of international and "alternative” U.S. asset classes. This
minimum ensures that the firm and product are somewhat established. The goal is to not taint the rankings with "flashes in

21
1492 VANTAGE POINT NEWSLETTER
the pan” while also not excluding promising emerging managers. The minimum asset base requirement, therefore, is set at a
level which balances these objectives. The classification of the product must fall into one of the categories which we rank.
We only publish rankings for categories/time period combinations for which we have at least 20 contenders.
Comments and opinions expressed in this document regarding individual securities, markets, strategies and case studies are
not recommendations or predictions, and thus should not be acted upon. They are based only upon the judgments and opinions
of 1492’s professional staff. The use of any investment strategy does not guarantee that an investment return will be achieved,
or that a loss will not occur from the advice provided. Past performance does not guarantee future results. No investment
firm, including 1492 Capital Management, guarantees gains or that losses will not occur from the strategies applied to
managed portfolios. You are encouraged to contact us with your questions.
1492 Capital Management, LLC
309 North Water Street
Suite 505
Milwaukee, WI 53202
Main: 414-276-1492
Fax: 414-224-9158
www.1492CapitalManagement.com