Embed Size (px)
Citation preview
Presenter
Regor Saulsberry
Date
June 25, 2015
14th International Symposium on
Nondestructive Characterization of Materials
Composite Overwrapped Pressure Vessel
(COPV) Liner and Thin Wall Metallic
Pressure Vessel Inspection Scanner
Development and Assessment
Regor Saulsberry
William Prosser
June 25, 2015: 12:35
1
Presenter
Regor Saulsberry
Date
June 25, 2015Presentation Overview
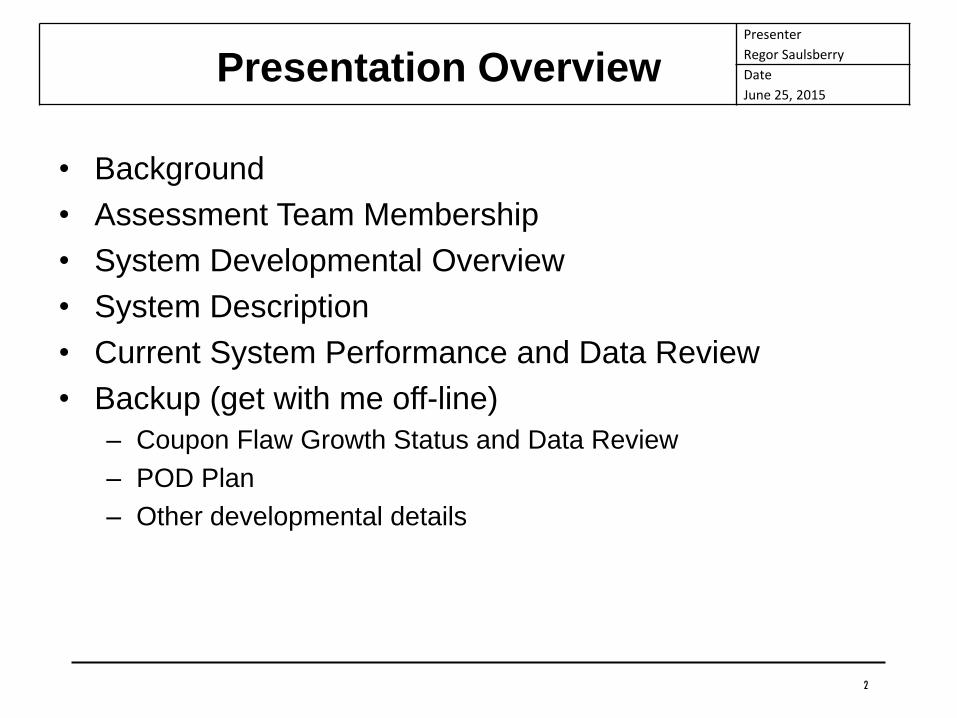
• Background
• Assessment Team Membership
• System Developmental Overview
• System Description
• Current System Performance and Data Review
• Backup (get with me off-line)
– Coupon Flaw Growth Status and Data Review
– POD Plan
– Other developmental details
2
Presenter
Regor Saulsberry
Date
June 25, 2015
• Following a Commercial Launch Vehicle On-Pad COPV
failure, a request was received by the NESC June 14,
2014.
• An assessment was approved July 10, 2014, to develop
and assess the capability of scanning eddy current (EC)
nondestructive evaluation (NDE) methods for mapping
thickness and inspection for flaws.
– Current methods could not identify thickness reduction from
necking and critical flaw detection was not possible with
conventional dye penetrant (PT) methods, so sensitive EC
scanning techniques were needed.
– Developmental methods existed, but had not been fully
developed, nor had the requisite capability assessment (i.e., a
POD study) been performed.
Background
3
Presenter
Regor Saulsberry
Date
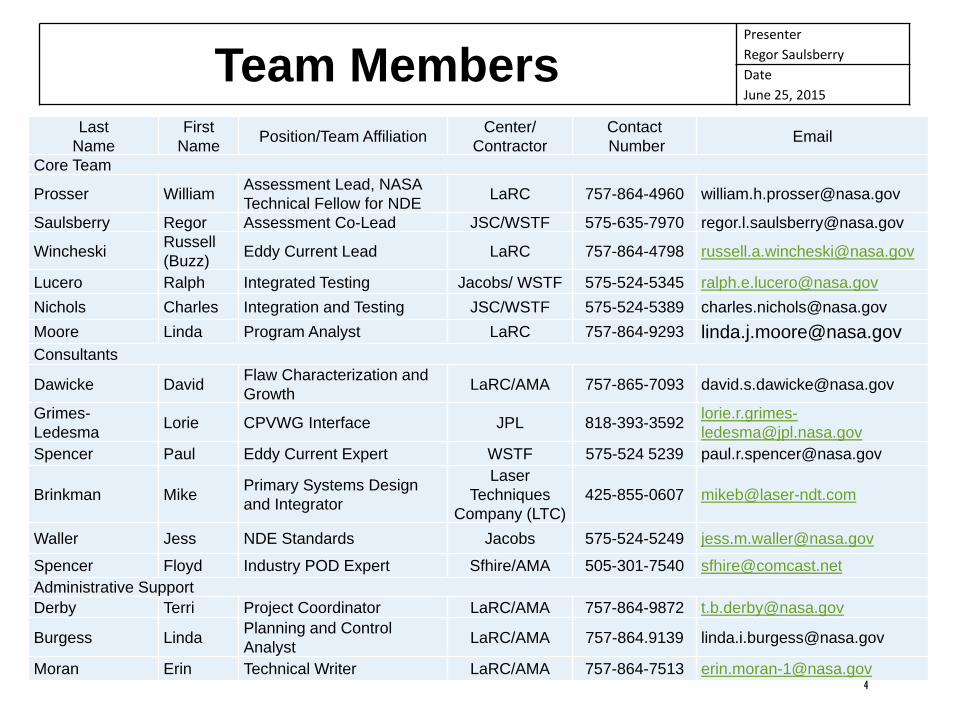
June 25, 2015Team Members
Last
Name
First
NamePosition/Team Affiliation
Center/
Contractor
Contact
NumberEmail
Core Team
Prosser WilliamAssessment Lead, NASA
Technical Fellow for NDELaRC 757-864-4960 [email protected]
Saulsberry Regor Assessment Co-Lead JSC/WSTF 575-635-7970 [email protected]
WincheskiRussell
(Buzz)Eddy Current Lead LaRC 757-864-4798 [email protected]
Lucero Ralph Integrated Testing Jacobs/ WSTF 575-524-5345 [email protected]
Nichols Charles Integration and Testing JSC/WSTF 575-524-5389 [email protected]
Moore Linda Program Analyst LaRC 757-864-9293 [email protected]
Dawicke DavidFlaw Characterization and
GrowthLaRC/AMA 757-865-7093 [email protected]
Grimes-
LedesmaLorie CPVWG Interface JPL 818-393-3592
lorie.r.grimes-
Spencer Paul Eddy Current Expert WSTF 575-524 5239 [email protected]
Brinkman MikePrimary Systems Design
and Integrator
Laser
Techniques
Company (LTC)
425-855-0607 [email protected]
Waller Jess NDE Standards Jacobs 575-524-5249 [email protected]
Spencer Floyd Industry POD Expert Sfhire/AMA 505-301-7540 [email protected]
Administrative Support
Derby Terri Project Coordinator LaRC/AMA 757-864-9872 [email protected]
Burgess LindaPlanning and Control
AnalystLaRC/AMA 757-864.9139 [email protected]
Moran Erin Technical Writer LaRC/AMA 757-864-7513 [email protected]
Presenter
Regor Saulsberry
Date
June 25, 2015
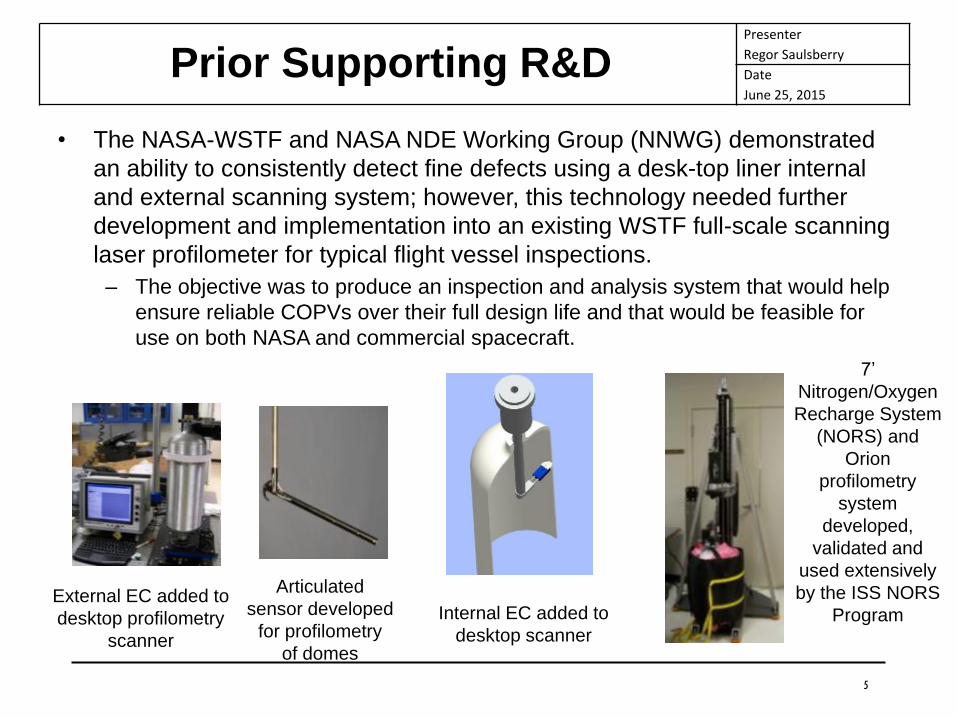
• The NASA-WSTF and NASA NDE Working Group (NNWG) demonstrated
an ability to consistently detect fine defects using a desk-top liner internal
and external scanning system; however, this technology needed further
development and implementation into an existing WSTF full-scale scanning
laser profilometer for typical flight vessel inspections.
– The objective was to produce an inspection and analysis system that would help
ensure reliable COPVs over their full design life and that would be feasible for
use on both NASA and commercial spacecraft.
Prior Supporting R&D
External EC added to
desktop profilometry
scanner
Articulated
sensor developed
for profilometry
of domes
7’
Nitrogen/Oxygen
Recharge System
(NORS) and
Orion
profilometry
system
developed,
validated and
used extensively
by the ISS NORS
ProgramInternal EC added to
desktop scanner
5

Presenter
Regor Saulsberry
Date
June 25, 2015
• Although further refinements are likely, the
modifications are now complete and a true multi-
purpose COPV NDE scanner has resulted.
– New sensors were developed and integrated into
the expanded laser profilometry delivery system.
– This new inspection system is potentially a “game
changer” for production of safer and more reliable
COPVs.
• Can scan COPV liners up to 22-in diameter and
48-in long and internally and externally map
thickness variations, map surfaces, provide Laser
Video™ and detect very fine defects.
• Highly accurate and calibrated internal mapping
allows mechanical response evaluation and
provides high-resolution images of the vessel
interior.
• Allows flaw screening and analysis after wrapping
and autofrettage addressing a long standing
technical concern over potential flaw generation
and liner thinning during this time of plastic
deformation.
System Developmental Overview
ID Vertical Stage
Travel increased
to 72 in
New OD Vertical
Stage 60 in travel
Up to 22-inch dia.
Liner Rotation Stage
6
Presenter
Regor Saulsberry
Date
June 25, 2015
7
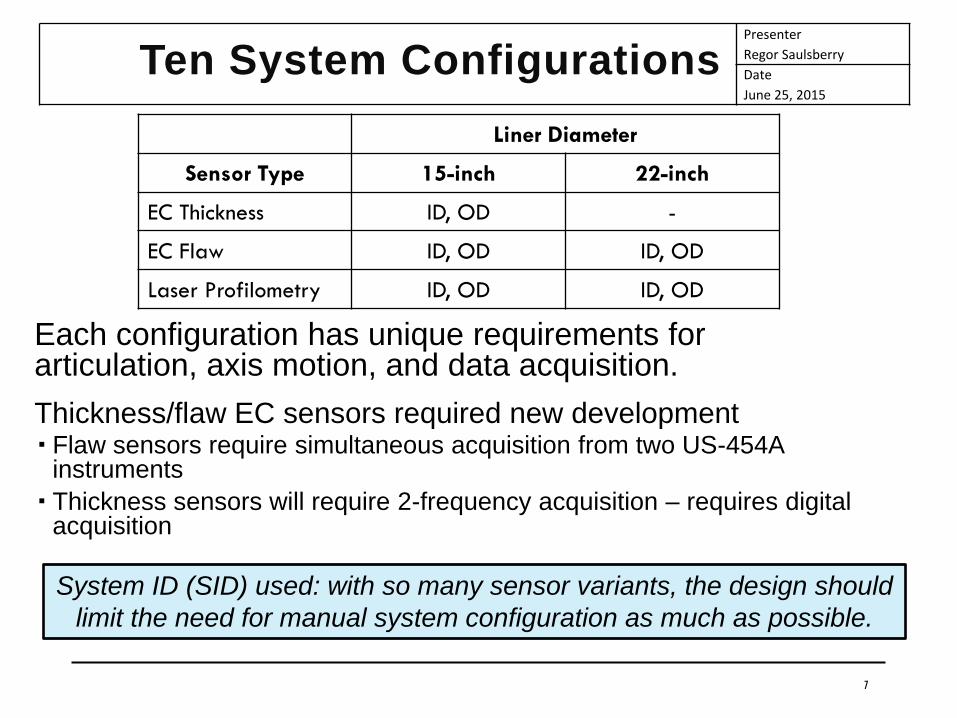
Ten System Configurations
Each configuration has unique requirements for articulation, axis motion, and data acquisition.
Thickness/flaw EC sensors required new development Flaw sensors require simultaneous acquisition from two US-454A
instruments
Thickness sensors will require 2-frequency acquisition – requires digital acquisition
System ID (SID) used: with so many sensor variants, the design should
limit the need for manual system configuration as much as possible.
Liner Diameter
Sensor Type 15-inch 22-inch
EC Thickness ID, OD -
EC Flaw ID, OD ID, OD
Laser Profilometry ID, OD ID, OD
Presenter
Regor Saulsberry
Date
June 25, 2015
8
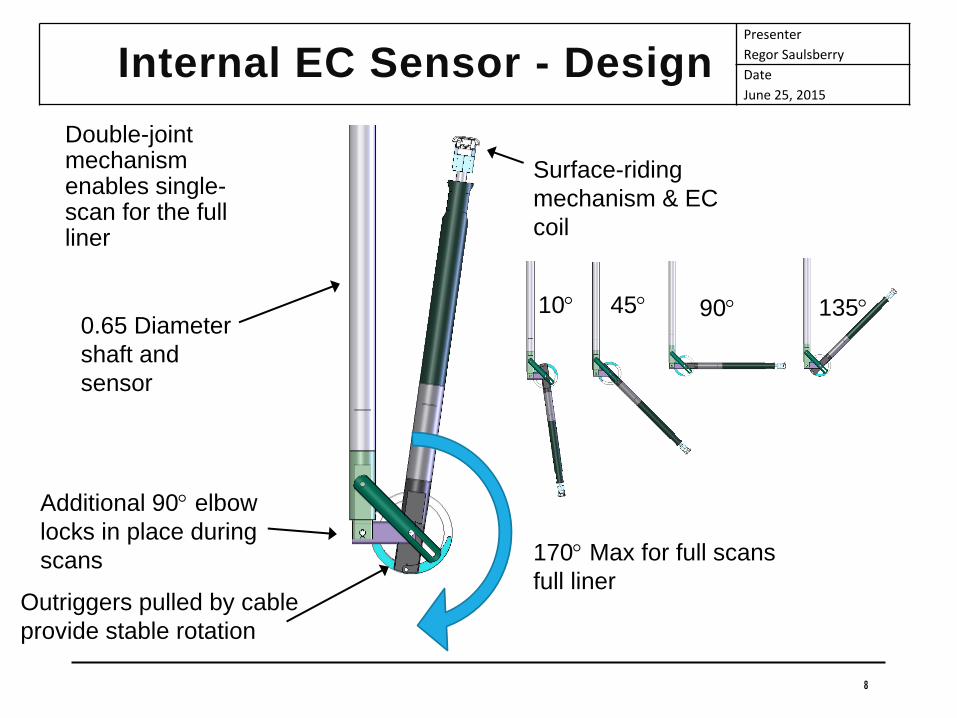
Internal EC Sensor - Design
Double-joint mechanism enables single-scan for the full liner
Additional 90 elbow
locks in place during
scans 170 Max for full scans
full linerOutriggers pulled by cable
provide stable rotation
0.65 Diameter
shaft and
sensor
Surface-riding
mechanism & EC
coil
90 1354510
Presenter
Regor Saulsberry
Date
June 25, 2015
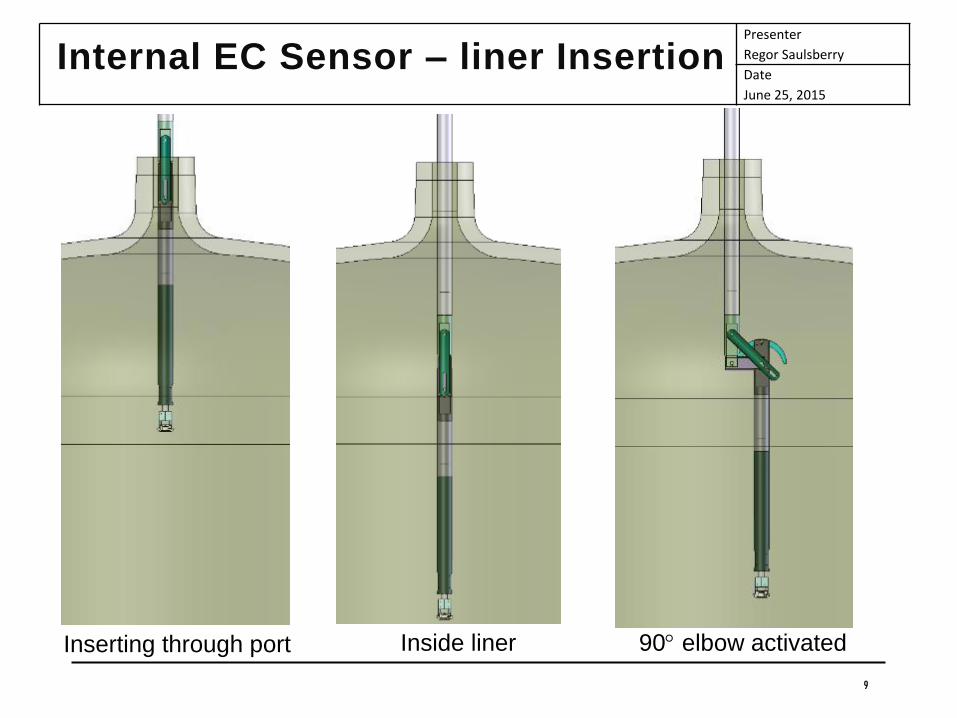
9
Internal EC Sensor – liner Insertion
Inserting through port Inside liner 90 elbow activated
Presenter
Regor Saulsberry
Date
June 25, 2015
10
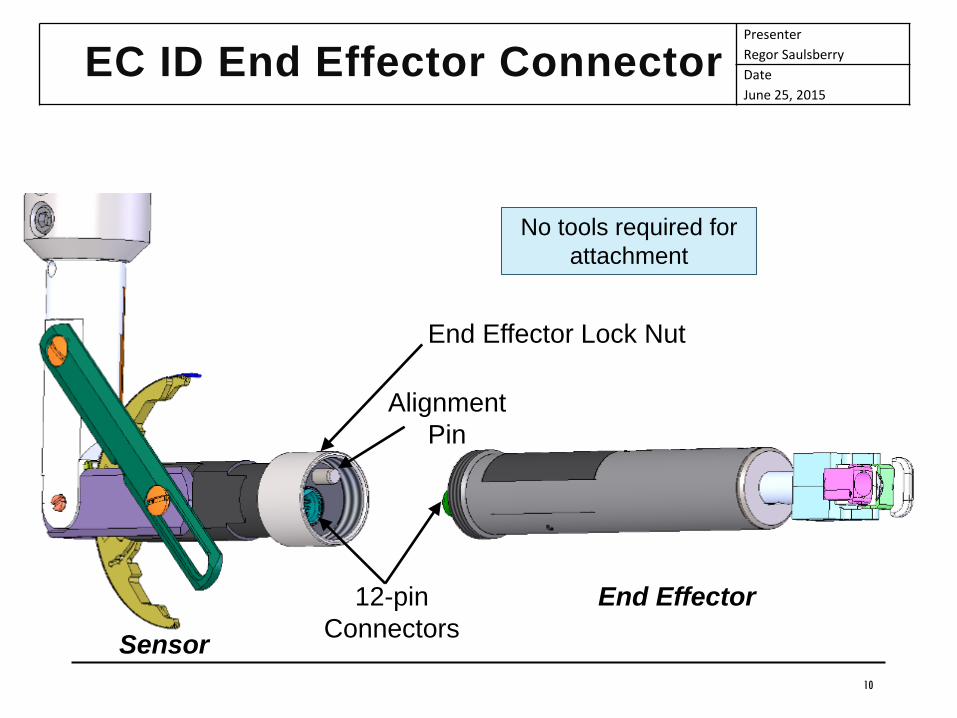
EC ID End Effector Connector
End Effector Lock Nut
End Effector12-pin
Connectors
Alignment
Pin
No tools required for
attachment
Sensor
Presenter
Regor Saulsberry
Date
June 25, 2015
11
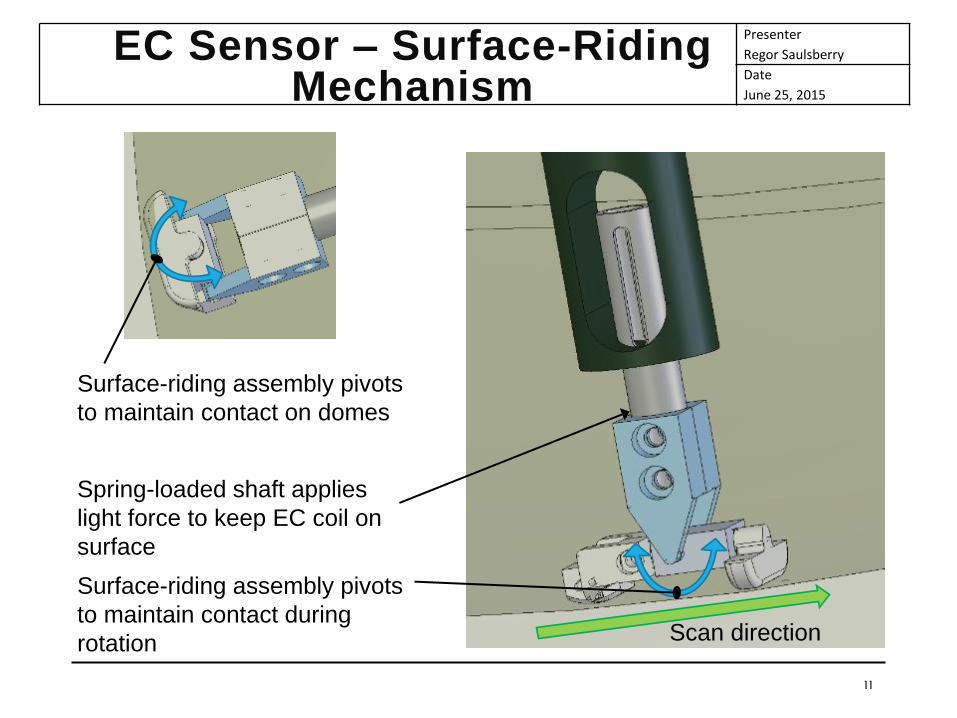
EC Sensor – Surface-Riding Mechanism
Spring-loaded shaft applies
light force to keep EC coil on
surface
Surface-riding assembly pivots
to maintain contact during
rotation Scan direction
Surface-riding assembly pivots
to maintain contact on domes
Presenter
Regor Saulsberry
Date
June 25, 2015
12
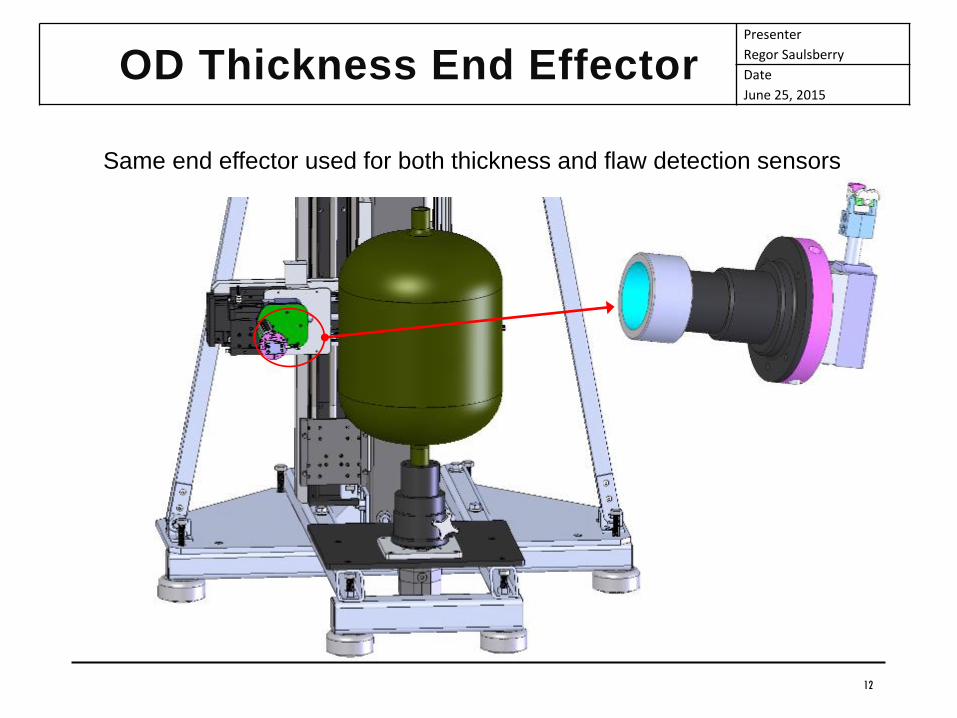
OD Thickness End Effector
Same end effector used for both thickness and flaw detection sensors
Presenter
Regor Saulsberry
Date
June 25, 2015
13
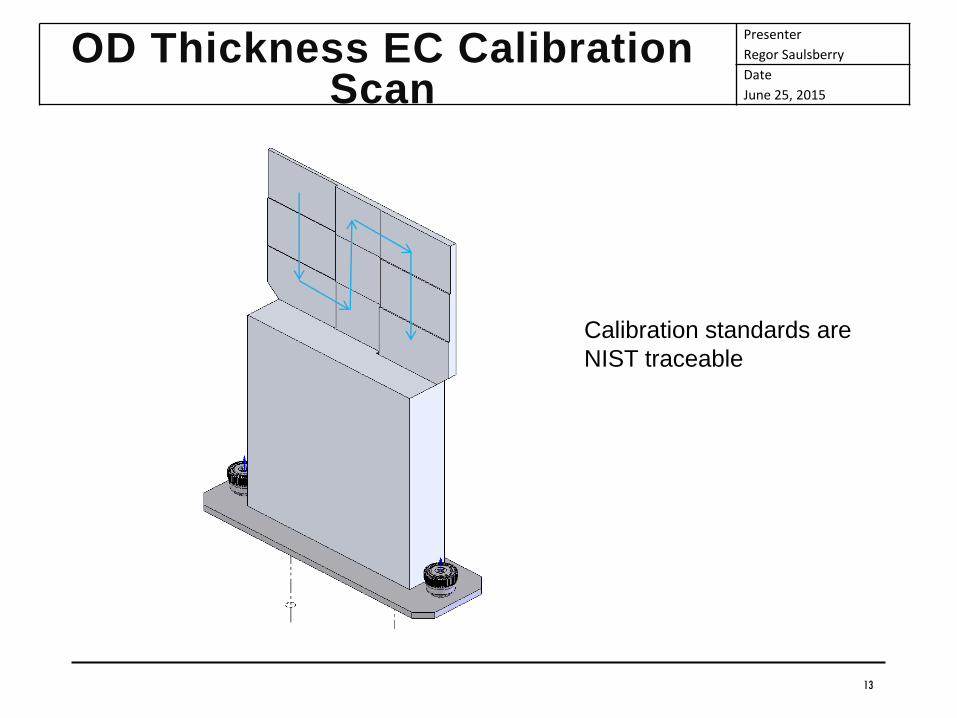
OD Thickness EC Calibration Scan
Calibration standards are
NIST traceable
Presenter
Regor Saulsberry
Date
June 25, 2015
14
Flaw Detection Process
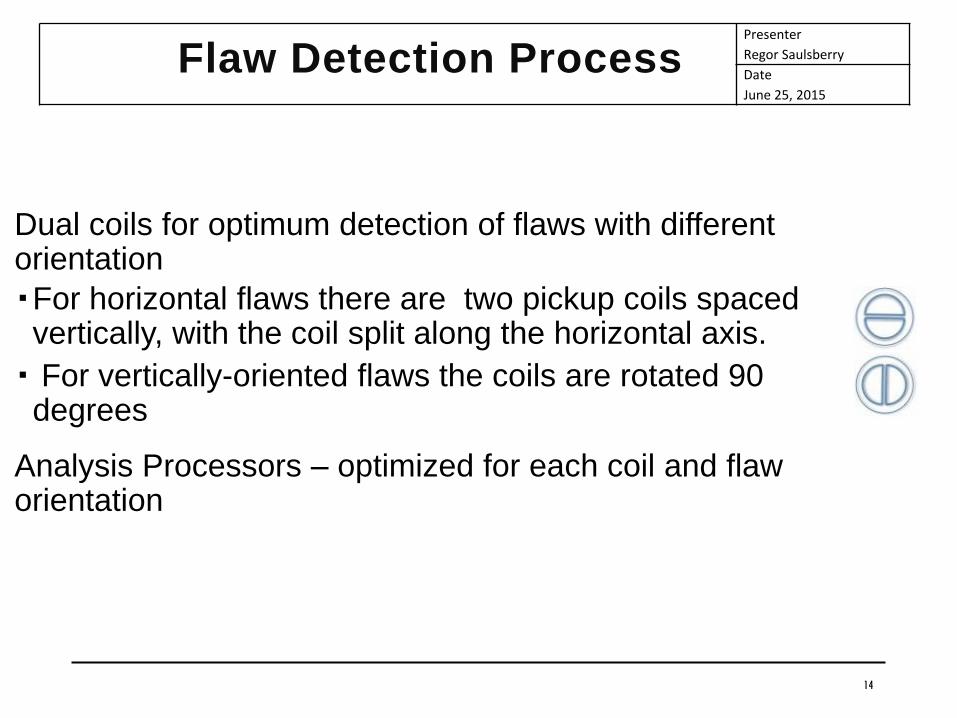
Dual coils for optimum detection of flaws with different orientation
For horizontal flaws there are two pickup coils spaced vertically, with the coil split along the horizontal axis.
For vertically-oriented flaws the coils are rotated 90 degrees
Analysis Processors – optimized for each coil and flaw orientation
Presenter
Regor Saulsberry
Date
June 25, 2015
15
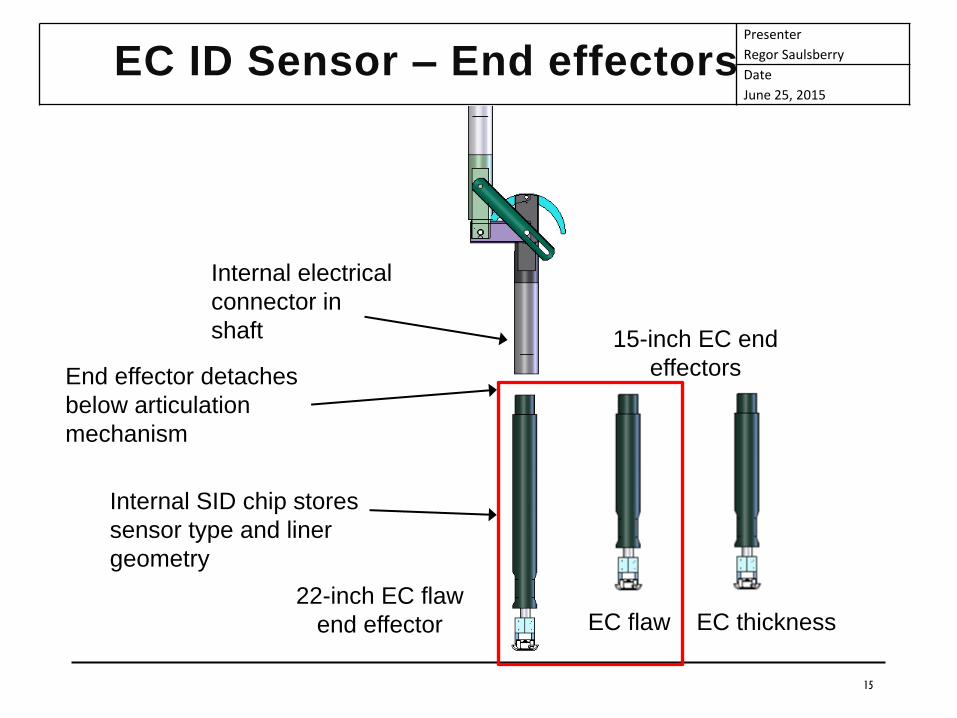
EC ID Sensor – End effectors
End effector detaches
below articulation
mechanism
22-inch EC flaw
end effector
Internal SID chip stores
sensor type and liner
geometry
Internal electrical
connector in
shaft
EC flaw
15-inch EC end
effectors
EC thickness
Presenter
Regor Saulsberry
Date
June 25, 2015Laser Profilometry (LP)
• Scanning of full liner OD and ID to near ports
• NIST traceable data to within 0.003 inch
• Produces high-resolution Laser Video™ Images
16
Presenter
Regor Saulsberry
Date
June 25, 2015
17
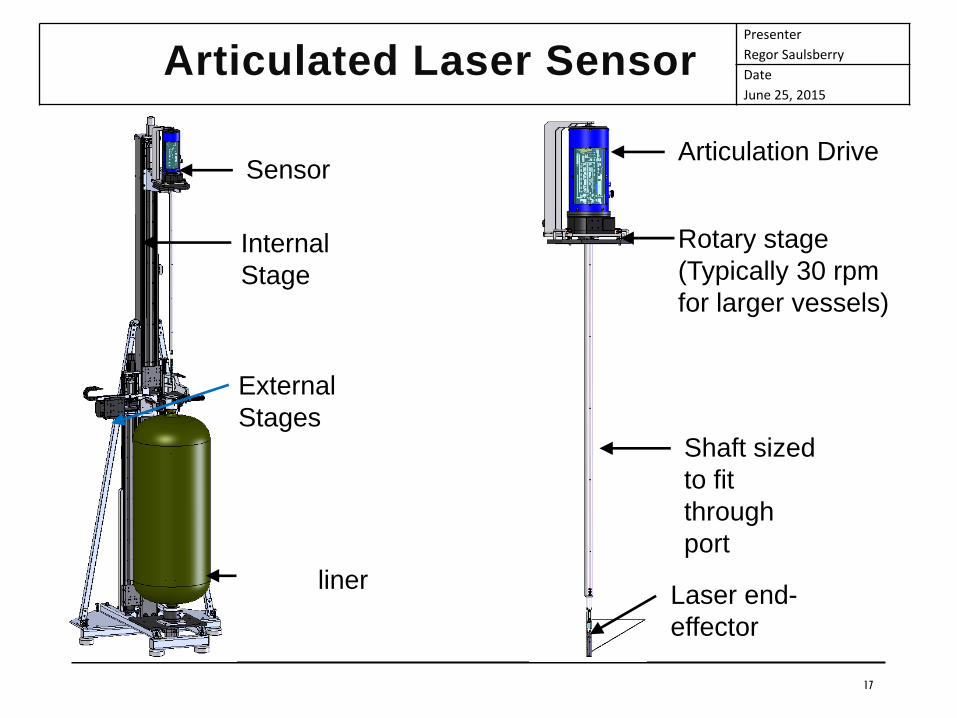
Articulated Laser Sensor
liner
Sensor
Internal
Stage
External
StagesShaft sized
to fit
through
port
Articulation Drive
Rotary stage
(Typically 30 rpm
for larger vessels)
Laser end-
effector
Presenter
Regor Saulsberry
Date
June 25, 2015
18
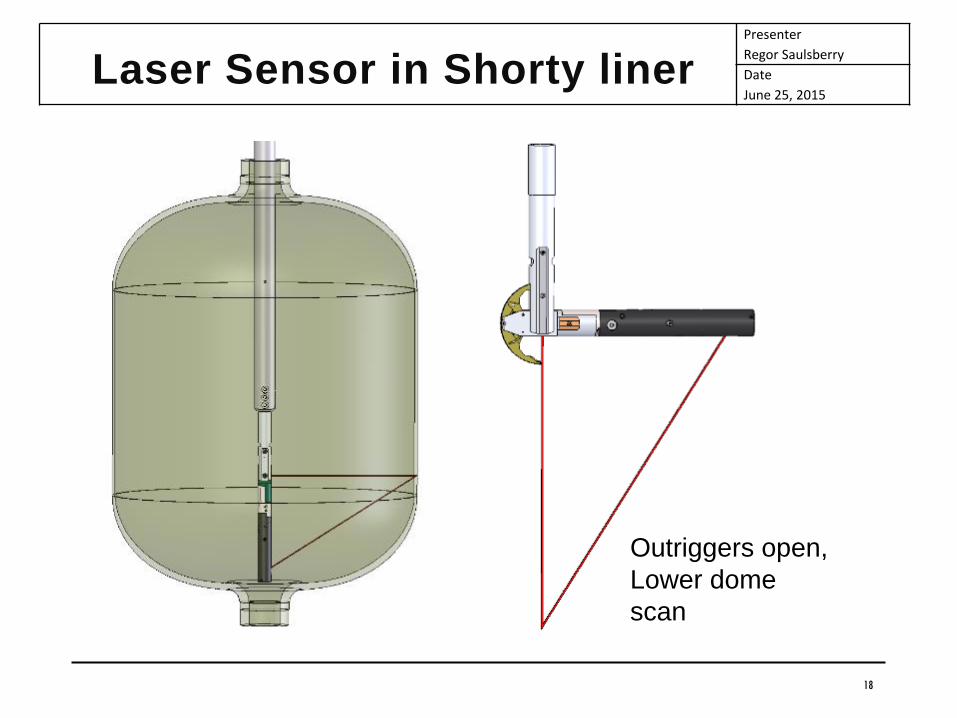
Laser Sensor in Shorty liner
Outriggers open,
Lower dome
scan
Presenter
Regor Saulsberry
Date
June 25, 2015
19
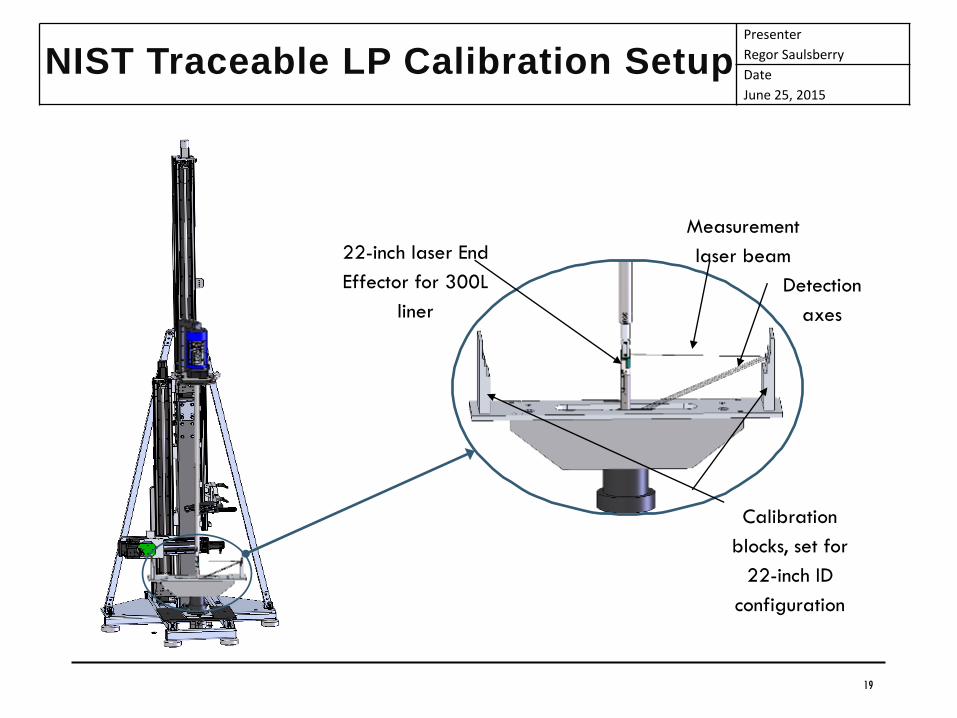
NIST Traceable LP Calibration Setup
22-inch laser End
Effector for 300L
liner
Measurement
laser beam
Detection
axes
Calibration
blocks, set for
22-inch ID
configuration
Presenter
Regor Saulsberry
Date
June 25, 2015
Data Review
1. Example data from the EC Thickness Mapping
Acceptance Test
a. Flaw Detection
b. Laser Profilometry
2. Repeatability test data:
a. Thickness Mapping (after improvements)
• Refinement in technique applied during
repeatability testing
b. Flaw detection
3. Coupon Level Testing
20

Presenter
Regor Saulsberry
Date
June 25, 2015
EC Thickness Mapping
Acceptance Testing
Step Actual (in) Measured (in) Difference (in)
1 0.060 0.0604 0.0004
2 0.070 0.0701 0.0001
3 0.080 0.0802 0.0002
4 0.090 0.0900 0.0000
5 0.100 0.0997 -0.0003
6 0.110 0.1098 -0.0002
7 0.120 0.1198 -0.0002
8 0.140 0.1404 0.0004
9 0.160 0.1658 0.0058
Calibration Tooling MeasurementsOD EC Thickness Sensor - After Auto-cal
21

Presenter
Regor Saulsberry
Date
June 25, 2015
Calibrated Liner Scan – OD EC
EC Thickness Mapping
Acceptance Testing
22

Presenter
Regor Saulsberry
Date
June 25, 2015
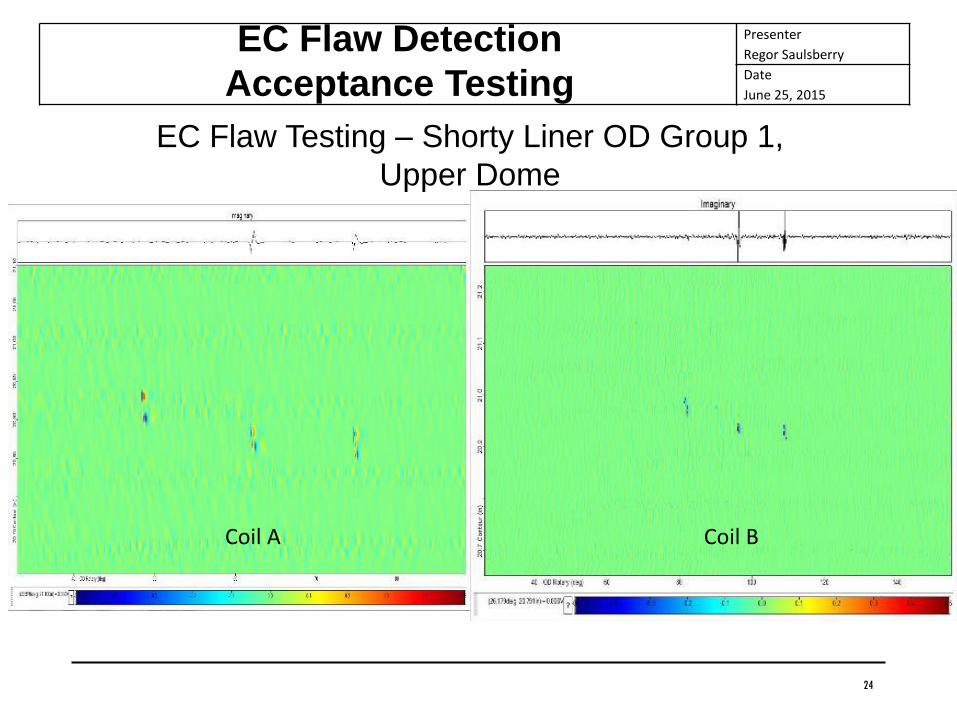
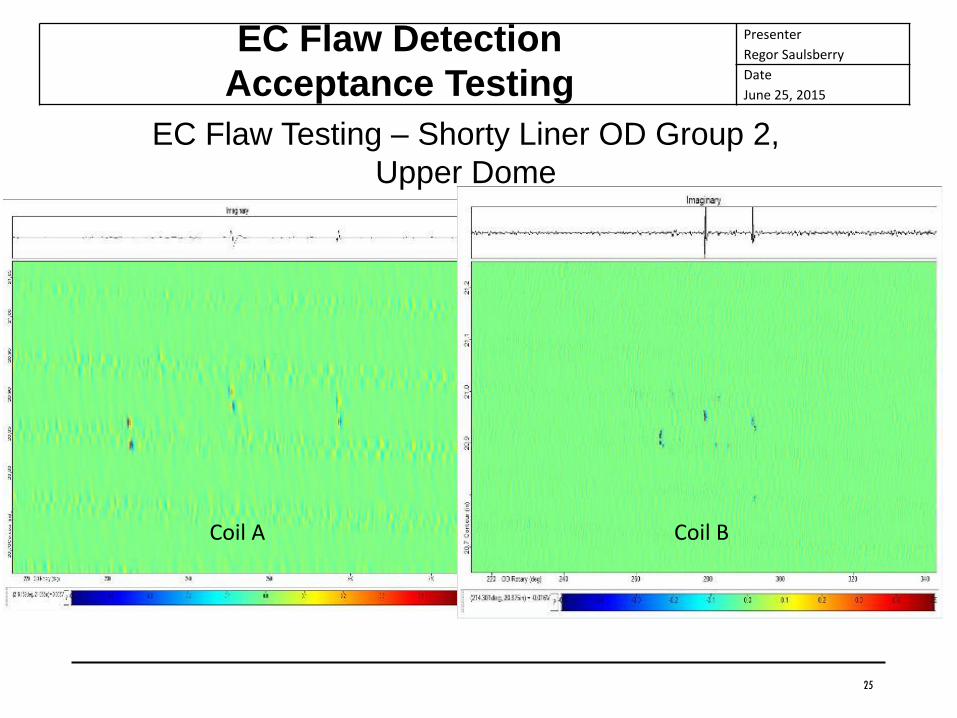
• OD Scans: 15-inch dia. Liner SN 005
• 22-inch dia. 300L pending new flight like liners from a commercial
spaceflight company
• Two groups of 3 flaws on upper dome
• All flaws clearly identified
– Noise filtering and automated flaw detection
EC Flaw Detection
Acceptance Testing
23
Group 1
Notch OrientationActual Notch Dimensions (Measured)
Length Depth Width
Circ 0.016 0.007 0.004
Radial 0.016 0.007 0.003
45deg 0.017 0.007 0.003
Group 2
Notch OrientationActual Notch Dimensions (Measured)
Length Depth Width
Circ 0.016 0.014 0.003
Radial 0.017 0.013 0.003
45deg 0.017 0.013 0.003
Presenter
Regor Saulsberry
Date
June 25, 2015
Coil A Coil B
EC Flaw Detection
Acceptance Testing
EC Flaw Testing – Shorty Liner OD Group 1,
Upper Dome
24
Presenter
Regor Saulsberry
Date
June 25, 2015
Coil A Coil B
EC Flaw Detection
Acceptance Testing
EC Flaw Testing – Shorty Liner OD Group 2,
Upper Dome
25

Presenter
Regor Saulsberry
Date
June 25, 2015
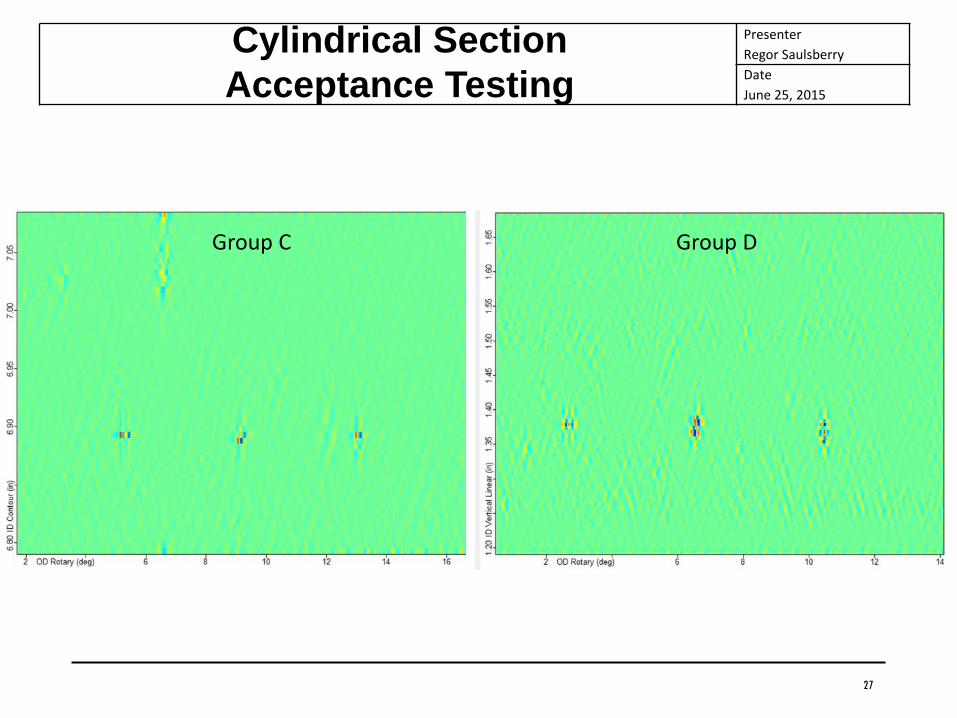
• 4 groups of 3 fine ID Flaws (cylinder and dome):
– Width: 0.0009-0.0011 inch
– Depth: 0.0049-0.0055 inch
– Length: 0.0123-0.0127 inch
• Flaws on cylindrical section were all found; however, noise
was high on domes due to extreme roughness causing
fine flaws not distinguished from noise in that area
– To bound capability in that area, six new flaws 0.030 x 0.020 x
0.003 inch plus 0.049 x 0.021 x 0.003 inch Circumferential, Axial,
and 45 degrees were later added and all were detected all after
application of optimized noise filtering (slides in backup charts)
– Recent data with the automated flaw detection software
successfully identifying all scanned flaws with a signal to noise > 3
and no false positives (in backup).
EC Flaw Detection
Acceptance Testing
26
Presenter
Regor Saulsberry
Date
June 25, 2015
Cylindrical Section
Acceptance Testing
Group C Group D
27
Presenter
Regor Saulsberry
Date
June 25, 2015
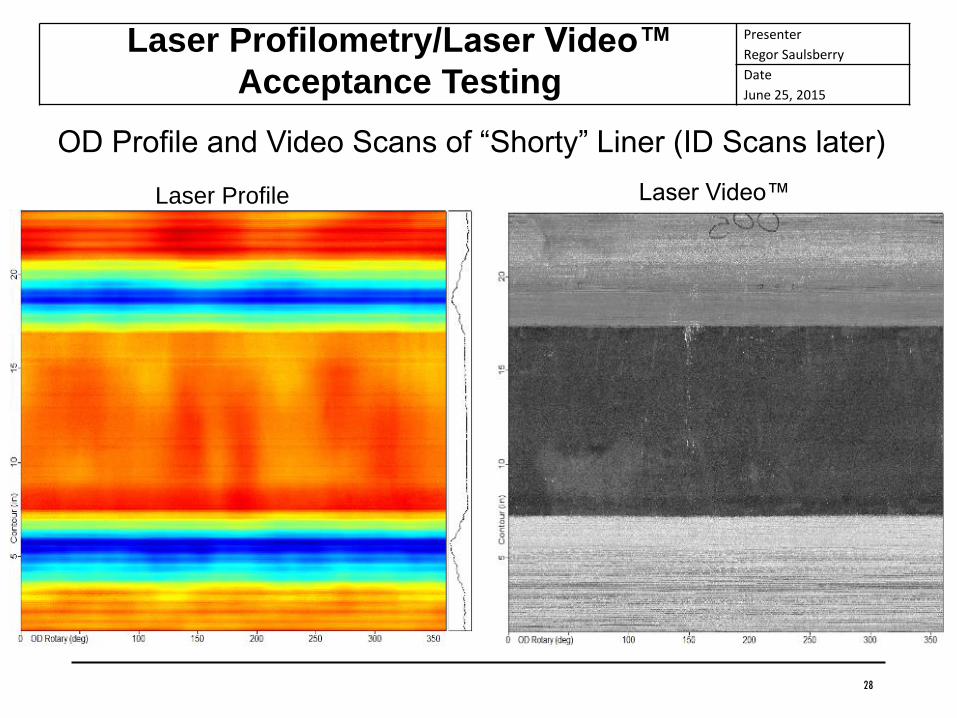
OD Profile and Video Scans of “Shorty” Liner (ID Scans later)
Laser Profilometry/Laser Video™
Acceptance Testing
28
Laser Video™Laser Profile
Presenter
Regor Saulsberry
Date
June 25, 2015
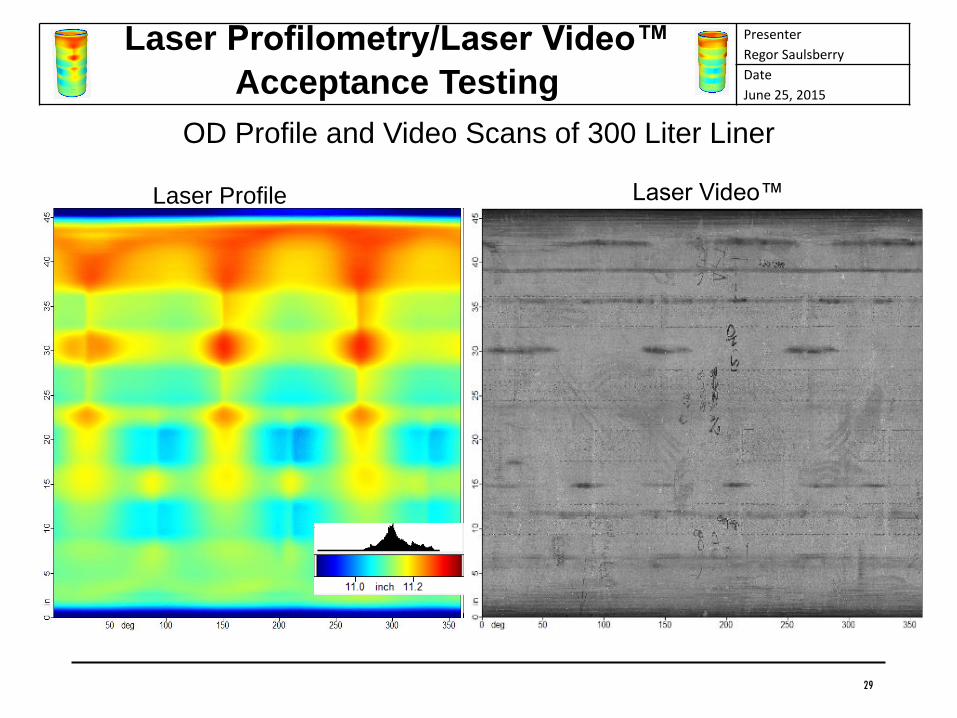
OD Profile and Video Scans of 300 Liter Liner
Laser Profilometry/Laser Video™
Acceptance Testing
29
Laser Profile Laser Video™
Presenter
Regor Saulsberry
Date
June 25, 2015
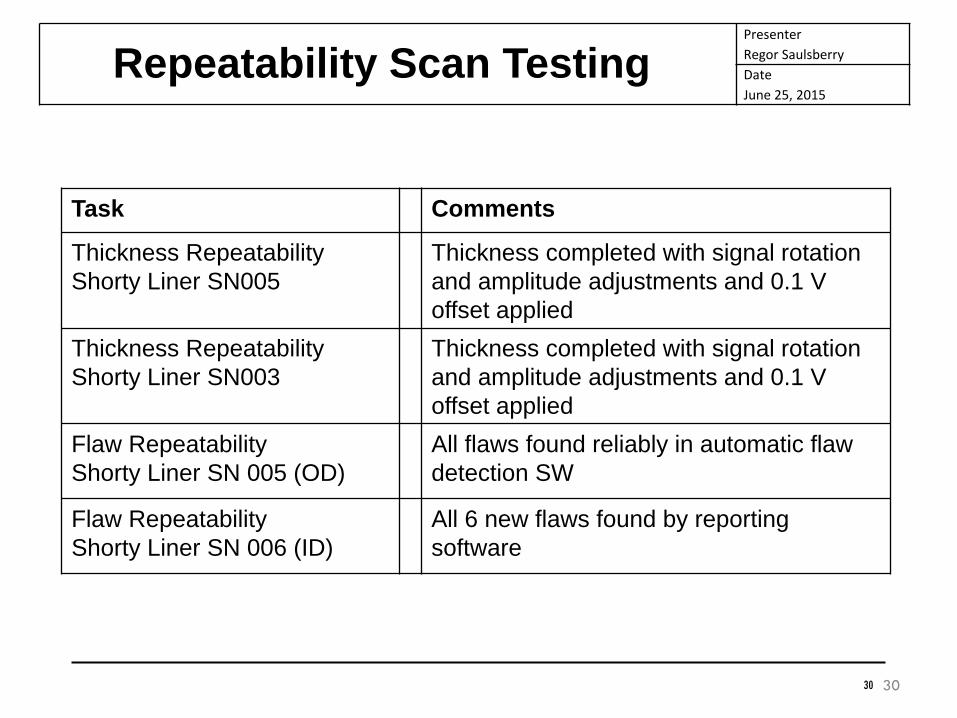
Repeatability Scan Testing
30
Task Comments
Thickness Repeatability
Shorty Liner SN005
Thickness completed with signal rotation
and amplitude adjustments and 0.1 V
offset applied
Thickness Repeatability
Shorty Liner SN003
Thickness completed with signal rotation
and amplitude adjustments and 0.1 V
offset applied
Flaw Repeatability
Shorty Liner SN 005 (OD)
All flaws found reliably in automatic flaw
detection SW
Flaw Repeatability
Shorty Liner SN 006 (ID)
All 6 new flaws found by reporting
software
30
Presenter
Regor Saulsberry
Date
June 25, 2015
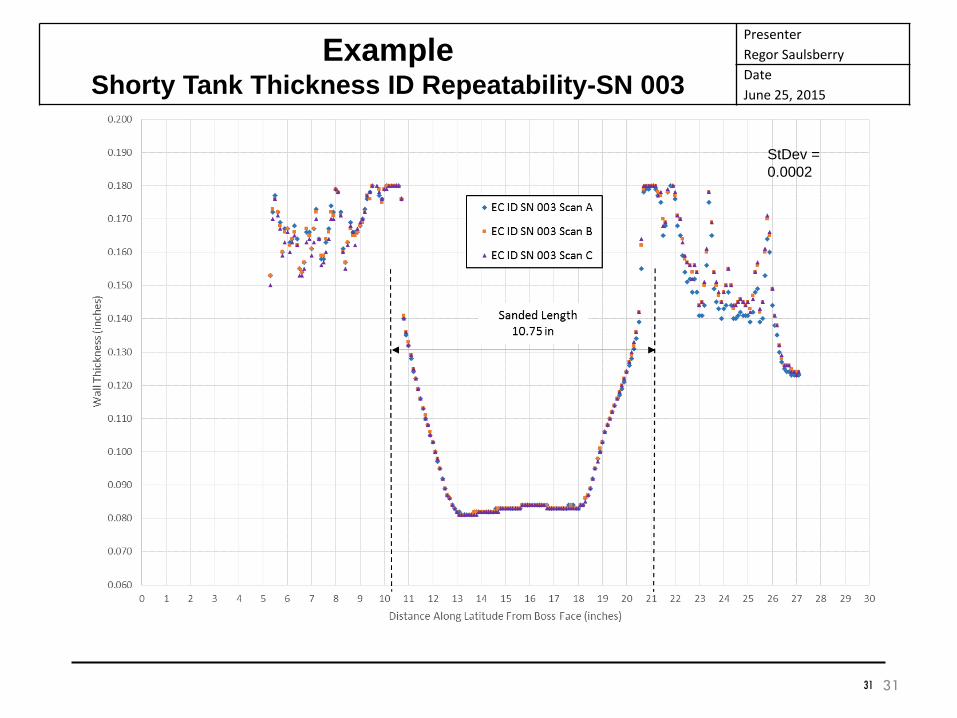
ExampleShorty Tank Thickness ID Repeatability-SN 003
31
StDev =
0.0002
31
Presenter
Regor Saulsberry
Date
June 25, 2015
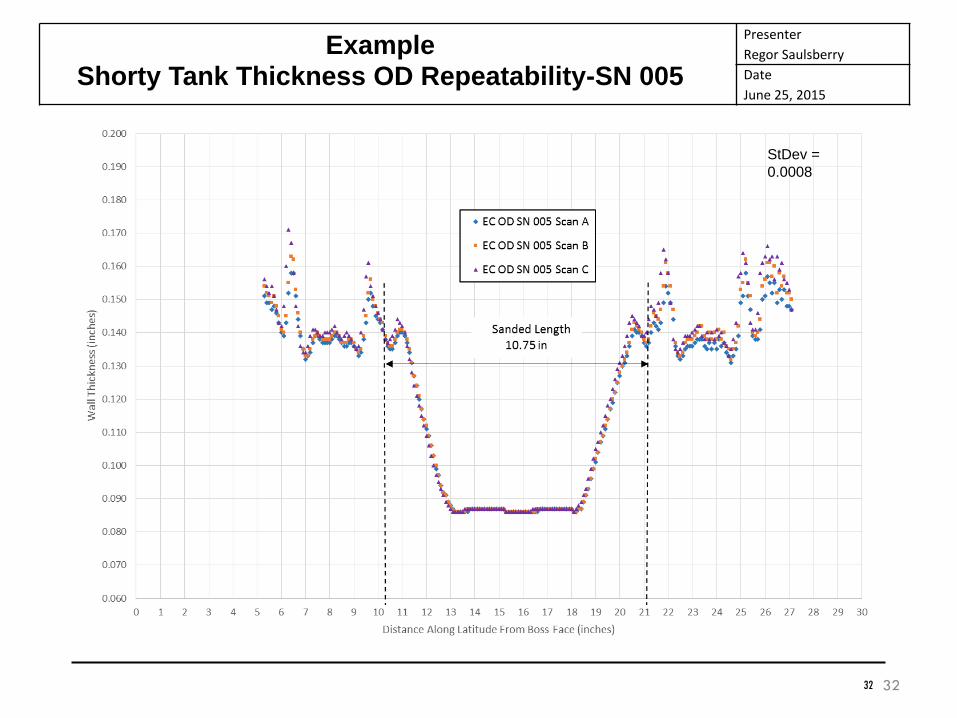
ExampleShorty Tank Thickness OD Repeatability-SN 005
32
StDev =
0.0008
32

Presenter
Regor Saulsberry
Date
June 25, 2015
Shorty Tank Thickness ID Repeatability Cross Section of SN 006 with Machined Grooves
33
StDev =
0.0004
Machined Grooves on
OD
33
Presenter
Regor Saulsberry
Date
June 25, 2015
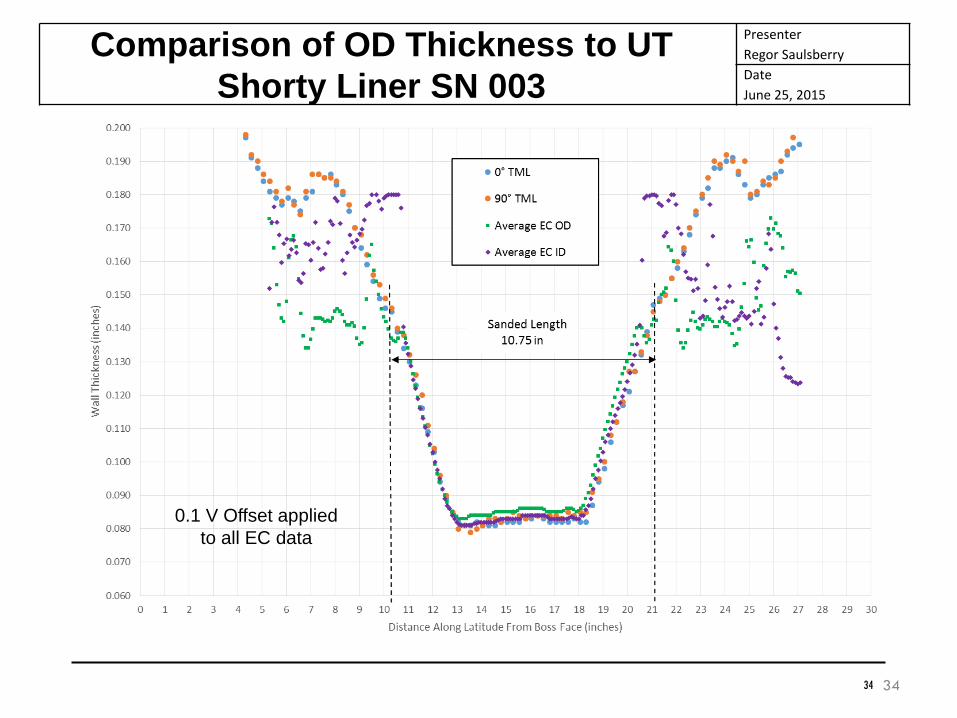
Comparison of OD Thickness to UT
Shorty Liner SN 003
34
0.1 V Offset applied
to all EC data
34
Presenter
Regor Saulsberry
Date
March 25, 2015
Conclusions
• Test System performance and Test Data to date is excellent; however, more comprehensive testing is planned at WSTF to wrap-up Phase I
• A Phase II POD plan has been developed and the coupon testing indicates that the approach is likely feasible
• The balance of the assessment has been scheduled to complete the task and provide a report around the end of 2015
35
Presenter
Regor Saulsberry
Date
June 25, 2015
Backup
36
Presenter
Regor Saulsberry
Date
June 25, 2015
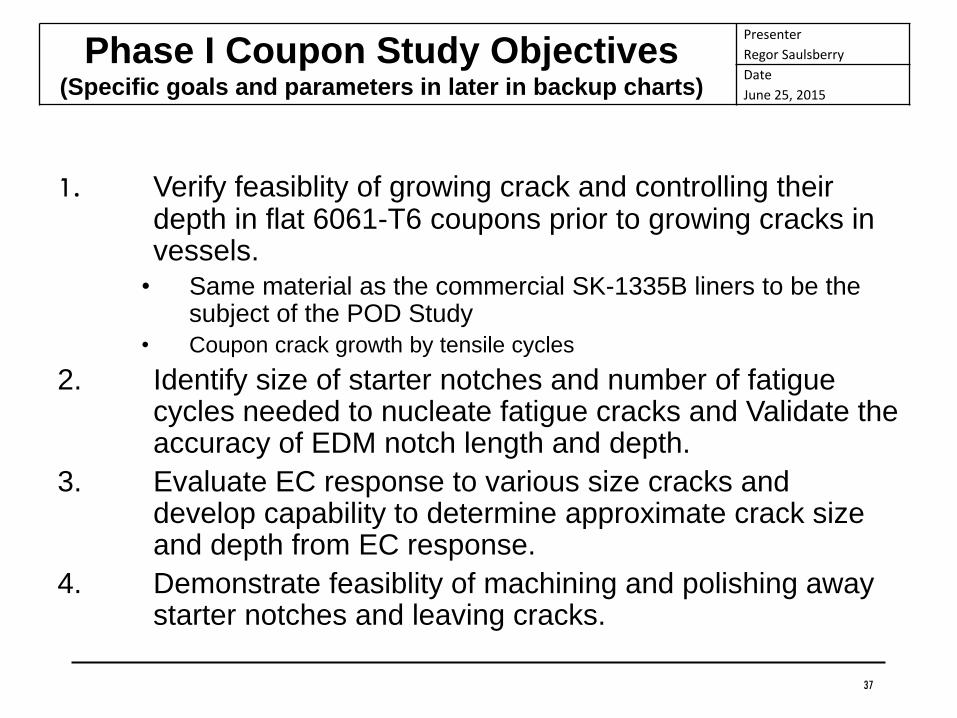
Phase I Coupon Study Objectives(Specific goals and parameters in later in backup charts)
1. Verify feasiblity of growing crack and controlling their depth in flat 6061-T6 coupons prior to growing cracks in vessels.
• Same material as the commercial SK-1335B liners to be the subject of the POD Study
• Coupon crack growth by tensile cycles
2. Identify size of starter notches and number of fatigue cycles needed to nucleate fatigue cracks and Validate the accuracy of EDM notch length and depth.
3. Evaluate EC response to various size cracks and develop capability to determine approximate crack size and depth from EC response.
4. Demonstrate feasiblity of machining and polishing away starter notches and leaving cracks.
37
Presenter
Regor Saulsberry
Date
March 25, 2015
38
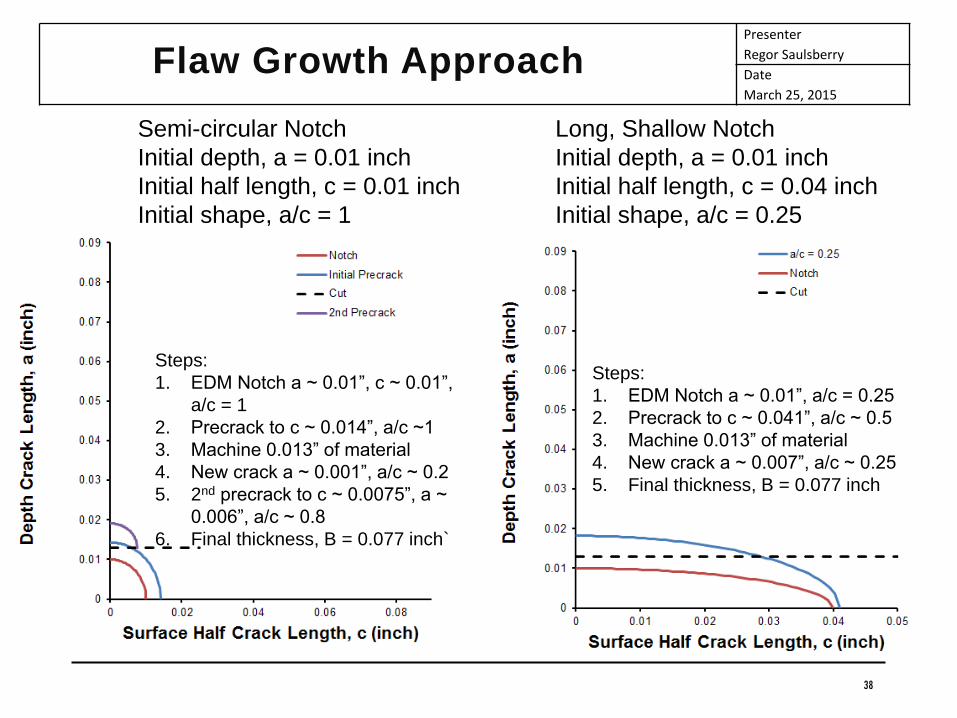
Flaw Growth Approach
Semi-circular Notch
Initial depth, a = 0.01 inch
Initial half length, c = 0.01 inch
Initial shape, a/c = 1
Steps:
1. EDM Notch a ~ 0.01”, c ~ 0.01”,
a/c = 1
2. Precrack to c ~ 0.014”, a/c ~1
3. Machine 0.013” of material
4. New crack a ~ 0.001”, a/c ~ 0.2
5. 2nd precrack to c ~ 0.0075”, a ~
0.006”, a/c ~ 0.8
6. Final thickness, B = 0.077 inch`
Long, Shallow Notch
Initial depth, a = 0.01 inch
Initial half length, c = 0.04 inch
Initial shape, a/c = 0.25
Steps:
1. EDM Notch a ~ 0.01”, a/c = 0.25
2. Precrack to c ~ 0.041”, a/c ~ 0.5
3. Machine 0.013” of material
4. New crack a ~ 0.007”, a/c ~ 0.25
5. Final thickness, B = 0.077 inch

Presenter
Regor Saulsberry
Date
June 25, 2015
39
Cracks from Long Shallow Notches
Crack nucleation required ~ 3,500 cycles
EDM Notch
Fatigue Crack
0.009 inch0.012 inch
0.075 inchEstimate of New
Surface Location
After Machining
Presenter
Regor Saulsberry
Date
June 25, 2015
40
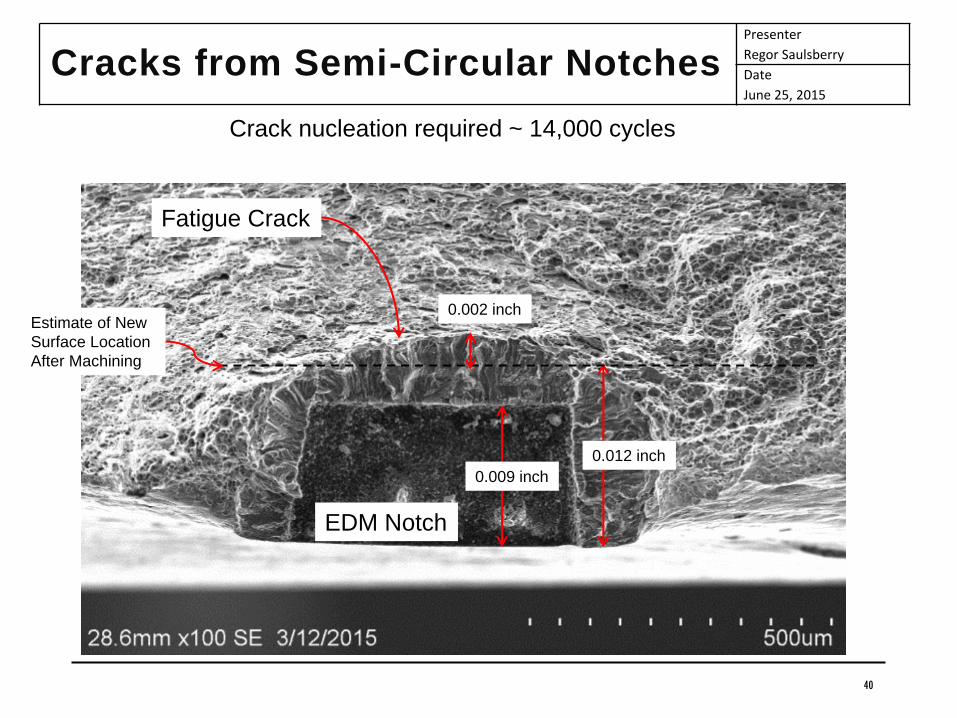
Cracks from Semi-Circular Notches
Crack nucleation required ~ 14,000 cycles
EDM Notch
Fatigue Crack
0.012 inch
0.002 inchEstimate of New
Surface Location
After Machining
0.009 inch
Presenter
Regor Saulsberry
Date
June 25, 2015
41
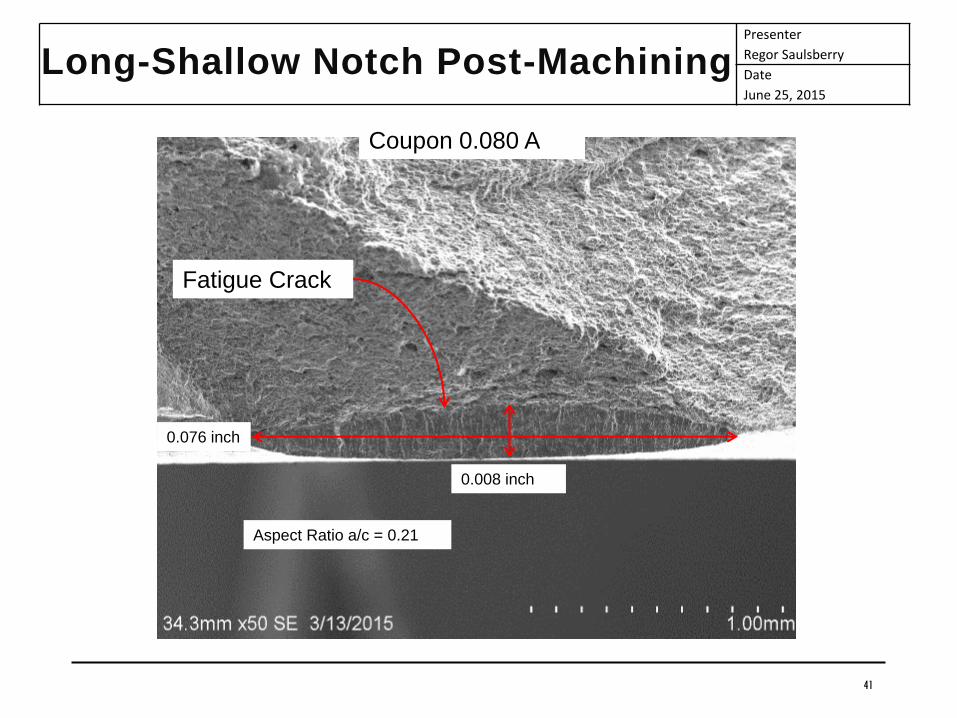
Long-Shallow Notch Post-Machining
Fatigue Crack
0.008 inch
0.076 inch
Aspect Ratio a/c = 0.21
Coupon 0.080 A

Presenter
Regor Saulsberry
Date
June 25, 2015
42
Semi-Circular Notch Post-Machining
Fatigue Crack
0.004 inch
0.019 inch
Aspect Ratio a/c = 0.42
Coupon 0.020 A

Presenter
Regor Saulsberry
Date
June 25, 2015
43
EC Response from 0.08” Starter Notch SampleUniWest ETC-2446 Probe, 4MHz, Differential Filter
S#10 Notch Only
Sample A Crack Only
S#10 Notch + Crack

Presenter
Regor Saulsberry
Date
June 25, 2015
44
EC Response from 0.02” Starter Notch SampleUniWest ETC-2446 Probe, 4MHz, Differential Filter
S#10 Notch Only
Sample A Crack Only
S#10 Notch + Crack
Sample B Crack Only
Presenter
Regor Saulsberry
Date
June 25, 2015
45
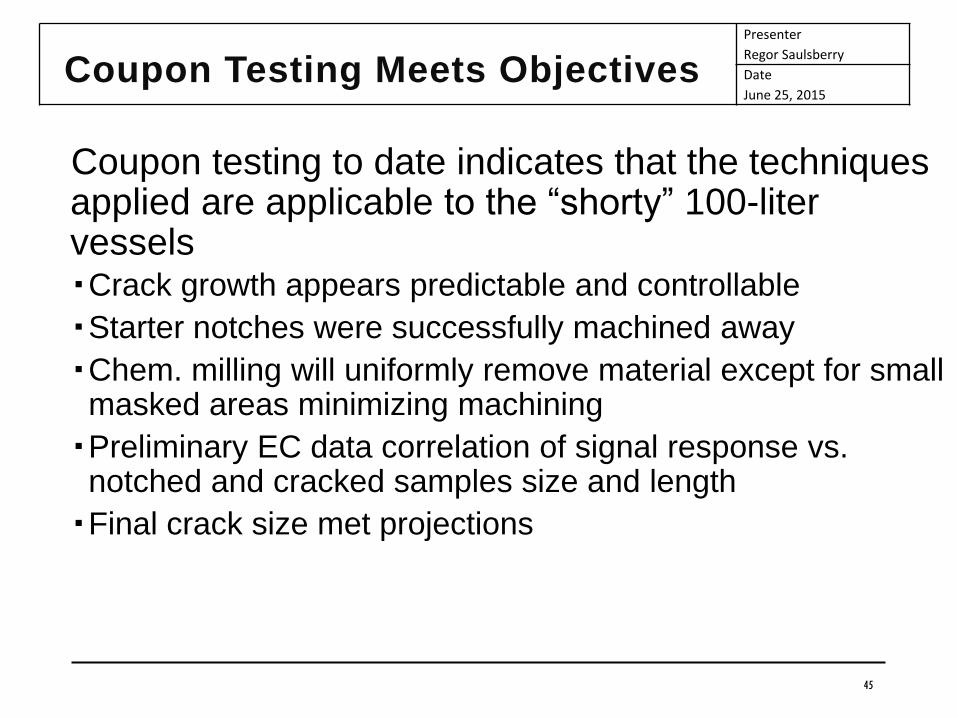
Coupon Testing Meets Objectives
Coupon testing to date indicates that the techniques applied are applicable to the “shorty” 100-liter vesselsCrack growth appears predictable and controllable
Starter notches were successfully machined away
Chem. milling will uniformly remove material except for small masked areas minimizing machining
Preliminary EC data correlation of signal response vs. notched and cracked samples size and length
Final crack size met projections
Presenter
Regor Saulsberry
Date
March 25, 2015
46
EC Scanner POD Study Plan
Plan created by NDE TDT POD specialist, Floyd Spencer, and peer reviewed by the NNWG/Dr. Edward Generazio and this assessment team.

Presenter
Regor Saulsberry
Date
June 25, 2015
47
POD Study Plan
Approved and controlled work authorizing document will be used to control inspection procedures and order of presentation of liners to inspectors
MIL Standard 1823a POD estimations to be used
The EC system will be used to inspect 6 Samtech SK-1335B liners, OD and IDCylinders and domes regions have differing critical flaw sizes due to different stress loads that roughly correspond to varying detection capability caused by surface noise levels
Presenter
Regor Saulsberry
Date
June 25, 2015
48
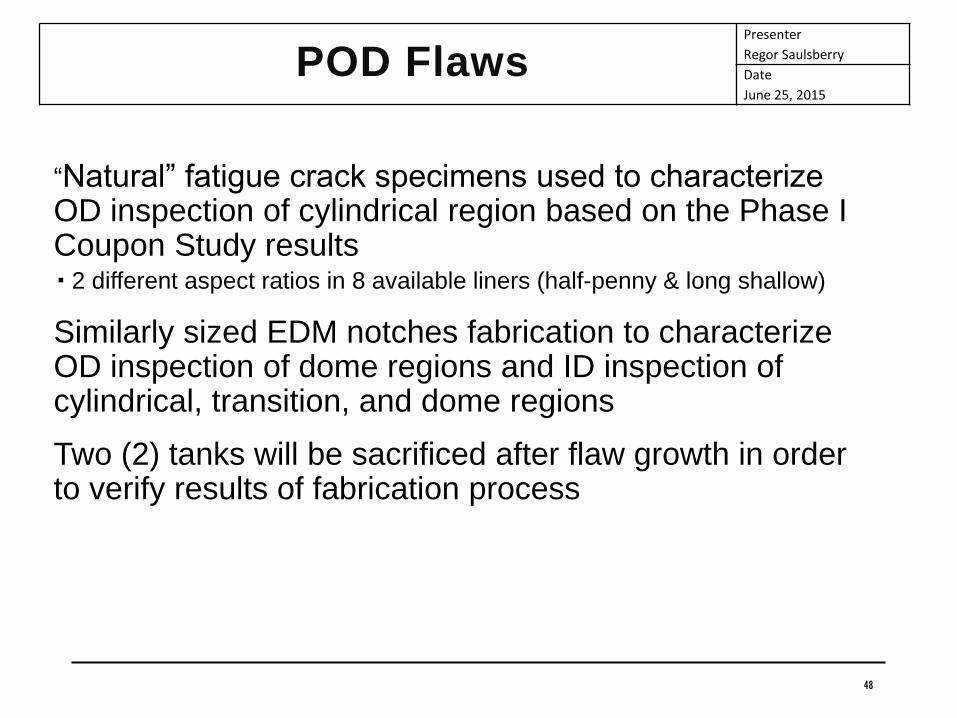
POD Flaws
“Natural” fatigue crack specimens used to characterize OD inspection of cylindrical region based on the Phase I Coupon Study results 2 different aspect ratios in 8 available liners (half-penny & long shallow)
Similarly sized EDM notches fabrication to characterize OD inspection of dome regions and ID inspection of cylindrical, transition, and dome regions
Two (2) tanks will be sacrificed after flaw growth in order to verify results of fabrication process
Presenter
Regor Saulsberry
Date
June 25, 2015
49
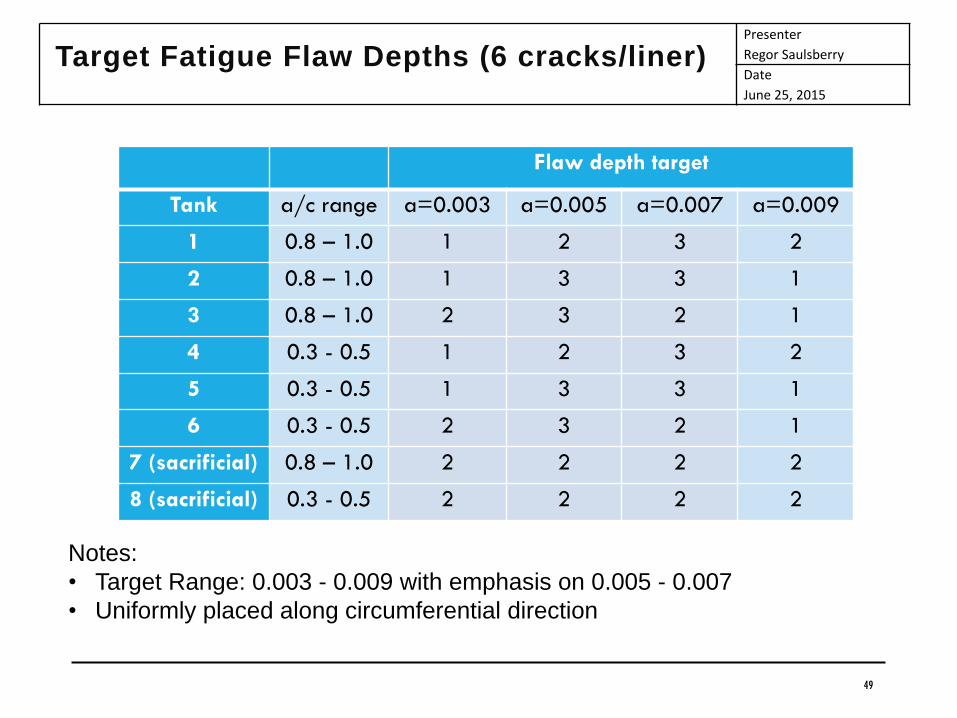
Target Fatigue Flaw Depths (6 cracks/liner)
Flaw depth target
Tank a/c range a=0.003 a=0.005 a=0.007 a=0.009
1 0.8 – 1.0 1 2 3 2
2 0.8 – 1.0 1 3 3 1
3 0.8 – 1.0 2 3 2 1
4 0.3 - 0.5 1 2 3 2
5 0.3 - 0.5 1 3 3 1
6 0.3 - 0.5 2 3 2 1
7 (sacrificial) 0.8 – 1.0 2 2 2 2
8 (sacrificial) 0.3 - 0.5 2 2 2 2
Notes:
• Target Range: 0.003 - 0.009 with emphasis on 0.005 - 0.007
• Uniformly placed along circumferential direction
Presenter
Regor Saulsberry
Date
June 25, 2015
50
OD & ID Inspection EDM Notches
ID notches will be placed on sectioned liner only (S/N 006)
OD notches will be placed on the same 6 liners with fatigue flaws
Will be placed in the three tank regions Cylinder
Dome
Transition
Various Sizes Target the two aspect ratios used in the fatigue flaws
EDM notches are easier to detect, therefore lower range of target depths: 0.002, 0.003, 0.005, 0.007
Will be placed after fatigue flaw growth
Different numbers of flaws are placed in each liner to not create an expectation with the inspectors of having the same conditions within each liner

Presenter
Regor Saulsberry
Date
June 25, 2015
51
Inspectors
•Number of inspectors: 5• Will be trained to operate system according to developed procedures
• Perform the inspections across all 6 liners
• Liners will be presented to the inspectors in the following pre-defined order to not confound a possible liner effect with the effect of probe film wear
•Random ordering of tanks:• Inspector 1 – Tanks in order 6, 5, 1, 3, 2, 4
• Inspector 2 – Tanks in order 3, 6, 2, 5, 4, 1
• Inspector 3 – Tanks in order 1, 2, 5, 4, 3, 6
• Inspector 4 – Tanks in order 2, 1, 4, 3, 6, 5
• Inspector 5 – Tanks in order 5, 4, 3, 6, 1, 2

Presenter
Regor Saulsberry
Date
June 25, 2015
52
Analysis
• Estimate a POD function notches leading to two distinct POD curves represented by 2 separate equations for cracks (cylinder region only)
for EDM A notch-to-flaw size transfer function will be used to estimate notch POD that can be compared to that for fatigue flaws
A noise floor parameter will also be added to the model which will lead to fewer false calls
• This makes notch POD curves available for transition and dome regions where fatigue flaw POD is not possible (transition and dome regions are significantly thicker)
Presenter
Regor Saulsberry
Date
June 25, 2015
53
Capability Objectives
Develop scan capabilities: EC thickness
EC flaw (minimum detectible flaw size 0.030 x 0.015 inches)
Laser Profilometry
For COPV sizes: 22 inch OD (300L)
15 inch OD (“Shorty”)
Including the following zones: Cylindrical section as well as the upper and lower domes
Liner ID and OD
Implemented with: Modified existing WSTF COPV-scanning system (NORS)
Newly developed additional sensors, stages, and software
Presenter
Regor Saulsberry
Date
June 25, 2015
54
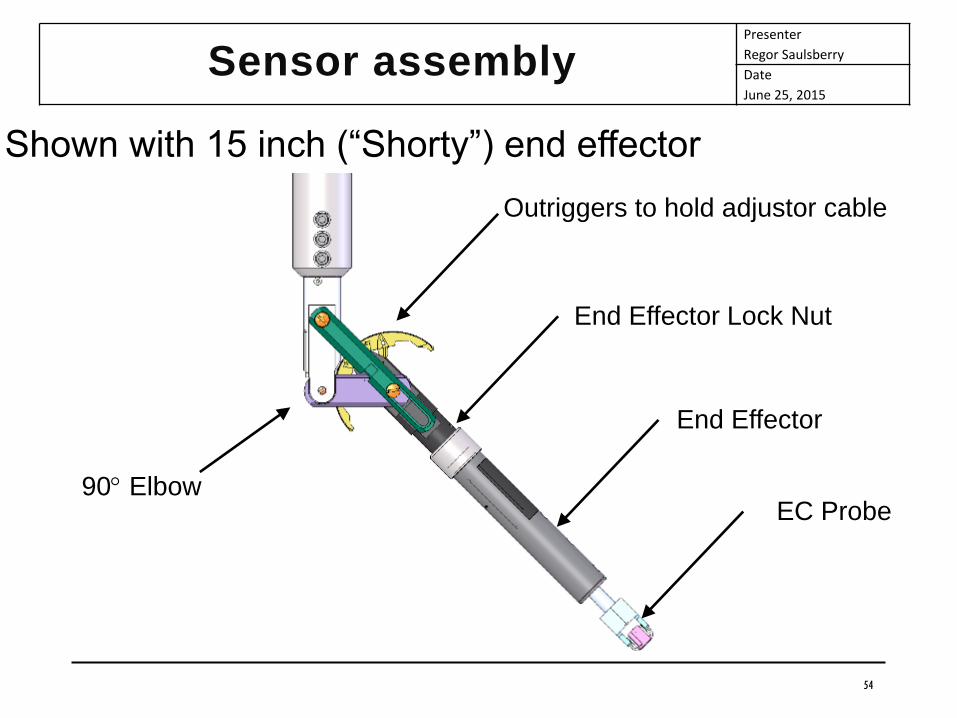
Sensor assembly
Shown with 15 inch (“Shorty”) end effector
90 Elbow
Outriggers to hold adjustor cable
End Effector Lock Nut
End Effector
EC Probe
Presenter
Regor Saulsberry
Date
June 25, 2015
55
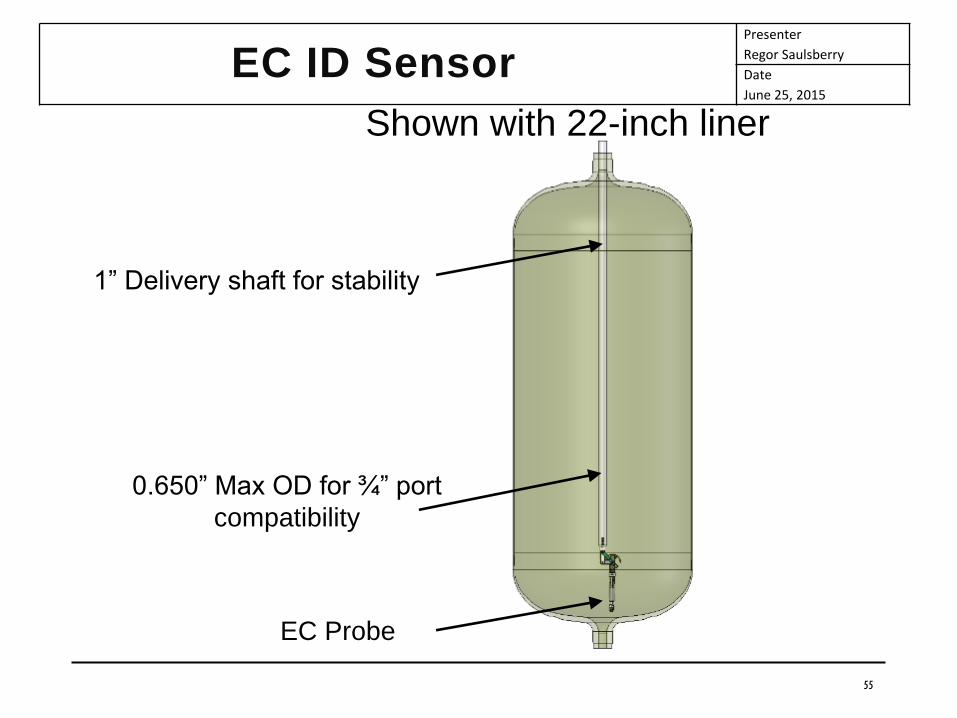
EC ID Sensor
Shown with 22-inch liner
1” Delivery shaft for stability
0.650” Max OD for ¾” port
compatibility
EC Probe
Presenter
Regor Saulsberry
Date
June 25, 2015
56
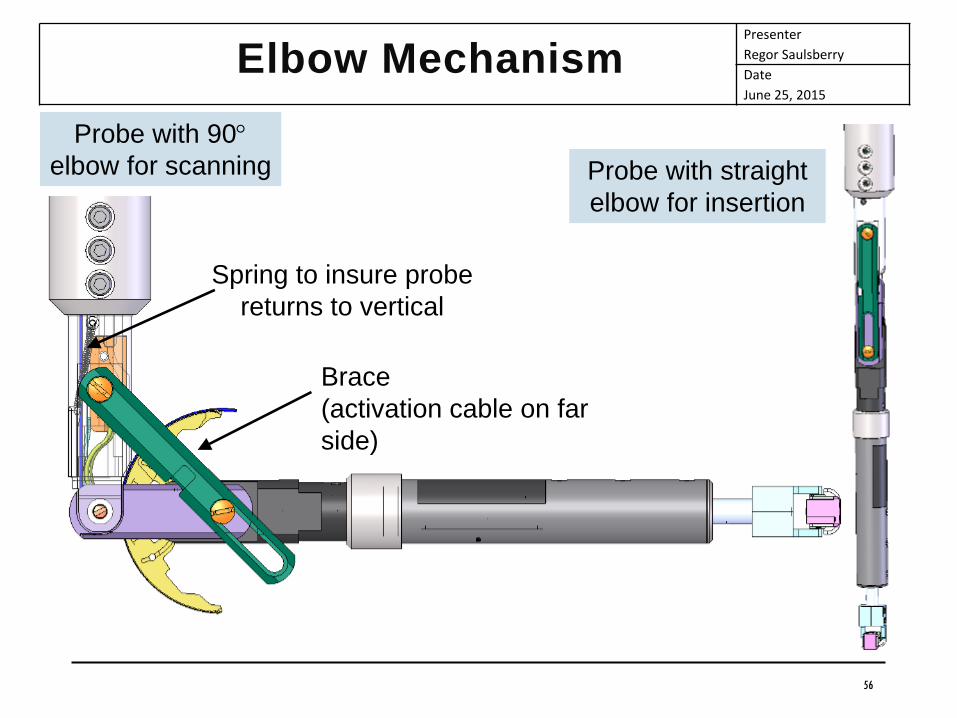
Elbow Mechanism
Spring to insure probe
returns to vertical
Probe with straight
elbow for insertion
Probe with 90
elbow for scanning
Brace
(activation cable on far
side)
Presenter
Regor Saulsberry
Date
June 25, 2015
57
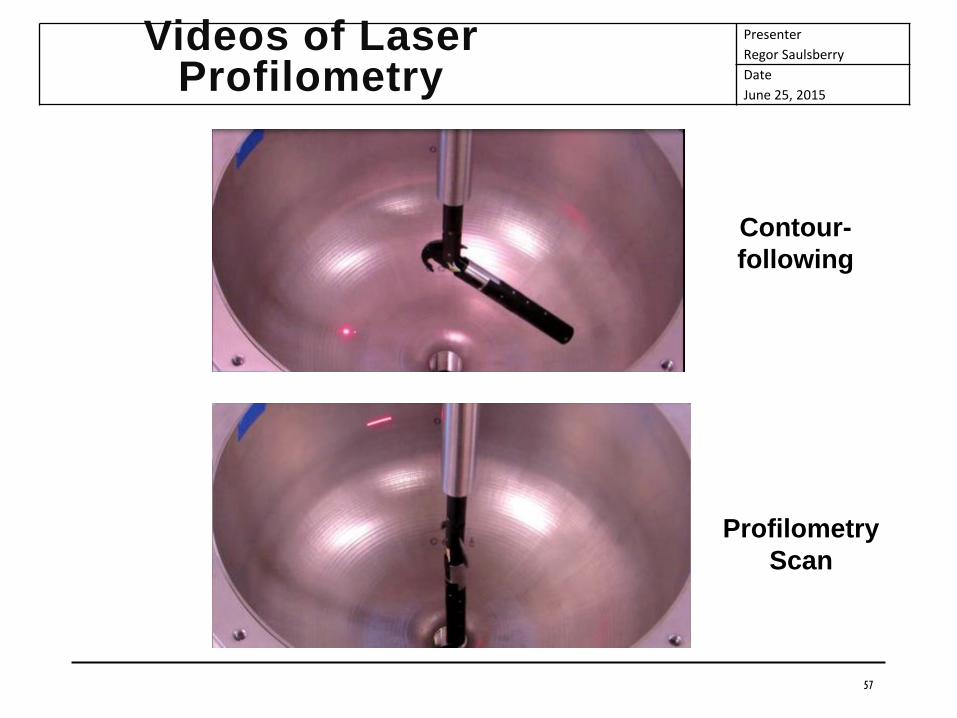
Videos of Laser Profilometry
Contour-
following
Profilometry
Scan

Presenter
Regor Saulsberry
Date
June 25, 2015
58
Flaw Summary – Liner S/N 006 ID
Uniwest EDM ID “Thumbnail” Flaws in Dome
Group Flaw
#
Rotary
Position
Axial
Position
Dimensions Orientation
A
1 3.6 4.06” 0.030 x 0.015 x 0.003” Circumferential
2 15.4 4.06” 0.030 x 0.015 x 0.003” Axial
3 28.0 4.06” 0.030 x 0.015 x 0.003” 45
B
4 60.9 3.73” 0.049 x 0.021 x 0.003” Circumferential
5 71.9 3.73” 0.049 x 0.021 x 0.004” Axial
6 81.7 3.73” 0.049 x 0.021 x 0.003” 45
Circumferential EC Coil Axial EC Coil
Presenter
Regor Saulsberry
Date
June 25, 2015
59
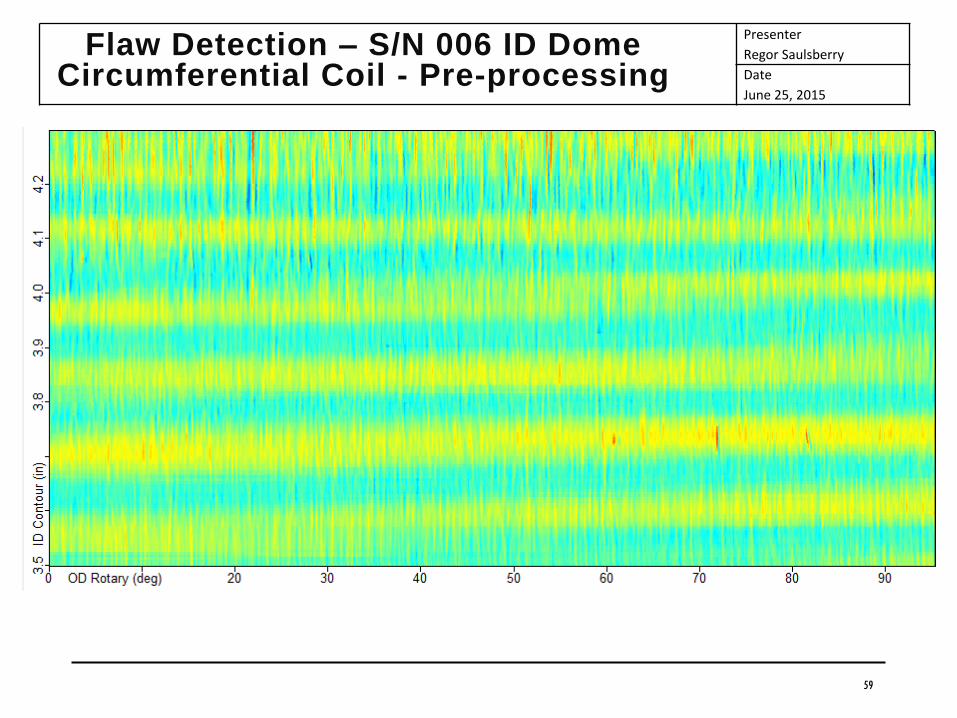
Flaw Detection – S/N 006 ID DomeCircumferential Coil - Pre-processing
Presenter
Regor Saulsberry
Date
June 25, 2015
60
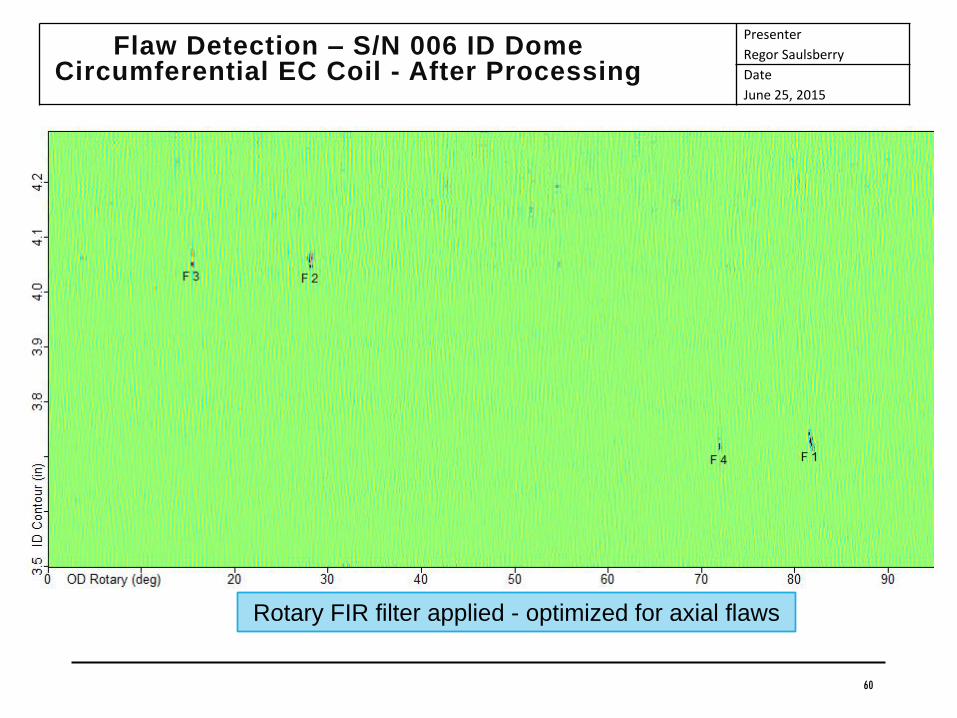
Flaw Detection – S/N 006 ID DomeCircumferential EC Coil - After Processing
Rotary FIR filter applied - optimized for axial flaws
Presenter
Regor Saulsberry
Date
June 25, 2015
61
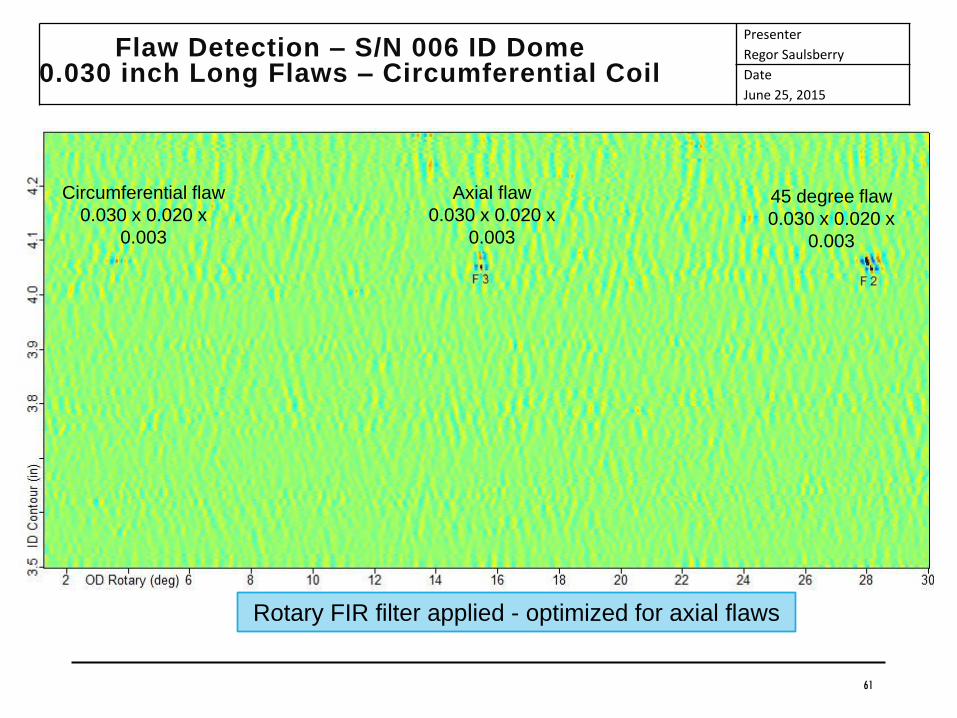
Flaw Detection – S/N 006 ID Dome0.030 inch Long Flaws – Circumferential Coil
Rotary FIR filter applied - optimized for axial flaws
Axial flaw
0.030 x 0.020 x
0.003
45 degree flaw
0.030 x 0.020 x
0.003
Circumferential flaw
0.030 x 0.020 x
0.003
Presenter
Regor Saulsberry
Date
June 25, 2015
62
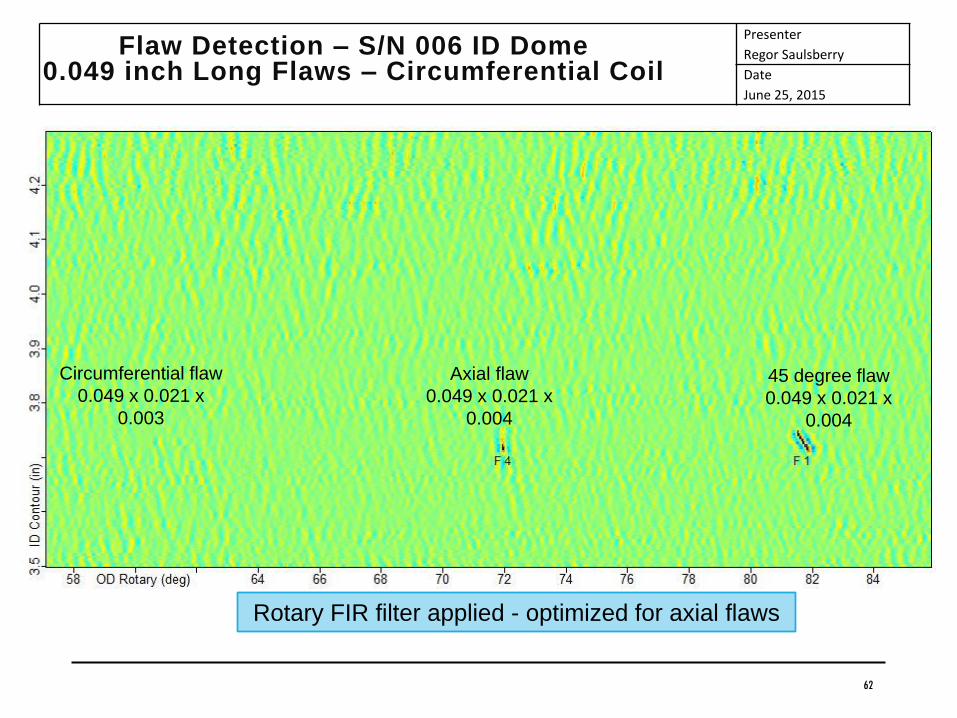
Flaw Detection – S/N 006 ID Dome0.049 inch Long Flaws – Circumferential Coil
Rotary FIR filter applied - optimized for axial flaws
Axial flaw
0.049 x 0.021 x
0.004
45 degree flaw
0.049 x 0.021 x
0.004
Circumferential flaw
0.049 x 0.021 x
0.003

Presenter
Regor Saulsberry
Date
June 25, 2015
63
Flaw Detection – S/N 006 ID DomeAxial Coil - Pre-processing
Presenter
Regor Saulsberry
Date
June 25, 2015
64
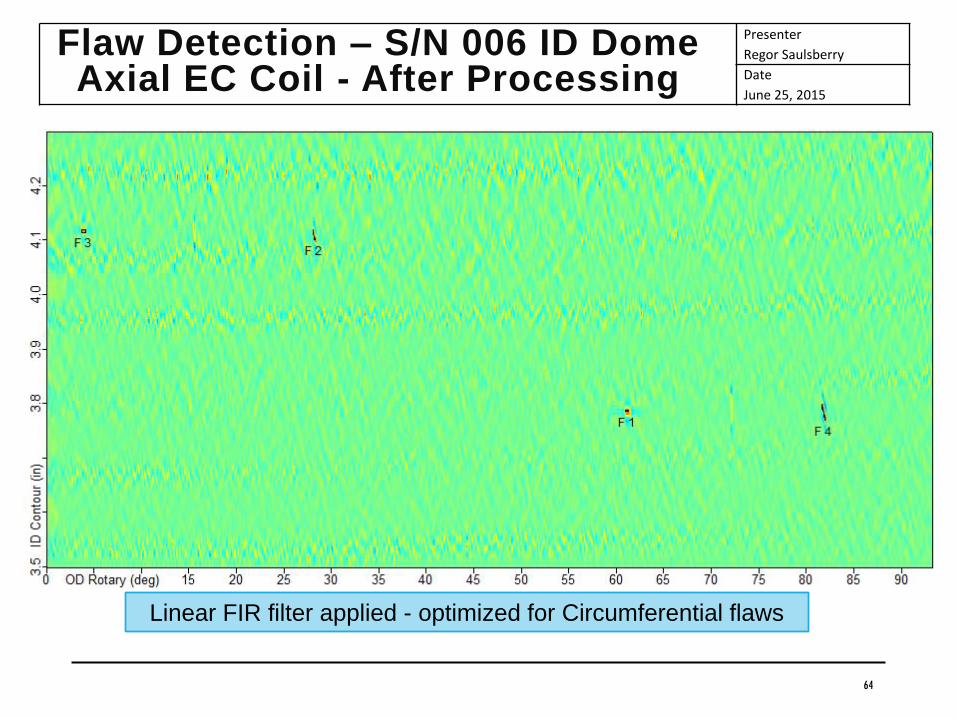
Flaw Detection – S/N 006 ID DomeAxial EC Coil - After Processing
Linear FIR filter applied - optimized for Circumferential flaws
Presenter
Regor Saulsberry
Date
June 25, 2015
65
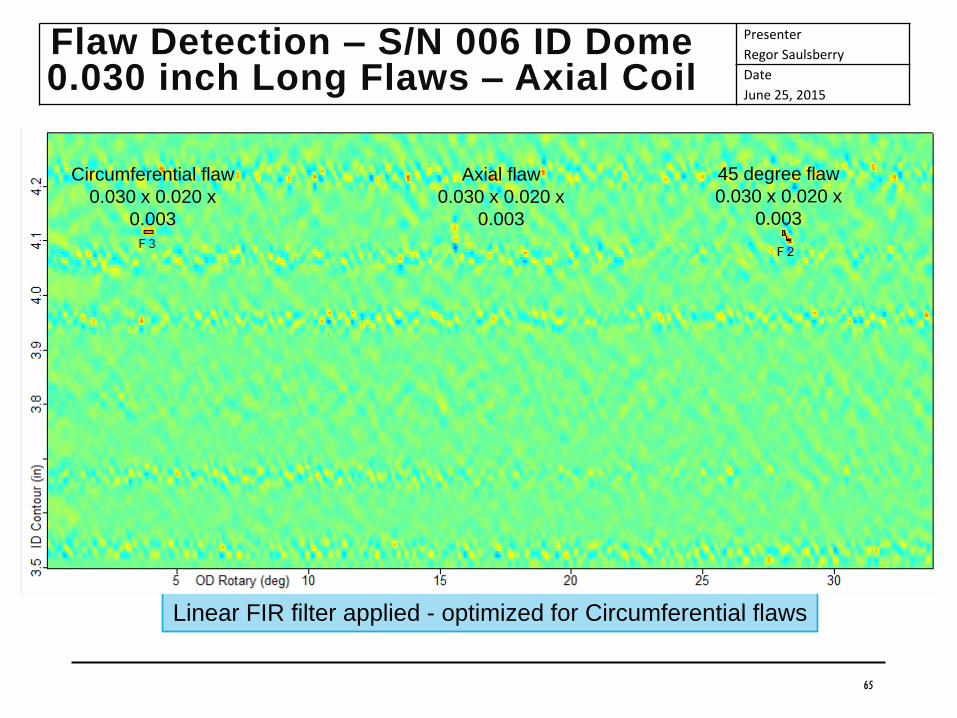
Flaw Detection – S/N 006 ID Dome0.030 inch Long Flaws – Axial Coil
Linear FIR filter applied - optimized for Circumferential flaws
Axial flaw
0.030 x 0.020 x
0.003
45 degree flaw
0.030 x 0.020 x
0.003
Circumferential flaw
0.030 x 0.020 x
0.003

Presenter
Regor Saulsberry
Date
June 25, 2015
66
Flaw Detection – S/N 006 ID Dome0.049 inch Long Flaws – Axial Coil
Linear FIR filter applied - optimized for Circumferential flaws
Axial flaw
0.050 x 0.021 x
0.004
45 degree flaw
0.049 x 0.021 x
0.004
Circumferential flaw
0.049 x 0.021 x
0.003
Presenter
Regor Saulsberry
Date
June 25, 2015
67
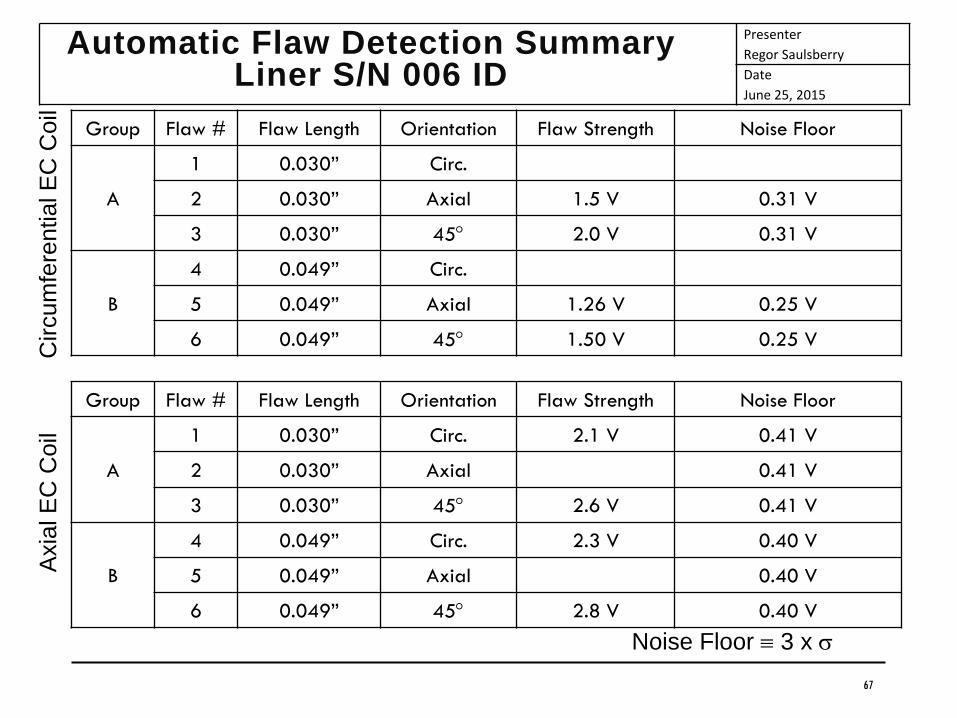
Automatic Flaw Detection SummaryLiner S/N 006 ID
Group Flaw # Flaw Length Orientation Flaw Strength Noise Floor
A
1 0.030” Circ.
2 0.030” Axial 1.5 V 0.31 V
3 0.030” 45 2.0 V 0.31 V
B
4 0.049” Circ.
5 0.049” Axial 1.26 V 0.25 V
6 0.049” 45 1.50 V 0.25 V
Noise Floor 3 x
Group Flaw # Flaw Length Orientation Flaw Strength Noise Floor
A
1 0.030” Circ. 2.1 V 0.41 V
2 0.030” Axial 0.41 V
3 0.030” 45 2.6 V 0.41 V
B
4 0.049” Circ. 2.3 V 0.40 V
5 0.049” Axial 0.40 V
6 0.049” 45 2.8 V 0.40 V
Cir
cum
fere
ntial E
C C
oil
Axia
l E
C C
oil
Presenter
Regor Saulsberry
Date
June 25, 2015
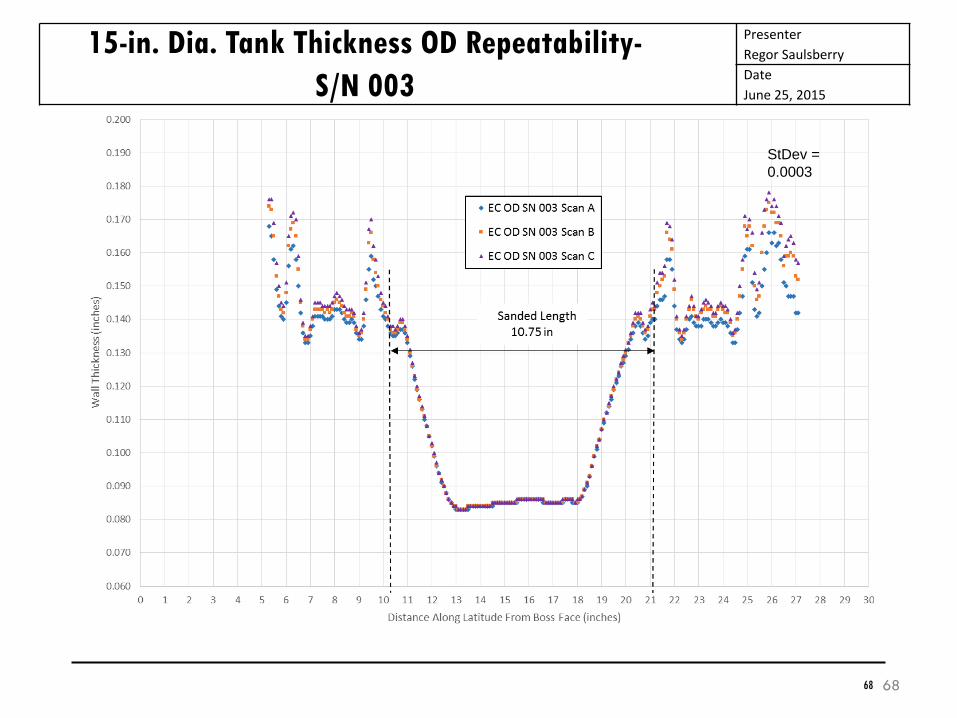
15-in. Dia. Tank Thickness OD Repeatability-
S/N 003
68
StDev =
0.0003
68
Presenter
Regor Saulsberry
Date
June 25, 2015
69
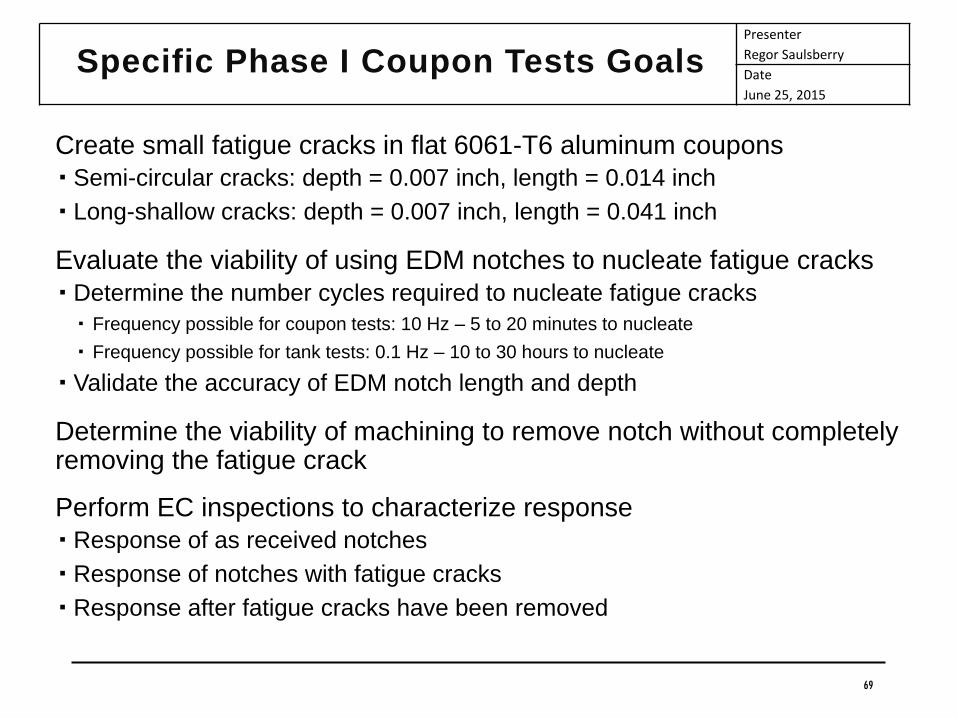
Specific Phase I Coupon Tests Goals
Create small fatigue cracks in flat 6061-T6 aluminum coupons
Semi-circular cracks: depth = 0.007 inch, length = 0.014 inch
Long-shallow cracks: depth = 0.007 inch, length = 0.041 inch
Evaluate the viability of using EDM notches to nucleate fatigue cracks
Determine the number cycles required to nucleate fatigue cracks
Frequency possible for coupon tests: 10 Hz – 5 to 20 minutes to nucleate
Frequency possible for tank tests: 0.1 Hz – 10 to 30 hours to nucleate
Validate the accuracy of EDM notch length and depth
Determine the viability of machining to remove notch without completely removing the fatigue crack
Perform EC inspections to characterize response
Response of as received notches
Response of notches with fatigue cracks
Response after fatigue cracks have been removed
Presenter
Regor Saulsberry
Date
June 25, 2015
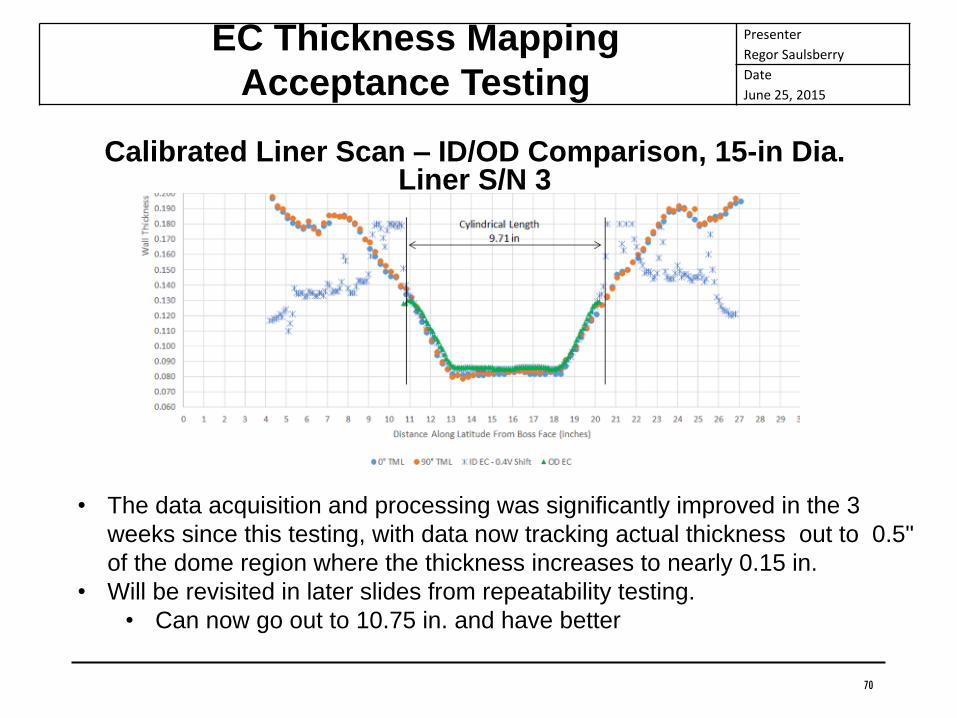
Calibrated Liner Scan – ID/OD Comparison, 15-in Dia. Liner S/N 3
70
EC Thickness Mapping
Acceptance Testing
• The data acquisition and processing was significantly improved in the 3
weeks since this testing, with data now tracking actual thickness out to 0.5"
of the dome region where the thickness increases to nearly 0.15 in.
• Will be revisited in later slides from repeatability testing.
• Can now go out to 10.75 in. and have better