Embed Size (px)
Citation preview
15-1
The Balanced The Balanced Scorecard: Scorecard: Strategic-Strategic-
Based ControlBased ControlPrepared by
Douglas Cloud Pepperdine University
Prepared by Douglas Cloud
Pepperdine University
15-2
1. Compare and contrast activity-based and strategic-based responsibility accounting systems.
2. Discuss the basic features of the Balanced Scorecard.
3. Explain how the Balanced Scorecard links measures to strategy.
4. Describe how an organization can achieve strategic alignment.
ObjectivesObjectivesObjectivesObjectives
After studying this After studying this chapter, you should chapter, you should
be able to:be able to:
After studying this After studying this chapter, you should chapter, you should
be able to:be able to:
15-3
Activity-Based versus Strategic-Activity-Based versus Strategic-Based AccountingBased Accounting
Activity-Based versus Strategic-Activity-Based versus Strategic-Based AccountingBased Accounting
The activity-based system adds a process
perspective to the financial perspective of
the functional-based responsibility
accounting system.
The activity-based system adds a process
perspective to the financial perspective of
the functional-based responsibility
accounting system.
A strategy-based responsibility
accounting system translates the strategy
of the organization into operational objectives
and measures.
A strategy-based responsibility
accounting system translates the strategy
of the organization into operational objectives
and measures.
15-4
Activity-Based versus Strategic-Activity-Based versus Strategic-Based AccountingBased Accounting
Activity-Based versus Strategic-Activity-Based versus Strategic-Based AccountingBased Accounting
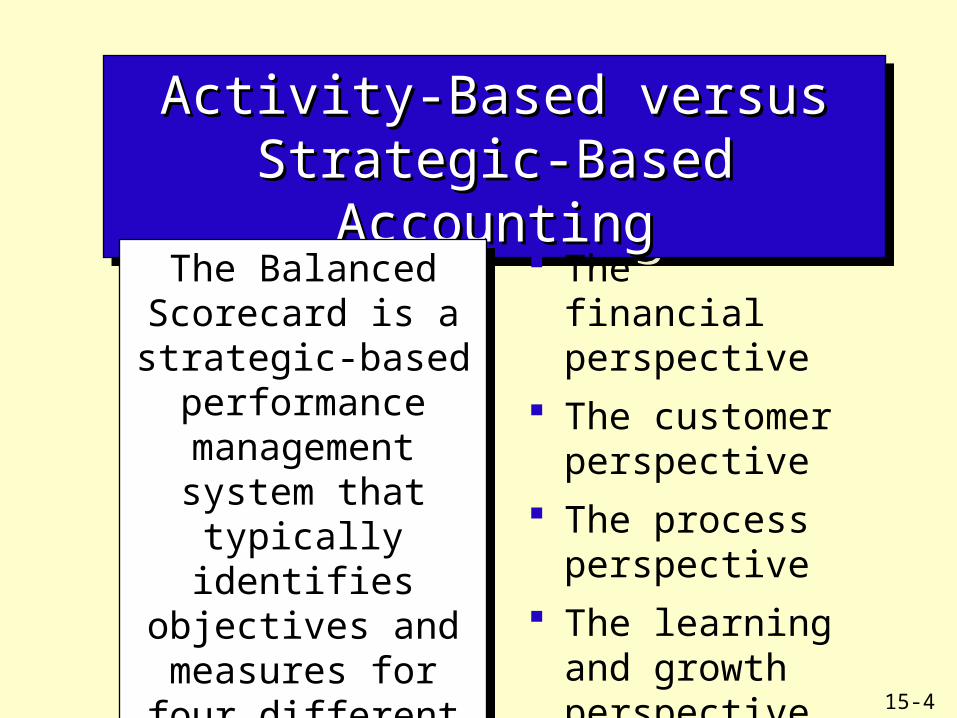
The Balanced Scorecard is a strategic-based performance
management system that typically identifies
objectives and measures for four
different perspectives.
The Balanced Scorecard is a strategic-based performance
management system that typically identifies
objectives and measures for four
different perspectives.
The financial perspective
The customer perspective
The process perspective
The learning and growth perspective
15-5
Assigning ResponsibilityAssigning ResponsibilityAssigning ResponsibilityAssigning Responsibility
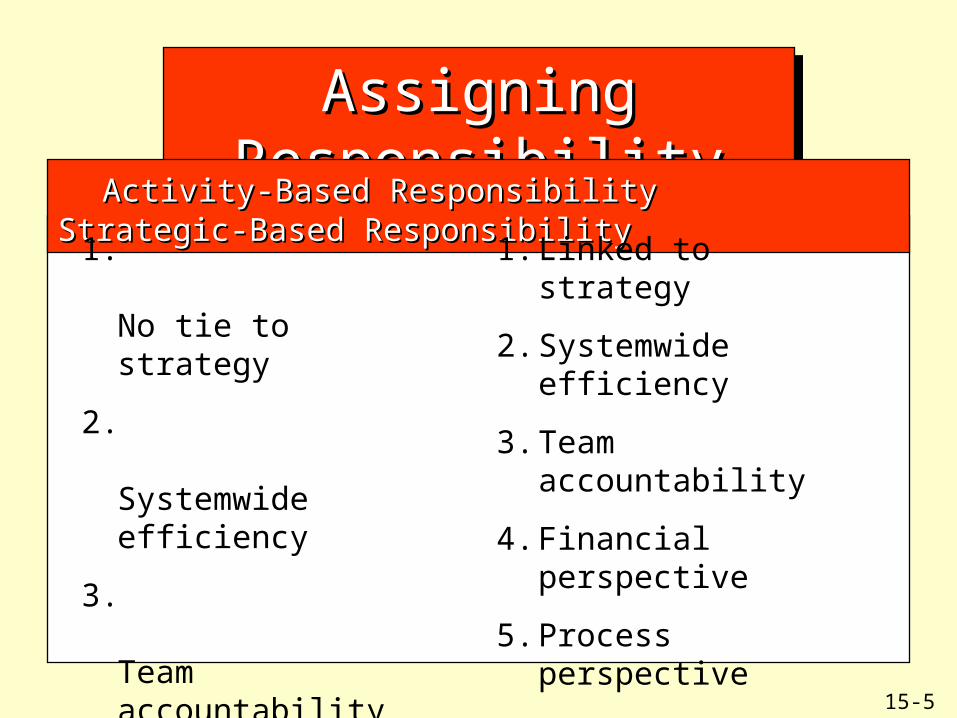
Activity-Based Responsibility Strategic-Based ResponsibilityActivity-Based Responsibility Strategic-Based Responsibility
1. No tie to strategy
2. Systemwide efficiency
3. Team accountability
4. Financial perspective
5. Process perspective
1. Linked to strategy
2. Systemwide efficiency
3. Team accountability
4. Financial perspective
5. Process perspective
6. Customer perspective
7. Learning and growth perspective
15-6
Establishing Performance MeasuresEstablishing Performance MeasuresEstablishing Performance MeasuresEstablishing Performance Measures
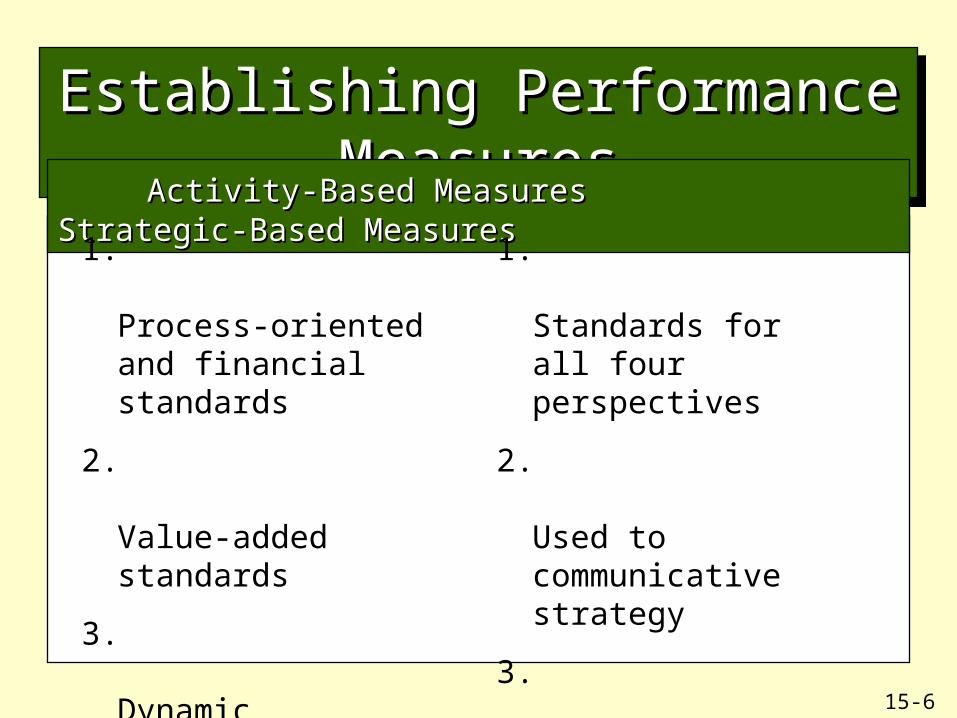
Activity-Based Measures Strategic-Based MeasuresActivity-Based Measures Strategic-Based Measures
1. Process-oriented and financial standards
2. Value-added standards
3. Dynamic standards
4. Optimal Standards
1. Standards for all four perspectives
2. Used to communicative strategy
3. Used to help align objectives
4. Linked to strategy and objectives
5. Balanced measures
15-7
ABC versus Strategic-BasedABC versus Strategic-BasedABC versus Strategic-BasedABC versus Strategic-Based
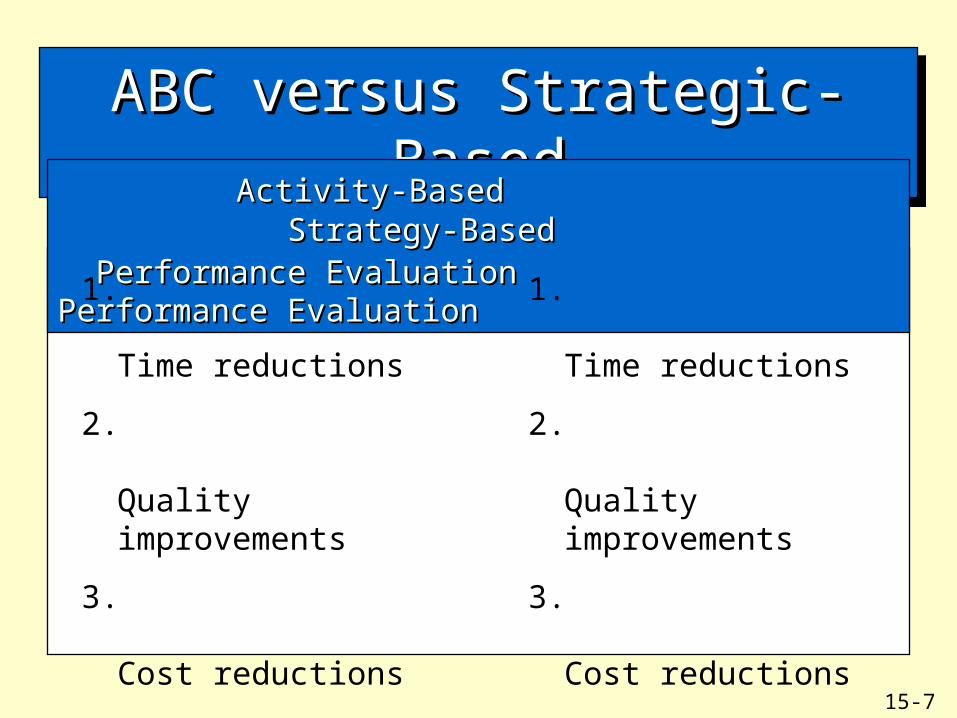
Activity-Based Strategy-BasedActivity-Based Strategy-Based
Performance Evaluation Performance EvaluationPerformance Evaluation Performance Evaluation
1. Time reductions
2. Quality improvements
3. Cost reductions
4. Trend measurements
1. Time reductions
2. Quality improvements
3. Cost reductions
4. Trend measurements
5. Expanded set of metrics
6. Set stretch targets for all four perspectives
15-8
Rewards ComparedRewards ComparedRewards ComparedRewards Compared
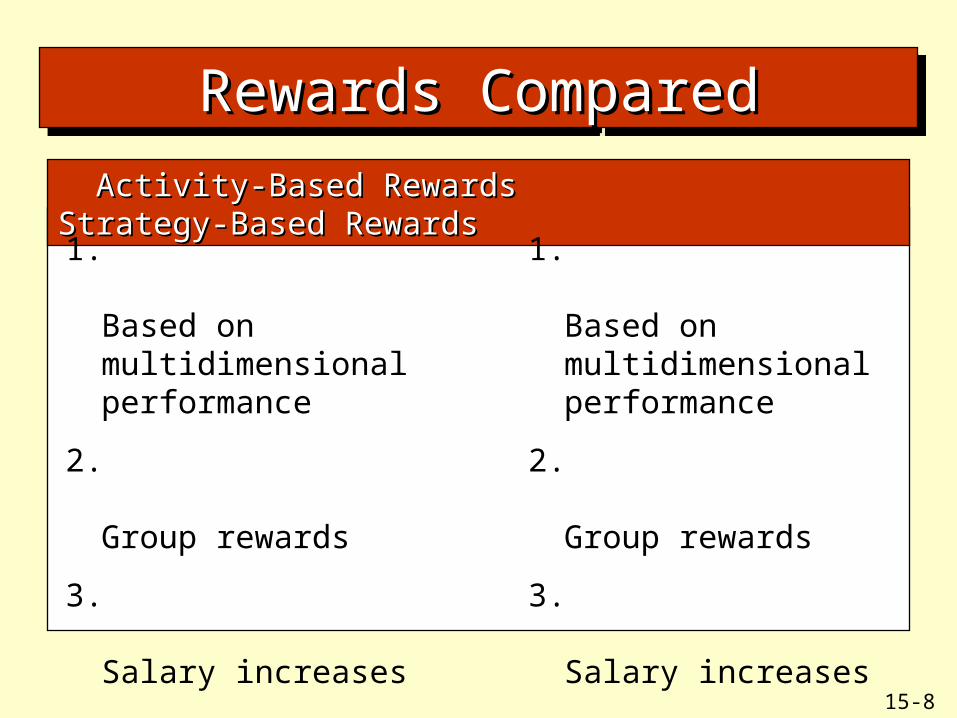
Activity-Based Rewards Strategy-Based Rewards Activity-Based Rewards Strategy-Based Rewards
1. Based on multidimensional performance
2. Group rewards
3. Salary increases
4. Promotions
5. Bonuses, profit sharing, and gainsharing
1. Based on multidimensional performance
2. Group rewards
3. Salary increases
4. Promotions
5. Bonuses, profit sharing, and gainsharing
15-9
StrategyStrategyStrategyStrategy
Strategy is choosing the market and customer segments the business unit
intends to service, identifying the critical internal and business processes that the unit must excel at to deliver the value propositions to customers in the
targeted market segments, and selecting the individual and organizational
capabilities required for the internal, customer, and financial objectives.
15-10
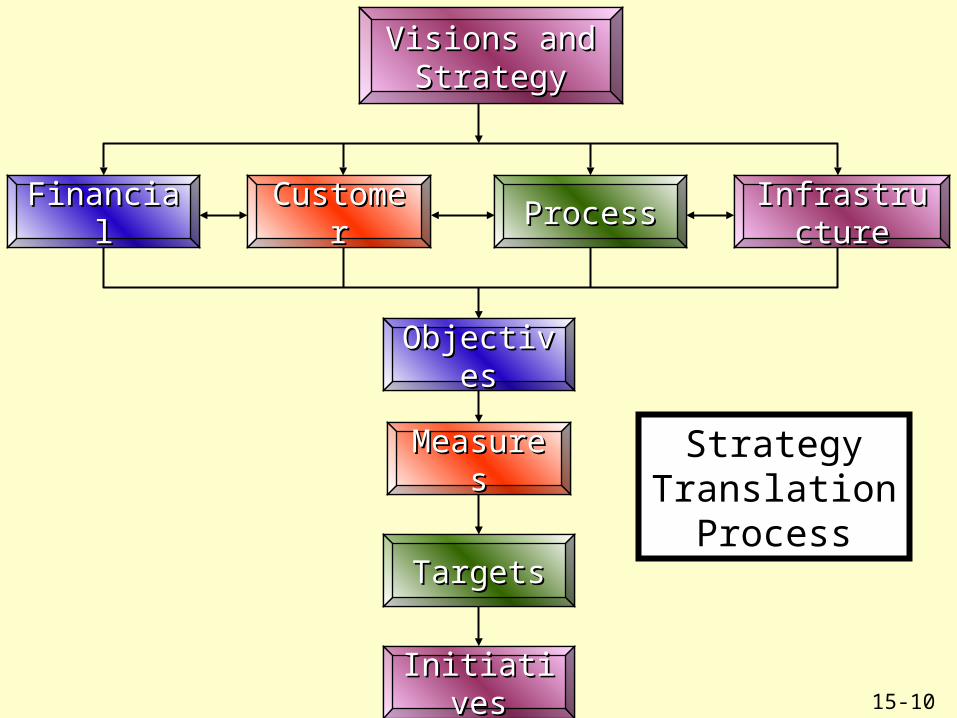
Visions and Visions and StrategyStrategy
FinancialFinancial CustomerCustomer ProcessProcess InfrastructureInfrastructure
ObjectivesObjectives
MeasuresMeasures
TargetsTargets
InitiativesInitiatives
Strategy Translation
Process
15-11
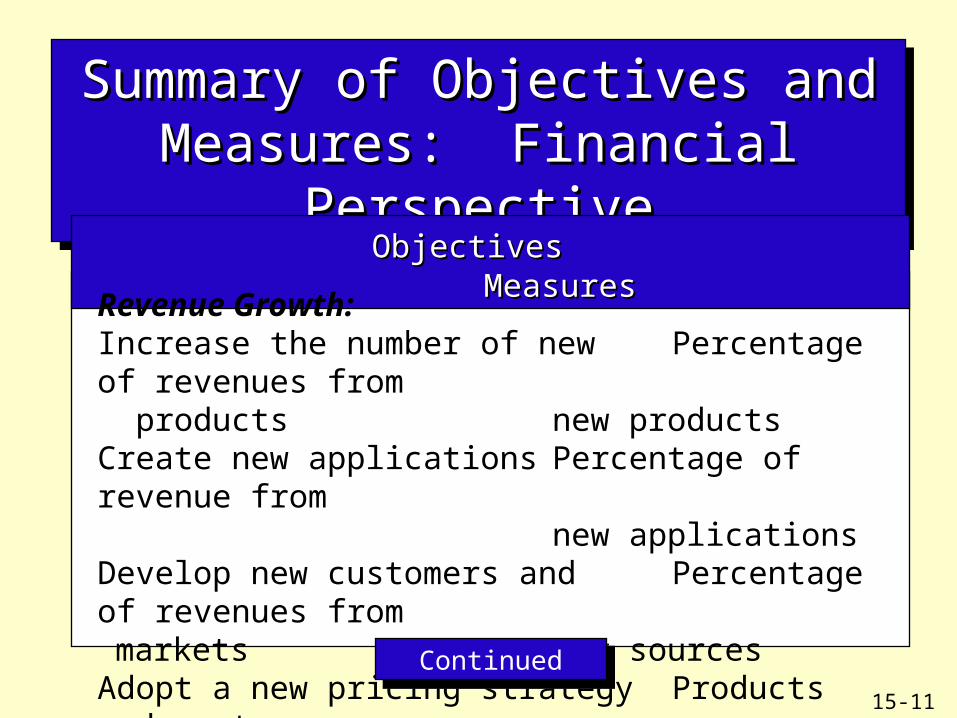
Summary of Objectives and Measures: Summary of Objectives and Measures: Financial Perspective Financial Perspective
Summary of Objectives and Measures: Summary of Objectives and Measures: Financial Perspective Financial Perspective
Objectives MeasuresObjectives Measures
Revenue Growth:Increase the number of new Percentage of revenues from products new productsCreate new applications Percentage of revenue from
new applicationsDevelop new customers and Percentage of revenues from
markets new sourcesAdopt a new pricing strategy Products and customer
profitability
ContinuedContinued
15-12
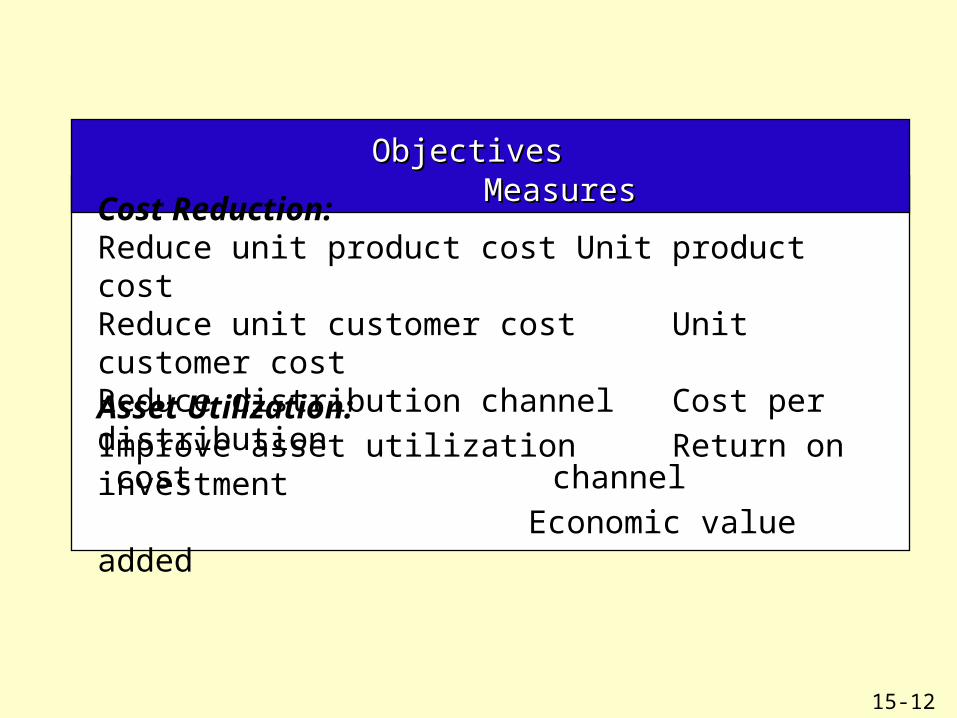
Objectives MeasuresObjectives Measures
Cost Reduction:Reduce unit product cost Unit product costReduce unit customer cost Unit customer costReduce distribution channel Cost per distribution
cost channel
Asset Utilization:Improve asset utilization Return on investment
Economic value added
15-13
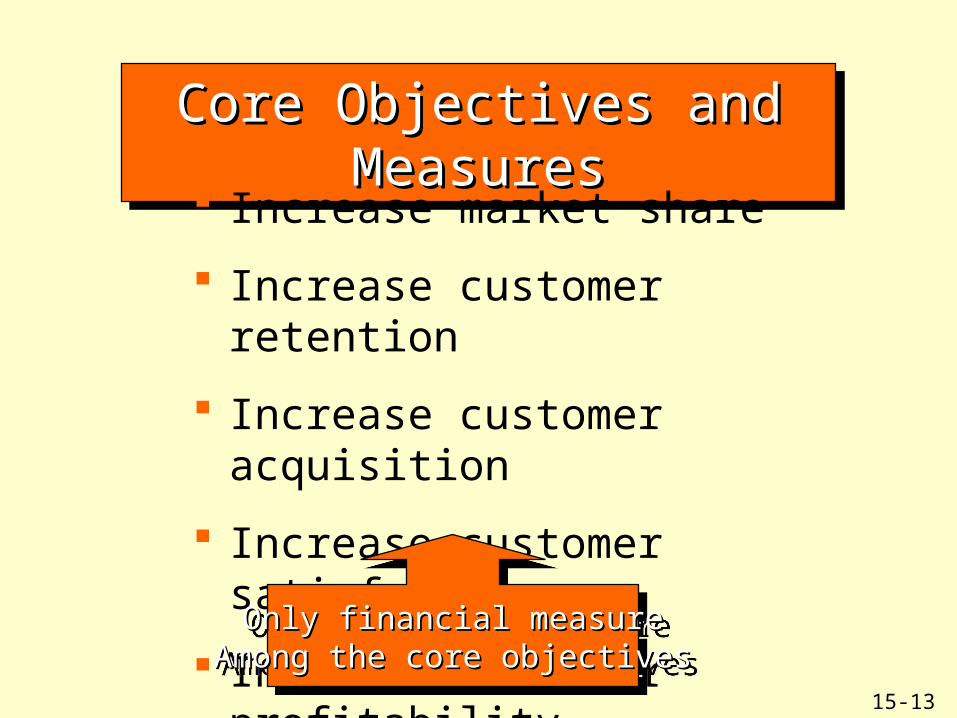
Core Objectives and MeasuresCore Objectives and MeasuresCore Objectives and MeasuresCore Objectives and Measures
Increase market share
Increase customer retention
Increase customer acquisition
Increase customer satisfaction
Increase customer profitability
Only financial measureOnly financial measureAmong the core objectivesAmong the core objectives
Only financial measureOnly financial measureAmong the core objectivesAmong the core objectives
15-14
Customer ValueCustomer Value
Customer value is the difference between realization and sacrifice, where realization is what the customer receives
and sacrifice is what is given up.
Customer value is the difference between realization and sacrifice, where realization is what the customer receives
and sacrifice is what is given up.
15-15
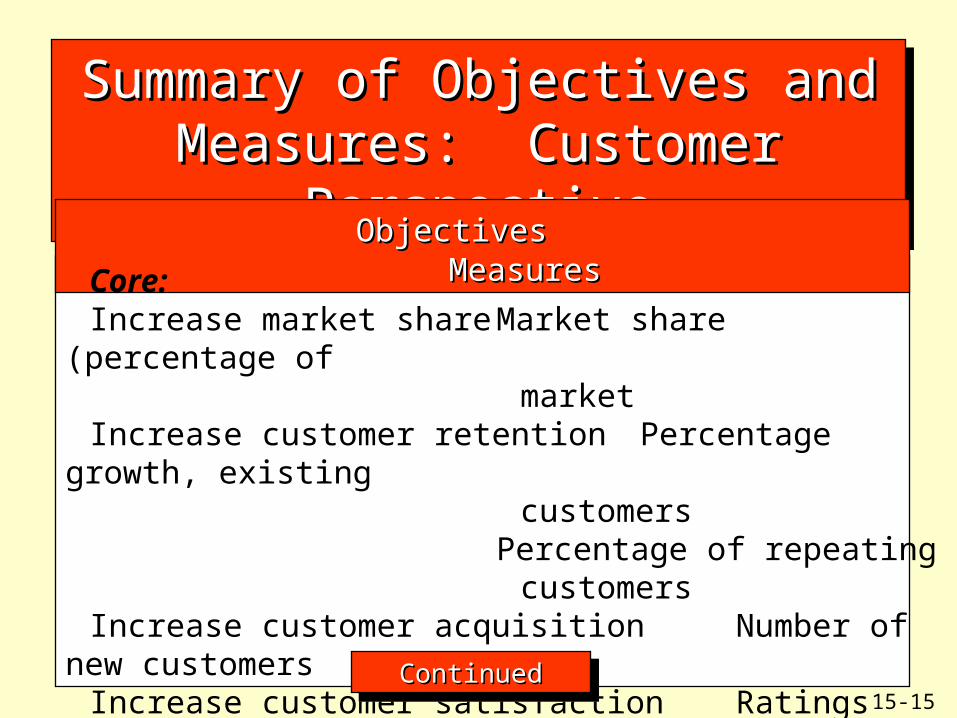
Summary of Objectives and Measures: Summary of Objectives and Measures: Customer Perspective Customer Perspective
Summary of Objectives and Measures: Summary of Objectives and Measures: Customer Perspective Customer Perspective
Objectives MeasuresObjectives Measures
Core:Increase market share Market share (percentage of
marketIncrease customer retention Percentage growth, existing
customersPercentage of repeating
customersIncrease customer acquisition Number of new customersIncrease customer satisfaction Ratings from customer surveysIncrease customer Customer profitabilityprofitability
ContinuedContinuedContinuedContinued
15-16
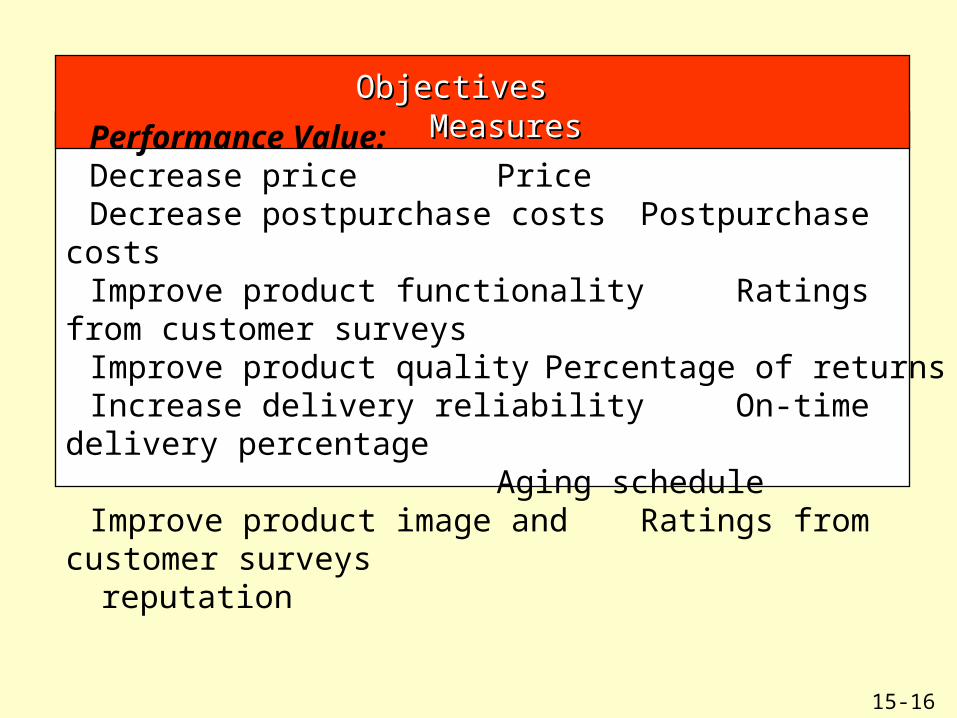
Objectives MeasuresObjectives Measures
Performance Value:Decrease price PriceDecrease postpurchase costs Postpurchase costsImprove product functionality Ratings from customer surveysImprove product quality Percentage of returnsIncrease delivery reliability On-time delivery percentage
Aging scheduleImprove product image and Ratings from customer surveysreputation
15-17
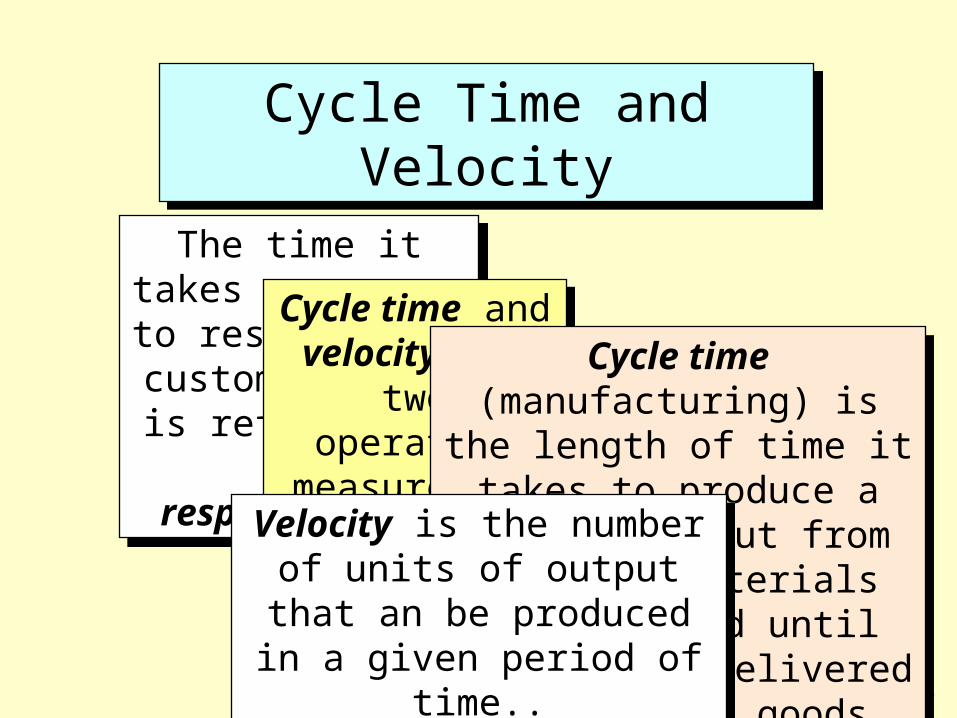
Cycle Time and VelocityCycle Time and Velocity
The time it takes a company to respond
to a customer order is referred to as
responsiveness.
The time it takes a company to respond
to a customer order is referred to as
responsiveness.
Cycle time and velocity are two
operation measures of
responsiveness.
Cycle time and velocity are two
operation measures of
responsiveness.
Cycle time (manufacturing) is the length of time it takes to
produce a unit of output from the time materials are received until the good is delivered to
finished goods inventory.
Cycle time (manufacturing) is the length of time it takes to
produce a unit of output from the time materials are received until the good is delivered to
finished goods inventory.Velocity is the number of units of output that an be produced in
a given period of time..
Velocity is the number of units of output that an be produced in
a given period of time..
15-18
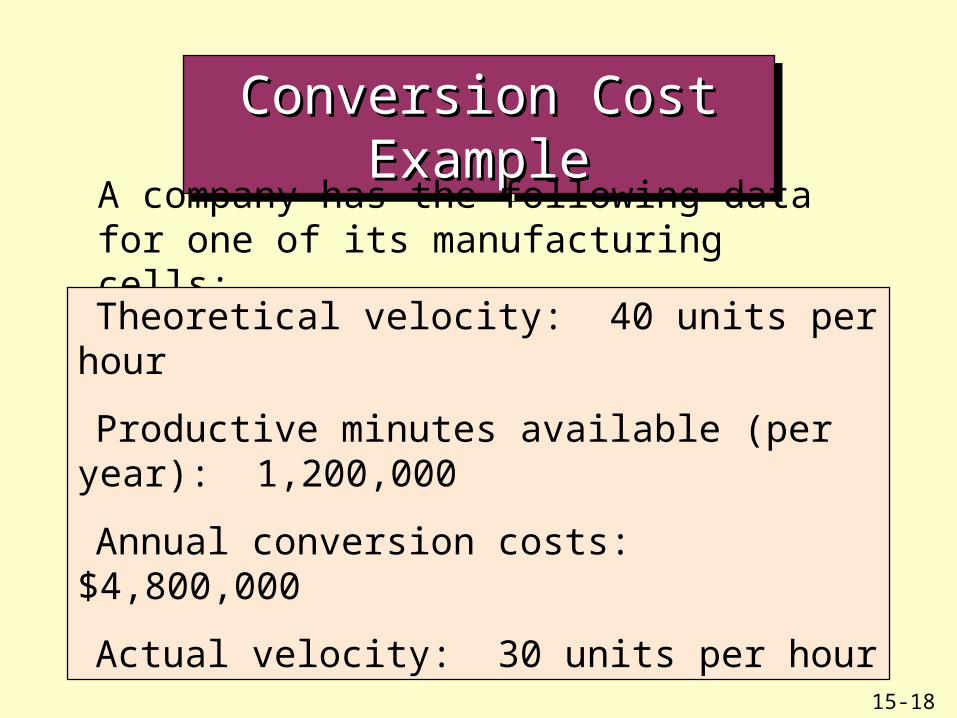
Conversion Cost ExampleConversion Cost ExampleConversion Cost ExampleConversion Cost Example
A company has the following data for one of its manufacturing cells:
Theoretical velocity: 40 units per hour
Productive minutes available (per year): 1,200,000
Annual conversion costs: $4,800,000
Actual velocity: 30 units per hour
15-19
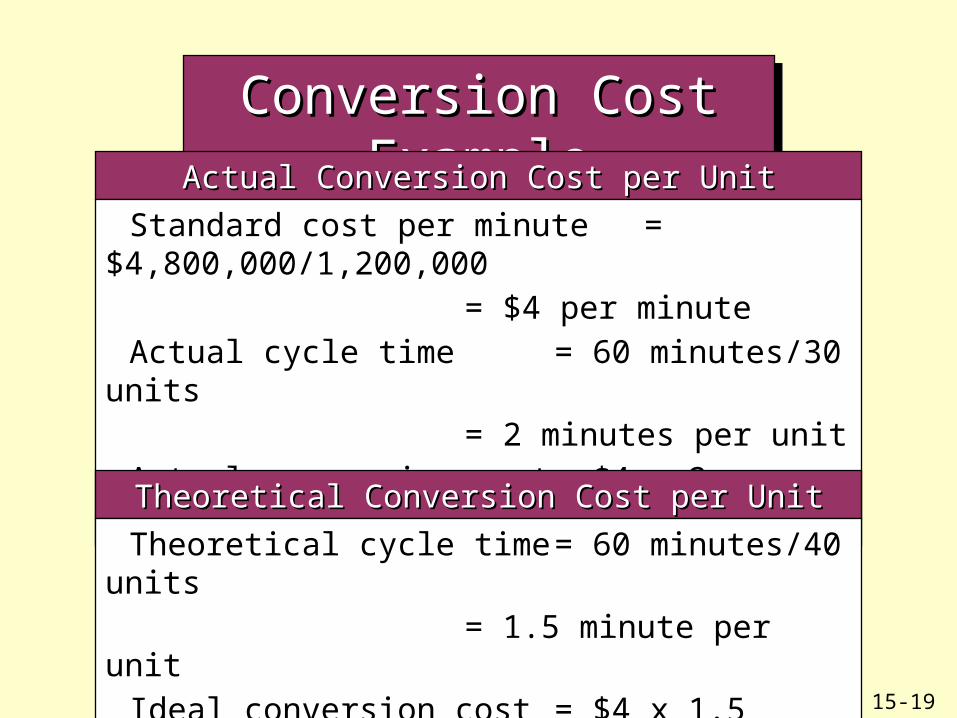
Conversion Cost ExampleConversion Cost ExampleConversion Cost ExampleConversion Cost Example
Actual Conversion Cost per UnitActual Conversion Cost per Unit
Standard cost per minute = $4,800,000/1,200,000
= $4 per minute
Actual cycle time = 60 minutes/30 units
= 2 minutes per unit
Actual conversion cost = $4 x 2
= $8 per unit
Theoretical Conversion Cost per UnitTheoretical Conversion Cost per Unit
Theoretical cycle time = 60 minutes/40 units
= 1.5 minute per unit
Ideal conversion cost = $4 x 1.5
= $6 per unit
15-20
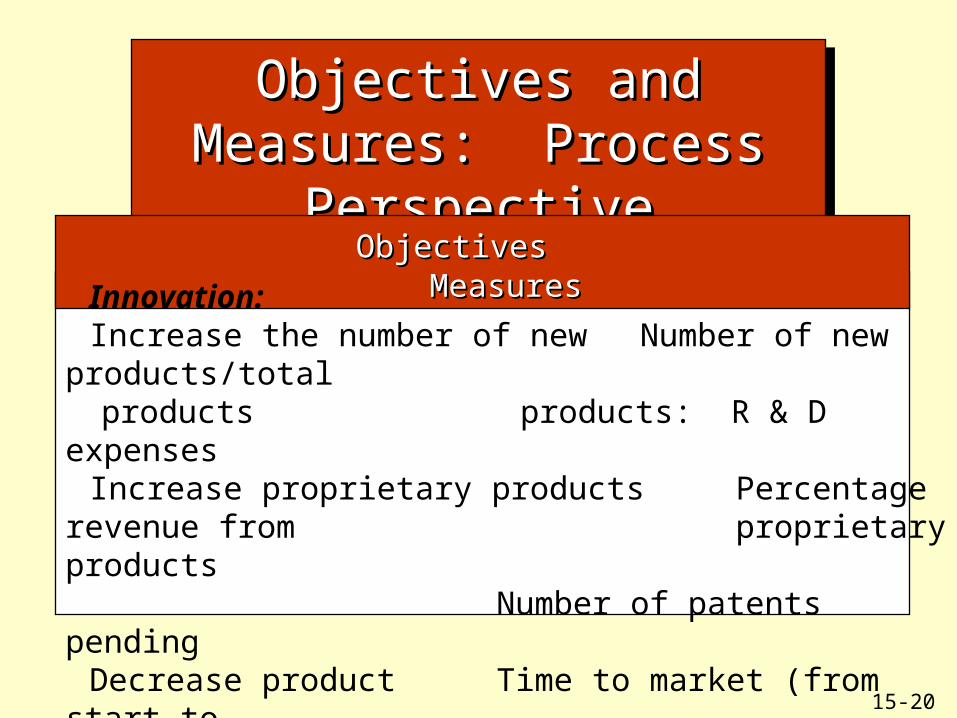
Objectives and Measures: Objectives and Measures: Process PerspectiveProcess Perspective
Objectives and Measures: Objectives and Measures: Process PerspectiveProcess Perspective
Objectives MeasuresObjectives Measures
Innovation:Increase the number of new Number of new products/totalproducts products: R & D expenses
Increase proprietary products Percentage revenue from proprietary products
Number of patents pendingDecrease product Time to market (from start todevelopment cycle time finish)
15-21
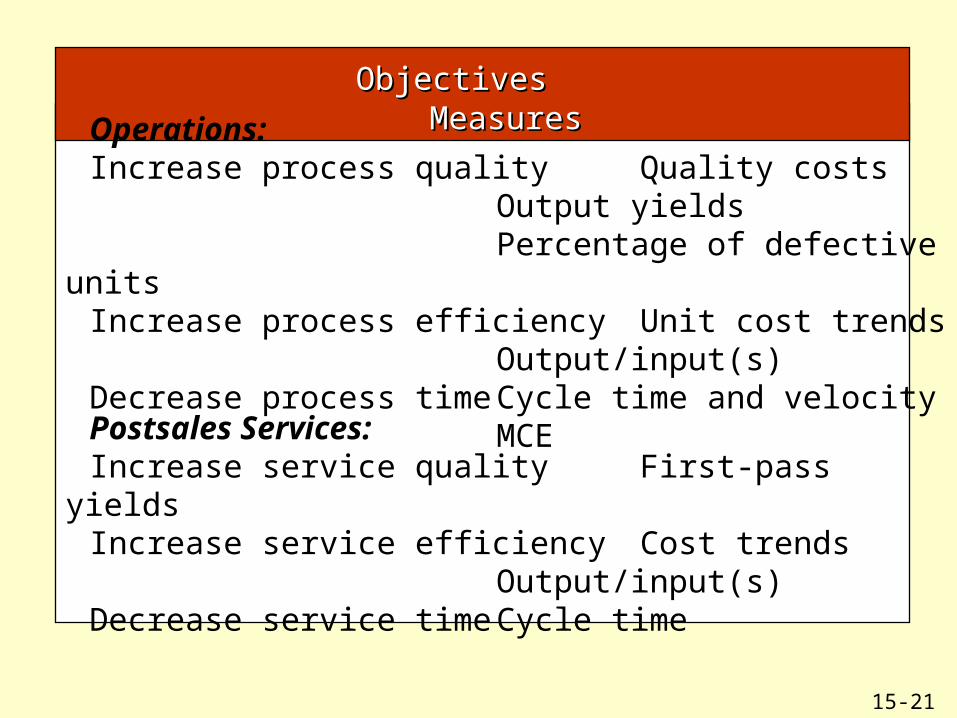
Objectives MeasuresObjectives Measures
Operations:Increase process quality Quality costs
Output yieldsPercentage of defective units
Increase process efficiency Unit cost trendsOutput/input(s)
Decrease process time Cycle time and velocityMCE
Postsales Services:Increase service quality First-pass yieldsIncrease service efficiency Cost trends
Output/input(s)Decrease service time Cycle time
15-22
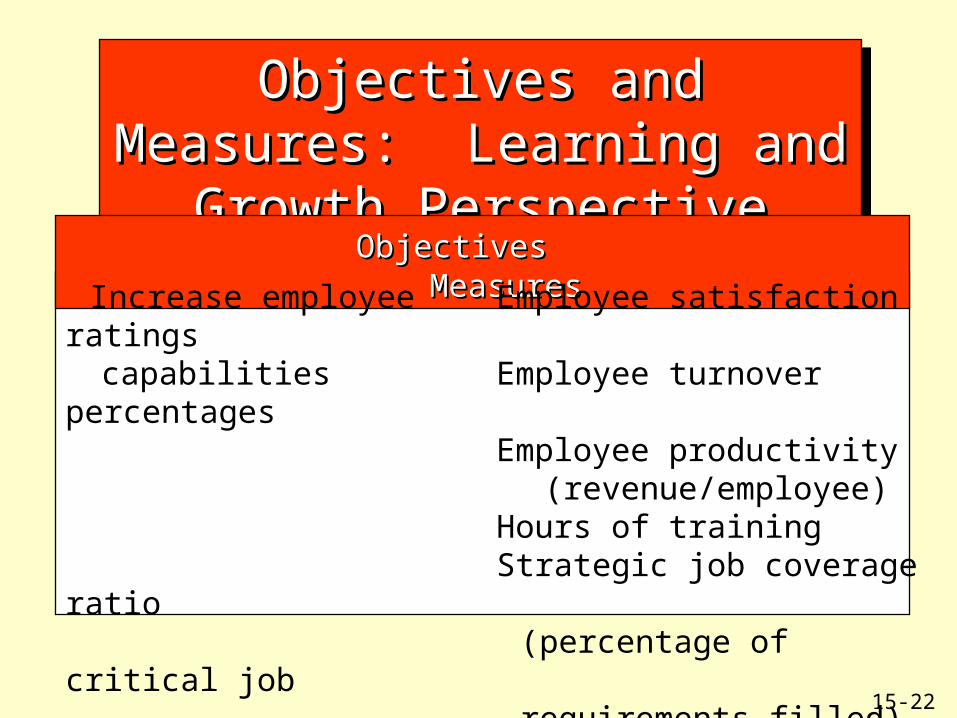
Objectives and Measures: Objectives and Measures: Learning and Growth PerspectiveLearning and Growth Perspective
Objectives and Measures: Objectives and Measures: Learning and Growth PerspectiveLearning and Growth Perspective
Objectives MeasuresObjectives Measures
Increase employee Employee satisfaction ratingscapabilities Employee turnover percentages
Employee productivity (revenue/employee)
Hours of trainingStrategic job coverage ratio
(percentage of critical jobrequirements filled)
15-23
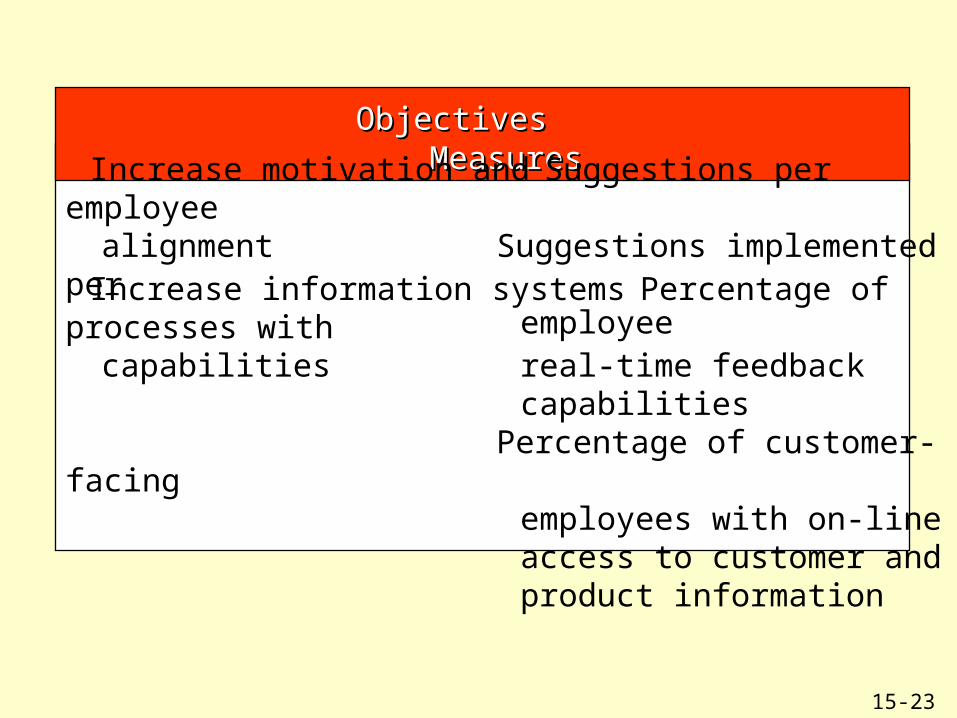
Objectives MeasuresObjectives Measures
Increase motivation and Suggestions per employeealignment Suggestions implemented per
employeeIncrease information systems Percentage of processes with capabilities real-time feedback
capabilitiesPercentage of customer-facing
employees with on-lineaccess to customer andproduct information
15-24
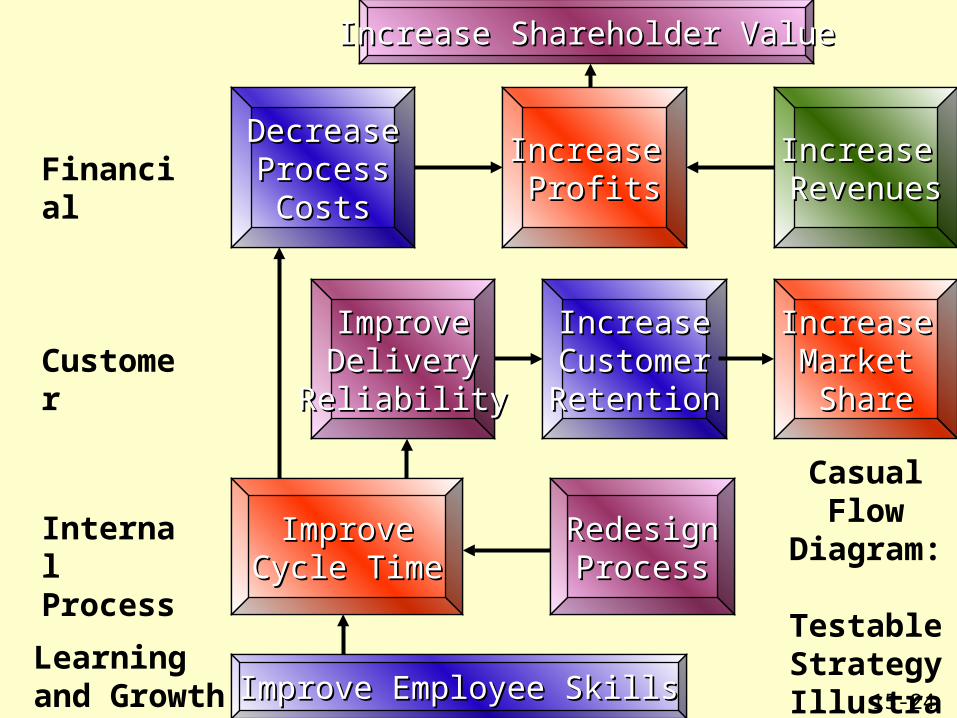
DecreaseDecreaseProcessProcessCostsCosts
Increase Increase ProfitsProfits
Increase Increase RevenuesRevenues
ImproveImproveDeliveryDelivery
ReliabilityReliability
IncreaseIncreaseCustomerCustomerRetentionRetention
Increase Increase Market Market ShareShare
ImproveImproveCycle TimeCycle Time
RedesignRedesignProcessProcess
Improve Employee SkillsImprove Employee Skills
Increase Shareholder ValueIncrease Shareholder Value
Casual Flow
Diagram: Testable Strategy
Illustrated
Financial
Customer
Internal Process
Learning and Growth
15-25
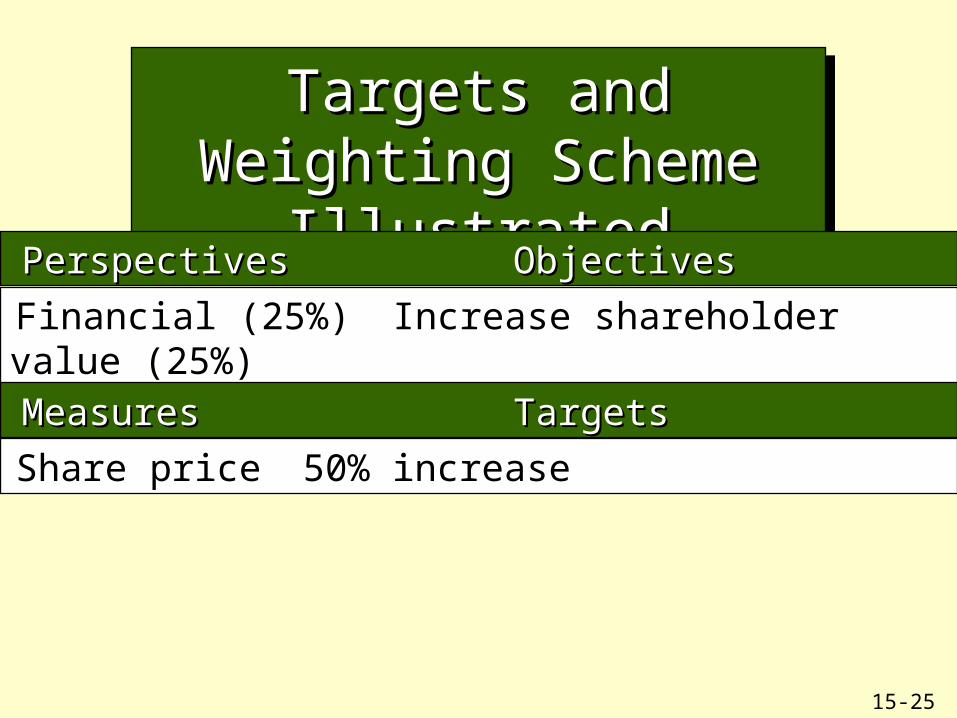
Targets and Weighting Targets and Weighting Scheme IllustratedScheme Illustrated
Targets and Weighting Targets and Weighting Scheme IllustratedScheme Illustrated
Perspectives Objectives Perspectives Objectives
Financial (25%) Increase shareholder value (25%)
Measures Targets Measures Targets
Share price 50% increase
15-26
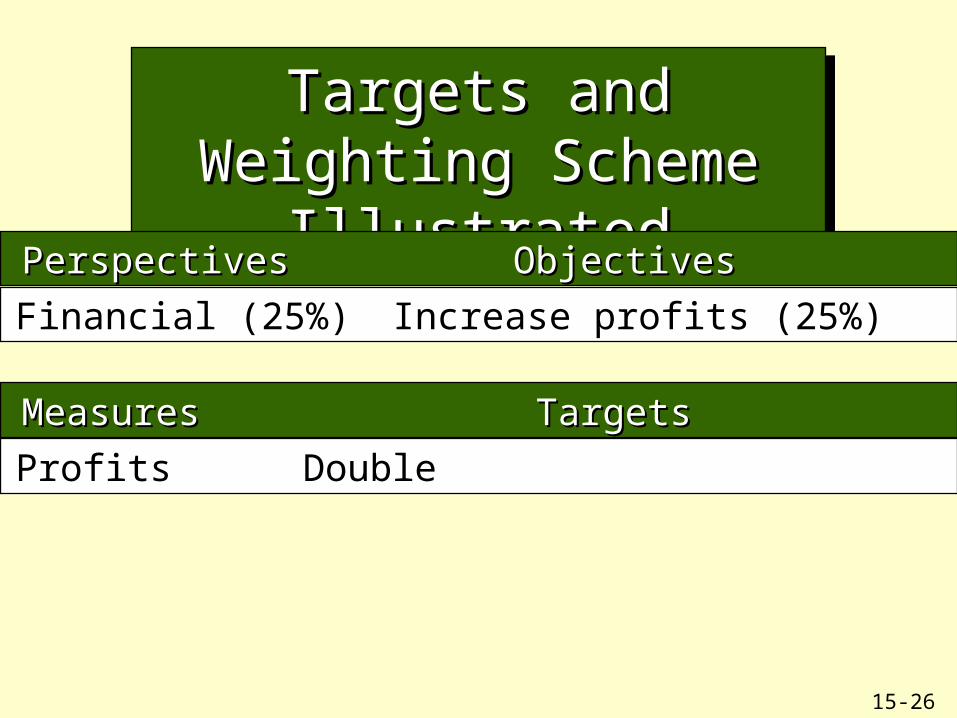
Targets and Weighting Targets and Weighting Scheme IllustratedScheme Illustrated
Targets and Weighting Targets and Weighting Scheme IllustratedScheme Illustrated
Perspectives Objectives Perspectives Objectives
Financial (25%) Increase profits (25%)
Measures Targets Measures Targets
Profits Double
15-27
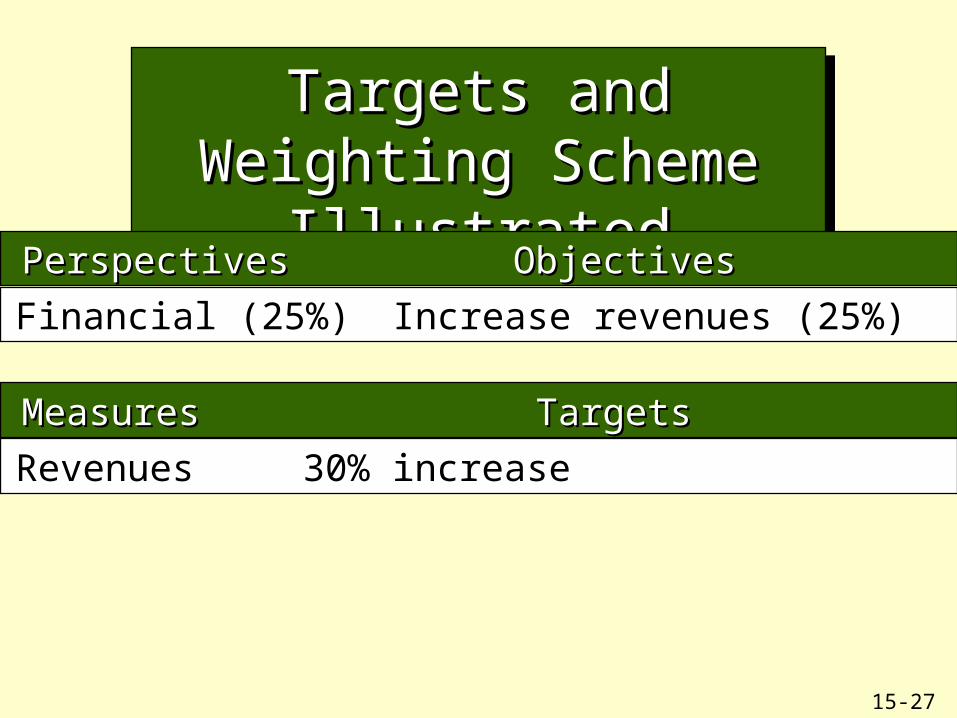
Targets and Weighting Targets and Weighting Scheme IllustratedScheme Illustrated
Targets and Weighting Targets and Weighting Scheme IllustratedScheme Illustrated
Perspectives Objectives Perspectives Objectives
Financial (25%) Increase revenues (25%)
Measures Targets Measures Targets
Revenues 30% increase
15-28
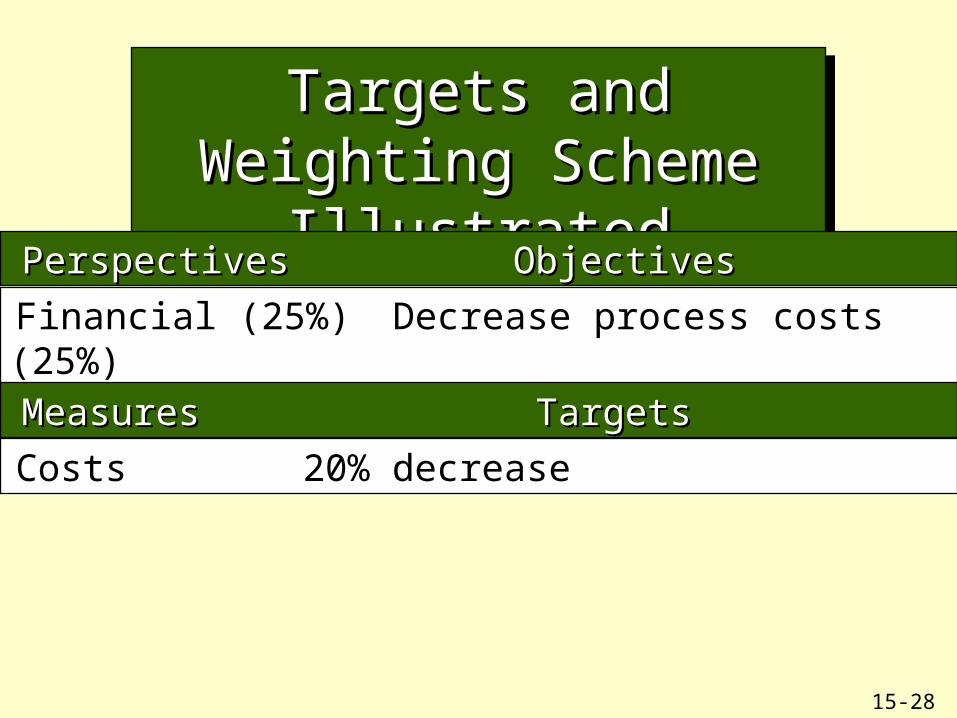
Targets and Weighting Targets and Weighting Scheme IllustratedScheme Illustrated
Targets and Weighting Targets and Weighting Scheme IllustratedScheme Illustrated
Perspectives Objectives Perspectives Objectives
Financial (25%) Decrease process costs (25%)
Measures Targets Measures Targets
Costs 20% decrease
15-29
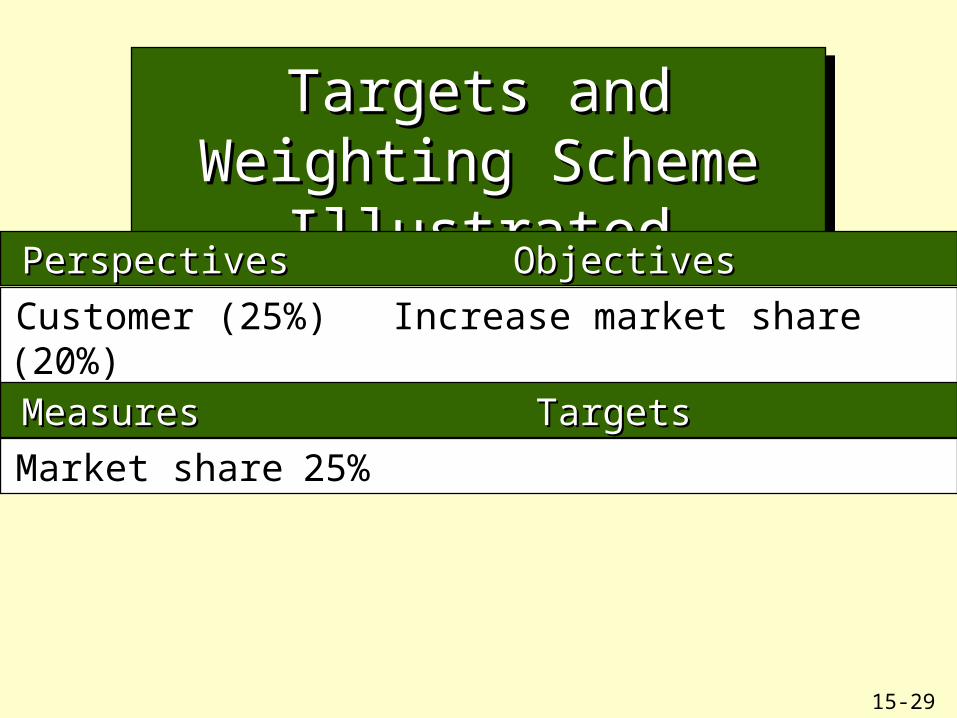
Targets and Weighting Targets and Weighting Scheme IllustratedScheme Illustrated
Targets and Weighting Targets and Weighting Scheme IllustratedScheme Illustrated
Perspectives Objectives Perspectives Objectives
Customer (25%) Increase market share (20%)
Measures Targets Measures Targets
Market share 25%
15-30
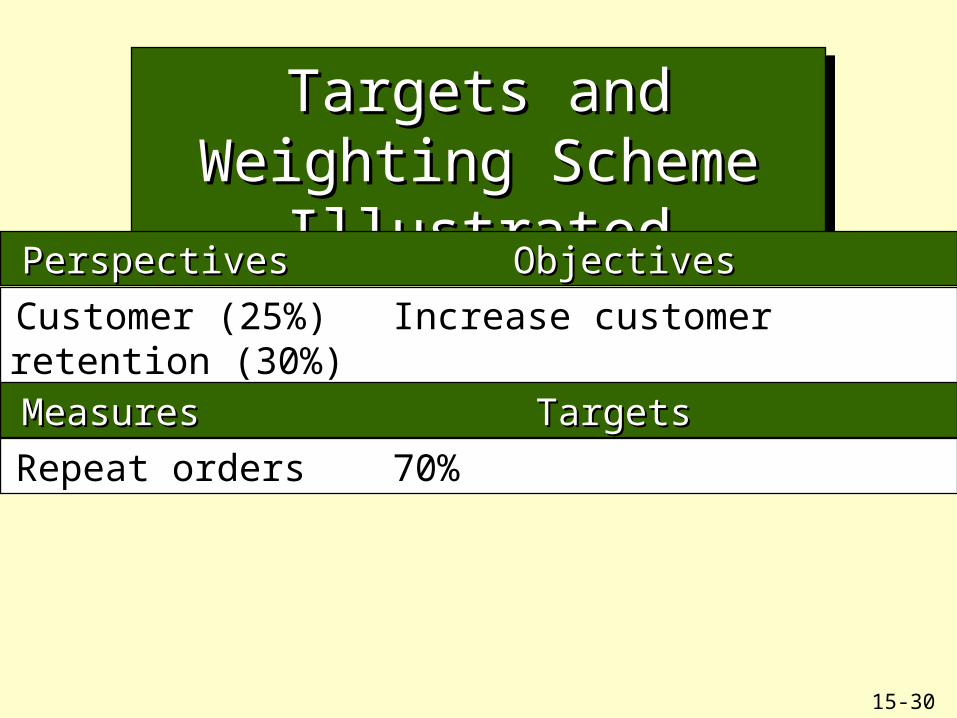
Targets and Weighting Targets and Weighting Scheme IllustratedScheme Illustrated
Targets and Weighting Targets and Weighting Scheme IllustratedScheme Illustrated
Perspectives Objectives Perspectives Objectives
Customer (25%) Increase customer retention (30%)
Measures Targets Measures Targets
Repeat orders 70%
15-31
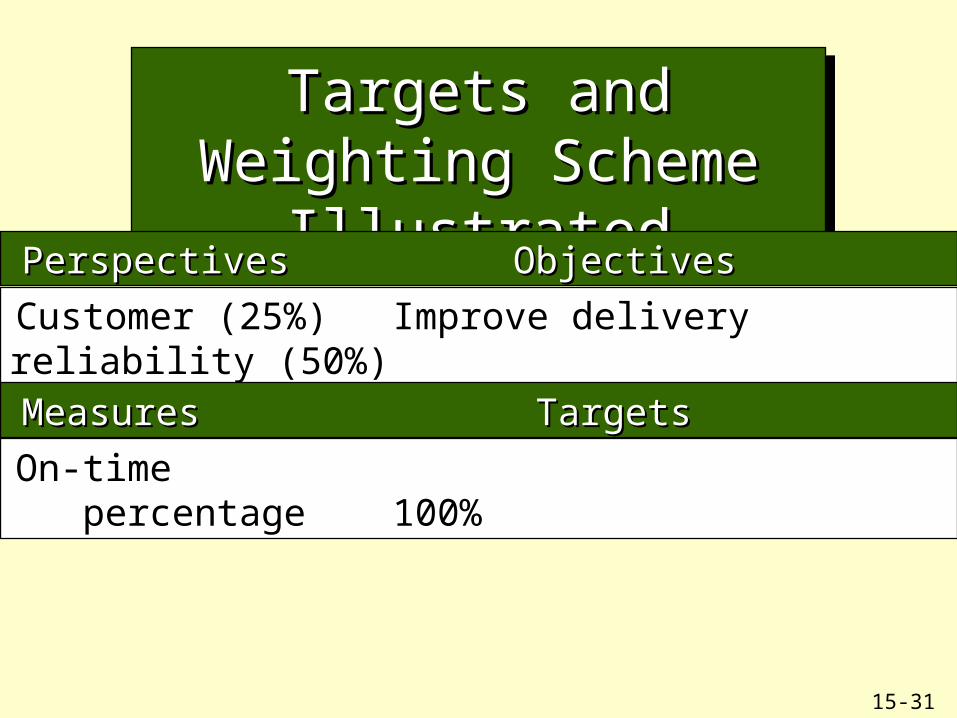
Targets and Weighting Targets and Weighting Scheme IllustratedScheme Illustrated
Targets and Weighting Targets and Weighting Scheme IllustratedScheme Illustrated
Perspectives Objectives Perspectives Objectives
Customer (25%) Improve delivery reliability (50%)
Measures Targets Measures Targets
On-time percentage 100%
15-32
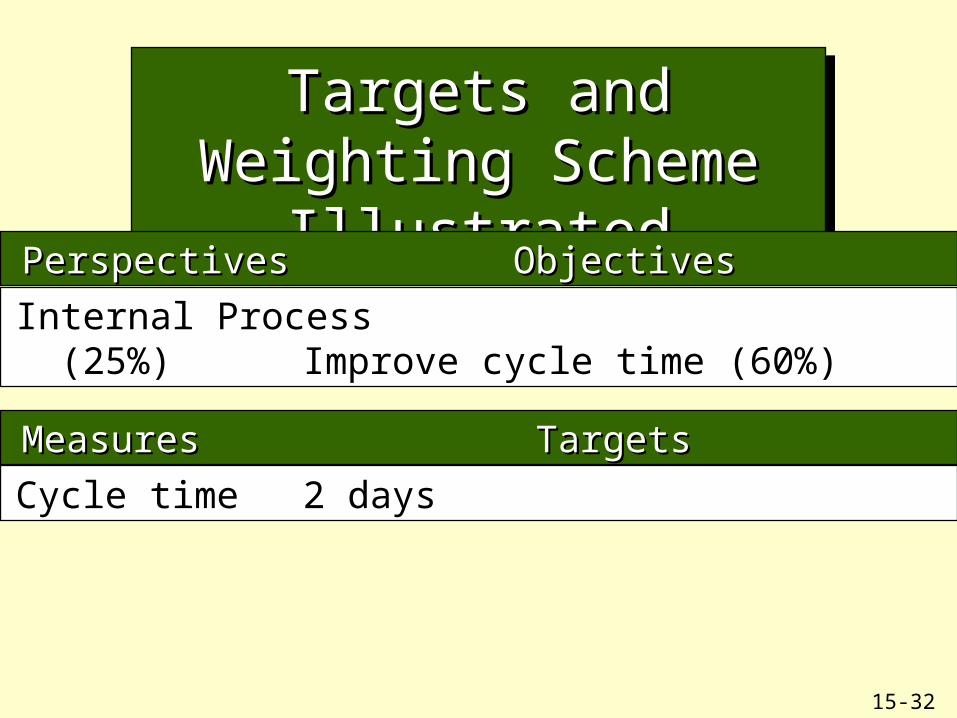
Targets and Weighting Targets and Weighting Scheme IllustratedScheme Illustrated
Targets and Weighting Targets and Weighting Scheme IllustratedScheme Illustrated
Perspectives Objectives Perspectives Objectives
Internal Process (25%) Improve cycle time (60%)
Measures Targets Measures Targets
Cycle time 2 days
15-33
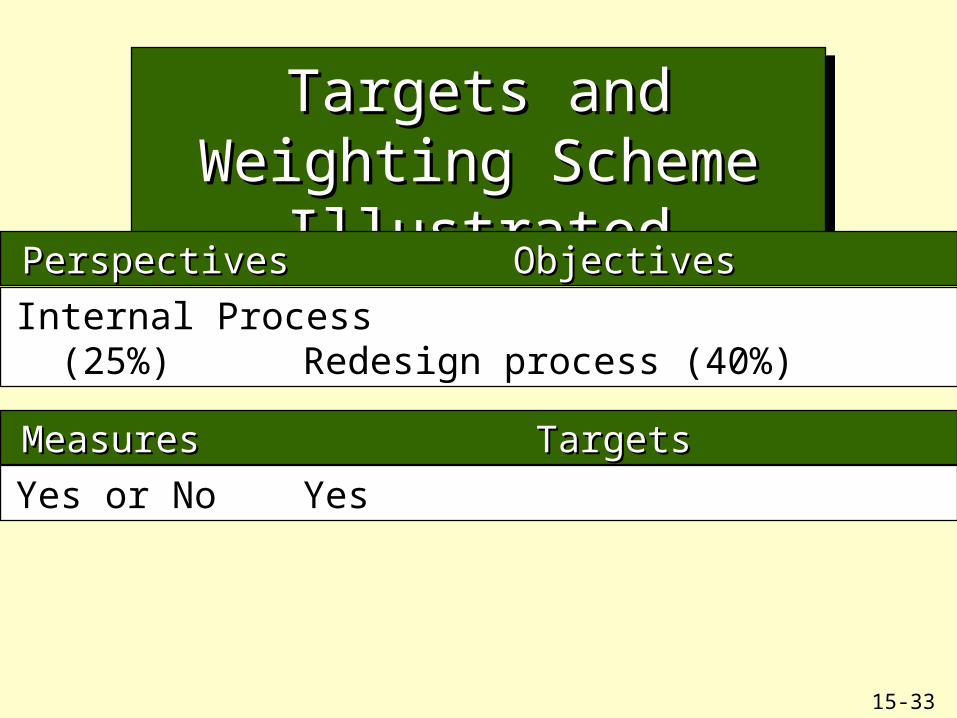
Targets and Weighting Targets and Weighting Scheme IllustratedScheme Illustrated
Targets and Weighting Targets and Weighting Scheme IllustratedScheme Illustrated
Perspectives Objectives Perspectives Objectives
Internal Process (25%) Redesign process (40%)
Measures Targets Measures Targets
Yes or No Yes
15-34
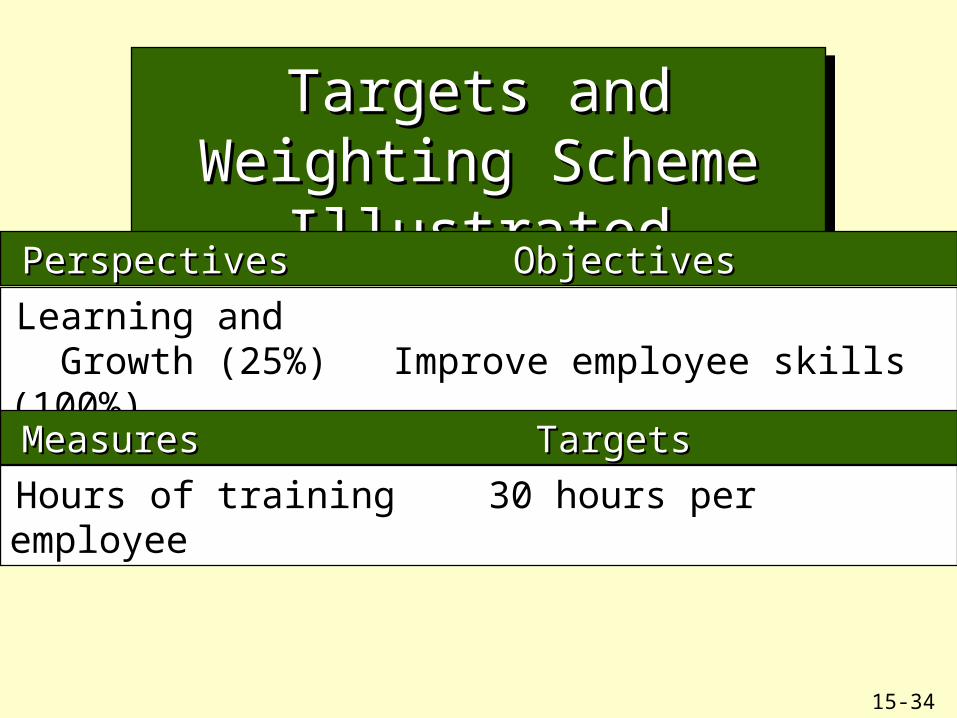
Targets and Weighting Targets and Weighting Scheme IllustratedScheme Illustrated
Targets and Weighting Targets and Weighting Scheme IllustratedScheme Illustrated
Perspectives Objectives Perspectives Objectives
Learning and Growth (25%) Improve employee skills (100%)
Measures Targets Measures Targets
Hours of training 30 hours per employee

15-35
ChapteChapterr
End ofEnd of

15-36