Embed Size (px)
Citation preview

Petrophysics MSc Course Notes The Neutron Log
Dr. Paul Glover Page 150
15. THE NEUTRON LOG
15.1 Introduction
The neutron log is sensitive mainly to the amountof hydrogen atoms in a formation. Its main use isin the determination of the porosity of a formation.
The tool operates by bombarding the formationwith high energy neutrons. These neutronsundergo scattering in the formation, losing energyand producing high energy gamma rays. Thescattering reactions occur most efficiently withhydrogen atoms. The resulting low energyneutrons or gamma rays can be detected, and theircount rate is related to the amount of hydrogenatoms in the formation.
In formations with a large amount of hydrogenatoms, the neutrons are slowed down and absorbedvery quickly and in a short distance. The countrate of slow neutrons or capture gamma rays is lowin the tool. Hence, the count rate will be low inhigh porosity rocks.
In formations with a small amount of hydrogenatoms, the neutrons are slowed down and absorbedmore slowly and travel further through the rockbefore being absorbed. The count rate of slowneutrons or capture gamma rays in the tool istherefore higher. Hence, the count rate will behigher in low porosity rocks.
Figure 15.1 shows a typical neutron tool.
Figure 15.1 A typical neutron tool.

Petrophysics MSc Course Notes The Neutron Log
Dr. Paul Glover Page 151
15.2 Theory
In neutron logging there are three processes of interest: neutron emission, neutron scattering andneutron absorption.
15.2.1 Neutron Emission
The neutron tool emits high energy (4.5 MeV) neutrons from a radioactive source. They move veryfast, and their energy is related to their speed. They are called fast neutrons. The neutron sources usedin logging are a mixture of two elements (i) a source of alpha radiation such as radium, plutonium oramericium, and (ii) beryllium-9. The alpha particles from the radium, plutonium or americium interactwith the beryllium-9 in an atomic reaction that produces carbon-12, a fast neutron and gamma rays.
(15.1)
15.2.2 Neutron Scattering
The fast neutrons interact with the nuclei of atoms within the formation. The interaction is a form ofelastic scattering involving the neutrally charged neutron and a stationary positively charged nucleus.At each interaction (collision) the neutron looses some energy and slows down, and the nucleus of theatom in the formation material gains energy. Such collisions occur with nuclei of ALL elements.However, the process of energy transfer (i.e., energy loss from the neutron) is most efficient when themasses of the neutron and the nucleus are the same, and becomes much less efficient when the nucleiof the formation material are more massive than the neutron. The neutron has approximately the samemass as hydrogen nuclei (the lightest element). Hence the neutrons lose energy by elastic scatteringmost efficiently by interaction with hydrogen nuclei, and lose energy much less efficiently byinteraction with more massive nuclei such as silicon or oxygen. Figure 15.2 shows the efficiency ofseveral elements in slowing down fast neutrons.
Figure 15.2 The fast neutron slowing efficiency of hydrogen, silicon and oxygen atoms as a functionof neutron energy for a clean sandstone, φ = 0.15.
γ++⇒+ nCHeBe 10
126
42
94
1
0.1
0.01
0.0010.1 10 1000 10
7105
Neutron Energy (eV)
Slo
win
g D
ow
n P
ow
er
Silicon
Oxygen
Hydrogen
Petrophysics MSc Course Notes The Neutron Log
Dr. Paul Glover Page 152
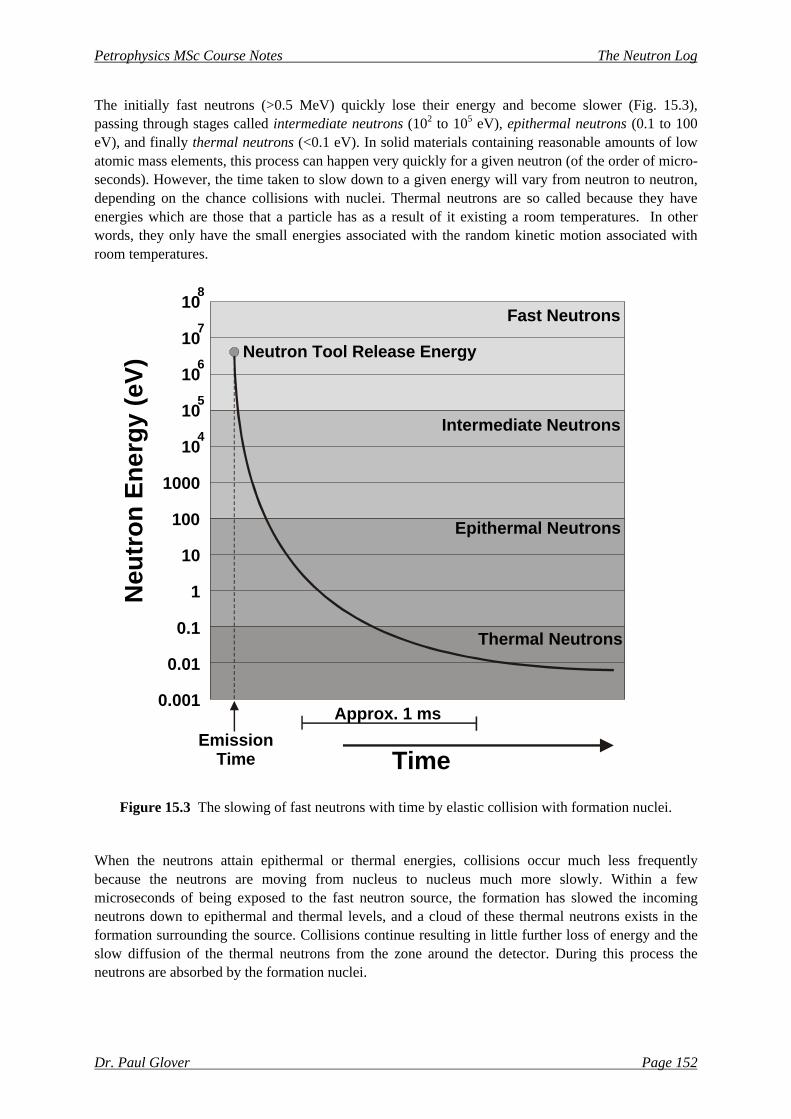
The initially fast neutrons (>0.5 MeV) quickly lose their energy and become slower (Fig. 15.3),passing through stages called intermediate neutrons (102 to 105 eV), epithermal neutrons (0.1 to 100eV), and finally thermal neutrons (<0.1 eV). In solid materials containing reasonable amounts of lowatomic mass elements, this process can happen very quickly for a given neutron (of the order of micro-seconds). However, the time taken to slow down to a given energy will vary from neutron to neutron,depending on the chance collisions with nuclei. Thermal neutrons are so called because they haveenergies which are those that a particle has as a result of it existing a room temperatures. In otherwords, they only have the small energies associated with the random kinetic motion associated withroom temperatures.
Figure 15.3 The slowing of fast neutrons with time by elastic collision with formation nuclei.
When the neutrons attain epithermal or thermal energies, collisions occur much less frequentlybecause the neutrons are moving from nucleus to nucleus much more slowly. Within a fewmicroseconds of being exposed to the fast neutron source, the formation has slowed the incomingneutrons down to epithermal and thermal levels, and a cloud of these thermal neutrons exists in theformation surrounding the source. Collisions continue resulting in little further loss of energy and theslow diffusion of the thermal neutrons from the zone around the detector. During this process theneutrons are absorbed by the formation nuclei.
0.001
0.1
1
10
100
1000
0.01
10
10
10
10
108
7
5
6
4
Time
Neu
tro
n E
ner
gy
(eV
)
Approx. 1 ms
EmissionTime
Thermal Neutrons
Fast Neutrons
Epithermal Neutrons
Intermediate Neutrons
Neutron Tool Release Energy

Petrophysics MSc Course Notes The Neutron Log
Dr. Paul Glover Page 153
15.2.3 Neutron Absorption
Thermal (and to some extent epithermal) neutrons can be absorbed by the nuclei of the formationatoms. The efficiency of neutron absorption varies from element to element. The only elements whichexhibit significant neutron absorbing behaviour and exist is reasonable quantities in rocks arehydrogen and chlorine. The process of neutron absorption by hydrogen and chlorine are
(15.2)
and
(15.3)
In neutron logging, some tools measure the epithermal neutrons, some the thermal neutrons and somethe gamma rays emitted when a neutron is absorbed.
15.2.4 Hydrogen Index
We can define a partial concentration of hydrogens per unit mass (CH)mass of a material as the mass ofhydrogen atoms in the material divided by the mass of all the atoms of all elements in the material.
(15.4)
where: AH = the atomic mass of hydrogen atoms in the materialAi = the atomic mass of non-hydrogen element inH = the number of hydrogen atoms in a molecule of the materialni = the number of non-hydrogen atoms of element i in a molecule of the materialNote: i is summed over every non-hydrogen element in the material.
Thus, for pure water (H2O), where the atomic mass of hydrogen is 1.0 and the atomic mass of oxygenis 16.0, the partial concentration of hydrogen (CH)mass = (2×1.0)/(1×16.0 + 2×1.0) = 1/9.
It is simple to obtain the partial concentration of hydrogens per unit volume (CH)vol, by multiplying thepartial concentration of hydrogens per unit mass by the density of the material, (CH)vol = ρb×(CH)mass.Hence, the partial concentration of hydrogens per unit volume (CH)vol = ρbwater/9 = 1/9, because thedensity of pure water is 1.000 g/cm3.
Now, the Hydrogen Index of a material is defined as the partial concentration of hydrogens per unitvolume relative to water. So, if the hydrogen index of water is constrained by the definition to beunity, and water has a partial concentration of hydrogens per unit volume of 1/9, the hydrogen index ofa material is
(15.5)
where: AH = the atomic mass of hydrogen atoms in the materialAi = the atomic mass of non-hydrogen element i
γ+⇒+ HnH 21
10
11
γ+⇒+ ClnCl 3617
10
3517
bHH
iii
HH
AnAn
AnHI ρ
+=
∑9
( )HH
iii
HHmassH AnAn
AnC
+=
∑

Petrophysics MSc Course Notes The Neutron Log
Dr. Paul Glover Page 154
nH = the number of hydrogen atoms in a molecule of the materialni = the number of non-hydrogen atoms of element i in a molecule of the materialNote: i is summed over every non-hydrogen element in the material.
Table 15.1 shows Eq. (15.5) in practice for a few minerals and fluids commonly found in reservoirs.
Table 15.1 Hydrogen index calculations for some reservoir minerals and fluids.
Compound Formula Ai ni nH ρρb HI
Pure water H2O 16 1 2 1.000 1.000Oil (CH2)x 12 1 2 0.780 1.003
Methane CH4 12 1 4 ρm 2.25×ρm
Gas C1.1H4.2 12 1.1 4.2 ρg 2.17×ρg
Quartz SiO2 28, 16 1, 2 0 2.654 0.000Calcite CaCO3 40, 12, 16 1, 1, 3 0 2.710 0.000
Gypsum CaSO4.2H2O 40, 32, 16 1, 1, 6 4 2.320 0.4855
Note the following:
• If the tool is in 100% water (a large tank of the stuff, say), the HI = 1.000. This is equivalent to arock of 100% porosity saturated with water. So we have a fixed point that HI = 1 represents φ = 1.
• If the tool is in a pure limestone rock with zero porosity, the HI = 0.000, because there are nohydrogen atoms in the solid matrix of calcite. So we have a second fixed point where HI = 0represents φ = 0.
• If the tool is in a pure limestone with a given porosity φ, the hydrogen index will be directlyproportional to the amount of water in the formation. Hence HI = φ for completely water saturatedlimestones.
Thus the hydrogen index is a proxy measure of porosity if the solid minerals of the formation containno hydrogen and if the pores are completely saturated with water. But, it is the hydrogen index thatcontrols the count rate observed by the neutron tool. Hence we have a tool that can measure porosity inwater saturated formations where the matrix minerals contain no hydrogen.
In practice, it is not only hydrogen that affects the passage of neutrons in a formation. As we can seefrom Fig. 15.2, other rock forming elements have an effect on the slowing down of neutrons in theformation, but their effect is small compared with hydrogen, and when it comes to neutron absorption,both chlorine and hydrogen have a part to play. The small errors that are introduced by assuming thatit is just hydrogen that affects neutrons are overcome by calibrating the tool. The tool is calibrated inpure limestone, and hence does not give true porosities. Instead it gives equivalent porosities thatwould occur if the rock was measuring limestone. This will be discussed in further detail in Section 4.
The Hydrocarbon Effect. Note in Table 15.1 that the hydrogen indices of water and oil areapproximately the same because the effect of their different compositions on the partial concentrationof hydrogens per unit volume is approximately balanced by the difference in their density.
As with the formation density tool, the zone of investigation of the neutron tool is constrained to theflushed zone. Hence, the tool will measure the hydrogen index associated mainly with the mud filtrate,

Petrophysics MSc Course Notes The Neutron Log
Dr. Paul Glover Page 155
together with whatever remains of the hydrocarbons and formation water in the formation. Imagine,for example that we are in an oil zone in a limestone, the mud filtrate almost completely replaces theformation fluids such that there is a saturation of mud filtrate SXO, and a residual saturation ofhydrocarbons (1- SXO). The porosity read by the neutron tool is related to the actual porosity in theformation by
(15.5)
If the hydrocarbon is oil, this equation reduces to φN ≈ φ , because, as we have seen in Table 15.1 thehydrogen index of water and oils is similar; HImf ≈HIhc. This is true whether the mud filtrate is oil-based or water-based.
(15.6)
If the hydrocarbon is methane gas with a density of 0.1 g/cm3, the equation reduces to
(15.7)
If the saturation in the flushed zone SXO = 0.7, Eq. (15.7) reduces to φN = 0.77 φ. This is known as thehydrocarbon effect in the neutron log.
The Chlorine Effect. Some types of neutron tool measure the thermal neutrons and gamma raysproduced during the capture of neutrons. There are only two elements that are found in reservoirs thatcontribute significantly to neutron absorption; hydrogen and chlorine. The presence of hydrogen in thefluids is what we want to measure, so this is not a problem.
However, if the drilling mud, mud filtrate or formation fluids contain a significant amount of dissolvedchloride ions, as is often the case, the tool will measure a lower flux of neutrons and henceoverestimate the porosity. This is called the chlorine effect, and is present in wells drilled or logged inthe presence of drilling muds containing dissolved chlorine, or in formations where the formationwaters are particularly salty.
The Shale Effect. Shale contain clays that have a significant amount of surface absorbed (bound)water. Hence shales can contain a significant proportion of hydrogens despite being low porosity. Theapparent porosity read from the neutron tool in shale formations is therefore always significantlyhigher than it really is. This is called the shale effect or the bound-water effect, and will be discussedfurther later in this chapter.
( )[ ]XOhcXOmfN SHISHI −+= 1φφ
( )[ ] φφφ ≈−×+×= XOXON SS 1003.100.1
( )[ ]XOXON SS −××+×= 11.025.200.1φφ

Petrophysics MSc Course Notes The Neutron Log
Dr. Paul Glover Page 156
15.3 Tool Operation
There are three main types of neutron tool, which are:
• The Gamma Ray/Neutron Tool (GNT)• The Sidewall Neutron Porosity Tool (SNP)• The Compensated Neutron Log (CNL)
15.3.1 Gamma Ray/Neutron Tool (GNT)
This tool has a neutron source and a single detector that is sensitive to high energy capture gammarays and thermal neutrons and is non-directional. The tool can be run in either open or cased holes, andin both cases is run centered. A 3-3/8 inches diameter tool is used in open holes, and a 1-11/16 or 2inch diameter tool is used in cased holes. The source to detector spacing varies between toolmanufacturers, but is in the range 15.5 to 19.5 inches. Because the tool is centered, the detectedneutrons and gamma rays have to travel through both mudcake and drilling mud. Hence, this tool ishighly sensitive to changes in borehole quality, temperature, type of drilling mud, and mudcakethickness. Correction curves are available from the tool manufacturers to correct the log data fortemperature, hole diameter, and the effect of drilling mud and mudcake.
Because the tool measures the thermal neutrons and the capture gamma rays, it is effected by theprocess of neutron capture by chlorine. Since drilling mud, mud filtrate and formation waters maycontain significant amounts of dissolved chloride ions, the measurement can give erroneous values.Erroneous values take the form of overestimated porosities in formations either drilled with mudscontaining dissolved chloride ions, or salty formation fluids.
15.3.2 Sidewall Neutron Porosity Tool (SNP)
This tool is designed for use in open holes only. The tool has a source and a single detector with a 16inch spacing, which are mounted on a skid that is pressed against the borehole wall. Often this will bethe same carrier that holds the formation density source and detector. Because the tool is pressedagainst the borehole wall, the drilling mud does not affect the measurement, and the attenuation due tothe mudcake is reduced. However rough holes can cause misalignment of the either the source of thedetector with the borehole wall, and hence give erroneous readings.
The detector is sensitive to epithermal neutrons. These neutrons are not yet slow enough to take part inabsorption reactions with hydrogen and chlorine. Hence, the SNP tool readings are unaffected by thepresence of chlorine in high salinity muds and formation fluids.
15.3.3 Compensated Neutron Log (CNL)
This tool is designed to be sensitive to thermal neutrons, and is therefore affected by the chlorineeffect. It has two detectors situated 15 in and 25 in from the source. The detector further from thesource is larger to ensure that adequate count rates are observed. The critical measurement for this toolis the difference in the thermal neutron population, which results from neutron capture and neutronscattering. The tool readings are presented in limestone porosity units in the same way as the sidewallneutron porosity tool. The CNL tool has a very strong source of neutrons to ensure that the measuredcount rates are sufficiently high to obviate any significant errors associated with statistical fluctuations

Petrophysics MSc Course Notes The Neutron Log
Dr. Paul Glover Page 157
in the count rate despite the longer source-detector spacing for this tool compared to the GNT and SNPtools. The stronger source permits a deeper depth of investigation as well as allowing the tool tooperate in cased holes. The CNL tool is run eccentred in the hole by an arm which presses the toolagainst the side of the borehole. This means that the tool is insensitive to the type of mud in the hole,but implies that the readings are only for one portion of the borehole wall. The CNL log is shown inFig. 15.4.
Figure 15.4 The CNL tool (Schlumberger).
15.4 Log Presentation
The data from all tool types are recorded in tracks 2 and 3.
The data from the GNT tool is given in API units as shown in Fig. 15.5.
The data from the SNP tool is given in equivalent limestone porosity units, with the scale runningfrom approximately –10% to 30%, as shown in Fig. 15.6.
Data from the CNL tool is given in equivalent limestone porosity units, with the scale running fromapproximately –10% to 30%, as shown in Fig. 15.7.
Formation Wire or other tool
Sprung-loadedarm
End of toolor other tool
Source
Near Detector
Far Detector

Petrophysics MSc Course Notes The Neutron Log
Dr. Paul Glover Page 158
Figure 15.5 Log presentation for the GNT tool.
Figure 15.6 Log presentation for the SNP tool.
6 16CAL (in)
166Bit Size (in)
Dep
th (
m)
1050
1055
3360160GNT (NAPI)
1000SGR (GAPI)
6 16CAL (in)
166Bit Size (in)
Dep
th (
m)
1050
1055
-1545SNP (%)
1500GR (GAPI)

Petrophysics MSc Course Notes The Neutron Log
Dr. Paul Glover Page 159
Figure 15.7 Log presentation for the CNL tool.
15.5 Calibration
15.5.1 The GNT Tool
The primary standard for this tool is the API Neutron Calibration Pit at the University of Houston.This pit contains three blocks of carbonate with accurately known porosities that are filled with freshwater that are drilled to accept a tool. The tool is calibrated in 19% porosity Indiana limestone, forwhich an API value of 1000 API neutron units is defined. The response of the tool is then checked in1.9% Carthage Marble, 26 % Austin limestone, and 100% fresh water. A tool tested at Houston is usedas a secondary reference for the calibration of other tools at the wireline company’s workshops aroundthe globe. A wellsite check on the calibration of a tool is also carried out before and after running thetool using a neutron source of accurately known radioactivity.
15.5.2 The SNP and CNL Tools
These tools are calibrated in blocks of limestone, sandstone and dolomite of high purity and accuratelyknown porosity in test pits. The tools are calibrated, not to give readings in API neutron porosity units,but to give the porosity directly in percent. Limestone is chosen as the calibrating lithology, so thereadings are given in limestone porosity units.
IMPORTANT The common use of limestone porosity units as the calibrating unit for these logsmeans that the reading of porosity in a limestone formation will be exact, but the reading of porosity inthese units in any other formation lithology will need correction (Fig. 15.8).
6 16CAL (in)
166Bit Size (in)
Dep
th (
m)
1050
1055
-1545CNL(%)
1000SGR (GAPI)

Petrophysics MSc Course Notes The Neutron Log
Dr. Paul Glover Page 160
Figure 15.8 Correction chart for obtaining porosity values for lithologies other than limestone.
The SNP tool is calibrated at the wellsite uses a U-shaped polyethylene baffle (artificial formation)with a two position baffle, where the geometry of the block and baffle arrangements are known toresult in readings equivalent to 11% porosity and 22% porosity.
The calibration of the CNL tool is checked at the wellsite before and after each logging run by the useof a neutron source of accurately known activity placed a standard distance from each detector.
15.6 Depth of Investigation
The depth of penetration of the tool readings depends directly upon the amount of hydrogens in theformation. Thus, for porous rocks that contain water or hydrocarbons (i.e., many hydrogens), there ismuch neutron scattering and absorption, and hence the depth of investigation is small. For lowporosity rocks containing water or hydrocarbons, there are fewer hydrogens in the formation and thedepth of investigation is larger.

Petrophysics MSc Course Notes The Neutron Log
Dr. Paul Glover Page 161
The presence of gas in a formation increases the depth of investigation because, although the gas maycontain hydrocarbons, the gas has a vary low density compared to liquid water and oil, and hence avery low hydrogen index.
The presence of shales decreases the depth of investigation because even low porosity shales containmany waters (i.e., hydrogen) that are bound to the surface of the clay crystals.
The depth of investigation of the CNL tool in a water saturated formation of 35% porosity is about 12inches, and that of the SNP tool in the same formation is about 8 inches.
15.7 Vertical Resolution
As with most tools the vertical resolution is defined by the source detector spacing for single detectortools and the spacing between the two detectors for dual detector tools. The vertical resolution ofneutron tools is a little greater than these spacings. For the GNT tool the vertical resolution is 16inches or 20 inches depending upon which of the two source-detector spacings possible for this toolare used. The vertical resolution of the SNP tool is 16 inches, and for the CNL tool is 10 inches.
As usual, the true bed resolution (the thinnest bed for which the true neutron porosity reading in thatbed is measured) is approximately three times the vertical resolution (i.e., 36 to 48 inches). Thinnerbeds will be noticed by the tool, but the apparent porosity will not be the same as the true porosity ofthe bed.
The measuring point for these tools is half way between the source and the detector for single detectortools, and half way between the two detectors for the dual detector tool.
15.8 Borehole Quality
The GNT tool is run centered in the borehole, and is therefore sensitive to the effect of caving andwash-out due to the attenuation of gamma rays and neutrons by the larger annulus of drilling mudaround the tool. As the diameter of the borehole increases, more of the signal that the tool measuresrepresents the borehole, and less comes from the formation. Clearly, there is a degree of caving wherethe signal measured by the tool is no longer representative of the formation, and then the tool cannotbe used. This problem is accentuated by the presence of chloride ions in the drilling mud (i.e., a saltwater-based mud), where attenuation by the drilling mud can lead to grossly erroneous porosityreadings.
The SNP and CNL tools are run pressed up against the borehole wall. In this case, the roughness of theborehole wall due to caving or wash-out can result in the detectors or source not being pressed directlyup against the borehole wall. This will cause erroneous porosity readings.

Petrophysics MSc Course Notes The Neutron Log
Dr. Paul Glover Page 162
15.9 Mud Type
The tools can be used in most types of mud.
The GNT tool is sensitive to chloride-rich muds, and its results must then be corrected for the drillingmud, mudcake and mud filtrate.
The SNP tool is not sensitive to the chloride effect and is run pressed against the borehole wall. Themudcake tends to increase the apparent porosity because the mudcake has a high hydrogen index. Thiseffect can be corrected for.
The detectors of the CNL tool are sensitive to the chloride effect. However, the tool is run pressedagainst the borehole wall so the effect of the drilling mud is not included in the measurement.Furthermore, the use of two detectors automatically compensates for the effect of chloride-richmudcake and mud filtrate.
The density of the mud also affects the readings, because high density muds attenuate the radiation toa greater extent. This is usually only a problem for the GNT tool, where the effect can be compensatedfor using correction charts.
15.10 Uses of the Neutron Log
15.10.1 Determination of Porosity
The main use of the neutron log is to provide porosity information.
The tool is sensitive to the amount of hydrogens in the formation and to a less extent upon otherelements. It is assumed that the contribution to the measurement by elements other than hydrogen isnegligible, and that the contribution to the measurement from hydrogen comes entirely from the fluidsfully occupying the pore space.
However, in real rocks elements other than hydrogen that exist in the rock matrix do contribute to themeasurement (e.g., chlorine in formation water, mud filtrates and in some evaporite formations), andhydrogen is present in the matrix (e.g., bound water in shales).
The problem is partially overcome by calibrating the tool to give the porosity in limestone units. Purelimestone saturated with fresh water is chosen because it contains no elements which contributesignificantly to the measured signal other than hydrogen.
The porosities that are read by the tool are accurate in limestone formations that contain fresh water.
The porosities that are read by the tool in other lithologies or with other fluids need to be corrected bya chart such as that shown in Fig. 15.8.
There are three effects that are not corrected for in the log data, that need to be briefly mentioned.
The Hydrocarbon Effect. The presence of hydrocarbon liquid (oil) does not effect the tool responseas it has approximately the same hydrogen index as fresh water. Hydrocarbon gas, however, has amuch lower hydrocarbon index resulting from its low density, and its presence will give rise tounderestimations in porosity (Fig. 15.9).

Petrophysics MSc Course Notes The Neutron Log
Dr. Paul Glover Page 163
Figure 15.9 The Hydrocarbon gas effect in the neutron log.
The Shale Effect. Shale contain clays that have a significant amount of bound water molecules ontheir surfaces. This increases the hydrogen index of the formation. Even very low porosity shales cangive erroneously high porosity readings due to the presence of these bound waters.
The Chloride Effect. Chlorine is a good absorber of neutrons, and can lead to overestimations ofporosity if present either as formation fluid or mud filtrate.
15.10.2 Determination of Lithology
The direct use of the neutron log to identify lithologies depends upon the recognition of whichlithologies may contain hydrogen atoms (Table 15.2).
Table 15.2 Lithological and fluid indicators for the neutron tool.
Type Examples
Fresh and salt water Formation waterDrilling mudMudcakeMud filtrate
Hydrocarbons GassesOilsOil-based drilling mudOil-based mud filtrateOil-based mudcakeCoalOrganic-rich deposits
Bound water ShalesWater of Crystallization EvaporitesHydrated minerals Igneous and metamorphic rocks

Petrophysics MSc Course Notes The Neutron Log
Dr. Paul Glover Page 164
Figure 15.10 shows typical log responses in common lithologies.
Figure 15.10 Typical neutron log responses in common lithologies.

Petrophysics MSc Course Notes The Neutron Log
Dr. Paul Glover Page 165
The values of apparent porosity in shales varies considerably, but is usually higher than the apparentporosity in carbonate or sandstone rocks (i.e., 45 to 75%). This clearly high and unrealistic porosity isa partial indicator of shale, and can become diagnostic when combined with the gamma ray log. Onemay see a slight decrease in the apparent porosity in shales due to compaction, but only over largedepth intervals.
The apparent neutron limestone porosity is affected by the amount of shale and sand, or shale andlimestone in a mixture of the two. Hence we can recognize coarsening-up and fining-up sequences inthe neutron log (Fig. 15.11). While one can calculate a shale volume from the neutron log directly, it isnot recommended because of the effect of hydrocarbon gasses which may be present to disturb the log.
Figure 15.11 The neutron log response to mixtures of shales and sandstones.
Organic mater, often present in shales may cause an even higher apparent neutron limestone porositythan the bound water in the shales alone (Fig. 15.11).
The neutron log can detect evaporites by either their waters of crystallization. The most commonexample is gypsum (CaSO4.2H2O), but also include kainite, carnalite and polyhalite. The first three ofthese give apparent limestone porosities of about 60%, while polyhalite give about 25%. The apparentlimestone porosities for halite, anhydrite, and sylvite are very low (-3, -2, and –3 respectively) as theycontain no water. Note that there is no effect of the chlorine atom in halite or sylvite (Fig. 15.12).
Sand
Shale
CNL (limestone p.u.)
060

Petrophysics MSc Course Notes The Neutron Log
Dr. Paul Glover Page 166
Figure 15.12 The neutron log responseto evaporites (after Rider, 1997).
Hydrated minerals are not common inbasins. The only occurrence isoccasional chamosite in Liassic shalesin the North Sea. Hydrated mineralsmay be seen in neutron logs used fornon-hydrocarbon purposes, such asgeothermal reservoir assessment inmetamorphic and igneous provinces.However, volcanic and intrusive rocksshow high apparent neutron porositiesdie to hydrated minerals, and thesehorizons in reservoirs can be veryuseful for correlation purposes.
15.11 Lithological Identification using the Neutron-Density Combination
15.11.1 Compatible Scales and the Density-Neutron Cross-plot
This is a hugely important technique, and together with the litho-density log forms the best downholelithological identification technique available to the petrophysicist.
Both the formation density log and the neutron log give a direct measurement of TOTAL porosity.Hence, if they are plotted on compatible scales, they should overlie each other (Fig. 15.13).
Note that the compatible scale here is Density (1.95 to 2.95 g/cm3) and Neutron (-15 to 45% limestoneporosity units). This is the most commonly used scale range, although other wider or more restrictedones are possible.
Note also that good superimposition will ONLY occur for clean limestone formations 100% saturatedwith fresh water.
To construct a compatible scale we follow the following steps:
• For limestone with 0% porosity, the density log reads 2.71 g/cm3 and the neutron log reads zero.
• For limestone with 100% porosity, the density log reads 1.00 g/cm3 and the neutron log reads 100.

Petrophysics MSc Course Notes The Neutron Log
Dr. Paul Glover Page 167
These two points can be plotted on a graph of density (from the density log) on the y-axis againstneutron porosity (from the neutron log) on the x-axis. We can join up the two points with a straightline, and calibrate the line for porosity (Fig. 15.14). The graph is called the density-neutron crossplotand the line is called the clean limestone line.
The clean limestone line only works for clean limestones because of the effect of non-hydrogenelements in the matrix on the neutron porosity values, and the different grain densities. However, wecan take account of the different densities and correct the neutron porosity units using Fig. 15.8, toobtain lines of the cross-plot for clean sandstones and clean dolomite, the clean sandstone and cleandolomite lines.
Figure 15.13 The density and neutron log responses for clean formations on a compatible scale (afterRider, 1997).
One can see from the cross-plot that for density and neutron logs plotted on compatible scales, therewill be a separation of the density and the neutron logs for sandstone and dolomite, but no separationfor limestone (Fig. 15.15). The sandstone separation is called negative and the dolomite separation isin the other direction and slightly larger, and is called positive.
The separations are caused by the relative positions of both logs.

Petrophysics MSc Course Notes The Neutron Log
Dr. Paul Glover Page 168
Figure 15.14 The density-neutron crossplot.
15.11.2 Clean Formations
• There is no separation for pure limestones, and the porosity value that the log gives is accurate.• There is a small negative separation for clean sandstones.• There is a moderate positive separation for pure dolomites.

Petrophysics MSc Course Notes The Neutron Log
Dr. Paul Glover Page 169
Figure 15.15 The density-neutron combination idealized responses.
15.11.3 Shaly Formations
If shale is present in the formation, the neutron log reads much higher porosities than it wouldotherwise do because of the effect of bound water. This gives a large positive separation.
This large positive separation is diagnostic of shales.
If the shale volume decreases due to the intermixture of sandstone, the large positive separationdecreases, crosses-over and becomes eventually the small negative separation associated with puresandstone.
Thus, a sequence of clearly defined sand and shale formations shows switching between positive andnegative separations in the logs.
Often the beds will not be well defined, but coarsen-up or fine-up gradually. This can be seen by agradual switch from one separation to another. Hence the characteristic patterns (reviewed in thechapter on the gamma ray log) can be recognized in the separations, and conclusions may be drawnconcerning the depositional environment.

Petrophysics MSc Course Notes The Neutron Log
Dr. Paul Glover Page 170
The size of the separation is actually THE BEST quantitative estimator or shale volume. It is betterthan the shale volume derived from the gamma ray log. We can write an equation for shale volumebased on separations
(15.8)
where Ω stands for the separation measured in 100% sandstone, 100% shale, and at the point ofinterest in the log. Note that the separations may ALL be measured on the limestone porosity scale,ALL on the density scale, or ALL using a simple ruler on the log! Each is valid, but you must keep itconsistent for the whole equation.
15.11.4 Distinctive Lithologies
Certain minerals have unusual combinationsof density and neutron porosity. Theseunusual combinations can be used to identifythem on a combination log. Examples aregiven in Fig. 15.16.
Coals are a good example of a distinctivecombination of density and neutron porosityvalues. They have unusually low densitiescombined with unusually high apparentneutron porosity values associated with theirhydrogen content.
15.11.5 Evaporites
Remember from the section about theformation density tool that evaporites canoften be recognized because their often purenature leads to well constrained densityvalues. Evaporites have apparent neutronporosity values which are either very high orvery low. The combination of wellconstrained density values and very high orvery low apparent neutron porosity values isa characteristic and diagnostic combinationfor evaporites (Fig. 15.17).
Fig 15.16 Distinctive minerals on a density-neutron log.
sandsh
sandlogshV
Ω−Ω
Ω−Ω=

Petrophysics MSc Course Notes The Neutron Log
Dr. Paul Glover Page 171
Fig 15.17 Distinctive evaporites on a density-neutron log.