Embed Size (px)
Citation preview

Lean Tools Contents
Unit 3: Lean 8-‐Step Process Improvement
Procedure 3.0
Revision # 6.0
Implementation
Date30.08.2012
Last Reviewed 06.02.2015 Approval S. Halpin

www.etacsolutions.com: ETAC Limited Your Lean Business Partner
Sticking with our approach to looking at everything as a process…………….
What steps would you normally take to solve a problem?
Brainstorm
How to solve problems?

www.etacsolutions.com: ETAC Limited Your Lean Business Partner
Decision making based on data. Analysis using statistical tools & visual presentation.
CUSTOMERRequirements
Respect for People & Involve
EVERYBODY
Add VALUE
and eliminateWASTE
Lean – A simple message
Employees come up with effective and creative ideas
Satisfying customers’ needs

www.etacsolutions.com: ETAC Limited Your Lean Business Partner
PLAN 1. Problem Definition2. Current State3. Target to Achieve4. Root cause Analysis5. Agreed
Countermeasures
DO small scale trials6. Implementation PlanIncluding: Experimental design; PilotData collection
CHECK to see if changes are working7. Evaluate results and processIncluding: Graphical analysisKey performance indicators
ACT to get the greatest benefit 8. Standardise Success; learn from failuresIncluding:Formal trainingStandard processes; Error proofing
Developed by Walter Shewhart at Bell Laboratories in the 1930s. Popularized by W. Edwards Deming in the 1950s onward. Frequently referred to as “the Deming Wheel.”
8-‐step methodology
ContinuousImprovement

www.etacsolutions.com: ETAC Limited Your Lean Business Partner
Kaizen
StandardWork
StandardWork

www.etacsolutions.com: ETAC Limited Your Lean Business Partner
Basic
JustDoIt!

www.etacsolutions.com: ETAC Limited Your Lean Business Partner
Six Sigma

www.etacsolutions.com: ETAC Limited Your Lean Business Partner
“A problem clearly stated is a problem half solved”
Charles “Boss” Kettering-‐ General Motors Corporation
Step 1: Clarify the problem

www.etacsolutions.com: ETAC Limited Your Lean Business Partner
Problem Statement
“Most conflicts in organisations are due to people arguing about solutions without having
reached an agreement on the problem”
Michael BalléESG Consultants
Step 1

www.etacsolutions.com: ETAC Limited Your Lean Business Partner
Your Problem Statements
Problem Statement Exercise

www.etacsolutions.com: ETAC Limited Your Lean Business Partner
Customers from the MidWestregion have been complaining about product availability since September 2013. Complaints
have increased by 15% compared with the previous quarter according to the customer service database
11
Problem Statement Example
WHERE?
WHAT?
WHEN?
IMPACT?
HOW WE KNOW?

www.etacsolutions.com: ETAC Limited Your Lean Business Partner
Project Charter
Business Case (Problem Statement) Opportunity
Clearly outline the project impact -‐ideally on bottom-‐line or customer service
Any other potential improvement within the business from this project
Target (Measure) Scope
A clear time-‐based target.The measure you will use.
What is in scope and what is out of scope
Plan Team
Milestones -‐ dates Who will you need on your team (consider key stakeholders)

www.etacsolutions.com: ETAC Limited Your Lean Business Partner
Project Charter - Example
Business Case (Problem Statement) Opportunity
Getting quotations done faster will reduce quotation losses by 10% (estimate)Reducing the cycle time will increase revenue by an estimated €250,000
Customers are dissatisfied with the quotation processing time of 15 days.Competitors are achieving 10 days.We estimate that we lose 25% of quotations due to long lead times.
Target (Measure) Scope
Reduce our cycle time to 9 days by March 2015. Domestic quotes for jobs of less than €10,000 in value.Process begins with initial request and ends with acceptance or rejection from customer.
Plan Team
Step Begin End1 Project Charter 5/1 12/12 Current State / VOC 13/1 30/13 Target 31/1 1/24 Root Cause Analysis 3/2 17/25 Select Countermeasures 19/2 26/26 Implement trials 28/2 21/37 Evaluate Results 22/3 26/38 Standardise & Learning 27/3 31/3
Gary Smith Sponsor / DirectorMike Hanley Project OwnerCeline Clarke Customer ServiceMargaret Bowes FinanceRichie Dawson EngineeringJohn Morgan Sales RepPaul Byrne OperationsGemma Storey IT

www.etacsolutions.com: ETAC Limited Your Lean Business Partner
Gets everyone on the same page

www.etacsolutions.com: ETAC Limited Your Lean Business Partner
Task 2 of 12: Complete a project charter for your chosen improvement area (5%)
Business Case (Problem / Opportunity Statement) Opportunity
Getting quotations done faster will reduce quotation losses by 10% (estimate)Reducing the cycle time will increase revenue by an estimated €250,000
Customers are dissatisfied with the quotation processing time of 15 days.Competitors are achieving 10 days.We estimate that we lose 25% of quotations due to long lead times.
Target (Measure) Scope
Reduce our cycle time to 9 days by March 2015Domestic quotes for jobs of less than €10,000 in value.Process begins with initial request and ends with acceptance or rejection from customer
Plan Team
Step Begin End1 Project Charter 5/1 12/12 Current State / VOC 13/1 30/13 Target 31/1 1/24 Root Cause Analysis 3/2 17/25 Select Countermeasures 19/2 26/26 Implement trials 28/2 21/37 Evaluate Results 22/3 26/38 Standardise& Learning 27/3 31/3
Gary Smith Sponsor / DirectorMike Hanley Project OwnerCeline Clarke Customer ServiceMargaret Bowes FinanceRichie Dawson EngineeringJohn Morgan Sales RepPaul Byrne OperationsGemma Storey IT

www.etacsolutions.com: ETAC Limited Your Lean Business Partner
Step 2: The Current Situation

www.etacsolutions.com: ETAC Limited Your Lean Business Partner
Without Data.... ...you're just another person with an opinion!
Data

www.etacsolutions.com: ETAC Limited Your Lean Business Partner
How many pages?
Count the number of pages in the book. Record your answer on the ‘Post-‐It’
NOTE: You are to work independently – no questions to others.

www.etacsolutions.com: ETAC Limited Your Lean Business Partner19
Process
Laptop Owner
Business OwnerEnvironmental waste
CustomersInputs Outputs
SIPOC Example: Upgrading laptop memory
CustomerTrained TechnicianMemory/tools vendorUtility provider
Suppliers
RequirementsUpgraded memoryQuick TurnroundGood priceLaptop in same Condition
Test Laptop
Shutdown
Anti-‐Static Gloves
Replace memory module
Power Up
Test Laptop
RequirementsLaptopAnti-Static Gloves/ToolsMemoryPower SupplyToolbox

www.etacsolutions.com: ETAC Limited Your Lean Business Partner
Process Mapping

www.etacsolutions.com: ETAC Limited Your Lean Business Partner
Process Mapping

www.etacsolutions.com: ETAC Limited Your Lean Business Partner
Process MappingPlaceh
olde
rPlaceh
olde
rPlaceh
olde
rPlaceh
olde
r
Placeholder Text Placeholder Placeholder
Placeholder
PlaceholderText
PlaceholderText Placeholder
Text
Text
Yes
Yes
Yes
No
No
No
Process Decision Start or Stop

www.etacsolutions.com: ETAC Limited Your Lean Business Partner
Exercise
Map process steps including inputs and outputs

www.etacsolutions.com: ETAC Limited Your Lean Business Partner
Data available?
Without data, you’re just another person with an opinion!
What data?
How accurate?
How long?
Who is responsible?
How is it reported?
Data

www.etacsolutions.com: ETAC Limited Your Lean Business Partner25
Operational Definition:
A description
-‐ those affected will have a common understanding
-‐ all parties will have no ambiguity over what is being measured
Operational Definition

Think 5Ws & 1H
Data Collection Planning
What to Measure How to Measure Who will do it? Sample Plan
MeasureType of Measure(O/P/I)
Type of data Operational Definition
Measurement or Test Method
Data Tags Needed to Stratify the
Data
Data Collection Method
Person(s)Assigned What? Where? When? How Many? Remarks
Name what is being
measured
Input / Process / Output measure
Continuous or discrete
Clear definition for repeatable results from different observers
Procedures for data collection are defined
E.g. Date, Time, Location,
Person, Customer etc.
Manual, Spreadsheet, Computer-based, etc.
Who is responsible?
What measure is being collected
Location for data collection
How often the data is collected
the number of data points collected per sample
1

www.etacsolutions.com: ETAC Limited Your Lean Business Partner27
Data Collection
Product <product name> ID R123 Number Inspected 265
Stage Final Inspection Date 12th Jan Checked by John Doe
Type of Error / Reason Count / Check SubtotalMon. Tues. Wed. Thu. Fri.
1. Description of Type //// // // //// // //// / 22
2. Description of Type // /// // /// //// / 16
3. Description of Type //// / //// //// / //// // 23
4. Description of Type //// / /// //// // /// 19
…
…
…
Grand Total 16 9 13 18 22 80

www.etacsolutions.com: ETAC Limited Your Lean Business Partner
The most common Quality Tools that can be used to solve the vast majority of quality-‐related issues
Checklist / Check Sheet
Pareto Chart
Frequency
Percent
A B C D E
Control Chart
Upper control limit
Lower control limit
Time
Cause-‐and-‐effectCause Effect
Materials Methods
Manpower Machinery
Scatter Diagram
Variable 2
Varia
ble 1
Flow Chart
HistogramDistribution
Frequency
Task / Process StepCount
Repeat Mon. Tues. Wed. Thu. Fri. Sat. Sun.
Process 1
1. Task Description D <Value>
2. Task Description D ü
3. Task Description AN -‐
4. Task Description D <Value>
Process 2
1. Task Description D <Value>
2. Task Description AN ü
3. Task Description D ü
… …
Type of Error / ReasonCount Total
ScoreMon. Tues. Wed. Thu. Fri.
1. Description of Type //// // // //// / / / /// / 22
2. Description of Type // /// // /// //// / 16
3. Description of Type //// / //// //// / / / // / / 23
4. Description of Type //// / / / / //// // /// 19
…
…
…
Total Errors 16 9 13 18 22 80
The 7 Classic Tools of Quality

www.etacsolutions.com: ETAC Limited Your Lean Business Partner29
– Based on a principle thought through by Vilfredo Pareto (Italian Economist). Pareto’s premise: 80% of the wealth of nations comes from a 20% minority.
– We arrange the data to highlight the impact of the ‘vital few’ causes on a high number of effects.
Pareto Chart

www.etacsolutions.com: ETAC Limited Your Lean Business Partner30
Pareto Example

www.etacsolutions.com: ETAC Limited Your Lean Business Partner31
Complaint Feb Mar Apr Total1 Refund 1 4 10 152 DPA-‐Fulfillment 175 100 85 3603 Delay 23 20 11 544 Incorrect Data 10 13 60 835 Incorrect Advice 324 265 373 9626 Incorrect Quote 7 12 21 407 DPA 12 8 12 328 Action not completed 25 52 50 1279 Agent Attitude 30 50 17 97
10 DPA breach 21 4 8 3311 Follow Up 300 110 95 505
How might you present this data in Pareto format?
Exercise

www.etacsolutions.com: ETAC Limited Your Lean Business Partner32
– Used to assess the shape and spread of sample data. – Suitable for use with variable data. – Minimum of 50 data points recommended. – To draw a histogram
– Divides sample values into intervals called bins. – Bars represent the number of observations falling within
each bin (its frequency).
This image cannot currently be displayed.
Watch Out!Histograms obscure the ‘time value’ of data and can obscure data meaning if too few or many horizontal bars are used.
Histogram

www.etacsolutions.com: ETAC Limited Your Lean Business Partner33
Histogram Example

www.etacsolutions.com: ETAC Limited Your Lean Business Partner34
CustomerRequirement
ProcessCentered
ProcessToo High
ProcessToo Low
Location -‐ Is the process distribution Variation -‐ What is the spread of thecentered, too high or too low? data? Is it too variable?
CustomerRequirementsProcess
withinRequirements
Processtoo Variable
Histogram Interpretation

www.etacsolutions.com: ETAC Limited Your Lean Business Partner
50.64 47.55 50.62 60.00 50.6749.11 52.22 57.40 62.58 51.1445.41 56.86 53.77 48.53 49.5943.91 51.17 54.28 46.99 58.4140.24 60.02 44.38 45.44 54.8240.79 50.13 47.00 48.03 42.8249.63 42.31 51.69 38.13 51.6643.91 42.86 60.51 51.15 52.1740.24 49.62 52.69 47.52 52.7451.18 52.21 49.08 50.10 42.82
Here are 50 data samples.Present this data as a histogram
Histogram Exercise

www.etacsolutions.com: ETAC Limited Your Lean Business Partner
Binmin max count37 40 140.1 43 743.1 46 546.1 49 649.1 52 1652.1 55 855.1 58 258.1 61 461.1 64 1 0
2
4
6
8
10
12
14
16
18
40 43 46 49 52 55 58 61 64
37 40.1 43.1 46.1 49.1 52.1 55.1 58.1 61.1
Histogram
Histogram Exercise

www.etacsolutions.com: ETAC Limited Your Lean Business Partner
Qty Temp30 7021 7540 8052 9057 9359 9833 7238 7532 7545 8053 9056 9562 9851 91
Y axis is the Dependant variable (Number of cans drank on a hot day)The X axis is the Independent variable (The Temperature)
100959085807570
60
50
40
30
20
Temp
Qty
Scatterplot of Qty vs Temp
Scatter Plot

www.etacsolutions.com: ETAC Limited Your Lean Business Partner
Scatter Plot : Example

www.etacsolutions.com: ETAC Limited Your Lean Business Partner
Scatter Plot : Regression Example

www.etacsolutions.com: ETAC Limited Your Lean Business Partner40
A sequence of observations over regularly spaced intervals of time. For example:·∙ Monthly unemployment rates for the past five years·∙ Daily production at a manufacturing plant for a month·∙ Decade-‐by-‐decade population of a state over the past century
A plot of the dataversus time.
Time Series

www.etacsolutions.com: ETAC Limited Your Lean Business Partner41
Time Series

www.etacsolutions.com: ETAC Limited Your Lean Business Partner42
Time Series

www.etacsolutions.com: ETAC Limited Your Lean Business Partner43
This time series plot shows the monthly sales for two store locations over 9 months.
Ø Store 1 sales show slow, fairly steady growth.
Ø Store 2 sales started below store 1 sales, but overtook and surpassed store 1 sales by the second month.
Ø Store 2 had greater monthly sales fluctuations than store 1.
Time Series Plot
0
2
4
6
8
10
12
Jan Feb Mar Apr May Jun Jul Aug Sep
€€€
Sales
www.etacsolutions.com: ETAC Limited Your Lean Business Partner
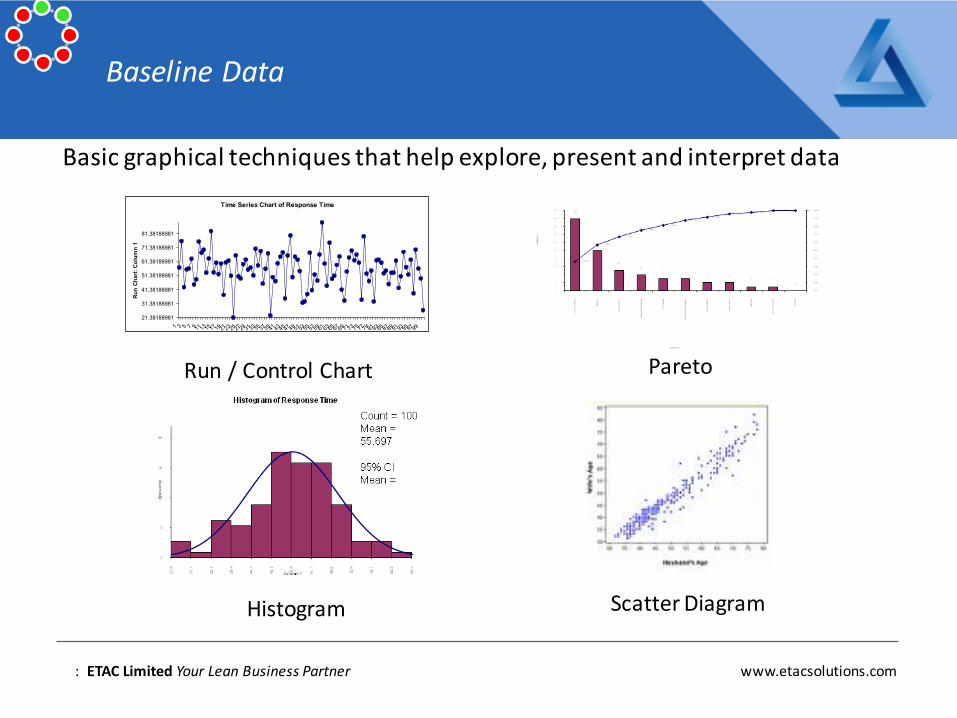
Basic graphical techniques that help explore, present and interpret dataTime Series Chart of Response Time
21.38188981
31.38188981
41.38188981
51.38188981
61.38188981
71.38188981
81.38188981
1 3 5 7 911 131517 192123 252729 313335 373941 434547 49515355 575961 636567 697173 757779 818385 878991 939597 99
Run Chart: Column 1
Histogram
ParetoRun / Control Chart
Scatter Diagram
Baseline Data

www.etacsolutions.com: ETAC Limited Your Lean Business Partner
Step 3: Define how you will measure your success

www.etacsolutions.com: ETAC Limited Your Lean Business Partner
The 5 criteria that define a goal so that it can be used in project management
Specific
Objectives have to be specific and positively described.
Measurable
A goal achievement should be measurable.
Attainable
It should be attractive for the project team to reach the goal.
Relevant
The objective needs to be
relevant to the aims of the organisation.
Time-‐bound
The goal has to set within a time frame.
Goal Criteria − SMART

www.etacsolutions.com: ETAC Limited Your Lean Business Partner
Step 4

www.etacsolutions.com: ETAC Limited Your Lean Business Partner48
Open Flow -‐ group spontaneously shout out ideas that are recorded by facilitator or nominated recorder
Silent/Sharing -‐ ideas recorded individually on post-‐it notes in silence and only then shared amongst group
Round Robin -‐ group take it in turn to give ideas that are then recorded
Brainstorming Techniques

www.etacsolutions.com: ETAC Limited Your Lean Business Partner49
Young Woman or Old Lady?
We may see different things when looking at exactly the same situation

www.etacsolutions.com: ETAC Limited Your Lean Business Partner50
Words
Logic
Linearity
Analysis
Lists
Numbers
Academic
Colour
Imagination
Rhythm
Spiritual Awareness
Holistics
Creativity
Left Right
Left & Right Brain Thinking
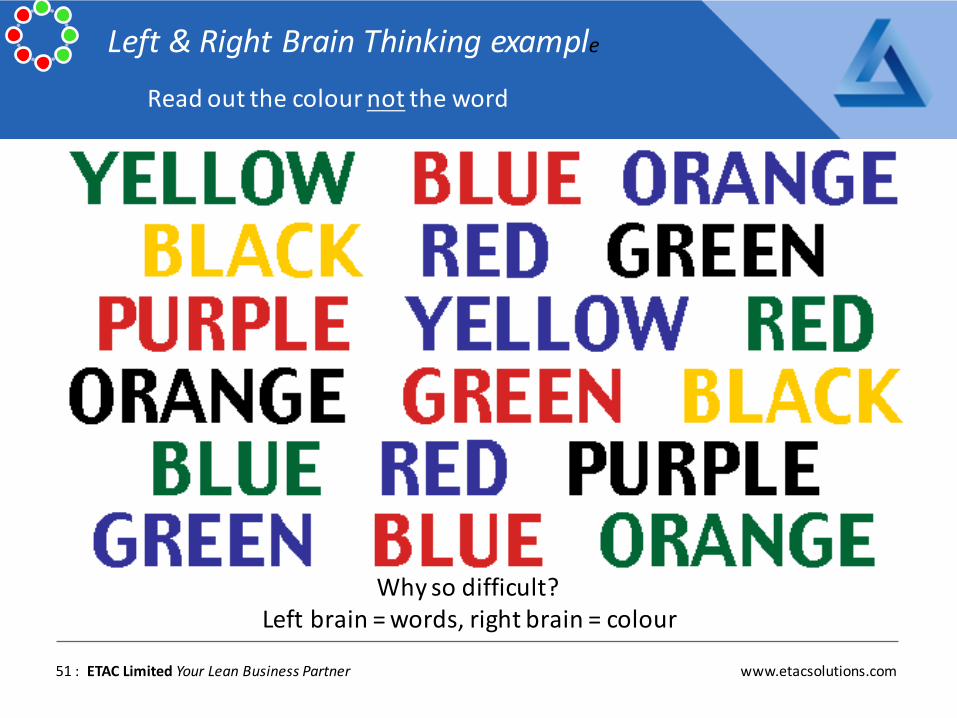
www.etacsolutions.com: ETAC Limited Your Lean Business Partner51
Why so difficult? Left brain = words, right brain = colour
Read out the colour not the word
Left & Right Brain Thinking example

www.etacsolutions.com: ETAC Limited Your Lean Business Partner
Brainstorm Exercise
Problem: Bad meetings in my business
Brainstorm using silent sharing-‐ causes of bad meetings
(or class examples)

www.etacsolutions.com: ETAC Limited Your Lean Business Partner
Effect that needs
improvement
Problem / Quality
Characteristic
Cause Effect
Description 1 Description 3Description 2
Description 4 Description 6Description 5
Placeholder
Placeholder
Placeholder
Placeholder
Placeholder
Placeholder
Placeholder Placeholder Placeholder
Placeholder Placeholder Placeholder
Developed by Dr. Kaoru Ishikawa in 1943
Fishbone Diagram (Cause and Effect / Ishikawa)

www.etacsolutions.com: ETAC Limited Your Lean Business Partner
Affinity
Problem: Bad meetings in my business
Brainstorm using silent sharing-‐ causes of bad meetings
Now Group common causes

www.etacsolutions.com: ETAC Limited Your Lean Business Partner55
What is a Root Cause ?
Root Cause

www.etacsolutions.com: ETAC Limited Your Lean Business Partner
5 Whys -‐ ExampleSymptom
A well known monument was disintegrating Why?
Use of harsh chemicals to clean pigeon droppings
They eat spiders and there are a lot of spiders at monument
Why so manypigeons?
Why so manyspiders? They eat gnats
and lots of gnats at monument
Why so manygnats? They are
attracted to the lights at dusk.
Cause
Action: Turn on the lights at a later time.

www.etacsolutions.com: ETAC Limited Your Lean Business Partner
Only the one who experienced the problem is qualified to perform the analysis. There are usually more than one root cause
Why? Reason
Why 1 Why was our customer unhappy? The service has been delivered to late. The customer was unsatisfied.
Why2 Why was the service not prepared on time?
We did not prepare the service on time because it took much longer than we expected.
Why3 Why did it take so much longer? Because we did not receive all approvals on time and underestimated the duration of the project.
Why4 Why did we underestimate the project duration?
Because we forgot to prepare a detailed list of all tasks.
Why5 Why did we forget about it? Because we were running behind on other projects and failed to review our task list and time estimation during the project.
Root Cause*
Because we didn’t have a checklist to clearly identify all tasks that we must achieve to estimate time accurately. We need to develop a systematic approach to include these factors in future projects.
5 Why Analysis

www.etacsolutions.com: ETAC Limited Your Lean Business Partner
Apply 5 Whys
Problem: Bad meetings in my business
Brainstorm using silent sharing-‐ causes of bad meetings
Now Group common causes
Select 3 key group causes and apply ‘5 Whys’
Does the cause (symptom) change to a root cause?

www.etacsolutions.com: ETAC Limited Your Lean Business Partner
Task 3 of 12: Identify goals and team-members for a Kaizen event.Run event. Record outcome. (5%)

www.etacsolutions.com: ETAC Limited Your Lean Business Partner
Step 5

www.etacsolutions.com: ETAC Limited Your Lean Business Partner
Narrow down to most practical and effectiveImpact / EaseFMEA
Can we error-‐proof it?Does the countermeasure affect quality, productivity, safety, cost or person?Can we quantify the expected outcome?Use problem, cause, action spreadsheetCreate a clear and detailed action plan
Prioritise

www.etacsolutions.com: ETAC Limited Your Lean Business Partner
Impact (I)
Ease of fix (E)
Score (I x E) Action
Man
Machine
Method
Measurement
Material
Mother Nature (Environment)
Cause & Effect Ranking

www.etacsolutions.com: ETAC Limited Your Lean Business Partner
Impact
Ease
Impact / Ease Chart
JUSTDoIT!
JUSTDoIT!
JUSTDoIT!
JUSTDoIT!
JUSTDoIT!
WHYNOT?
WHYNOT?
WHYNOT?
WHYNOT? WHY
NOT?
WHYNOT? WHY
NOT?
PROJECT
PROJECT
PROJECT
PROJECT
PROJECT
NOTNOW
NOTNOW
NOTNOW
NOTNOW

www.etacsolutions.com: ETAC Limited Your Lean Business Partner64
Must Haves
Quick Wins
Money Pits
Low Hanging Fruit
High
Low
EasyHard
BusinessImpact
Ease ofImplementation
Impact / Ease Chart
www.etacsolutions.com: ETAC Limited Your Lean Business Partner
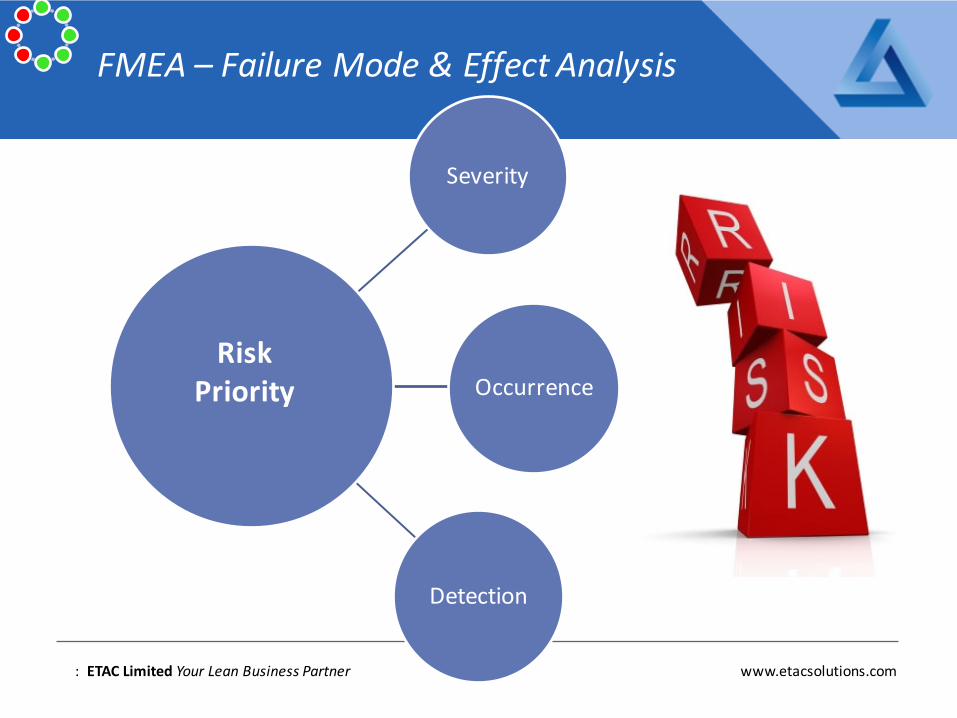
FMEA – Failure Mode & Effect Analysis
Severity
Occurrence
Detection
Risk Priority

www.etacsolutions.com: ETAC Limited Your Lean Business Partner
Failure Mode & Effects Analysis (FMEA)
Process Name Process NumberDate:
Revision:
Failure Mode
A) Severity
Rate 1-‐1010 = Most Severe
B) Probability ofOccurance
Rate 1-‐1010 = HighestProbability
C) Probability of Detection
Rate 1-‐1010 = LowestProbability
Risk PreferenceNumber (RPN)
A x B x C
1) Selectwrong color seat belt 5 4 3 60
2) Seat belt bolt not fully tightened 9 2 8 144
3) Trim Cover clip misaligned 2 3 4 24
Failure Mode Effect Analysis (FMEA)

www.etacsolutions.com: ETAC Limited Your Lean Business Partner
Step 6

www.etacsolutions.com: ETAC Limited Your Lean Business Partner
What data do we need to collect on counter-‐measures?For how long?Who collects it?How is it reported?Do you need permission?Is revalidation required?Is additional training required?Are additional resources required?Have we communicated the counter-‐measure?
How?

www.etacsolutions.com: ETAC Limited Your Lean Business Partner

www.etacsolutions.com: ETAC Limited Your Lean Business Partner

www.etacsolutions.com: ETAC Limited Your Lean Business Partner
Step 7

www.etacsolutions.com: ETAC Limited Your Lean Business Partner
Were the results consistent with the expected result?
If not, can you explain the difference?
What was learnt?
Step 7

www.etacsolutions.com: ETAC Limited Your Lean Business Partner
Step 8

www.etacsolutions.com: ETAC Limited Your Lean Business Partner
StandardisePreventMonitor Document
Close out the projectComplete A3Can this counter-‐measure be applied elsewhere?
Opportunity

www.etacsolutions.com: ETAC Limited Your Lean Business Partner
What Did the Team Learn (from what didn’t go to plan)

www.etacsolutions.com: ETAC Limited Your Lean Business Partner
Complete A3

www.etacsolutions.com: ETAC Limited Your Lean Business Partner
Kaoru Ishikawa
“95% of quality related problemscan be solved with
7 fundamental quantitative tools”
Good presentation makes data analysis and decision making easy
77
7 basic quality tools

www.etacsolutions.com: ETAC Limited Your Lean Business Partner
Cause & Effect
Scatter PlotPareto
Flow diagram
Histogram
Mean CL: 0.10
-6.80
7.00
-19
-14
-9
-4
1
6
11
16
21
26
31
Individuals - Delivery Time Deviation
Before Improvement After Improvement
Run/Control Charts
Check Sheets
7 basic tools

www.etacsolutions.com: ETAC Limited Your Lean Business Partner
Yes
Start
Select Likely Causes
Brainstorm action optionsFinish
Is the Cause a Root Cause?
No
Planning Phase
0 Problem / Opportunity
1 Problem Statement / Charter
3Set a target
& plan improvement
2 Establish the Team. Define current state with process team
4 Brainstorm – Identify CausesSelect Countermeasures 5
Implement Solution 6
Stanadardise or document learning 8
Evaluate Solution 7
SUMMARY: 8-‐step problem-‐solving –Project framework

www.etacsolutions.com: ETAC Limited Your Lean Business Partner
Task 4 of 12: Apply 8-step improvement methodology to your process improvement. Include appropriate lean tools. Brainstorm & identify root causes to your process (10%)
1. Problem
2. Current State
3. Target
4. Root Cause Analysis
5. Select Countermeasures
6. Implementation
7. Evaluation
8. Standardisation & Learnings