Embed Size (px)
Citation preview

1 Letter BallotStatus2 2018/01/23Date of Last Update3 David Clunie
4 mailto:[email protected]
Person Assigned
5 QIICRSubmitter Name6 2017/02/22Submission Date
7 Correction Number CP-16998 Log Summary: Match units to quantities9 Name of Standard
10 PS3.1611 Rationale for Correction:
12 Extend the pattern of matching units with quantities explicitly, as per Sup 169 and CP 1665
13 Update section 7.1 with discussion of Units column.14 Correction Wording:
15 - Letter Ballot -
16 Page 1CP-1699 - Match units to quantities

1 Amend DICOM PS3.16 as follows (changes to existing text are bold and underlined for additions and struckthrough for removals):
2 CID 4033 MR Proton Spectroscopy Metabolites3 Type:4 Extensible5 Version:6 20160314
7 Table CID 4033. MR Proton Spectroscopy Metabolites
8 UnitsUMLS Concept9 Unique ID
SNOMED-CTConcept ID
Code MeaningCode ValueCodingScheme
10 Designator11 DT (ppm, UCUM, "ppm")C0067684115391007N-acetylaspartateF-65C50SRT12 DT (ppm, UCUM, "ppm")C037625959351004CitrateF-61080SRT13 DT (ppm, UCUM, "ppm")C000840565123005CholineF-61620SRT14 DT (ppm, UCUM, "ppm")C001028614804005CreatineF-61380SRT15 DT (ppm, UCUM, "ppm")Creatine and Choline113094DCM16 DT (ppm, UCUM, "ppm")C037626183036002LactateF-61760SRT17 DT (ppm, UCUM, "ppm")C002377970106000LipidF-63600SRT18 DT (ppm, UCUM, "ppm")Lipid and Lactate113095DCM19 DT (ppm, UCUM, "ppm")Glutamate and glutamine113080DCM20 DT (ppm, UCUM, "ppm")C001779725761002GlutamineF-64210SRT21 DT (ppm, UCUM, "ppm")C003935010944007TuarineF-64460SRT22 DT (ppm, UCUM, "ppm")C002154772164009InositolF-61A90SRT23 DT (ppm, UCUM, "ppm")Choline/Creatine Ratio113081DCM24 DT (ppm, UCUM, "ppm")N-acetylaspartate/Creatine25 Ratio
113082DCM
26 DT (ppm, UCUM, "ppm")N-acetylaspartate/Choline27 Ratio
113083DCM
28 DT (ppm, UCUM, "ppm")Creatine+Choline/Citrate29 Ratio
113096DCM
30 CID 4107 Tracer Kinetic Model Parameters31 Type:32 Extensible33 Version:34 20141110
35 Table CID 4107. Tracer Kinetic Model Parameters
36 UnitsUMLS37 Concept38 Unique ID
SNOMED-CTConcept ID
Code MeaningCode ValueCoding SchemeDesignator
39 DT (/min, UCUM, "/min")Ktrans126312DCM40 DT (/min, UCUM, "/min")kep126313DCM41 DT ({ratio}, UCUM, "ratio")ve126314DCM42 DT (s, UCUM, "s")tau_m126330DCM43 DT ({ratio}, UCUM, "ratio")vp126331DCM
44 - Letter Ballot -
45 Page 2CP-1699 - Match units to quantities

1 Note
2 CID 4108 Perfusion Model Parameters3 Type:4 Extensible5 Version:6 20161106
7 Table CID 4108. Perfusion Model Parameters
8 UnitsUMLS9 Concept10 Unique11 ID
SNOMED-CTConcept ID
Code MeaningCode ValueCoding SchemeDesignator
12 DT (ml/(100.ml)/min, UCUM,13 "ml/(100.ml)/min")
14 DT (ml/(100.g)/min, UCUM,15 "ml/(100.g)/min")
Regional Cerebral Blood16 Flow
113055DCM
17 DT (ml/(100.ml)/min, UCUM,18 "ml/(100.ml)/min")
19 DT (ml/(100.g)/min, UCUM,20 "ml/(100.g)/min")
Regional Blood Flow126390DCM
21 DT (ml/(100.ml), UCUM, "ml/(100.ml)")
22 DT (ml/(100.g), UCUM, "ml/(100.g)")
Regional Cerebral Blood23 Volume
113056DCM
24 DT (ml/(100.ml), UCUM, "ml/(100.ml)")
25 DT (ml/(100.g), UCUM, "ml/(100.g)")
Regional Blood Volume126391DCM
26 DT (s, UCUM, "s")Mean Transit Time113052DCM27 DT (s, UCUM, "s")Time To Peak113069DCM28 Oxygen Extraction Fraction126392DCM29 DT (s, UCUM, "s")Tmax113084DCM
30 Note
31 CID 4109 Model-Independent Dynamic Contrast Analysis Parameters32 Type:33 Extensible34 Version:35 20150916
36 Table CID 4109. Model-Independent Dynamic Contrast Analysis Parameters
37 UnitsUMLS38 Concept39 Unique40 ID
SNOMED-CTConcept ID
Code MeaningCode ValueCoding SchemeDesignator
41 DT (mmol/l.s, UCUM, "mmol/l.s")IAUC126320DCM42 DT (mmol/l.s, UCUM, "mmol/l.s")IAUC60126321DCM43 DT (mmol/l.s, UCUM, "mmol/l.s")IAUC90126322DCM44 DT (mmol/l.s, UCUM, "mmol/l.s")IAUC180126323DCM45 DT {normalized}, UCUM,46 "normalized"
IAUCBN126324DCM
47 - Letter Ballot -
48 Page 3CP-1699 - Match units to quantities

1 UnitsUMLS2 Concept3 Unique4 ID
SNOMED-CTConcept ID
Code MeaningCode ValueCoding SchemeDesignator
5 DT {normalized}, UCUM,6 "normalized"
IAUC60BN126325DCM
7 DT {normalized}, UCUM,8 "normalized"
IAUC90BN126326DCM
9 DT {normalized}, UCUM,10 "normalized"
IAUC180BN126327DCM
11 DT (s, UCUM, "s")Time of Peak Concentration126370DCM12 DT (s, UCUM, "s")Time of Leading Half-Peak13 Concentration
126372DCM
14 DT (s, UCUM, "s")Bolus Arrival Time126371DCM15 DT (s, UCUM, "s")Time To Peak113069DCM16 Temporal Derivative17 Threshold
126374DCM
18 Maximum Slope126375DCM19 Maximum Difference126376DCM20 DT (mmol/l, UCUM, "mmol/l")Tracer Concentration126377DCM
21 CID 7180 Abstract Multi-dimensional Image Model Component Semantics22 Type:23 Extensible24 Version:25 20161106
26 Table CID 7180. Abstract Multi-dimensional Image Model Component Semantics
27 UnitsUMLS28 Concept29 Unique ID
SNOMED-CTConcept ID
Code MeaningCode ValueCoding SchemeDesignator
30 Include CID 4033 “MR Proton Spectroscopy Metabolites”
31 DT (ms, UCUM, "ms")T1113063DCM32 DT (ms, UCUM, "ms")T2113065DCM33 DT (ms, UCUM, "ms")T2*113064DCM34 Proton Density113058DCM35 Spin Tagging Perfusion MR Signal36 Intensity
110800DCM
37 Velocity encoded113070DCM38 Temperature encoded113067DCM39 Contrast Agent Angio MR Signal40 Intensity
110801DCM
41 Time Of Flight Angio MR Signal42 Intensity
110802DCM
43 Proton Density Weighted MR44 Signal Intensity
110803DCM
45 T1 Weighted MR Signal Intensity110804DCM46 T2 Weighted MR Signal Intensity110805DCM47 T2* Weighted MR Signal Intensity110806DCM
48 - Letter Ballot -
49 Page 4CP-1699 - Match units to quantities

1 UnitsUMLS2 Concept3 Unique ID
SNOMED-CTConcept ID
Code MeaningCode ValueCoding SchemeDesignator
4 Diffusion weighted113043DCM5 Field Map MR Signal Intensity110807DCM6 DT ({0:1}, UCUM, "range7 0:1")
Fractional Anisotropy110808DCM
8 DT ({ratio}, UCUM, "ratio")Relative Anisotropy110809DCM9 DCID nn20 “Units of10 Diffusion Rate Area Over11 Time”
Apparent Diffusion Coefficient113041DCM
12 Volumetric Diffusion Dxx13 Component
110810DCM
14 Volumetric Diffusion Dxy15 Component
110811DCM
16 Volumetric Diffusion Dxz17 Component
110812DCM
18 Volumetric Diffusion Dyy19 Component
110813DCM
20 Volumetric Diffusion Dyz21 Component
110814DCM
22 Volumetric Diffusion Dzz23 Component
110815DCM
24 T1 Weighted Dynamic Contrast25 Enhanced MR Signal Intensity
110816DCM
26 T2 Weighted Dynamic Contrast27 Enhanced MR Signal Intensity
110817DCM
28 T2* Weighted Dynamic Contrast29 Enhanced MR Signal Intensity
110818DCM
30 Blood Oxygenation Level110819DCM31 Nuclear Medicine Projection32 Activity
110820DCM
33 Nuclear Medicine Tomographic34 Activity
110821DCM
35 Spatial Displacement X36 Component
110822DCM
37 Spatial Displacement Y38 Component
110823DCM
39 Spatial Displacement Z40 Component
110824DCM
41 Hemodynamic Resistance110825DCM42 Indexed Hemodynamic Resistance110826DCM43 DT ([hnsf'U], UCUM,44 "Hounsfield unit")
Attenuation Coefficient112031DCM
45 Tissue Velocity110827DCM46 Flow Velocity110828DCM47 C1960437425704008Power DopplerP0-02241SRT48 Flow Variance110829DCM
49 - Letter Ballot -
50 Page 5CP-1699 - Match units to quantities

1 UnitsUMLS2 Concept3 Unique ID
SNOMED-CTConcept ID
Code MeaningCode ValueCoding SchemeDesignator
4 Elasticity110830DCM5 Perfusion110831DCM6 Speed of sound110832DCM7 Ultrasound Attenuation110833DCM8 Student's T-test113068DCM9 Z-score113071DCM10 R-Coefficient113057DCM11 R2-Coefficient126220DCM12 RGB R Component110834DCM13 RGB G Component110835DCM14 RGB B Component110836DCM15 YBR FULL Y Component110837DCM16 YBR FULL CB Component110838DCM17 YBR FULL CR Component110839DCM18 YBR PARTIAL Y Component110840DCM19 YBR PARTIAL CB Component110841DCM20 YBR PARTIAL CR Component110842DCM21 YBR ICT Y Component110843DCM22 YBR ICT CB Component110844DCM23 YBR ICT CR Component110845DCM24 YBR RCT Y Component110846DCM25 YBR RCT CB Component110847DCM26 YBR RCT CR Component110848DCM27 Echogenicity110849DCM28 X-Ray Attenuation110850DCM29 MR signal intensity110852DCM30 Binary Segmentation110853DCM31 Fractional Probabilistic32 Segmentation
110854DCM
33 Fractional Occupancy34 Segmentation
110855DCM
35 DT (1/ms, UCUM, "1/ms")R1126393DCM36 DT (1/ms, UCUM, "1/ms")R2126394DCM37 DT (1/ms, UCUM, "1/ms")R2*126395DCM38 DT ({ratio}, UCUM, "ratio")Magnetization Transfer Ratio113098DCM39 DT ({ratio}, UCUM, "ratio")Magnetic Susceptibility126396DCM40 Include Section CID 4107 “Tracer Kinetic Model Parameters”41 Include Section CID 4108 “Perfusion Model Parameters”42 Include Section CID 4109 “Model-Independent Dynamic Contrast Analysis Parameters”43 Standardized Uptake Value126400DCM
44 - Letter Ballot -
45 Page 6CP-1699 - Match units to quantities

1 UnitsUMLS2 Concept3 Unique ID
SNOMED-CTConcept ID
Code MeaningCode ValueCoding SchemeDesignator
4 DT (g/ml{SUVbw}, UCUM,5 "Standardized Uptake Value6 body weight")
SUVbw126401DCM
7 DT (g/ml{SUVlbm}, UCUM,8 "Standardized Uptake Value9 lean body mass (James)")
SUVlbm126402DCM
10 DT11 (g/ml{SUVlbm(James128)},12 UCUM, "Standardized13 Uptake Value lean body14 mass (James 12815 multiplier)")
SUVlbm(James128)126406DCM
16 DT (g/ml{SUVlbm(Janma)},17 UCUM, "Standardized18 Uptake Value lean body19 mass (Janma)")
SUVlbm(Janma)126405DCM
20 DT (cm2/ml{SUVbsa},21 UCUM, "Standardized22 Uptake Value body surface23 area")
SUVbsa126403DCM
24 DT (g/ml{SUVibw}, UCUM,25 "Standardized Uptake Value26 ideal body weight")
SUVibw126404DCM
27 CID 7181 Abstract Multi-dimensional Image Model Component Units28 Type:29 Extensible30 Version:31 20161106
32 Table CID 7181. Abstract Multi-dimensional Image Model Component Units
33 Code MeaningCode ValueCoding Scheme Designator34 Include ???
35 Include ???
36 Include ???
37 Include ???
38 Include ???
39 Include ???
40 Include ???
41 no units1UCUM42 ratio{ratio}UCUM43 Hounsfield Unit[hnsf'U]UCUM44 Counts{counts}UCUM45 Counts per second{counts}/sUCUM46 arbitrary unit[arb'U]UCUM47 ppmppmUCUM48 centimeter/secondcm/sUCUM
49 - Letter Ballot -
50 Page 7CP-1699 - Match units to quantities

1 Code MeaningCode ValueCoding Scheme Designator2 millimeter/secondmm/sUCUM3 decibeldBUCUM4 degrees CelsiusCelUCUM5 milliliter per minuteml/minUCUM6 milliliter per secondml/sUCUM7 millisecondmsUCUM8 secondsUCUM9 HertzHzUCUM10 milliTeslamTUCUM11 number particles per 100 gram of tissue{Particles}/[100]g{Tissue}UCUM12 square millimeter per secondmm2/sUCUM13 second per square millimeters/mm2UCUM14 milliliter per 100 gram per minuteml/[100]g/minUCUM15 milliliter per 100 milliliterml/[100]mlUCUM16 millimoles per kg wet weightmmol/kg{WetWeight}UCUM17 /min/minUCUM18 /s/sUCUM
19 CID nn20 Units of Diffusion Rate Area Over Time20 Type:21 Extensible22 Version:23 yyyymmdd
24 Table CID nn20. Units of Diffusion Rate Area Over Time
25 Code MeaningCode ValueCoding Scheme Designator26 mm2/smm2/sUCUM27 um2/msum2/msUCUM28 um2/sum2/sUCUM29 10-6.mm2/s10-6.mm2/sUCUM
30 Note
31 D DICOM Controlled Terminology Definitions (Normative)
32 Table D-1. DICOM Controlled Terminology Definitions
33 NotesDefinitionCode MeaningCode Value34 Signal intensity of a Spin tagging Perfusion MR image. Spin tagging is a35 technique for the measurement of blood perfusion, based on magnetically36 labeled arterial blood water as an endogenous tracer.
Spin Tagging PerfusionMR Signal Intensity
110800
37 Signal intensity of a Contrast Agent Angio MR image.Contrast Agent Angio MR38 Signal Intensity
110801
39 Signal intensity of a Time-of-flight (TOF) MR image. Time-of-flight (TOF)40 is based on the phenomenon of flow-related enhancement of spins entering41 into an imaging slice. As a result of being unsaturated, these spins give42 more signal that surrounding stationary spins.
Time Of Flight Angio MRSignal Intensity
110802
43 - Letter Ballot -
44 Page 8CP-1699 - Match units to quantities

1 NotesDefinitionCode MeaningCode Value2 Signal intensity of a Proton Density Weighted MR image. All MR images3 have intensity proportional to proton density. Images with very little T1 or4 T2 weighting are called 'PD-weighted'.
Proton Density WeightedMR Signal Intensity
110803
5 Signal intensity of T1 Weighted MR image. A T1 Weighted MR image is6 created typically by using short TE and TR times.
T1 Weighted MR SignalIntensity
110804
7 Signal intensity of a T2 Weighted MR image. T2 Weighted image contrast8 state is approached by imaging with a TR long compared to tissue T1 (to9 reduce T1 contribution to image contrast) and a TE between the longest10 and shortest tissue T2s of interest.
T2 Weighted MR SignalIntensity
110805
11 Signal intensity of a T2* Weighted MR image. The T2* phenomenon results12 from molecular interactions (spin spin relaxation) and local magnetic field13 non-uniformities, which cause the protons to precess at slightly different14 frequencies.
T2* Weighted MR SignalIntensity
110806
15 Signal intensity of a Field Map MR image. A Field Map MR image provides16 a direct measure of the B 17 0 inhomogeneity at each point in the image.
Field Map MR Signal18 Intensity
110807
19 Coefficient reflecting the fractional anisotropy of the tissues, derived from20 a diffusion weighted MR image. Fractional anisotropy is proportional to the21 square root of the variance of the Eigen values divided by the square root22 of the sum of the squares of the Eigen values.
Fractional Anisotropy110808
23 Coefficient reflecting the relative anisotropy of the tissues, derived from a24 diffusion weighted MR image.
Relative Anisotropy110809
25 Dxx Component of the diffusion tensor, quantifying the molecular mobility26 along the X axis.
Volumetric Diffusion DxxComponent
110810
27 Dxy Component of the diffusion tensor, quantifying the correlation of28 molecular displacements in the X and Y directions.
Volumetric Diffusion DxyComponent
110811
29 Dxz Component of the diffusion tensor, quantifying the correlation of30 molecular displacements in the X and Z directions.
Volumetric Diffusion DxzComponent
110812
31 Dyy Component of the diffusion tensor, quantifying the molecular mobility32 along the Y axis.
Volumetric Diffusion DyyComponent
110813
33 Dyz Component of the diffusion tensor, quantifying the correlation of34 molecular displacements in the Y and Z directions.
Volumetric Diffusion DyzComponent
110814
35 Dzz Component of the diffusion tensor, quantifying the molecular mobility36 along the Z axis.
Volumetric Diffusion DzzComponent
110815
37 Signal intensity of a T1 Weighted Dynamic Contrast Enhanced MR image.38 A T1 Weighted Dynamic Contrast Enhanced MR image reflects the39 dynamics of diffusion of the exogenous contrast media from the blood pool40 into the extra vascular extracellular space (EES) of the brain at a rate41 determined by the blood flow to the tissue, the permeability of the Brain42 Blood Barrier (BBB), and the surface area of the perfusing vessels.
T1 Weighted DynamicContrast Enhanced MRSignal Intensity
110816
43 Signal intensity of a T2 Weighted Dynamic Contrast Enhanced MR image.44 A T2 Weighted Dynamic Contrast Enhanced MR image reflects the T2 of45 tissue decrease as the Gd contrast agent bolus passes through the brain.
T2 Weighted DynamicContrast Enhanced MRSignal Intensity
110817
46 Signal intensity of a T2* Weighted Dynamic Contrast Enhanced MR image.47 A T2* Weighted Dynamic Contrast Enhanced MR image reflects the T2*48 of tissue decrease as the Gd contrast agent bolus passes through the49 brain.
T2* Weighted DynamicContrast Enhanced MRSignal Intensity
110818
50 Signal intensity of a Blood Oxygenation Level image. BOLD imaging is51 sensitive to blood oxygenation (but also to cerebral blood flow and volume).52 This modality is essentially used for detecting brain activation (functional53 MR).
Blood Oxygenation Level110819
54 - Letter Ballot -
55 Page 9CP-1699 - Match units to quantities

1 NotesDefinitionCode MeaningCode Value2 Accumulated decay event counts in a nuclear medicine projection image.Nuclear Medicine3 Projection Activity
110820
4 Accumulated decay event counts in a Nuclear Medicine Tomographic5 image (including PET).
Nuclear MedicineTomographic Activity
110821
6 Spatial Displacement along axis X of a non linear deformable spatial7 registration image. The X axis is defined in reference to the patient's8 orientation, and is increasing to the left hand side of the patient.
Spatial Displacement XComponent
110822
9 Spatial Displacement along axis Y of a non linear deformable spatial10 registration image. The Y axis is defined in reference to the patient's11 orientation, and is increasing to the posterior side of the patient.
Spatial Displacement YComponent
110823
12 Spatial Displacement along axis Z of a Non linear deformable spatial13 registration image. The Z axis is defined in reference to the patient's14 orientation, and is increasing toward the head of the patient.
Spatial Displacement ZComponent
110824
15 Measured resistance to the flow of blood. E.g., through the vasculature or16 through a heart value.
Hemodynamic Resistance110825
17 Measured resistance to the flow of blood. E.g., through the vasculature or18 through a heart value, normalized to a particular indexed scale.
Indexed HemodynamicResistance
110826
19 Velocity of tissue based on Doppler measurements.Tissue Velocity11082720 Velocity of blood flow based on Doppler measurements.Flow Velocity11082821 Statistical variance of blood velocity relative to mean.Flow Variance11082922 Scalar value related to the elastic properties of the tissue.Elasticity11083023 Scalar value related to the volume of blood perfusing into tissue.Perfusion11083124 Speed of sound in tissue.Speed of sound11083225 Reduction in strength of ultrasound signal as the wave.Ultrasound Attenuation11083326 Red component of a true color image (RGB).RGB R Component11083427 Green component of a true color image (RGB).RGB G Component11083528 Blue component of a true color image (RGB).RGB B Component11083629 Y (Luminance) component of a YBR FULL image, as defined in JPEG30 2000.
YBR FULL Y Component110837
31 CB (Blue chrominance) component of a YBR FULL image, as defined in32 JPEG 2000.
YBR FULL CB Component110838
33 CR (Red chrominance) component of a YBR FULL image, as defined in34 JPEG 2000.
YBR FULL CR Component110839
35 Y (Luminance) component of a YBR PARTIAL image, as defined in JPEG36 2000.
YBR PARTIAL YComponent
110840
37 CB (Blue chrominance) component of a YBR PARTIAL image, as defined38 in JPEG 2000.
YBR PARTIAL CBComponent
110841
39 CR (Red chrominance) component of a YBR PARTIAL image, as defined40 in JPEG 2000.
YBR PARTIAL CRComponent
110842
41 Y (Luminance) component of a YBR ICT image (Irreversible Color42 Transform), as defined in JPEG 2000.
YBR ICT Y Component110843
43 CB (Blue chrominance) component of a YBR ICT image (Irreversible Color44 Transform), as defined in JPEG 2000.
YBR ICT CB Component110844
45 CR (Red chrominance) component of a YBR ICT image (Irreversible Color46 Transform), as defined in JPEG 2000.
YBR ICT CR Component110845
47 Y (Luminance) component of a YBR RCT image (Reversible Color48 Transform), as defined in JPEG 2000.
YBR RCT Y Component110846
49 - Letter Ballot -
50 Page 10CP-1699 - Match units to quantities

1 NotesDefinitionCode MeaningCode Value2 CB (Blue chrominance) component of a YBR RCT image (Reversible Color3 Transform), as defined in JPEG 2000.
YBR RCT CB Component110847
4 CR (Red chrominance) component of a YBR RCT image (Reversible Color5 Transform), as defined in JPEG 2000.
YBR RCT CR Component110848
6 The ability of a material to create an ultrasound return echo.Echogenicity1108497 Decrease in the number of photons in an X-Ray beam due to interactions8 with the atoms of a material substance. Attenuation is due primarily to two9 processes, absorption and scattering.
X-Ray Attenuation110850
10 Retired.11 Replaced by12 (112031,13 DCM,14 "Attenuation15 Coefficient").
Coefficient that describes the fraction of a beam of X-Rays or gamma raysthat is absorbed or scattered per unit thickness of the absorber. This valuebasically accounts for the number of atoms in a cubic cm volume of materialand the probability of a photon being scattered or absorbed from thenucleus or an electron of one of these atoms.
X-Ray AttenuationCoefficient
110851
16 Signal intensity of an MR image, not otherwise specified.MR signal intensity11085217 Binary value denoting that the segmented property is present.Binary Segmentation11085318 Probability, defined as a percentage, that the segmented property occupies19 the spatial area defined by the voxel.
Fractional ProbabilisticSegmentation
110854
20 Percentage of the voxel area occupied by the segmented property.Fractional Occupancy21 Segmentation
110855
22 Spatial dimension, denoting a linear displacement.Linear Displacement11085623 Dimension denoting the energy (frequency or wavelength) of photons.Photon Energy11085724 Dimension used to sequence events, to compare the duration of events25 and the intervals between events.
Time110858
26 Spatial dimension, denoting an angle.Angle11085927 A quantitative numerical statement of the relative attenuation of the X-Ray28 beam at a specified point. Coefficient that describes the fraction of a beam29 of X-Rays or gamma rays that is absorbed or scattered per unit thickness30 of the absorber. This value basically accounts for the number of atoms in31 a cubic cm volume of material and the probability of a photon being32 scattered or absorbed from the nucleus or an electron of one of these33 atoms. Usually expressed in Hounsfield units [referred to as CT Number34 in Fraser and Pare].
Attenuation Coefficient112031
35 An X-Ray attenuation coefficient that is used as a threshold. E.g., in calcium36 scoring.
Threshold AttenuationCoefficient
112032
37 Values are derived by calculation of the apparent diffusion coefficient.Apparent Diffusion38 Coefficient
113041
39 Values are derived by calculation of the diffusion weighting.Diffusion weighted11304340 The time required for blood to pass through a region of tissue.Mean Transit Time11305241 The absoluteflow rate of blood perfusing a region of the brain as volume42 per mass per unit of time. The mass divisor may be approximated by43 a measurement of volume assuming a tissue density of 1.
Regional Cerebral Blood44 Flow
113055
45 The absolutevolume of blood perfusing a region of brain as as volume46 per mass. The mass divisor may be approximated by a measurement47 of volume assuming a tissue density of 1.
Regional Cerebral Blood48 Volume
113056
49 Correlation Coefficient, r.R-Coefficient11305750 Values are derived by calculating proton density values.Proton Density11305851 Values are derived by calculating signal change values.Signal Change11305952 Values are derived by calculating the signal to noise ratio.Signal to Noise113060
53 - Letter Ballot -
54 Page 11CP-1699 - Match units to quantities

1 NotesDefinitionCode MeaningCode Value2 Values are derived by calculating the standard deviation of two or more3 images.
Standard Deviation113061
4 Values are derived by the pixel by pixel subtraction of two images.Pixel by pixel subtraction1130625 The time constant for the decay of longitiudinal magnetization caused by6 spin-lattice relaxation. The inverse of the longitudinal relaxation rate7 constant, i.e., T1 = 1/R1.
T1113063
8 The time constant for the decay of transverse magnetization caused by a9 combination of spin-spin relaxation and magnetic field inhomogeneity. The10 inverse of the transverse relaxation rate constant, i.e., T2* = 1/R2*.
T2*113064
11 The time constant for the decay of transverse magnetization caused by12 spin-spin relaxation. The inverse of the transverse relaxation rate constant,13 i.e., T2 = 1/R2.
T2113065
14 Values are derived by calculating values based on the time course of signal.Time Course of Signal11306615 Values are derived by calculating values based on temperature encoding.Temperature encoded11306716 Values are derived by calculating the value of the Student's T-Test statistic17 from multiple image samples.
Student's T-Test113068
18 The time from the start of the contrast agent injection to the maximum19 enhancement value.
Time To Peak113069
20 Values are derived by calculating values based on velocity encoded. E.g.,21 phase contrast.
Velocity encoded113070
22 Values are derived by calculating the value of the Z-Score statistic from23 multiple image samples.
Z-Score113071
24 For single-proton MR spectroscopy, the resonance peak corresponding to25 glutamate and glutamine.
Glutamate and glutamine113080
26 For single-proton MR spectroscopy, the ratio between the Choline and27 Creatine resonance peaks.
Choline/Creatine Ratio113081
28 For single-proton MR spectroscopy, the ratio between the N-acetylaspartate29 and Creatine resonance peaks.
N-acetylaspartate/Creatine Ratio
113082
30 For single-proton MR spectroscopy, the ratio between the N-acetylaspartate31 and Choline resonance peaks.
N-acetylaspartate /CholineRatio
113083
32 The time delay to the maximum of the residue function after deconvolution.
33 Shih LC, Saver JL, Alger JR, Starkman S, Leary MC, Vinuela F, et al.34 Perfusion-Weighted Magnetic Resonance Imaging Thresholds Identifying35 Core, Irreversibly Infarcted Tissue. Stroke. 2003 Jun 1;34(6):1425–30.36 doi:10.1161/01.STR.0000072998.70087.E9 http://stroke.ahajournals.org/37 content/34/6/1425.abstract
38 Østergaard L, Weisskoff RM, Chesler DA, Gyldensted C, Rosen BR. High39 resolution measurement of cerebral blood flow using intravascular tracer40 bolus passages. Part I: Mathematical approach and statistical analysis.41 Magnetic Resonance in Medicine. 1996;36(5):715–25.42 doi:10.1002/mrm.1910360510 http://onlinelibrary.wiley.com/doi/10.1002/43 mrm.1910360510/abstract
Tmax113084
44 For single-proton MR spectroscopy, the resonance peak corresponding to45 creatine and choline.
Creatine and Choline113094
46 For single-proton MR spectroscopy, the resonance peak corresponding to47 lipid and lactate.
Lipid and Lactate113095
48 For single-proton MR spectroscopy, the ratio between the Choline and49 Creatine resonance peak and the Citrate resonance peak.
Creatine+Choline/ CitrateRatio
113096
50 - Letter Ballot -
51 Page 12CP-1699 - Match units to quantities

1 NotesDefinitionCode MeaningCode Value2 Image pixels created through proportional weighting of multiple acquisitions3 at distinct X-Ray energies.
Multi-energy proportionalweighting
113097
4 Magnetization Transfer Ratio (MTR) is the ratio of magnetization transfer,5 Mo - Ms/Mo, where Ms represents the magnitude of signal of tissues with6 the saturation pulse used to saturate macromolecular protons on, and Mo7 is the magnitude of signal without saturation.
8 See Dousset V, Grossman RI, Ramer KN, Schnall MD, Young LH,9 Gonzalez-Scarano F, et al. Experimental allergic encephalomyelitis and10 multiple sclerosis: lesion characterization with magnetization transfer11 imaging. Radiology. 1992 Feb 1;182(2):483–91.12 http://dx.doi.org/10.1148/radiology.182.2.1732968
Magnetization TransferRatio
113098
13 Coefficient of determination, R14 2. An indication of goodness of fit.R2-Coefficient12622015 K16 trans, the volume transfer constant of a tracer diffusion kinetic model,17 specifically the volume transfer constant between blood plasma and18 extravascular extracellular space (EES)
19 See Tofts et al, "Estimating Kinetic Parameters From Dynamic20 Contrast-Enhanced T1-Weighted MRI of a Diffusable Tracer: Standardized21 Quantities and Symbols", Journal of Magnetic Resonance Imaging, vol.22 10, pp. 223–232, 1999.
Ktrans126312
23 k24 ep, the rate constant between extravascular extracellular space (EES)25 and blood plasma
26 See Tofts et al, "Estimating Kinetic Parameters From Dynamic27 Contrast-Enhanced T1-Weighted MRI of a Diffusable Tracer: Standardized28 Quantities and Symbols", Journal of Magnetic Resonance Imaging, vol.29 10, pp. 223–232, 1999.
kep126313
30 v31 e, the fractional (not absolute) volume of extravascular extracellular space32 (EES) per unit volume of tissue
33 See Tofts et al, "Estimating Kinetic Parameters From Dynamic34 Contrast-Enhanced T1-Weighted MRI of a Diffusable Tracer: Standardized35 Quantities and Symbols", Journal of Magnetic Resonance Imaging, vol.36 10, pp. 223–232, 1999.
ve126314
37 The initial area under the contrast agent concentration–time curveIAUC12632038 The initial area under the contrast agent concentration–time curve at 6039 seconds after the onset time
IAUC60126321
40 The initial area under the contrast agent concentration–time curve at 9041 seconds after the onset time
IAUC90126322
42 The initial area under the contrast agent concentration–time curve at 18043 seconds after the onset time
IAUC180126323
44 The initial area under the contrast agent concentration–time curve,45 normalized with the corresponding arterial input function, such that IAUC46 BN47 = IAUC / IAUC48 AIF.
IAUCBN126324
49 The initial area under the contrast agent concentration–time curve at 6050 seconds after the onset time, normalized with the corresponding arterial51 input function, such that IAUC6052 BN = IAUC60 / IAUC60AIF.
IAUCBN60126325
53 The initial area under the contrast agent concentration–time curve at 9054 seconds after the onset time, normalized with the corresponding arterial55 input function, such that IAUC9056 BN = IAUC90 / IAUC90AIF.
IAUCBN90126326
57 - Letter Ballot -
58 Page 13CP-1699 - Match units to quantities

1 NotesDefinitionCode MeaningCode Value2 The initial area under the contrast agent concentration–time curve at 1803 seconds after the onset time, normalized with the corresponding arterial4 input function, such that IAUC1805 BN = IAUC180 / IAUC180AIF.
AUCBN180126327
6 τ7 m. The mean intracellular water lifetime (τi). Used in the Shutter-Speed8 Model (SSM) of tracer kinetics.
tau_m126330
9 v10 p. The fractional (not absolute) blood plasma volume per unit volume of11 tissue.
12 See Tofts et al, "Estimating Kinetic Parameters From Dynamic13 Contrast-Enhanced T1-Weighted MRI of a Diffusable Tracer: Standardized14 Quantities and Symbols", Journal of Magnetic Resonance Imaging, vol.15 10, pp. 223–232, 1999.
vp126331
16 The time at which the concentration-time curve achieves its peak for the17 first time. Used as a concept name for a value or as a method. E.g., used18 as a method of calculation for BAT. See Shpilfoygel Med Phys 2008. doi:19 10.1118/1.1288669
Time of PeakConcentration
126370
20 The nominal time at which arrival of a contrast bolus is detected, which is21 used as a reference point for subsequent calculations. Used as a concept22 name for a value or as a method. No specific computational method is23 implied by this general definition. Abbreviated BAT.
Bolus Arrival Time126371
24 The time at which the concentration-time curve achieves half of its peak25 density for the first time. Used as a concept name for a value or as a26 method. E.g., used as a method of calculation for BAT. See Shpilfoygel27 Med Phys 2008. doi: 10.1118/1.1288669
Time of Leading Half-PeakConcentration
126372
28 A threshold applied to the temporal derivative of the concentration-time29 curve. E.g., used to establish BAT. See Shpilfoygel Med Phys 2008. doi:30 10.1118/1.1288669
Temporal DerivativeThreshold
126374
31 The maximum rate of signal intensity change within a measured region of32 a time-activity curve. See Boonsirikamchai, Piyaporn, Harmeet Kaur,33 Deborah A. Kuban, Edward Jackson, Ping Hou, and Haesun Choi. “Use34 of Maximum Slope Images Generated From Dynamic Contrast-Enhanced35 MRI to Detect Locally Recurrent Prostate Carcinoma After Prostatectomy:36 A Practical Approach.” American Journal of Roentgenology 198, no. 337 (March 1, 2012): W228–W236. doi:10.2214/AJR.10.6387.
Maximum Slope126375
38 The maximum degree of signal intensity change within a measured region39 of a time-activity curve. See Boonsirikamchai, Piyaporn, Harmeet Kaur,40 Deborah A. Kuban, Edward Jackson, Ping Hou, and Haesun Choi. “Use41 of Maximum Slope Images Generated From Dynamic Contrast-Enhanced42 MRI to Detect Locally Recurrent Prostate Carcinoma After Prostatectomy:43 A Practical Approach.” American Journal of Roentgenology 198, no. 344 (March 1, 2012): W228–W236. doi:10.2214/AJR.10.6387.
Maximum Difference126376
45 Tracer concentration in tissue. E.g., in a DCE-MR experiment, the46 concentration of contrast agent in mmol/l.
Tracer Concentration126377
47 The degree to which a paramagnetic contrast agent can enhance the proton48 longitudinal relaxation rate constant (R1, 1/T1), normalized to the49 concentration of the contrast agent. Also referred to as r1. Typically50 expressed in units of l/mmol/s.
Contrast LongitudinalRelaxivity
126380
51 The absolute flow rate of blood perfusing a region as volume per mass52 per unit of time. The mass divisor may be approximated by a53 measurement of volume assuming a tissue density of 1.
Regional Blood Flow126390
54 The absolute volume of blood perfusing a region as volume per mass.55 The mass divisor may be approximated by a measurement of volume56 assuming a tissue density of 1.
Regional Blood Volume126391
57 - Letter Ballot -
58 Page 14CP-1699 - Match units to quantities
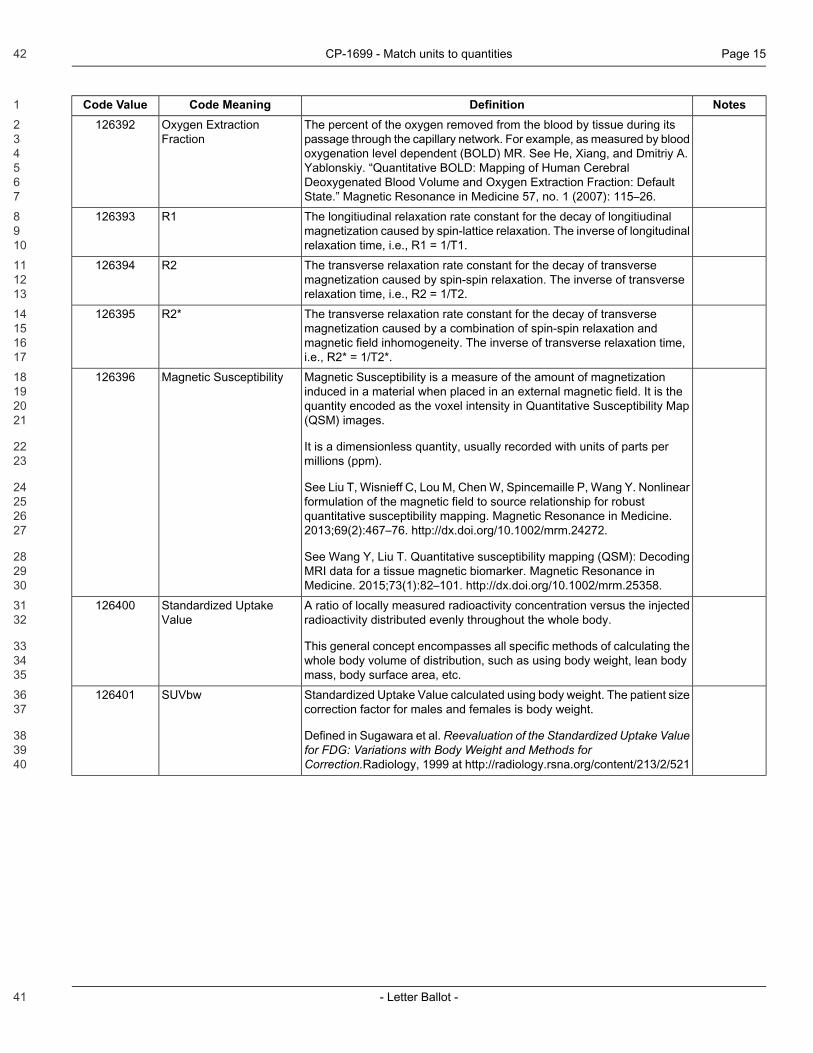
1 NotesDefinitionCode MeaningCode Value2 The percent of the oxygen removed from the blood by tissue during its3 passage through the capillary network. For example, as measured by blood4 oxygenation level dependent (BOLD) MR. See He, Xiang, and Dmitriy A.5 Yablonskiy. “Quantitative BOLD: Mapping of Human Cerebral6 Deoxygenated Blood Volume and Oxygen Extraction Fraction: Default7 State.” Magnetic Resonance in Medicine 57, no. 1 (2007): 115–26.
Oxygen ExtractionFraction
126392
8 The longitiudinal relaxation rate constant for the decay of longitiudinal9 magnetization caused by spin-lattice relaxation. The inverse of longitudinal10 relaxation time, i.e., R1 = 1/T1.
R1126393
11 The transverse relaxation rate constant for the decay of transverse12 magnetization caused by spin-spin relaxation. The inverse of transverse13 relaxation time, i.e., R2 = 1/T2.
R2126394
14 The transverse relaxation rate constant for the decay of transverse15 magnetization caused by a combination of spin-spin relaxation and16 magnetic field inhomogeneity. The inverse of transverse relaxation time,17 i.e., R2* = 1/T2*.
R2*126395
18 Magnetic Susceptibility is a measure of the amount of magnetization19 induced in a material when placed in an external magnetic field. It is the20 quantity encoded as the voxel intensity in Quantitative Susceptibility Map21 (QSM) images.
22 It is a dimensionless quantity, usually recorded with units of parts per23 millions (ppm).
24 See Liu T, Wisnieff C, Lou M, Chen W, Spincemaille P, Wang Y. Nonlinear25 formulation of the magnetic field to source relationship for robust26 quantitative susceptibility mapping. Magnetic Resonance in Medicine.27 2013;69(2):467–76. http://dx.doi.org/10.1002/mrm.24272.
28 See Wang Y, Liu T. Quantitative susceptibility mapping (QSM): Decoding29 MRI data for a tissue magnetic biomarker. Magnetic Resonance in30 Medicine. 2015;73(1):82–101. http://dx.doi.org/10.1002/mrm.25358.
Magnetic Susceptibility126396
31 A ratio of locally measured radioactivity concentration versus the injected32 radioactivity distributed evenly throughout the whole body.
33 This general concept encompasses all specific methods of calculating the34 whole body volume of distribution, such as using body weight, lean body35 mass, body surface area, etc.
Standardized UptakeValue
126400
36 Standardized Uptake Value calculated using body weight. The patient size37 correction factor for males and females is body weight.
38 Defined in Sugawara et al. Reevaluation of the Standardized Uptake Value39 for FDG: Variations with Body Weight and Methods for40 Correction.Radiology, 1999 at http://radiology.rsna.org/content/213/2/521
SUVbw126401
41 - Letter Ballot -
42 Page 15CP-1699 - Match units to quantities

1 NotesDefinitionCode MeaningCode Value2 Standardized Uptake Value calculated using lean body mass by James3 method. The patient size correction factor for males is 1.10 * weight - (1204 or 128) * (weight/height) ^2, and for females is 1.07 * weight - 148 *5 (weight/height) ^2.
6 Defined in Sugawara et al. Reevaluation of the Standardized Uptake Value7 for FDG: Variations with Body Weight and Methods for8 Correction.Radiology, 1999 at http://radiology.rsna.org/content/213/2/521,9 except that either 120 or 128 may be used as the multiplier parameter for10 males).
11 Unfortunately, Sugawara used a parameter of 120 rather than 128,12 propagating an error in Morgan DJ, Bray KM. Lean Body Mass as a13 Predictor of Drug Dosage: Implications for Drug Therapy. Clinical14 Pharmacokinetics. 1994;26(4):292–307, which misquoted the original LBM15 definition that used 128 in James WPT, Waterlow JC. Research on Obesity:16 A Report of the DHSS/MRC Group. London: Her Majesty’s Stationery17 Office; 1976. Implementations differ in whether they have used 120 or 12818 when using this code. See Kelly M. SUV: Advancing Comparability and19 Accuracy. Siemens; 2009. Available from: http://www.mpcphysics.com/20 documents/SUV_Whitepaper_Final_11.17.09_59807428_2.pdf.
SUVlbm126402
21 Standardized Uptake Value calculated using body surface area. The patient22 size correction factor for males and females is weight^ 0.425 * height^0.72523 * 0.007184.
24 Defined in Sugawara et al. Reevaluation of the Standardized Uptake Value25 for FDG: Variations with Body Weight and Methods for26 Correction.Radiology, 1999 at http://radiology.rsna.org/content/213/2/521
SUVbsa126403
27 Standardized Uptake Value calculated using ideal body weight. The patient28 size correction factor for males is 48.0 + 1.06 * (height - 152) and for29 females is 45.5 + 0.91 * (height - 152).
30 Defined in Sugawara et al. Reevaluation of the Standardized Uptake Value31 for FDG: Variations with Body Weight and Methods for32 Correction.Radiology, 1999 at http://radiology.rsna.org/content/213/2/521
SUVibw126404
33 Standardized Uptake Value calculated using lean body mass by34 Janmahasatian method. The patient size correction factor for males is35 9.27E3 * weight / (6.68E3 + 216 * weight / (height^2)) and for females is36 9.27E3 * weight / (8.78E3 + 244 * weight / (height^2)).
37 Defined in Janmahasatian et al. Quantification of Lean Bodyweight. Clin38 Pharmacokinet. 2005 Oct 1;44(10):1051–65. at http://dx.doi.org/10.2165/39 00003088-200544100-00004 and its role in SUVlbm(Janma) calculation40 is discussed in Tahari et al. Optimum Lean Body Formulation for Correction41 of Standardized Uptake Value in PET Imaging. Journal of Nuclear Medicine.42 2014 Sep 1;55(9):1481–4. at http://jnm.snmjournals.org/content/55/9/1481.
SUVlbm(Janma)126405
43 Standardized Uptake Value calculated using lean body mass by James44 method, using the originally published 128 multiplier for males. The patient45 size correction factor for males is 1.10 * weight - 128) * (weight/height) ^2,46 and for females is 1.07 * weight - 148 * (weight/height) ^2.
SUVlbm(James128)126406
47 - Letter Ballot -
48 Page 16CP-1699 - Match units to quantities