Embed Size (px)
Citation preview
208
16 EcosystemsOutofBalance
Overview
In this activity, students interpret population graphs as they
investigate four fisheries that are altering surrounding eco-
systems. Students advise the fisheries on the consequences of
their fishing and how to make their fishery more sustainable.
Key COntent
1. Relationships between species in an ecosystem are
interdependent.
2. Changes in the population of a species within an ecosys-
tem affect other species in that ecosystem.
3. Removing a species from an ecosystem can have unin-
tended consequences.
4. Some fisheries have significantly damaged associated
ecosystems.
5. Changes in the population dynamics of an ecosystem can
be a factor in an invasive species becoming established
within that ecosystem.
6. Sustainable management of ecosystem services depends
on continual input from scientists and other experts.
Key PrOCess sKills
1. Students graph and analyze data.
2. Students interpret data.
3. Students identify and describe trends in data.
4. Students make accurate interpretations, inferences, and
conclusions from text.
Materials and advanCe PreParatiOn
For the teacher transparency 16.1, “Pacific Halibut Population”
transparency 16.2, “Pacific Halibut Food Web”
transparency 16.3, “Pacific-Halibut-dominated Ecosystem Graph”
transparency of Scoring Guide: ANALYZING DATA (AD)
transparency of Scoring Guide: UNDERSTANDING
CONCEPTS (UC)
For each student Student Sheet 16.1, “Cod-dominated Ecosystem Graph”
Student Sheet 16.2, “Tiger-shark-dominated Ecosystem Graph”
Student Sheet 16.3, “Orca-dominated Ecosystem Graph”
Student Sheet 16.4, “Caspian-seal-dominated Ecosystem Graph”
Scoring Guide: ANALYZING DATA (AD) (optional)
Scoring Guide: UNDERSTANDING CONCEPTS (UC)
(optional) *Not supplied in kit
Masters for Scoring Guides are in Teacher Resources IV:
Assessment.
teaChing suMMary
Getting Started
• Reviewthepopulationgraphsforanecosystemwitha
sustainable fishery.
Doing the Activity
• Studentsformulatehypothesesontheimpactoffishing
on four ecosystems.
• (AD ASSESSMENT) Students analyze how sustainable fish-
ery practices might alter the effects seen in the fisheries’
ecosystems.
Follow-up
• (UC ASSESSMENT) (AD ASSESSMENT) The class discusses why
sustainable practices are not currently implemented in
all fisheries.
investigation • 1–2 class sessions
209
eCOsysteMs Out Of balanCe • aCtivity 16
baCKgrOund infOrMatiOn
Scientists have documented many instances of the effect of
ecosystem disruption due to species removal. Some ecosys-
tems have a keystone species, which if removed, critically
disrupts the balance for the ecosystem. One of the best-
known examples of this is the sea otter and the kelp forests.
Sea otters were hunted so much in the 18th and 19th centu-
ries that by early in the 20th century they were near extinc-
tion. At this point scientists documented that the numbers of
sea urchins, once prey for the otters, increased dramatically,
consuming kelp forests and leaving rocky barrens devoid of
the vast array of species that had resided there previously.
This is referred to as a cascade effect, where the removal of
one species causes a number of associated species to be
affected as a result. The cascade effect is not limited to
removal of a species, but can also occur with the introduc-
tion of an invasive species or as the result of an ecological
disturbance. In the case of the sea otter, when they were no
longer hunted, the populations eventually began to recover,
and the kelp forests and associated ecosystems slowly
returned as well. It should be noted, however, that in most
instances the interactions are much more complex.
Initial theories approached the cascade effect as either
“top down” (when the apex predator[s] of a food chain was
removed) or “bottom up” (when the producers for an
ecosystem were removed). As scientific understanding of eco-
system interactions has deepened, it has become clear that
ecosystems can compensate to a degree if disrupted, but that
too much disruption throws the ecosystem out of balance,
causing a cascade effect. This can occur due to the loss of one
species, or the reduction of several species.
Fisheries have been found to have a major impact on many
ecosystems, although the effects are often not immediately
apparent. For example, if an apex predator, such as a shark,
were heavily fished, the species it had preyed on would
increase due to lack of pressure from predation. As that spe-
cies increases, its prey will decrease, and so on. In some
instances the removal of a species (due to overfishing or
other factors) has led to shifts in ecosystems whereby species
are consuming less desirable prey. Stellar sea lions off Alaska,
for example, have switched from eating herring to eating
pollock, which have a lower nutritional value. In other cases
overfishing has led to complete ecosystem collapse, such as
off the coast of Namibia in Africa where overfishing of most
fish in the ecosystem is believed to have led to massive jelly-
fish blooms due to the cascade effects of overfishing.
It is also important to note that ecosystems are in a constant
state of flux. Scientists once believed that a “healthy” eco-
system exhibited only minor fluctuations unless there was
some kind of disturbance. They have now found that many
populations regularly undergo large fluctuations, and not
necessarily in response to major disturbances such as vol-
canic eruptions or floods.
210
sCienCe and glObal issues/biOlOgy • eCOlOgy
getting started
1 Start by asking students, What
do you think population levels would
look like if you graphed them for an
ecosystem that had no pressure from
fisheries?
Students’ answers should point out
that while population levels of the
species in the ecosystem might fluc-
tuate a bit, they should remain fairly
constant. Then ask students, based
on what they have studied, What do
you expect to happen to the graph if
an important species within the eco-
system were overfished?
They should point out that the levels
of all populations might change,
either going up if they were a prey
species, relative to the organism
being fished, or down if they were a
predator species. Ask the students, If
the fishery were sustainable, would
you expect the same results?
Students should answer that they
would not expect to see as much of
an impact, if any. If necessary,
remind students that a fishery
would be considered sustainable if
it allows the ecosystem to remain in
a relatively stable state.
Project Transparency 16.1, “Pacific
Halibut Population.” Discuss the graph, noting the labels on
the axes and what is happening to population levels. Next,
project Transparency 16.2, “Pacific Halibut Food Chain.”
Review the food chain with the students and have them sug-
gest the roles of the organisms in the food chain. Now
project Transparency 16.3, “Pacific-halibut-dominated Eco-
system.” Have students identify which line correlates with
each organism, and what the different axes of the graph
show. Ask the students, Do you think this is a stable, healthy
ecosystem? What evidence supports your thinking?
Students should answer yes because the population levels
for all organisms stay fairly steady with slight fluctuations
relative to each other. Be sure to clear up any misconcep-
tions about the slight fluctuations in the population levels.
Students should understand that population levels will
normally not be a flat line, and some fluctuation is normal.
Ask the students, What do you notice about the population
levels for the different organisms?
129
16 Ecosystems Out of Balance
ORGANISMS WITHIN an ecosystem interact at
all levels, depending on each other for their
survival, either directly for food or shelter, or indi-
rectly through the carbon cycle. As you saw in the
previous activity, both native and introduced species
have a signifi cant effect on the ecosystem around
them. The entire ecosystem is a complex network
that can be drastically altered if the population of one
(or more) species goes into a decline or a surge. In
this activity you will take on the role of a fi sheries
biologist and determine how to make several fi sheries
more sustainable.
You are a fi sheries biologist who has, in the past,
advised the Pacifi c halibut (Hippoglossus stenolepis)
fi shery, which is known for its successful sustainable
practices. The Pacifi c halibut fi shery is carefully moni-
tored, and each year you and other fi sheries biologists
make a new set of recommendations on where and
how many fi sh can be caught. The limits are adopted by
the entire fi shery. Several other fi sheries have asked for
your expert advice. These fi sheries would like you to
examine population data and other information for the
species they fi sh and the species’ ecosystems and, if they
are not sustainable, to advise on how to make them
more sustainable.
ChallengeHow does information about relationships among organisms help to determine the�
sustainability of a species and an ecosystem?
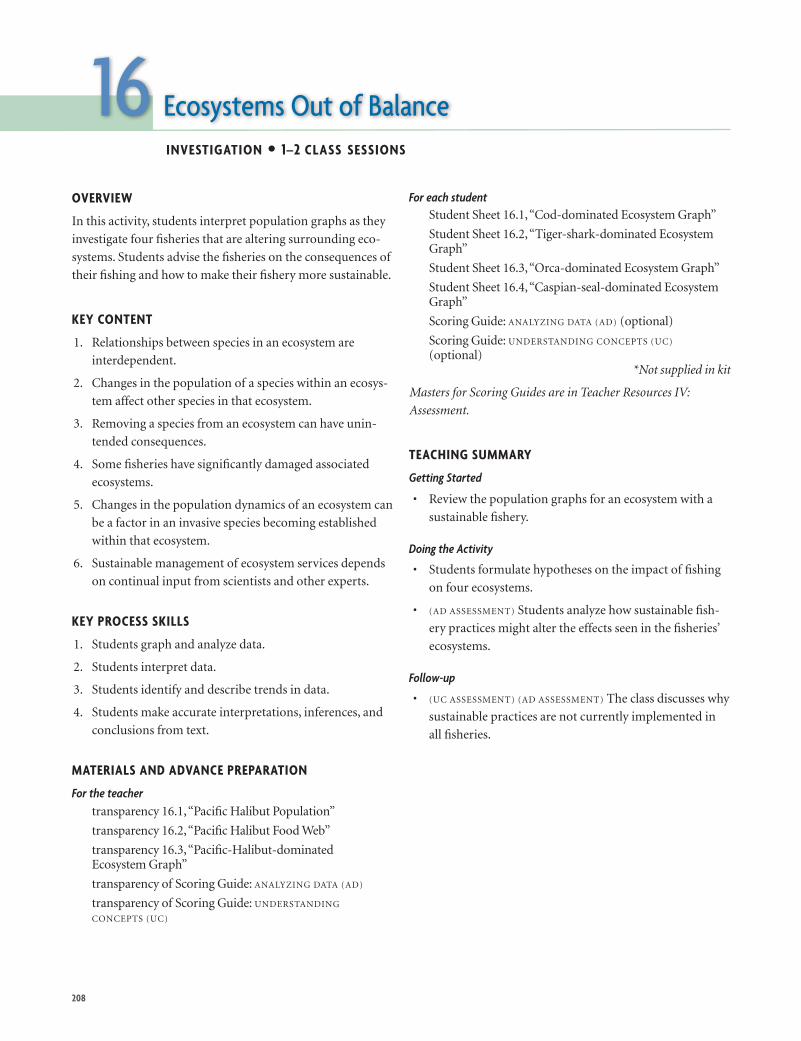
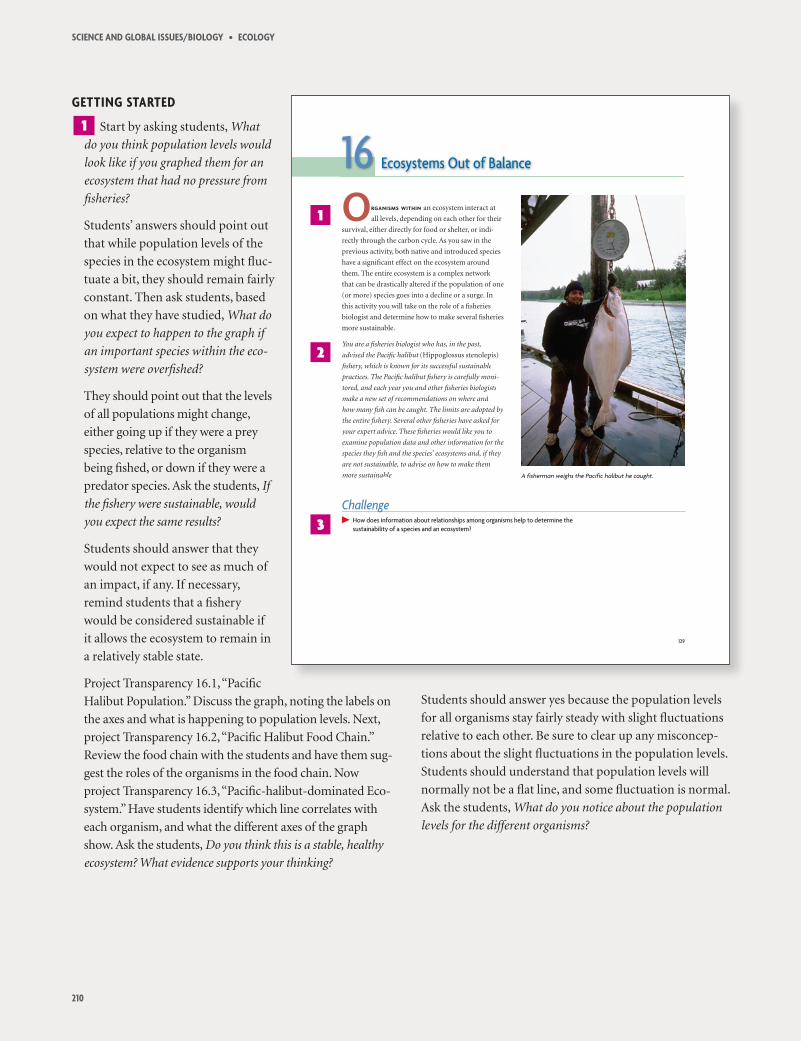
A fisherman weighs the Pacific halibut he caught.
1
2
3
eCOsysteMs Out Of balanCe • aCtivity 16
211
Students should point out that the
brittle stars and Pacific halibut
follow the same pattern, and that
the sablefish do the opposite. Then
review the food chain with the stu-
dents. Remind them that an upward
arrow indicates that the organism
above gets energy from (eats) the
organism below. Have the students
examine the graph at two specific
points in time, one from the begin-
ning of the graph and one from the
end. Ask the students to describe
what the data show at each point. If
necessary, model a statement for
them. For example: In 1975, the hal-
ibut and brittle star populations
were about the same, and they were
larger than the sablefish’s. In 2000,
the sablefish population was greater
while the halibut and brittle star
populations were lower, but still
about the same as each other.
2 Ask the students, Based on the
information in the food chain we saw,
what do you think is happening
within the ecosystem?
Guide the students, as necessary, to
the conclusion that as the Pacific
halibut population increases, they
consume more sablefish, so the
sablefish population decreases.
Have the students take a top-down approach, and have
them start with the apex predator, in this case the halibut,
and work their way down the food chain. (This tactic will
make the activity run more smoothly than if they started
just anywhere in the chain.) Students should determine
that as the sablefish population decreases, the brittle star
population increases because fewer of them are being
eaten by sablefish. Students should also notice that there
comes a point when this relationship changes, likely due to
an abundance of brittle stars (prey for sablefish) and rela-
tive scarcity of halibut to prey on the sablefish, and the
pattern reverses. Over time, the pattern repeats itself, so
that overall, all of the populations in the ecosystem remain
fairly steady.
3 After students read the introduction, tell them that
Pacific halibut comprise a large, commercial fishery off
of the west coasts of the United States and Canada. Ask
students, Based on what you have seen, do you think this is
a sustainable fishery? What indicators are you looking at to
determine this?
Students should answer that the fishery is sustainable,
which is indicated by the continued relatively steady popu-
lation levels for both the halibut and the other organisms
within its ecosystem. Ask the students, What would you
expect to be different on a population graph for an ecosystem
of a fishery that is not sustainable?
SCIENCE & GLOBAL ISSUES/BIOLOGY • ECOLOGY
130
MATERIALS
FOR EACH STUDENT
Student Sheet 16.1, “Cod-dominated Ecosystem Graph”, y p
Student Sheet 16.2, “Tiger-shark-dominated Ecosystem Graph”, g y p
Student Sheet 16.3, “Orca-dominated Ecosystem Graph”, y p
Student Sheet 16.4, “Caspian-seal-dominated Ecosystem Graph”, p y p
ProcedurePart A: Evaluating Fisheries’ Sustainability
1. With your group, examine the food chain for the cod-dominated ecosystem,
and the corresponding graph on Student Sheet 16.1, “Cod-dominated Eco-
system.” This ecosystem is found in the North Atlantic Ocean.
2. Identify the role of each species in the food chain by determining what they
eat and what they are eaten by.
3. With the key, label each line on the graph with the name of the organism.
4. Choose one time point on the graph, toward the beginning. Based on the
information provided in the graph, explain in detail what is happening at this
point with each species, relative to the other populations in the ecosystem.
Write your description in your science notebook.
5. Choose a time point on the graph that is toward the end. Based on the infor-
mation provided in the graph, explain in detail what is happening at this
point with each species in the ecosystem. Include what this means about the
food-chain relationships between the species. Write your description in your
science notebook.
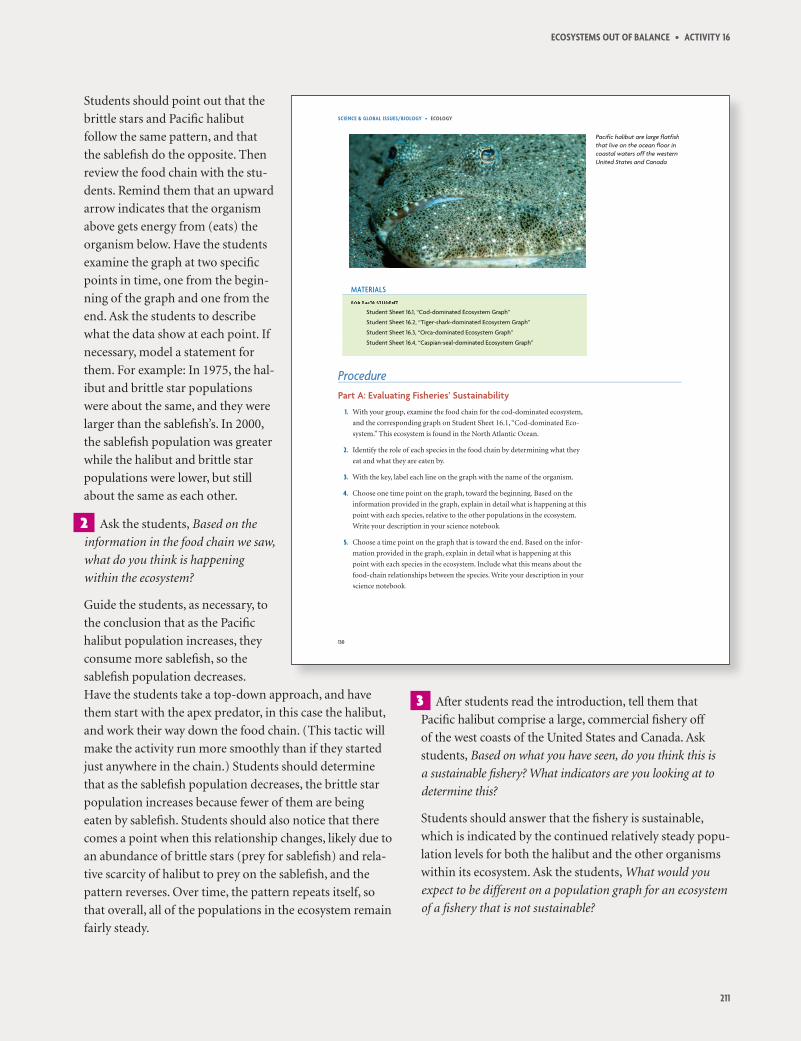
Pacific halibut are large flatfish that live on the ocean floor incoastal waters off the westernUnited States and Canada.
212
sCienCe and glObal issues/biOlOgy • eCOlOgy
Students should answer that they
expect the population levels to
change and not follow the same pat-
terns. They should recognize that
the population levels would not stay
relatively steady.
dOing the aCtivity
4 (AD ASSESSMENT) Procedure Step 7
is an opportunity for you to use the
ANALYZING DATA Scoring Guide to
asses students’ ability to correctly
identify and describe trends and
relationships between variables.
Sample Level-3 responses for each
ecosystem are shown on the next
page. Students may need varying
levels of support, depending on their
comfort level with analyzing graphs,
particularly the orca-dominated
ecosystem where the relationships
are more complex. If students need
assistance analyzing the graphs, you
may want to suggest that they look
first at what is happening with the
population that is being fished and
work up or down the food chain
from there, or that they work their
way through the graph asking
themselves, “If species X is declining
and it eats species Y, what is hap-
pening to species Y?” If students
question the initial rise in the bay scallop population in
the tiger-shark- dominated ecosystem, you might point
them to the brief reading, which tells them that there was a
bay scallop crash in the early 1960s, before the graph
began, but the population began to recover in the early
1970s. Or ask them to speculate on what might be hap-
pening with the scallops, and discuss it with them after
they have formed their own hypotheses. Depending on
your students’ abilities to analyze the graphs and food
chains, you may opt to have them begin on Part B of the
Procedure to help them interpret the graphs. The brief
readings on the history of each fishery may help them in
drawing their conclusions about the ecosystems.
5 If necessary, review with students that correlation does
not necessarily mean causation. Reinforce this concept by
reminding them that while fishing may be the cause of the
population-level shifts on the graphs, there is no direct
evidence of causation. You might want to give them an
analogy to further illustrate this. For example, if 75% of
students are wearing blue shirts on Friday, someone might
infer that the students are wearing blue shirts because the
school color is blue and there is a big football game after
school. However, the true cause might be that the local
pizza place is giving a special discount that day for everyone
wearing a blue shirt.
131
ECOSYSTEMS OUT OF BALANCE • ACTIVITY 16
6. Summarize the population growth rates for each population for the full time
period shown on the graph. Write your summary in your science notebook.
7. Discuss with your group what the graph shows overall. Note any patterns or
anything that seems out of the ordinary, as compared to the Pacifi c-halibut-
dominated ecosystem you reviewed with your teacher. Write your observa-
tions in your science notebook.
8. Repeat Steps 1–7 for the tiger-shark-dominated ecosystem. This ecosystem is
found in the Atlantic Ocean off the southern coast of the United States.
9. Repeat Steps 1–7 for the orca-dominated ecosystem. This ecosystem is found
off the northwestern Pacifi c coast of North America.
10. Repeat Steps 1–7 for the Caspian-seal-dominated ecosystem. This ecosystem is
found in the Caspian Sea, the world’s largest enclosed body of water, located
between the southern border of Russia and the northern border of Iran.
Part B: Fishery Histories
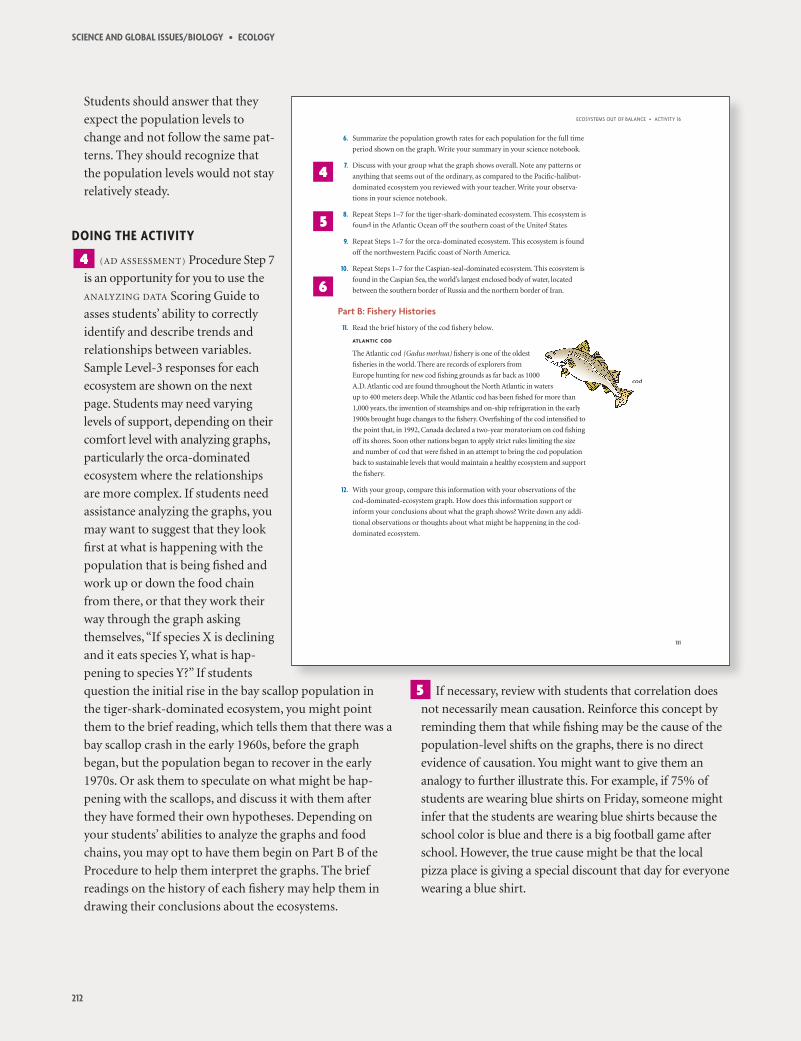
11. Read the brief history of the cod fi shery below.
ATLANTIC COD
The Atlantic cod (Gadus morhua) fi shery is one of the oldest
fi sheries in the world. There are records of explorers from
Europe hunting for new cod fi shing grounds as far back as 1000
A.D. Atlantic cod are found throughout the North Atlantic in watters
up to 400 meters deep. While the Atlantic cod has been fi shed for more than
1,000 years, the invention of steamships and on-ship refrigeration in the early n in the early
1900s brought huge changes to the fi shery. Overfi shing of the cod intensifi ed to
the point that, in 1992, Canada declared a two-year moratorium on cod fi shing
off its shores. Soon other nations began to apply strict rules limiting the size
and number of cod that were fi shed in an attempt to bring the cod population
back to sustainable levels that would maintain a healthy ecosystem and support
the fi shery.
12. With your group, compare this information with your observations of the
cod-dominated-ecosystem graph. How does this information support or
inform your conclusions about what the graph shows? Write down any addi-
tional observations or thoughts about what might be happening in the cod-
dominated ecosystem.
codc
4
5
6
213
eCOsysteMs Out Of balanCe • aCtivity 16
6 Students should eventually reach
the following conclusions:
Sample Level-3 Response Cod-dominated EcosystemAs the cod population decreased,
there were more northern snow
crabs because they were not being
preyed on. As the northern snow
crabs increased, they consumed
more zooplankton, which in turn
meant that fewer phytoplankton
were eaten, and so their popula-
tion increased.
Tiger-shark-dominated EcosystemAs the tiger shark population
decreased, the cownose rays were
increasing. The bay scallops, which
were increasing, started to decrease
as the cownose rays increased and
consumed more of them.
Orca-dominated EcosystemAs the perch population
decreased, the sea urchin popula-
tion increased. This kept the sea
otter and algae populations steady
for a while, but the orcas did not
have as much perch to eat. The
orcas began preying on otters, and
the otter population dropped,
which meant the urchin popula-
tion continued to rise. Eventually
the orcas did not have enough perch or otters, and their
population dropped. The algae population stayed steady
because, while the perch population dropped, the urchin
population rose, which meant that there was the same
amount of pressure on the algae, but from different
predators.
Caspian-seal-dominated EcosystemThe seal population decreased as the kilka population
decreased. In 1999, when these two populations were
already far into decline, an invasive comb jelly was found,
and it increased extremely rapidly. The zooplankton
decreased, and the phytoplankton (not having its natural
predators) rose rapidly. The plankton populations have
leveled off somewhat, but the comb jelly population is
still very high, and the kilka and seal populations are still
declining.
SCIENCE & GLOBAL ISSUES/BIOLOGY • ECOLOGY
132
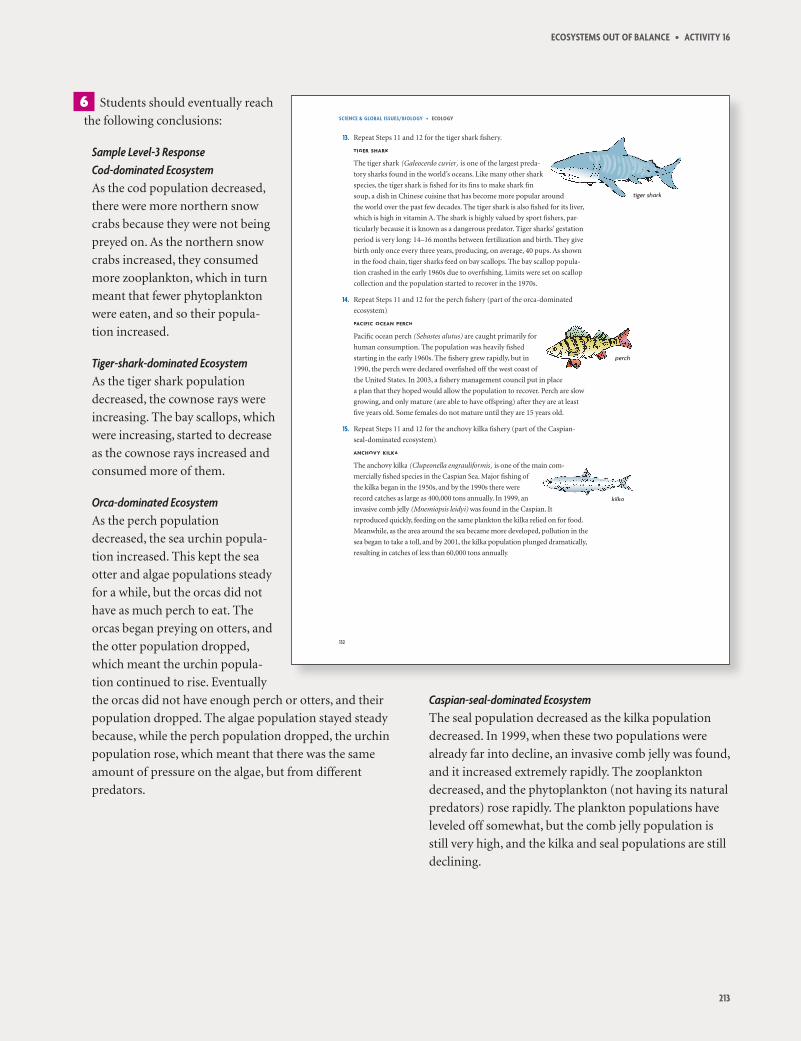
13. Repeat Steps 11 and 12 for the tiger shark fi shery.
TIGER SHARK
The tiger shark (Galeocerdo cuvier) is one of the largest preda-
tory sharks found in the world’s oceans. Like many other shark
species, the tiger shark is fi shed for its fi ns to make shark fi n
soup, a dish in Chinese cuisine that has become more popular around
the world over the past few decades. The tiger shark is also fi shed for its liver,
which is high in vitamin A. The shark is highly valued by sport fi shers, par-
ticularly because it is known as a dangerous predator. Tiger sharks’ gestation
period is very long: 14–16 months between fertilization and birth. They give
birth only once every three years, producing, on average, 40 pups. As shown
in the food chain, tiger sharks feed on bay scallops. The bay scallop popula-
tion crashed in the early 1960s due to overfi shing. Limits were set on scallop
collection and the population started to recover in the 1970s.
14. Repeat Steps 11 and 12 for the perch fi shery (part of the orca-dominated
ecosystem).
PACIFIC OCEAN PERCH
Pacifi c ocean perch (Sebastes alutus) are caught primarily for
human consumption. The population was heavily fi shed
starting in the early 1960s. The fi shery grew rapidly, but in
1990, the perch were declared overfi shed off the west coast of
the United States. In 2003, a fi shery management council put in place
a plan that they hoped would allow the population to recover. Perch are slow
growing, and only mature (are able to have offspring) after they are at least
fi ve years old. Some females do not mature until they are 15 years old.
15. Repeat Steps 11 and 12 for the anchovy kilka fi shery (part of the Caspian-
seal-dominated ecosystem).
ANCHOVY KILKA
The anchovy kilka (Clupeonella engrauliformis) is one of the main com-in com
mercially fi shed species in the Caspian Sea. Major fi shing of
the kilka began in the 1950s, and by the 1990s there were
record catches as large as 400,000 tons annually. In 1999, an
invasive comb jelly (Mnemiopsis leidyi) was found in the Caspian. It
reproduced quickly, feeding on the same plankton the kilka relied on for food.
Meanwhile, as the area around the sea became more developed, pollution in the
sea began to take a toll, and by 2001, the kilka population plunged dramatically,
resulting in catches of less than 60,000 tons annually.
tiger shark
kilkakilk
perch
214
sCienCe and glObal issues/biOlOgy • eCOlOgy
7 Ask the students, What other
causes might there be for these popu-
lation changes besides overfishing?
Students’ answers will vary, but may
include disease, natural disaster, or
another phenomenon that could
harm the population being fished,
which would then cause the cascade
of effects seen in the graphs. You
may want to have them discuss
this in their groups and then as
a whole class.
8 (AD ASSESSMENT) Parts a and b of
Analysis Question 5 are opportuni-
ties for an ANALYZING DATA (AD)
Assessment. Students will analyze
one of the ecosystems they have
investigated and explain their
analyses to the people running the
fishery. Students should use evi-
dence from the graphs to support
their analyses.
fOllOw-uP
9 Discuss with students the differ-
ence in what they saw in the Pacific
halibut fishery and the other fish-
eries. Ask, Why do you think all fish-
eries do not follow the practices that
the Pacific halibut fishery follows?
Accept all answers. Then ask the
students, Would it change your answer if I told you that the
Pacific halibut fishery operates near shore, and only in the
United States and Canada?
Students may speculate that this is a fairly small area and
easier to monitor. They may also suggest that it is easier to
work together when they are not working in the open ocean
with many different countries. Remind students of the
Tragedy of the Commons concept, introduced in Activity 5.
They should think about the idea that the more parties
involved and the bigger the common, the harder it may be to
manage. They should also consider the fact that the more
pressures there are on an ecosystem and a fishery, the more
challenging it may be to fish the species sustainably. Students
will re-examine this concept in the final activity of the unit.
133
ECOSYSTEMS OUT OF BALANCE • ACTIVITY 16
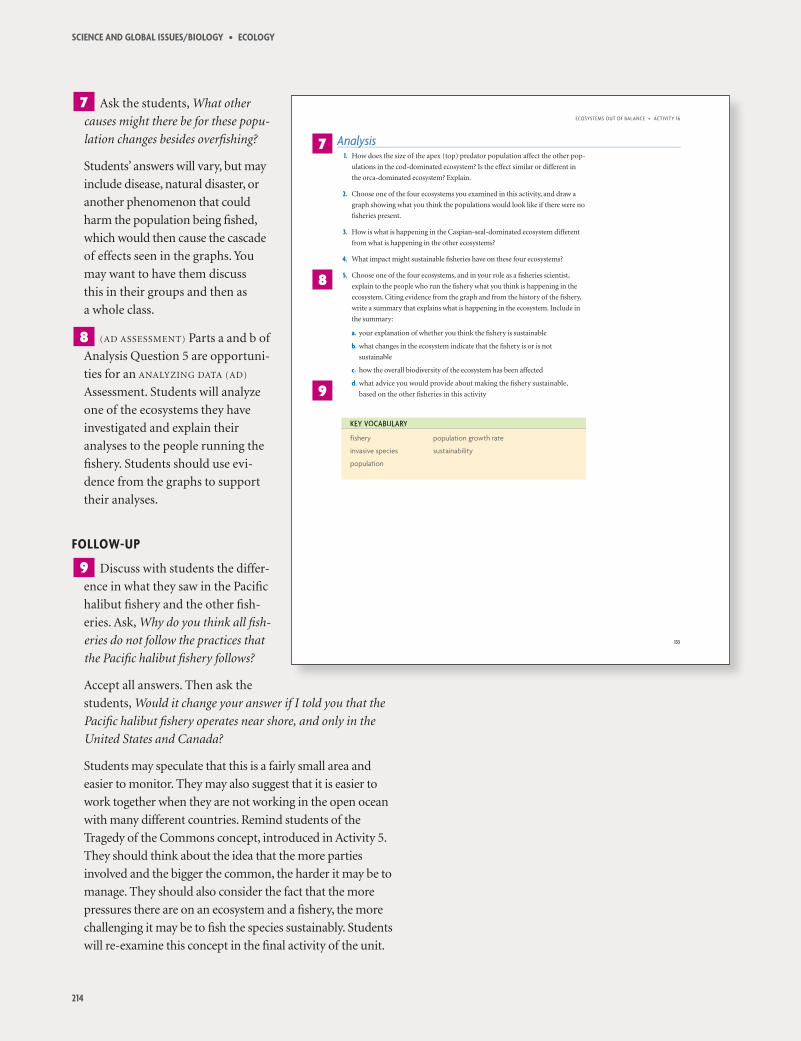
Analysis1. How does the size of the apex (top) predator population affect the other pop-
ulations in the cod-dominated ecosystem? Is the effect similar or different in
the orca-dominated ecosystem? Explain.
2. Choose one of the four ecosystems you examined in this activity, and draw a
graph showing what you think the populations would look like if there were no
fi sheries present.
3. How is what is happening in the Caspian-seal-dominated ecosystem different
from what is happening in the other ecosystems?
4. What impact might sustainable fi sheries have on these four ecosystems?
5. Choose one of the four ecosystems, and in your role as a fi sheries scientist,
explain to the people who run the fi shery what you think is happening in the
ecosystem. Citing evidence from the graph and from the history of the fi shery,
write a summary that explains what is happening in the ecosystem. Include in
the summary:
a. your explanation of whether you think the fi shery is sustainable
b. what changes in the ecosystem indicate that the fi shery is or is not
sustainable
c. how the overall biodiversity of the ecosystem has been affected
d. what advice you would provide about making the fi shery sustainable,
based on the other fi sheries in this activity
KEY VOCABULARY
fishery population growth rate
invasive species sustainability
population
7
8
9
215
eCOsysteMs Out Of balanCe • aCtivity 16
saMPle resPOnses
1. (UC ASSESSMENT) Answers will vary. A correct and complete
answer would state that if the apex predator population
decreases, the population levels of the organisms below it on
the food chain or within the food web will change because
the ecosystem is no longer balanced. Students should point
out that the orca-dominated ecosystem response is more
complicated, but ultimately the effect is the same.
Sample Level-3 ResponseThe cod is the apex predator in the cod-dominated eco-
system. Instead of all the populations remaining fairly
even, when the cod population decreased, the northern
snow crab population increased because it had no preda-
tors. That meant that the zooplankton population
decreased because it was being eaten by more crabs, which
also caused the phytoplankton population to increase
because they were no longer being eaten. By fishing out
the cod, the fishery put the entire ecosystem out of bal-
ance. This is the same in the orca-dominated ecosystem,
because eventually all the species in the ecosystem were
affected when there were fewer perch. It just took longer
because the orcas could eat sea otters or perch, and so they
had another food when the perch first declined.
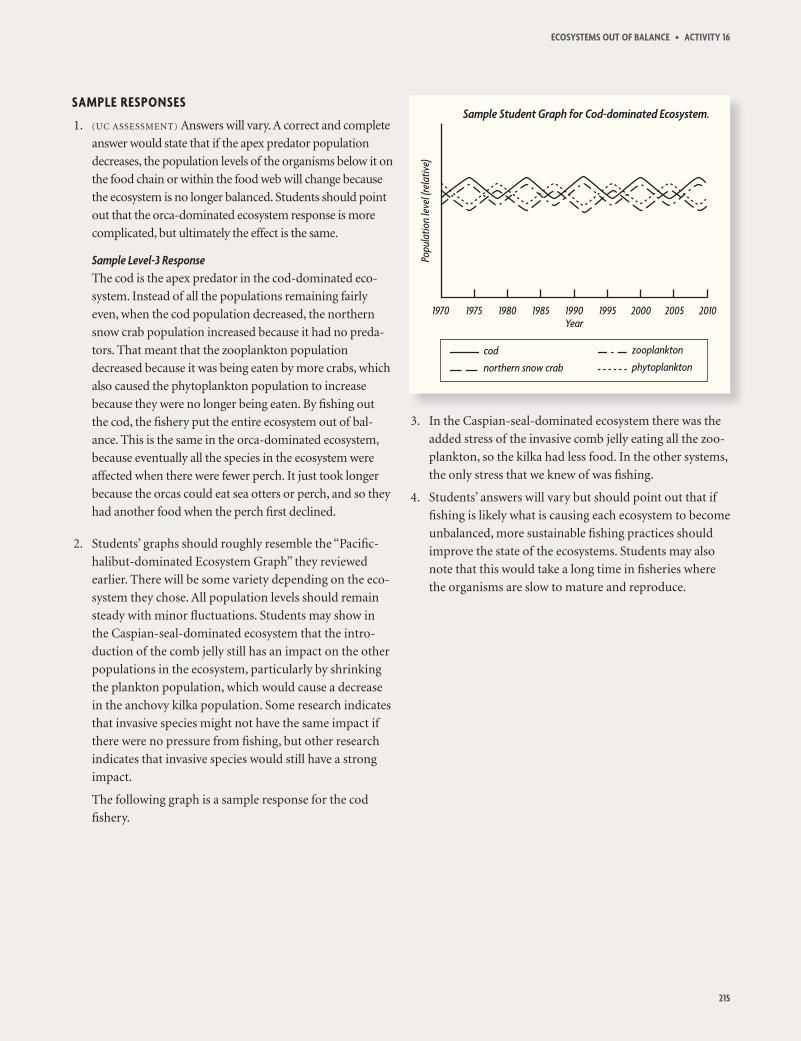
2. Students’ graphs should roughly resemble the “Pacific-
halibut-dominated Ecosystem Graph” they reviewed
earlier. There will be some variety depending on the eco-
system they chose. All population levels should remain
steady with minor fluctuations. Students may show in
the Caspian-seal-dominated ecosystem that the intro-
duction of the comb jelly still has an impact on the other
populations in the ecosystem, particularly by shrinking
the plankton population, which would cause a decrease
in the anchovy kilka population. Some research indicates
that invasive species might not have the same impact if
there were no pressure from fishing, but other research
indicates that invasive species would still have a strong
impact.
The following graph is a sample response for the cod
fishery.
3. In the Caspian-seal-dominated ecosystem there was the
added stress of the invasive comb jelly eating all the zoo-
plankton, so the kilka had less food. In the other systems,
the only stress that we knew of was fishing.
4. Students’ answers will vary but should point out that if
fishing is likely what is causing each ecosystem to become
unbalanced, more sustainable fishing practices should
improve the state of the ecosystems. Students may also
note that this would take a long time in fisheries where
the organisms are slow to mature and reproduce.
Sample Student Graph for Cod-dominated Ecosystem.
216
sCienCe and glObal issues/biOlOgy • eCOlOgy
5. (AD ASSESSMENT) Answers will vary. A correct and complete
answer would include evidence from the graph and the
brief history of the ecosystem being described to explain
why the fishery is unsustainable. Students should discuss
population levels as indicators that the fishery is unsus-
tainable, and may also include information about the
balance in the ecosystem. Students’ advice on how to
make the fishery more sustainable will vary.
Sample Level-3 Response a. I do not think the perch fishery is sustainable because
the population has decreased dramatically.
b. In the orca-dominated ecosystem you can tell the
perch were overfished because the population started
a steep decline. When the perch were overfished, the
otter population declined. You can see from the
graph of the orca-dominated ecosystem that when
the perch population started to decline it most likely
led to other drastic population changes in the
ecosystem.
c. The total number of species has stayed the same,
but the population size of each species has changed.
If the perch were being fished sustainably, the line
would have stayed fairly steady or moved up and
down around the same total amount of fish. The
otters probably declined after the perch because the
orcas needed them as a source of food when the
perch became scarce. Since there were fewer otters
and perch to eat the urchins, the sea urchin popula-
tion got much bigger. The history tells us that the
perch are starting to recover, and they will have
plenty of urchins to eat, but for now several popula-
tions are lower than they were before the fishing
started.
d. I would suggest that the perch fishery remain closed
for several years, because perch take a long time to
mature and reproduce. Once the perch levels go back
up, it is important to keep the fishing limits low, and
to monitor all of the population levels in the ecosys-
tem carefully to make sure the ecosystem recovers
and stays stable.
revisit the Challenge
Have a discussion with the class comparing the Pacific hal-
ibut fishery with the other fisheries they studied during the
activity. Students should be able to explain how changes in
one population will affect another population within the
ecosystem. Ensure that students are able to articulate how
the analysis of the data from each fishery in the activity could
inform fisheries-management decision-making.