Embed Size (px)
Citation preview
Internal Use ▲
ZTE Confidential Proprietary © 2013 ZTE CORPORATION. All rights reserved.
1
GSM RF Planning Guide
Internal Use ▲
ZTE Confidential Proprietary © 2013 ZTE CORPORATION. All rights reserved.
2
Revision History
Version Date Author Reviewed by Revision History
V1.0 2012-10-25
Internal Use ▲
ZTE Confidential Proprietary © 2013 ZTE CORPORATION. All rights reserved.
3
Contents
1 GSM Link Budget ........................................................................................................................ 4
1.1 Input (Cov) ........................................................................ Error! Bookmark not defined.
1.2 Link Budget Process and Result ......................................................................................... 4
2 GSM Simulation by Atoll ............................................................................................................ 4
2.1 Open the Engineering Template (template.ATL) ................................................................ 4
2.2 Import the Map .................................................................................................................... 4
2.3 Set the Projection Mode and Projection Zone ..................................................................... 7
2.4 Set the Propagation Model .................................................................................................. 8
2.5 Import Antenna Files ......................................................................................................... 10
2.6 Import Site and Cell Information ...................................................................................... 13
2.7 Draw Polygons .................................................................................................................. 18
2.8 Set the Standard Deviation and Penetration Loss ............. Error! Bookmark not defined.
2.9 Set the Propagation Model for the Transmitter by Polygon .............................................. 20
2.10 Calculate the Path Loss ................................................................................................... 24
2.11 Network Performance Predictions ................................................................................... 25
2.11.1 RSCP Plot .......................................................................................................... 26
2.11.2 Ec/Io Plot ............................................................ Error! Bookmark not defined.
2.11.3 Best Server Plot ................................................ Error! Bookmark not defined.
2.11.4 Handoff Status Plot .......................................... Error! Bookmark not defined.
2.11.5 Eb/No Plot .......................................................... Error! Bookmark not defined.
2.11.6 Throughput Plot ................................................ Error! Bookmark not defined.
2.12 Output Simulation Plots and Statistical Results .............................................................. 30
2.12.1 Print PDF-Format Simulation Plots ................................................................ 30
2.12.2 Output Statistical Results ................................................................................ 32
Internal Use ▲
ZTE Confidential Proprietary © 2013 ZTE CORPORATION. All rights reserved.
4
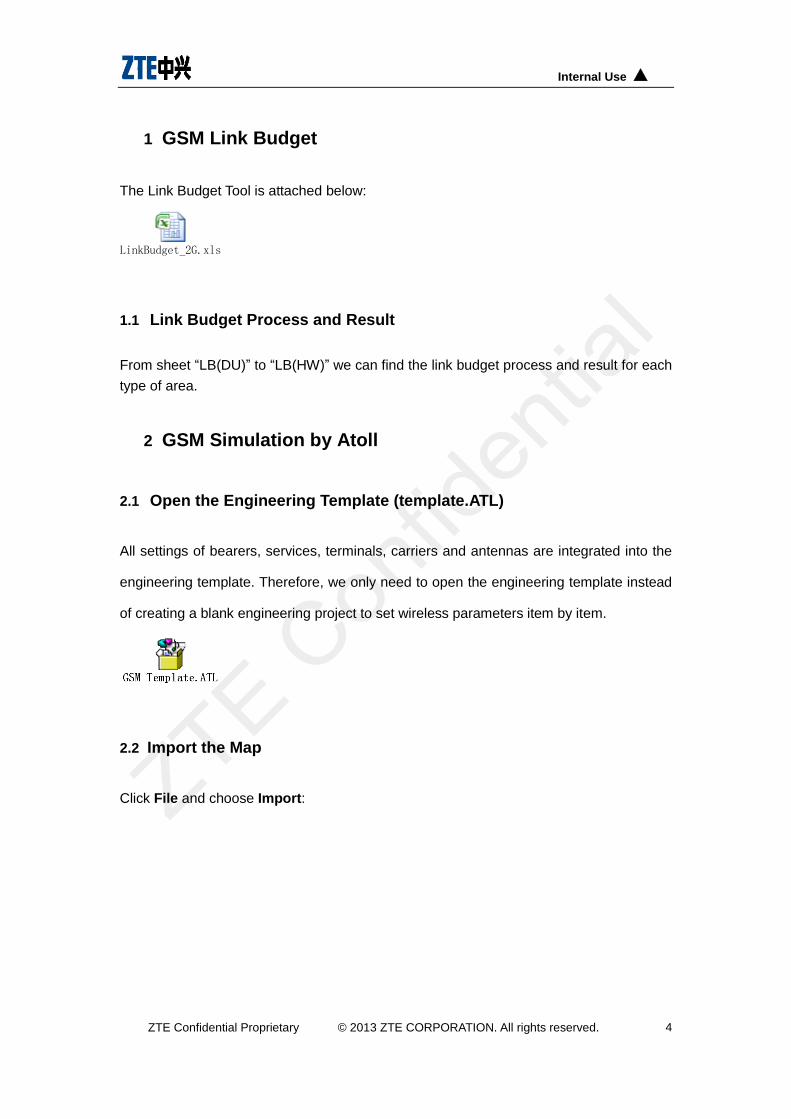
1 GSM Link Budget
The Link Budget Tool is attached below:
LinkBudget_2G.xls
1.1 Link Budget Process and Result
From sheet “LB(DU)” to “LB(HW)” we can find the link budget process and result for each
type of area.
2 GSM Simulation by Atoll
2.1 Open the Engineering Template (template.ATL)
All settings of bearers, services, terminals, carriers and antennas are integrated into the
engineering template. Therefore, we only need to open the engineering template instead
of creating a blank engineering project to set wireless parameters item by item.
2.2 Import the Map
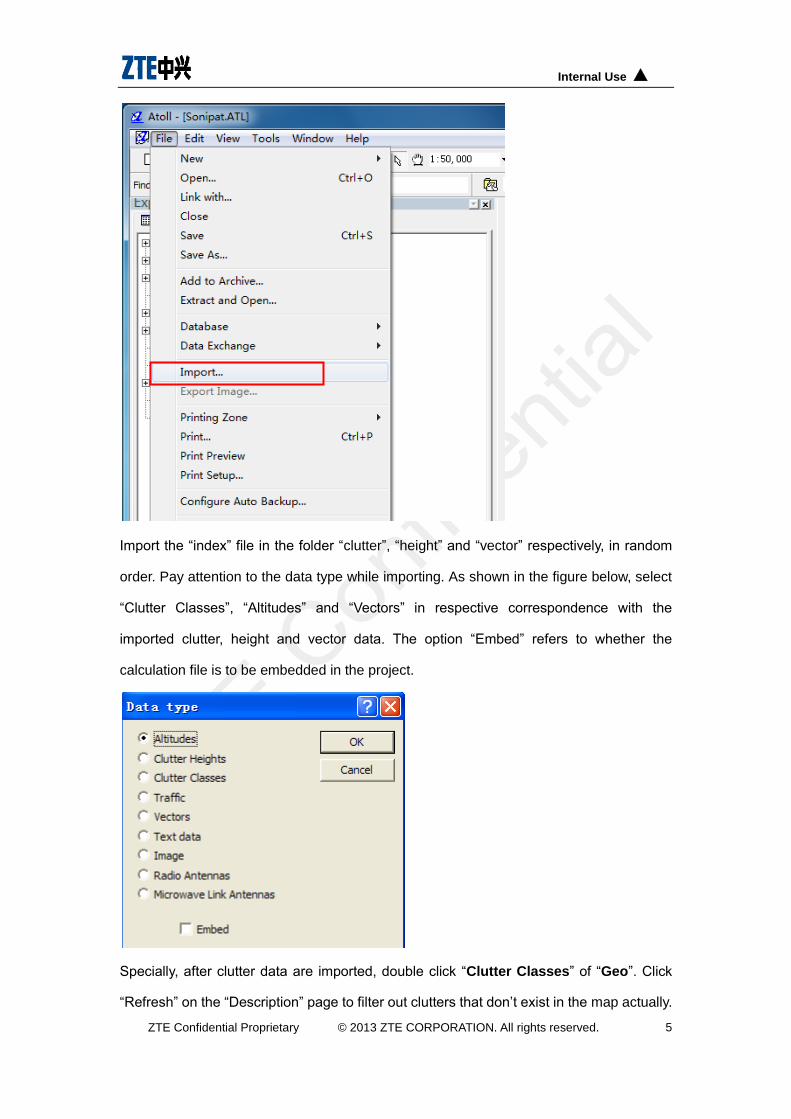
Click File and choose Import:
Internal Use ▲
ZTE Confidential Proprietary © 2013 ZTE CORPORATION. All rights reserved.
5
Import the “index” file in the folder “clutter”, “height” and “vector” respectively, in random
order. Pay attention to the data type while importing. As shown in the figure below, select
“Clutter Classes”, “Altitudes” and “Vectors” in respective correspondence with the
imported clutter, height and vector data. The option “Embed” refers to whether the
calculation file is to be embedded in the project.
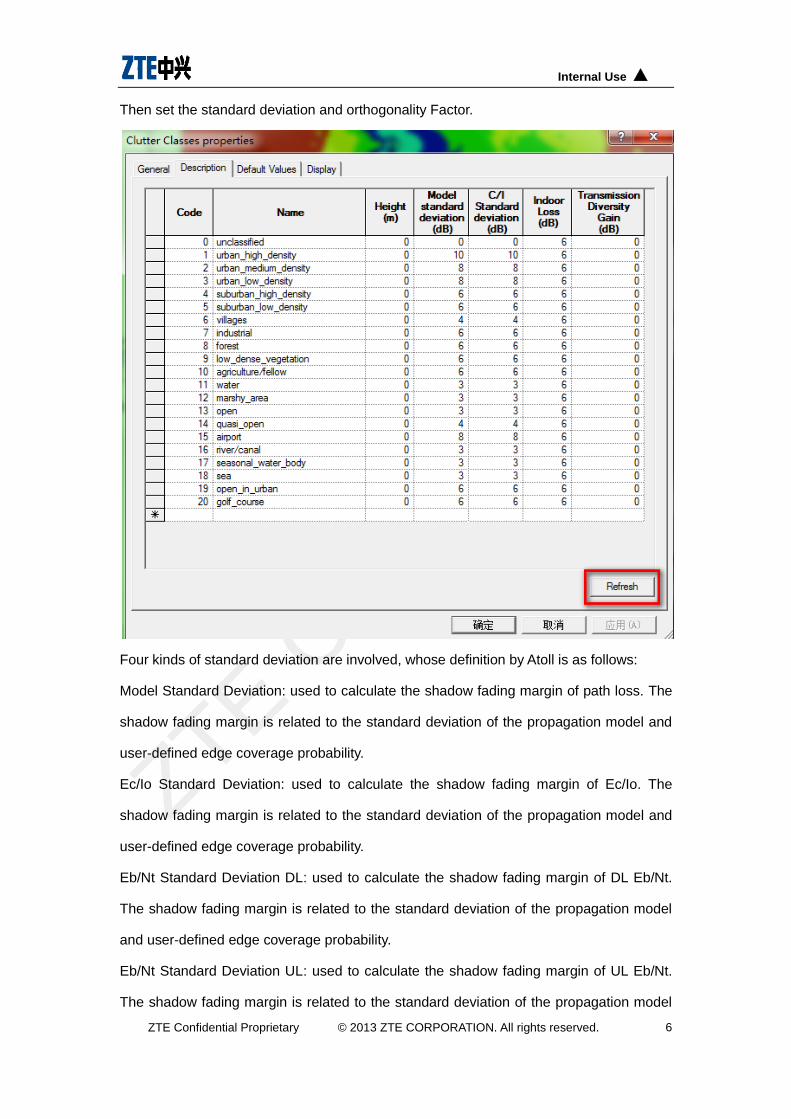
Specially, after clutter data are imported, double click “Clutter Classes” of “Geo”. Click
“Refresh” on the “Description” page to filter out clutters that don’t exist in the map actually.
Internal Use ▲
ZTE Confidential Proprietary © 2013 ZTE CORPORATION. All rights reserved.
6
Then set the standard deviation and orthogonality Factor.
Four kinds of standard deviation are involved, whose definition by Atoll is as follows:
Model Standard Deviation: used to calculate the shadow fading margin of path loss. The
shadow fading margin is related to the standard deviation of the propagation model and
user-defined edge coverage probability.
Ec/Io Standard Deviation: used to calculate the shadow fading margin of Ec/Io. The
shadow fading margin is related to the standard deviation of the propagation model and
user-defined edge coverage probability.
Eb/Nt Standard Deviation DL: used to calculate the shadow fading margin of DL Eb/Nt.
The shadow fading margin is related to the standard deviation of the propagation model
and user-defined edge coverage probability.
Eb/Nt Standard Deviation UL: used to calculate the shadow fading margin of UL Eb/Nt.
The shadow fading margin is related to the standard deviation of the propagation model
Internal Use ▲
ZTE Confidential Proprietary © 2013 ZTE CORPORATION. All rights reserved.
7
and user-defined edge coverage probability.
These four kinds of standard deviation can be set as the set value.
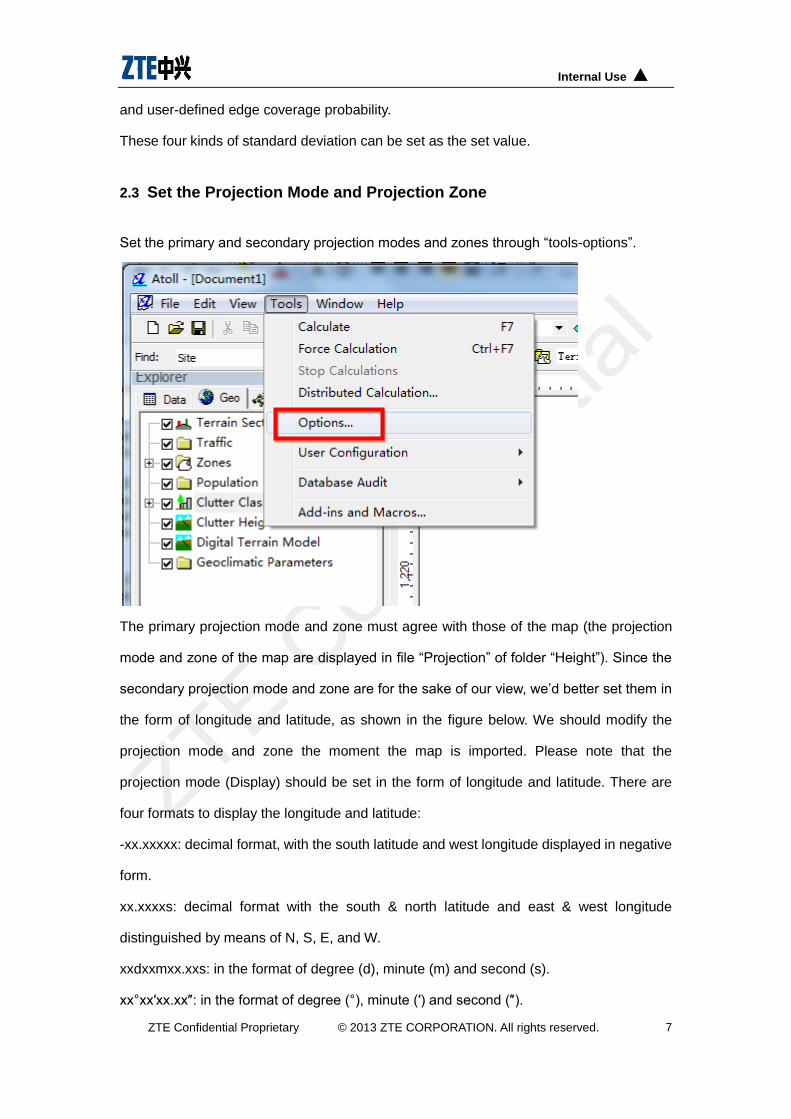
2.3 Set the Projection Mode and Projection Zone
Set the primary and secondary projection modes and zones through “tools-options”.
The primary projection mode and zone must agree with those of the map (the projection
mode and zone of the map are displayed in file “Projection” of folder “Height”). Since the
secondary projection mode and zone are for the sake of our view, we’d better set them in
the form of longitude and latitude, as shown in the figure below. We should modify the
projection mode and zone the moment the map is imported. Please note that the
projection mode (Display) should be set in the form of longitude and latitude. There are
four formats to display the longitude and latitude:
-xx.xxxxx: decimal format, with the south latitude and west longitude displayed in negative
form.
xx.xxxxs: decimal format with the south & north latitude and east & west longitude
distinguished by means of N, S, E, and W.
xxdxxmxx.xxs: in the format of degree (d), minute (m) and second (s).
xx°xx′xx.xx″: in the format of degree (°), minute (′) and second (″).
Internal Use ▲
ZTE Confidential Proprietary © 2013 ZTE CORPORATION. All rights reserved.
8
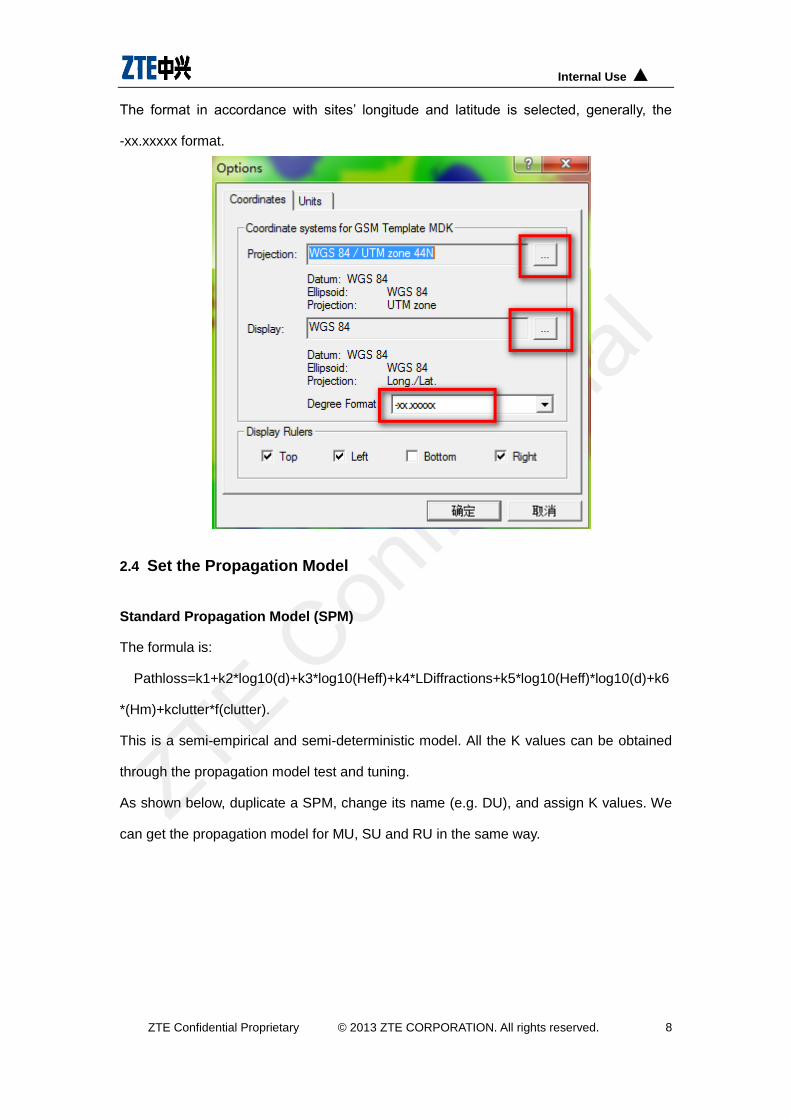
The format in accordance with sites’ longitude and latitude is selected, generally, the
-xx.xxxxx format.
2.4 Set the Propagation Model
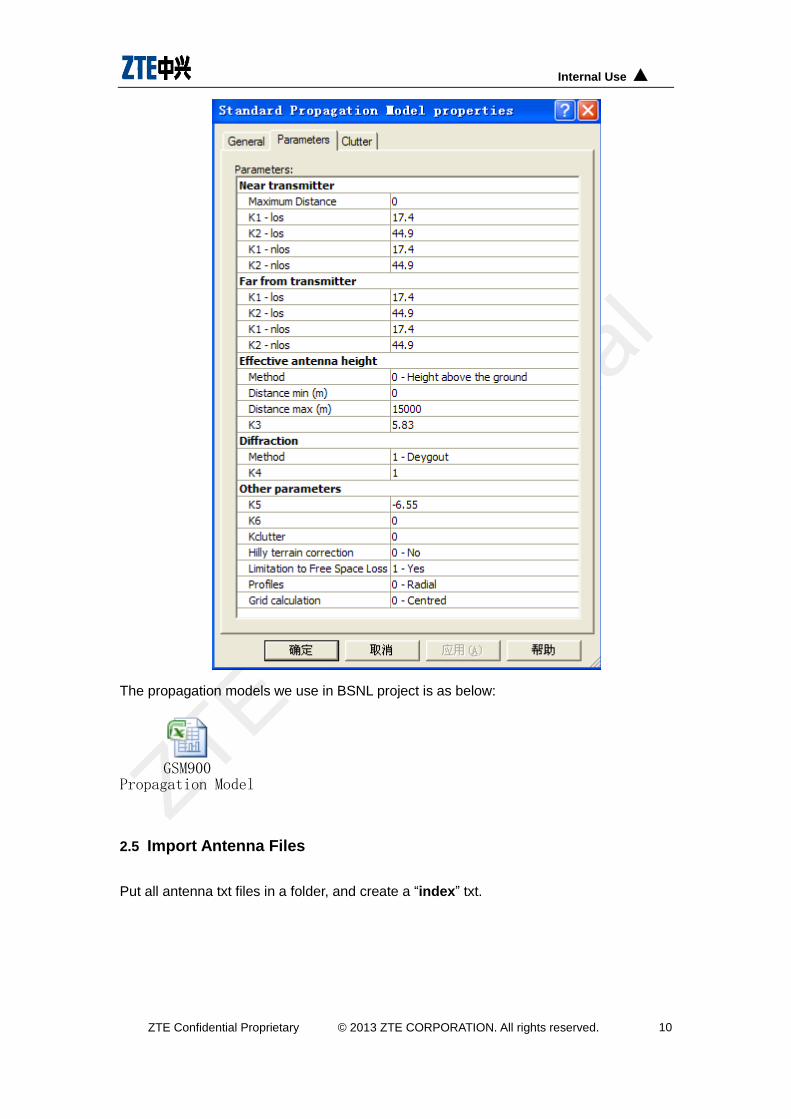
Standard Propagation Model (SPM)
The formula is:
Pathloss=k1+k2*log10(d)+k3*log10(Heff)+k4*LDiffractions+k5*log10(Heff)*log10(d)+k6
*(Hm)+kclutter*f(clutter).
This is a semi-empirical and semi-deterministic model. All the K values can be obtained
through the propagation model test and tuning.
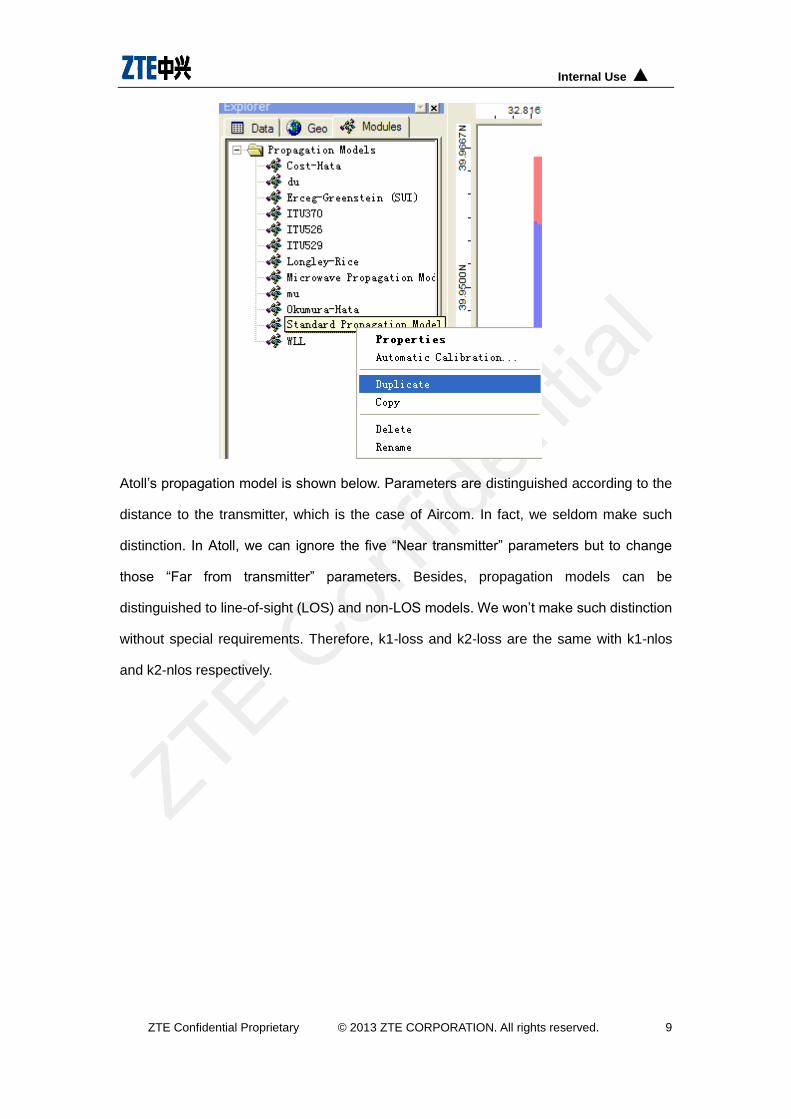
As shown below, duplicate a SPM, change its name (e.g. DU), and assign K values. We
can get the propagation model for MU, SU and RU in the same way.
Internal Use ▲
ZTE Confidential Proprietary © 2013 ZTE CORPORATION. All rights reserved.
9
Atoll’s propagation model is shown below. Parameters are distinguished according to the
distance to the transmitter, which is the case of Aircom. In fact, we seldom make such
distinction. In Atoll, we can ignore the five “Near transmitter” parameters but to change
those “Far from transmitter” parameters. Besides, propagation models can be
distinguished to line-of-sight (LOS) and non-LOS models. We won’t make such distinction
without special requirements. Therefore, k1-loss and k2-loss are the same with k1-nlos
and k2-nlos respectively.
Internal Use ▲
ZTE Confidential Proprietary © 2013 ZTE CORPORATION. All rights reserved.
10
The propagation models we use in BSNL project is as below:
GSM900 Propagation Models.xlsx
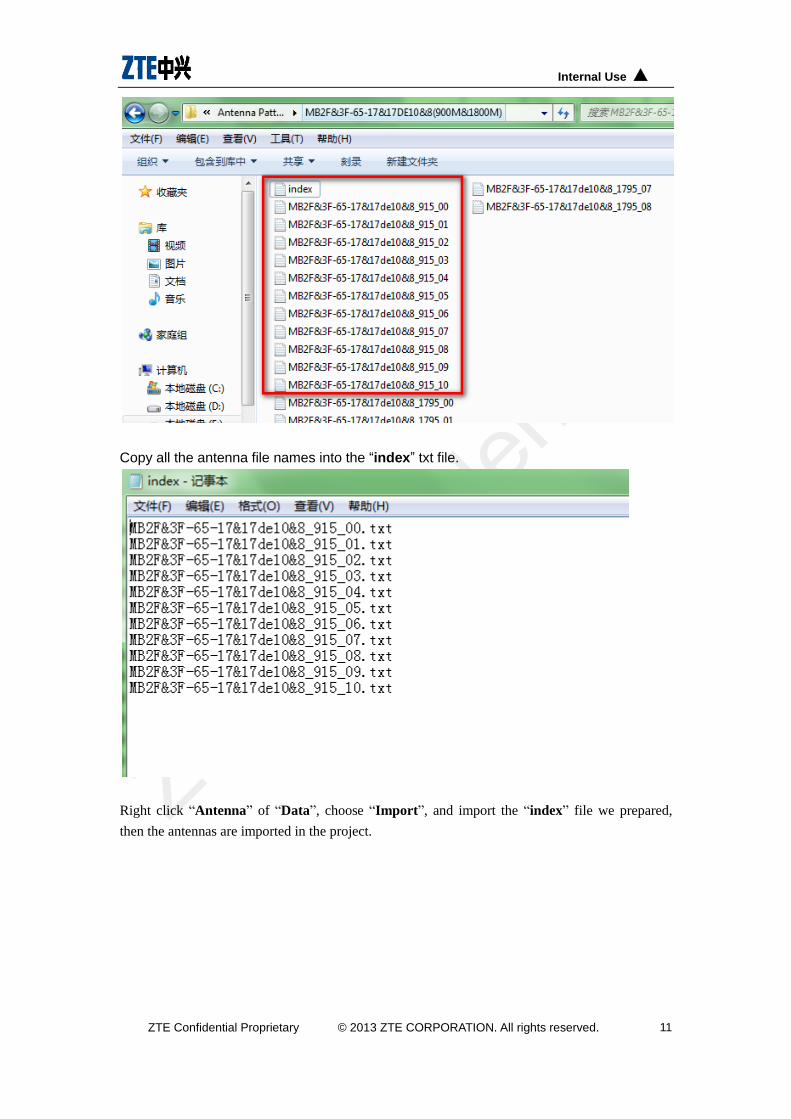
2.5 Import Antenna Files
Put all antenna txt files in a folder, and create a “index” txt.
Internal Use ▲
ZTE Confidential Proprietary © 2013 ZTE CORPORATION. All rights reserved.
11
Copy all the antenna file names into the “index” txt file.
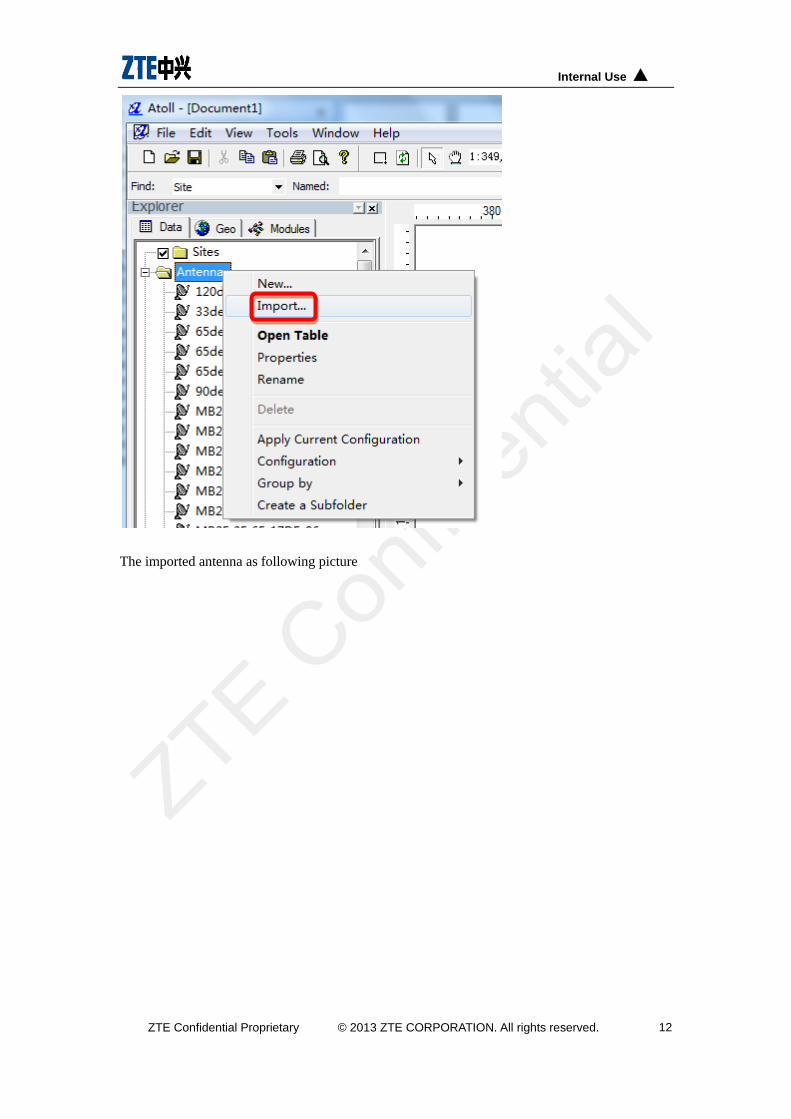
Right click “Antenna” of “Data”, choose “Import”, and import the “index” file we prepared,
then the antennas are imported in the project.
Internal Use ▲
ZTE Confidential Proprietary © 2013 ZTE CORPORATION. All rights reserved.
12
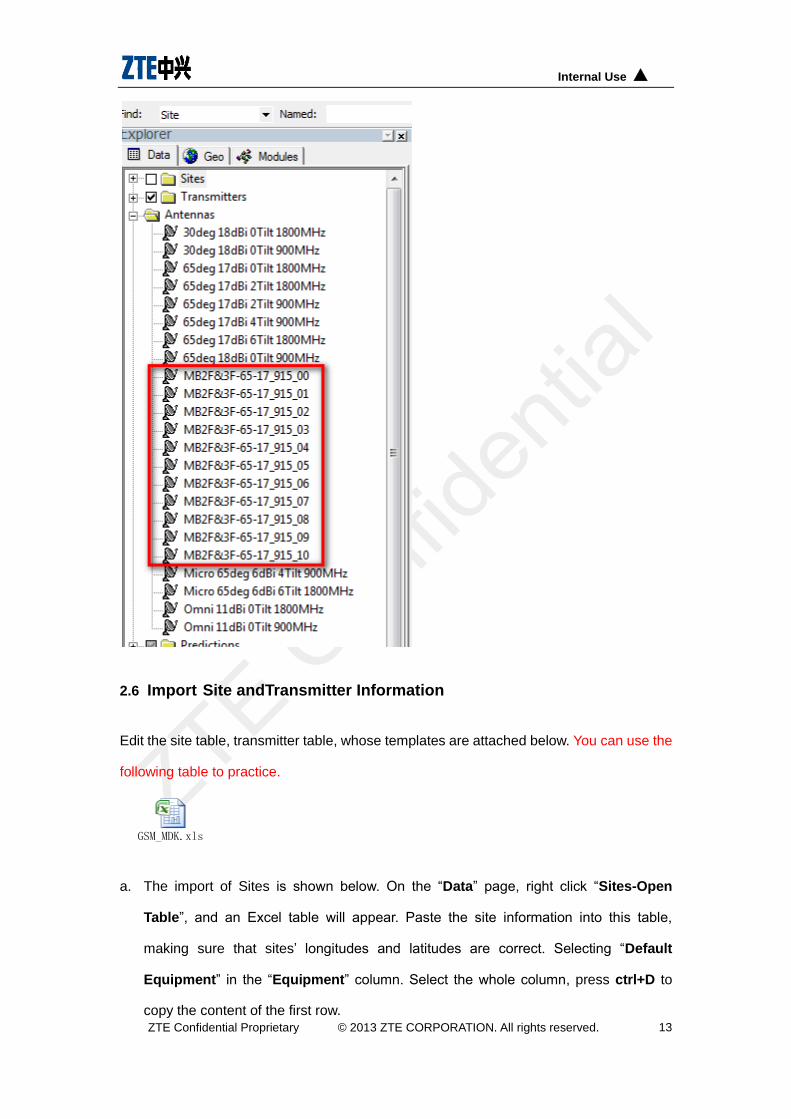
The imported antenna as following picture
Internal Use ▲
ZTE Confidential Proprietary © 2013 ZTE CORPORATION. All rights reserved.
13
2.6 Import Site andTransmitter Information
Edit the site table, transmitter table, whose templates are attached below. You can use the
following table to practice.
GSM_MDK.xls
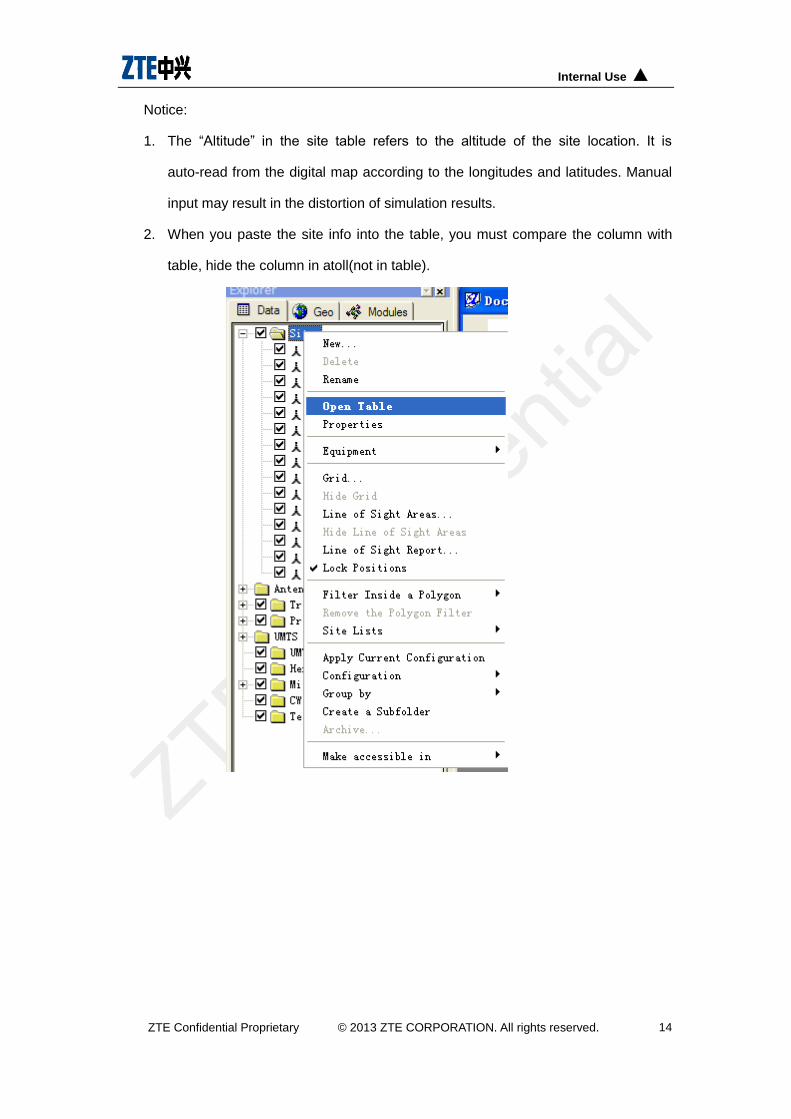
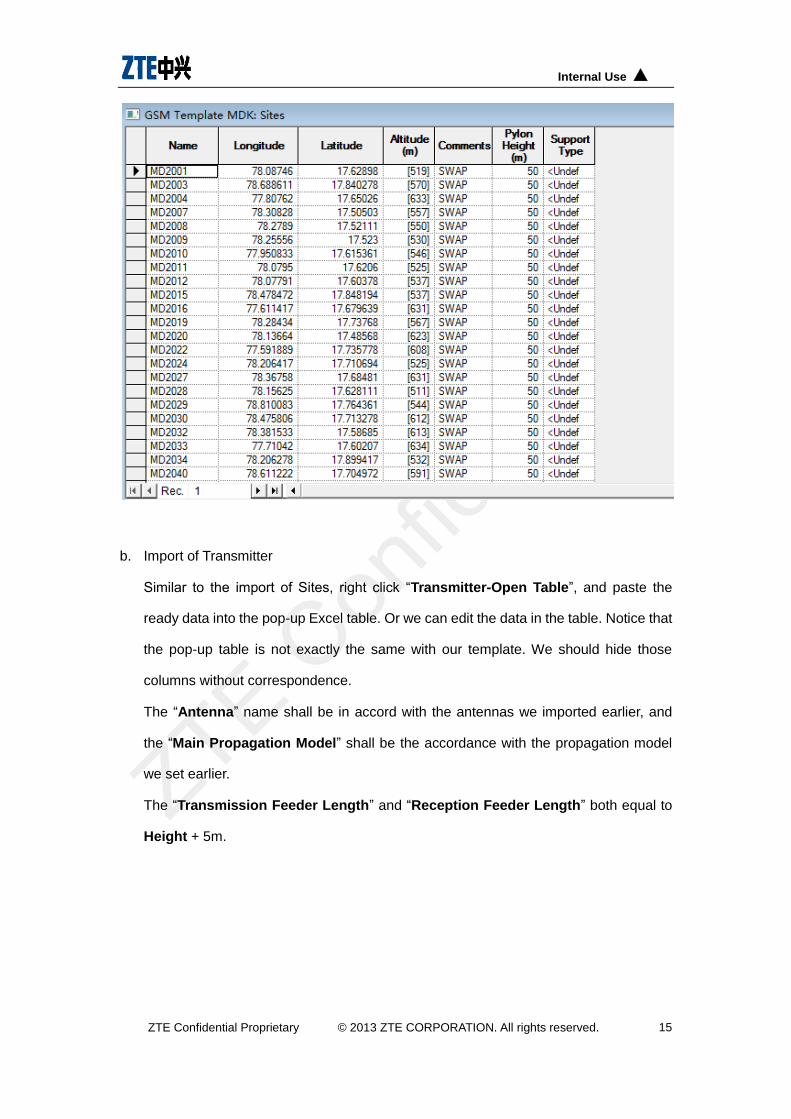
a. The import of Sites is shown below. On the “Data” page, right click “Sites-Open
Table”, and an Excel table will appear. Paste the site information into this table,
making sure that sites’ longitudes and latitudes are correct. Selecting “Default
Equipment” in the “Equipment” column. Select the whole column, press ctrl+D to
copy the content of the first row.
Internal Use ▲
ZTE Confidential Proprietary © 2013 ZTE CORPORATION. All rights reserved.
14
Notice:
1. The “Altitude” in the site table refers to the altitude of the site location. It is
auto-read from the digital map according to the longitudes and latitudes. Manual
input may result in the distortion of simulation results.
2. When you paste the site info into the table, you must compare the column with
table, hide the column in atoll(not in table).
Internal Use ▲
ZTE Confidential Proprietary © 2013 ZTE CORPORATION. All rights reserved.
15
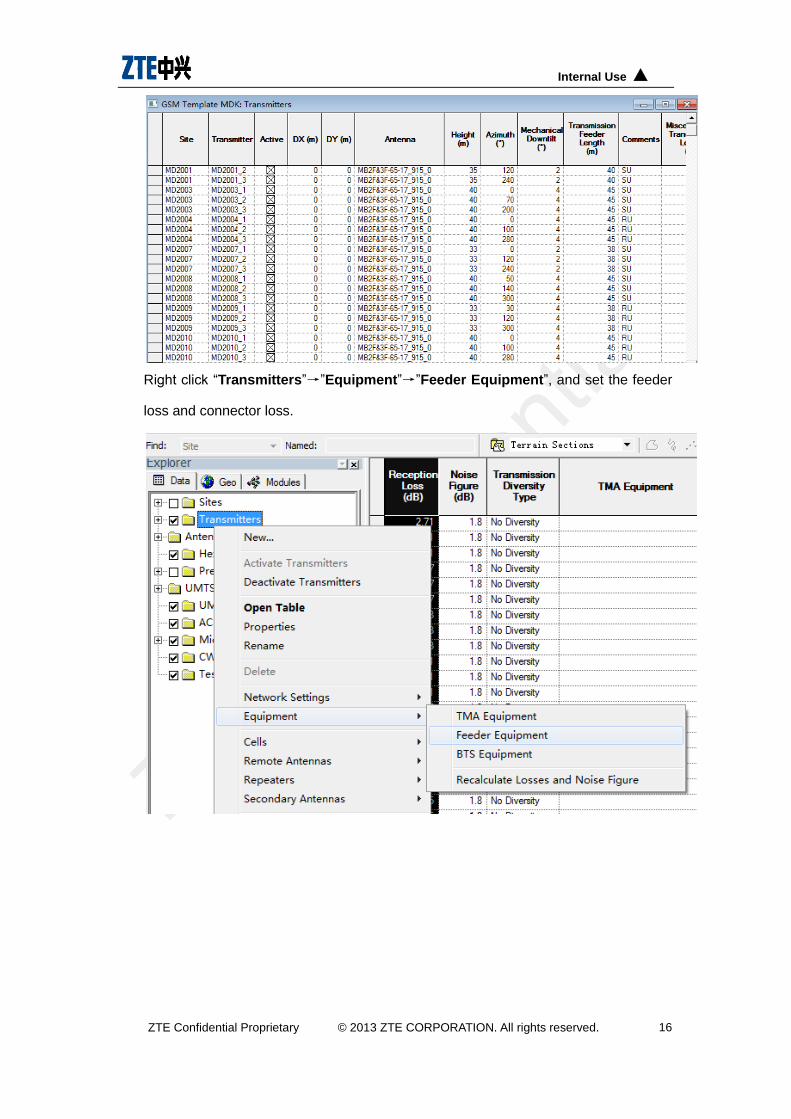
b. Import of Transmitter
Similar to the import of Sites, right click “Transmitter-Open Table”, and paste the
ready data into the pop-up Excel table. Or we can edit the data in the table. Notice that
the pop-up table is not exactly the same with our template. We should hide those
columns without correspondence.
The “Antenna” name shall be in accord with the antennas we imported earlier, and
the “Main Propagation Model” shall be the accordance with the propagation model
we set earlier.
The “Transmission Feeder Length” and “Reception Feeder Length” both equal to
Height + 5m.
Internal Use ▲
ZTE Confidential Proprietary © 2013 ZTE CORPORATION. All rights reserved.
16
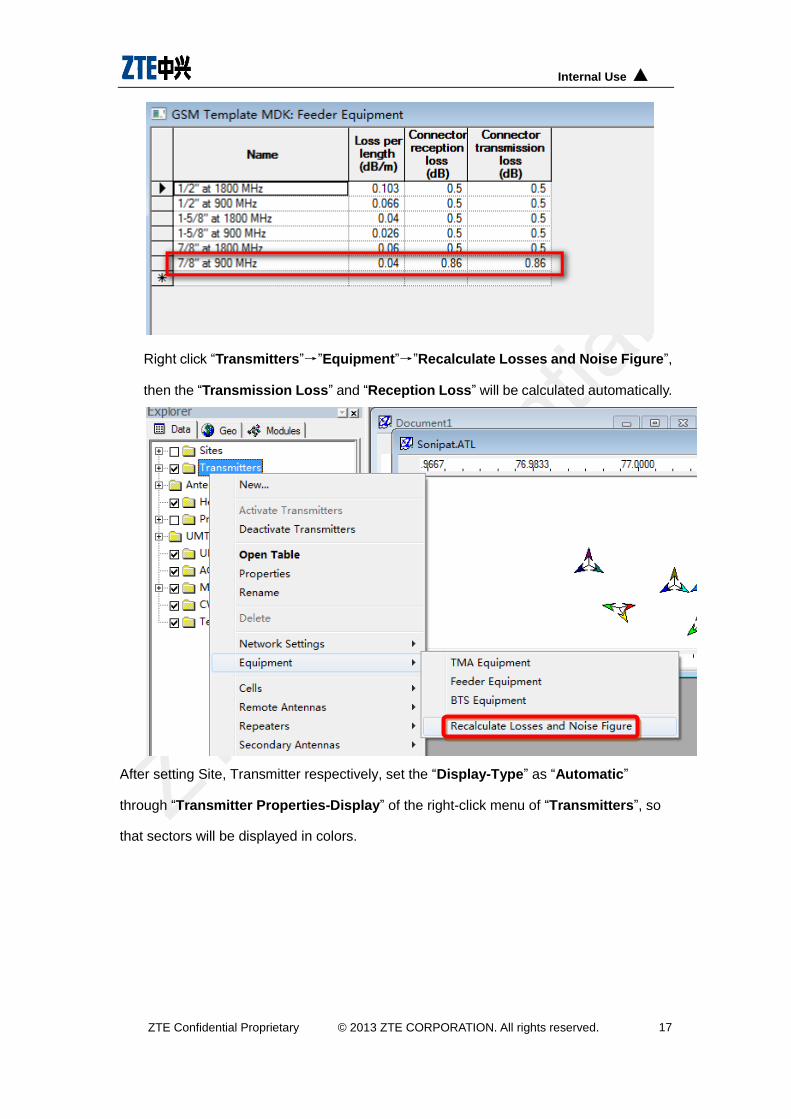
Right click “Transmitters”→”Equipment”→”Feeder Equipment”, and set the feeder
loss and connector loss.
Internal Use ▲
ZTE Confidential Proprietary © 2013 ZTE CORPORATION. All rights reserved.
17
Right click “Transmitters”→”Equipment”→”Recalculate Losses and Noise Figure”,
then the “Transmission Loss” and “Reception Loss” will be calculated automatically.
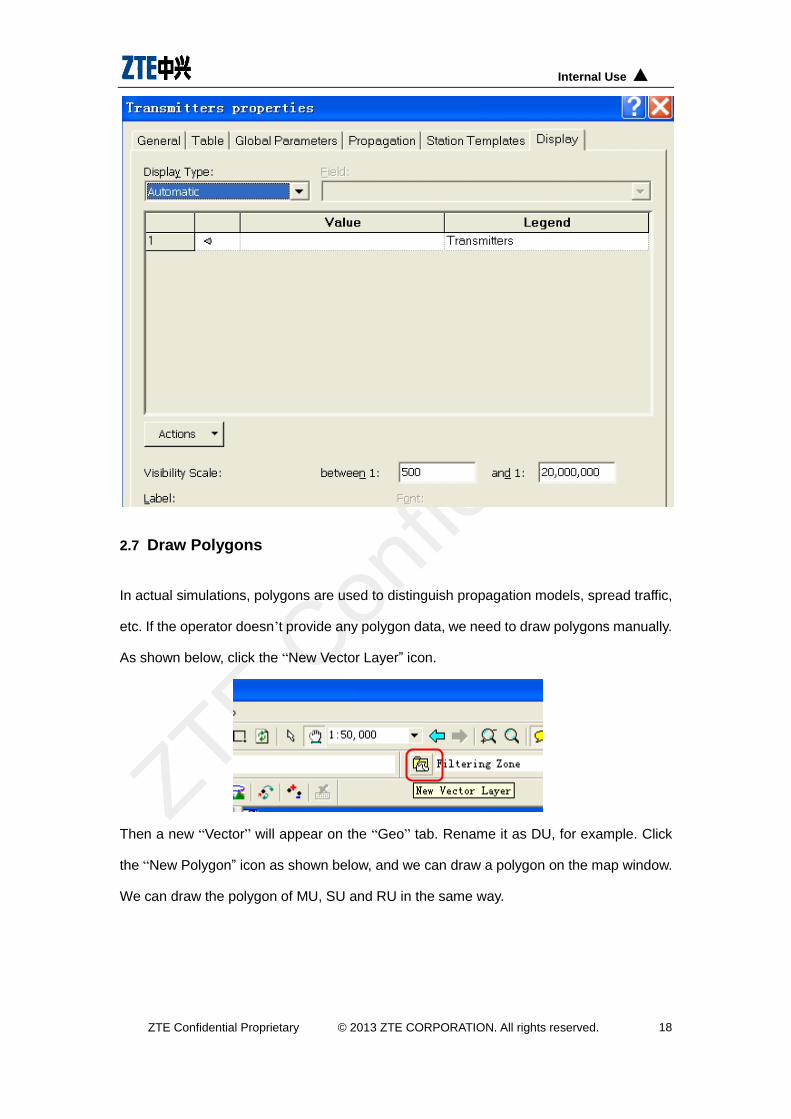
After setting Site, Transmitter respectively, set the “Display-Type” as “Automatic”
through “Transmitter Properties-Display” of the right-click menu of “Transmitters”, so
that sectors will be displayed in colors.
Internal Use ▲
ZTE Confidential Proprietary © 2013 ZTE CORPORATION. All rights reserved.
18
2.7 Draw Polygons
In actual simulations, polygons are used to distinguish propagation models, spread traffic,
etc. If the operator doesn’t provide any polygon data, we need to draw polygons manually.
As shown below, click the “New Vector Layer” icon.
Then a new “Vector” will appear on the “Geo” tab. Rename it as DU, for example. Click
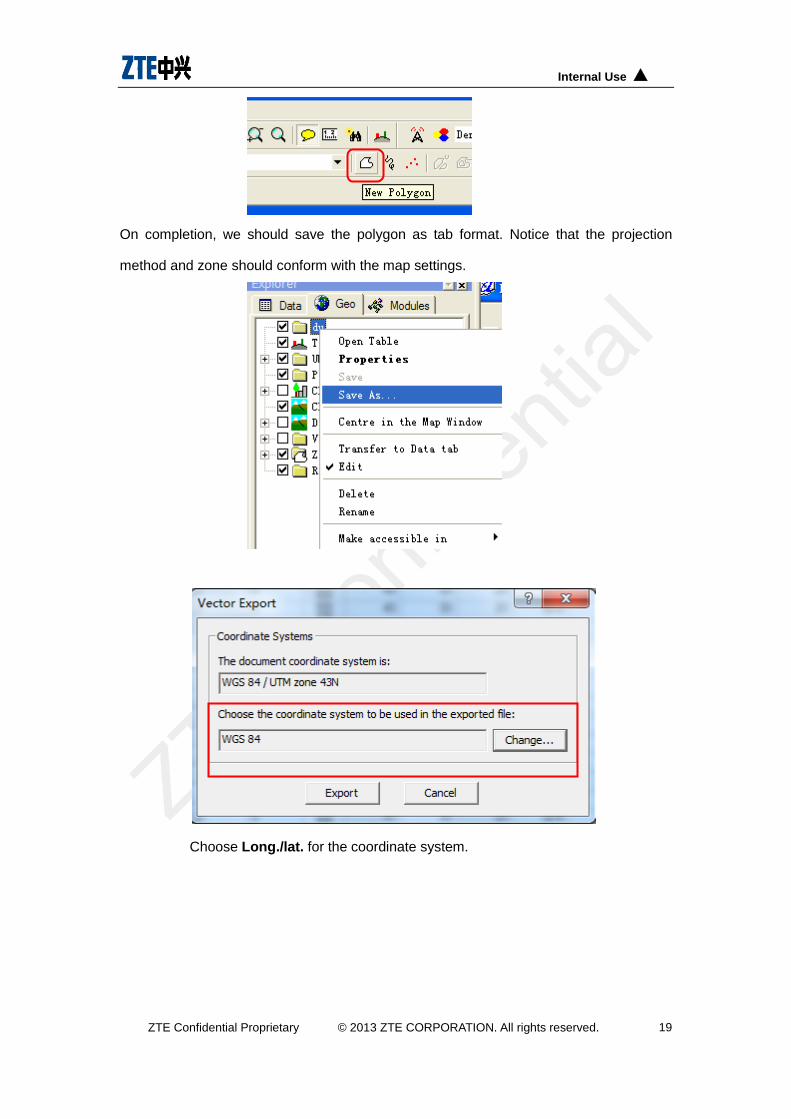
the “New Polygon” icon as shown below, and we can draw a polygon on the map window.
We can draw the polygon of MU, SU and RU in the same way.
Internal Use ▲
ZTE Confidential Proprietary © 2013 ZTE CORPORATION. All rights reserved.
19
On completion, we should save the polygon as tab format. Notice that the projection
method and zone should conform with the map settings.
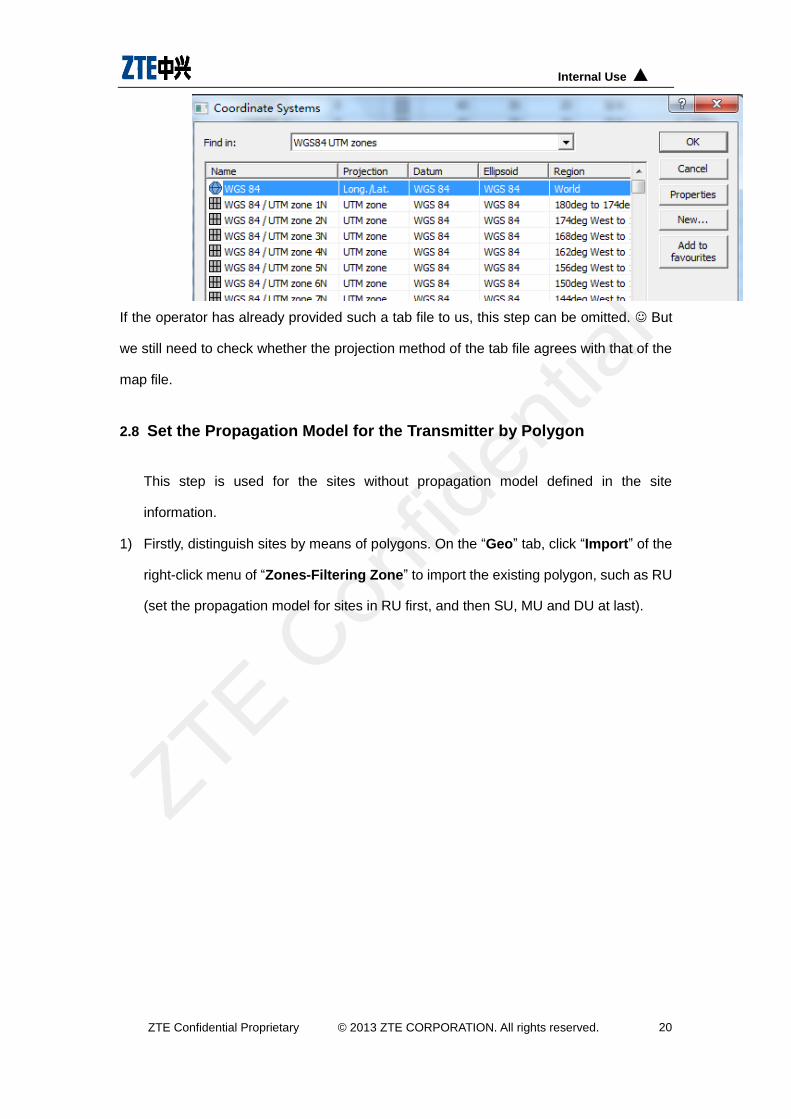
Choose Long./lat. for the coordinate system.
Internal Use ▲
ZTE Confidential Proprietary © 2013 ZTE CORPORATION. All rights reserved.
20
If the operator has already provided such a tab file to us, this step can be omitted. But
we still need to check whether the projection method of the tab file agrees with that of the
map file.
2.8 Set the Propagation Model for the Transmitter by Polygon
This step is used for the sites without propagation model defined in the site
information.
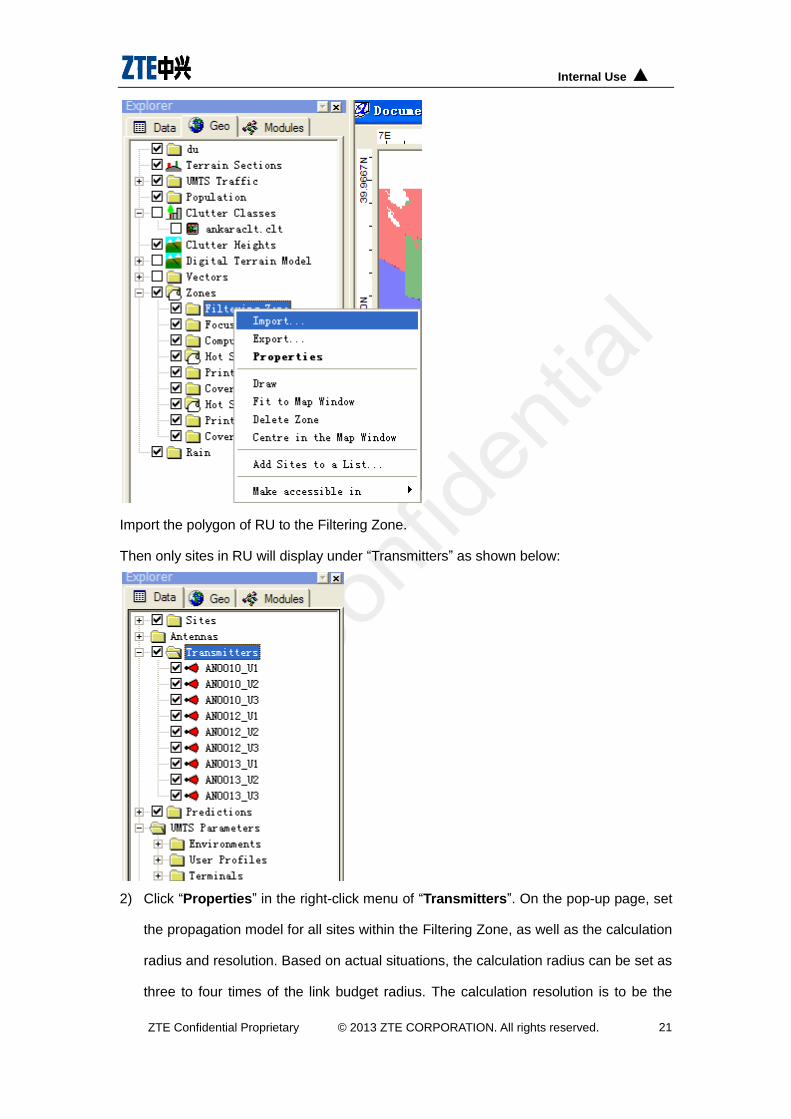
1) Firstly, distinguish sites by means of polygons. On the “Geo” tab, click “Import” of the
right-click menu of “Zones-Filtering Zone” to import the existing polygon, such as RU
(set the propagation model for sites in RU first, and then SU, MU and DU at last).
Internal Use ▲
ZTE Confidential Proprietary © 2013 ZTE CORPORATION. All rights reserved.
21
Import the polygon of RU to the Filtering Zone.
Then only sites in RU will display under “Transmitters” as shown below:
2) Click “Properties” in the right-click menu of “Transmitters”. On the pop-up page, set
the propagation model for all sites within the Filtering Zone, as well as the calculation
radius and resolution. Based on actual situations, the calculation radius can be set as
three to four times of the link budget radius. The calculation resolution is to be the
Internal Use ▲
ZTE Confidential Proprietary © 2013 ZTE CORPORATION. All rights reserved.
22
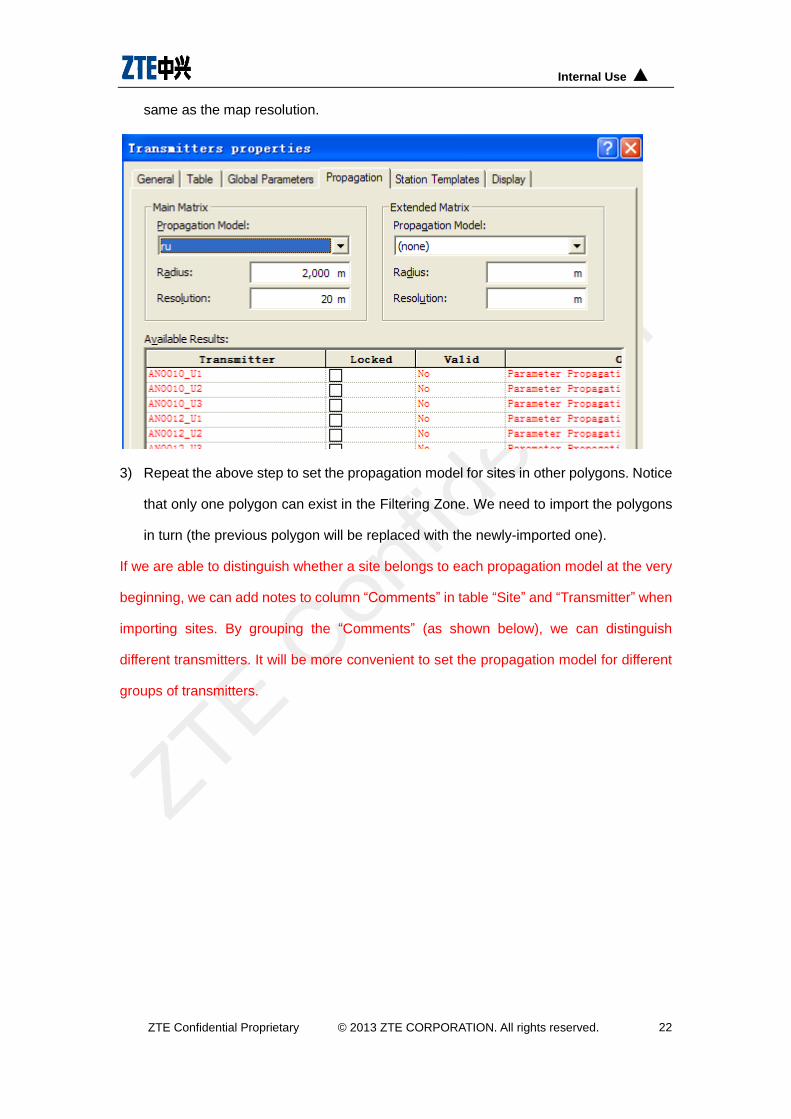
same as the map resolution.
3) Repeat the above step to set the propagation model for sites in other polygons. Notice
that only one polygon can exist in the Filtering Zone. We need to import the polygons
in turn (the previous polygon will be replaced with the newly-imported one).
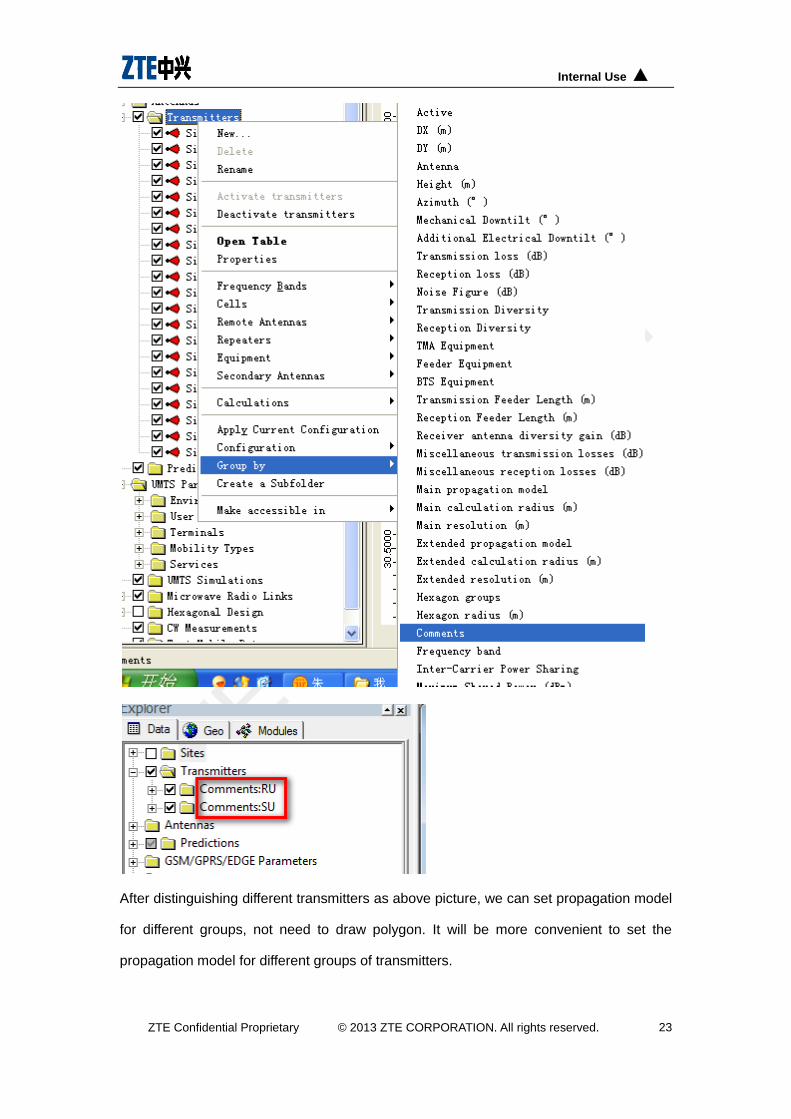
If we are able to distinguish whether a site belongs to each propagation model at the very
beginning, we can add notes to column “Comments” in table “Site” and “Transmitter” when
importing sites. By grouping the “Comments” (as shown below), we can distinguish
different transmitters. It will be more convenient to set the propagation model for different
groups of transmitters.
Internal Use ▲
ZTE Confidential Proprietary © 2013 ZTE CORPORATION. All rights reserved.
23
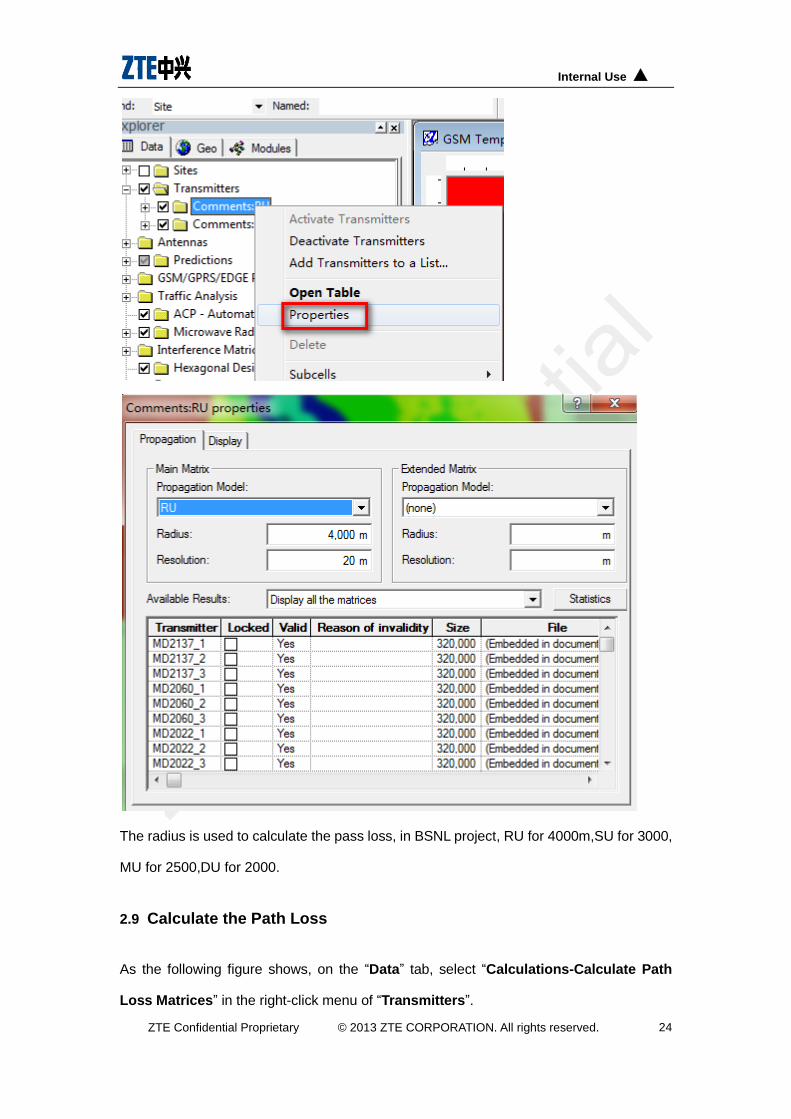
After distinguishing different transmitters as above picture, we can set propagation model
for different groups, not need to draw polygon. It will be more convenient to set the
propagation model for different groups of transmitters.
Internal Use ▲
ZTE Confidential Proprietary © 2013 ZTE CORPORATION. All rights reserved.
24
The radius is used to calculate the pass loss, in BSNL project, RU for 4000m,SU for 3000,
MU for 2500,DU for 2000.
2.9 Calculate the Path Loss
As the following figure shows, on the “Data” tab, select “Calculations-Calculate Path
Loss Matrices” in the right-click menu of “Transmitters”.
Internal Use ▲
ZTE Confidential Proprietary © 2013 ZTE CORPORATION. All rights reserved.
25
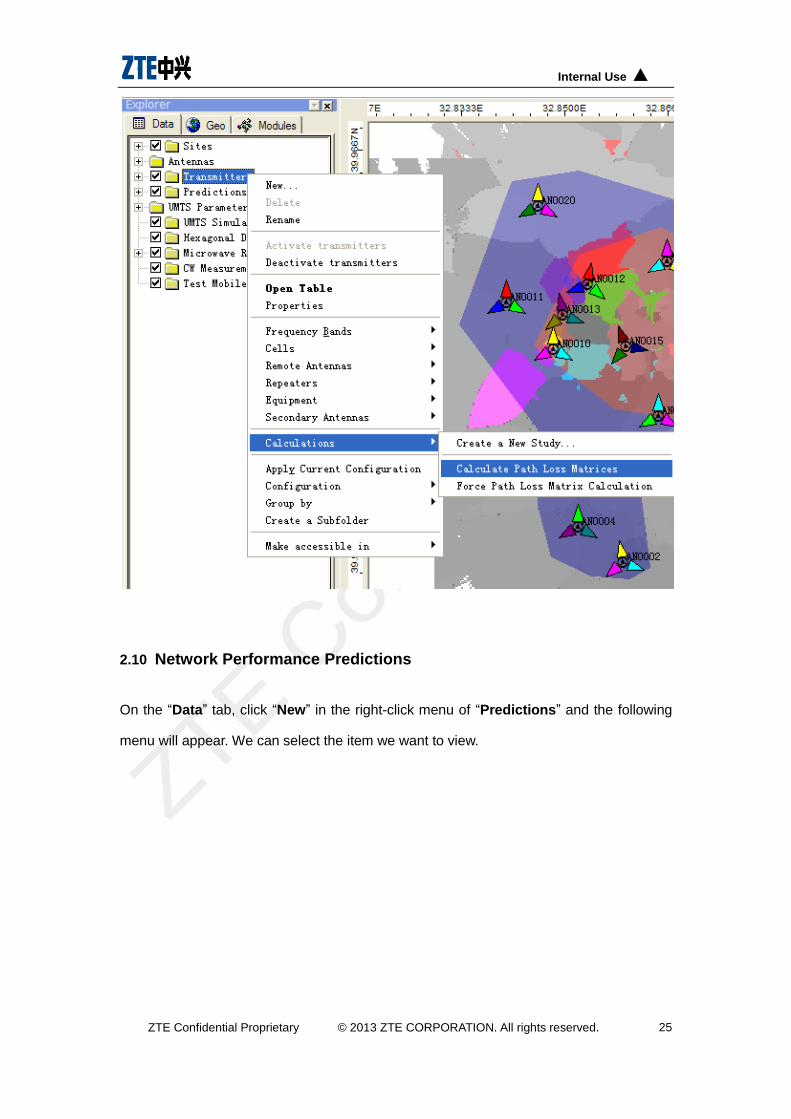
2.10 Network Performance Predictions
On the “Data” tab, click “New” in the right-click menu of “Predictions” and the following
menu will appear. We can select the item we want to view.
Internal Use ▲
ZTE Confidential Proprietary © 2013 ZTE CORPORATION. All rights reserved.
26
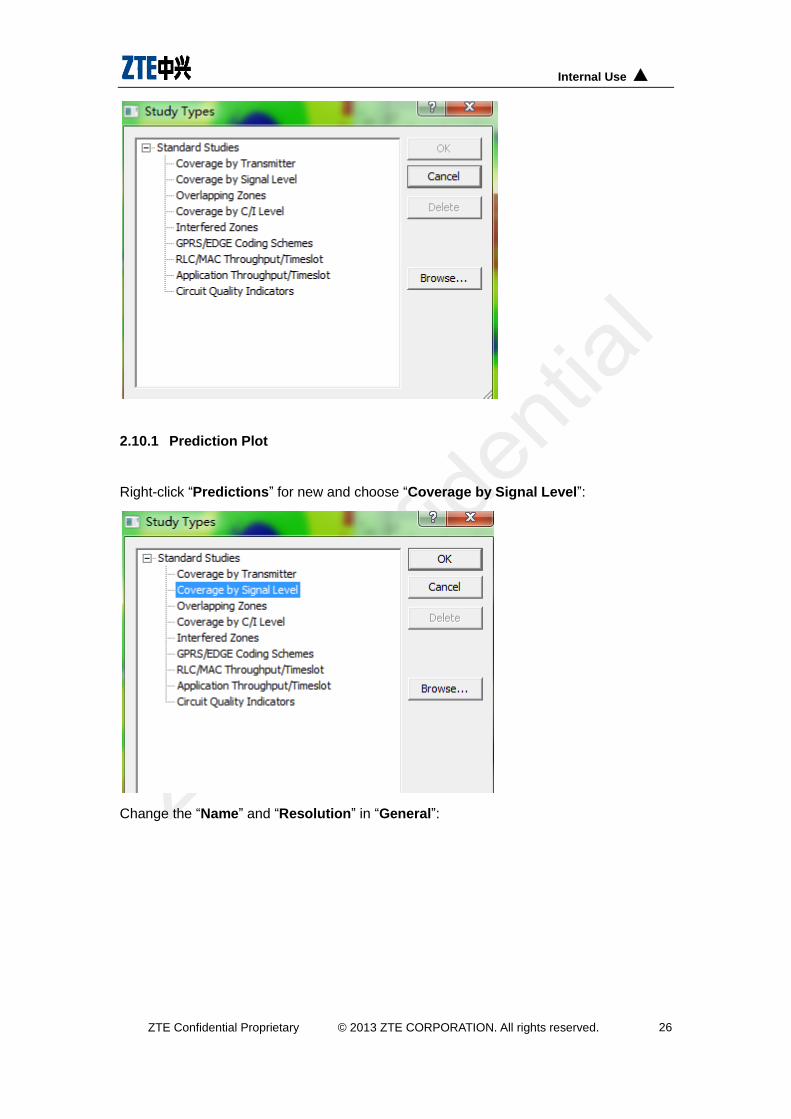
2.10.1 Prediction Plot
Right-click “Predictions” for new and choose “Coverage by Signal Level”:
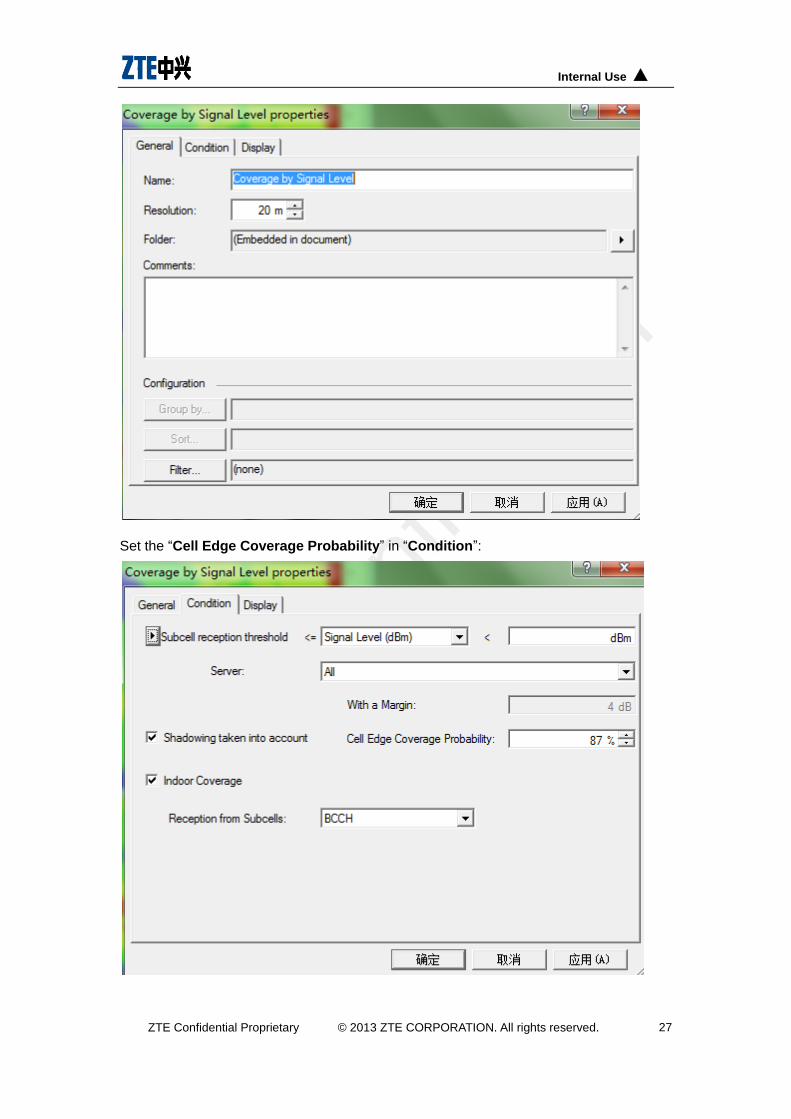
Change the “Name” and “Resolution” in “General”:
Internal Use ▲
ZTE Confidential Proprietary © 2013 ZTE CORPORATION. All rights reserved.
27
Set the “Cell Edge Coverage Probability” in “Condition”:
Internal Use ▲
ZTE Confidential Proprietary © 2013 ZTE CORPORATION. All rights reserved.
28
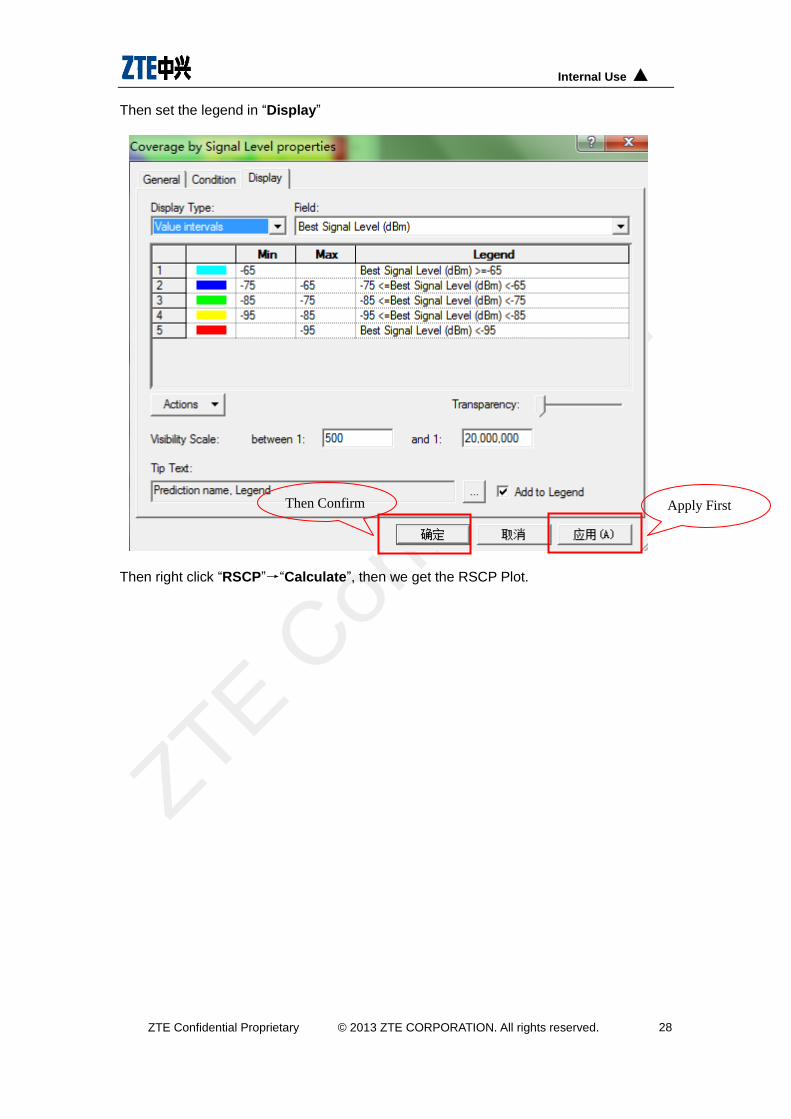
Then set the legend in “Display”
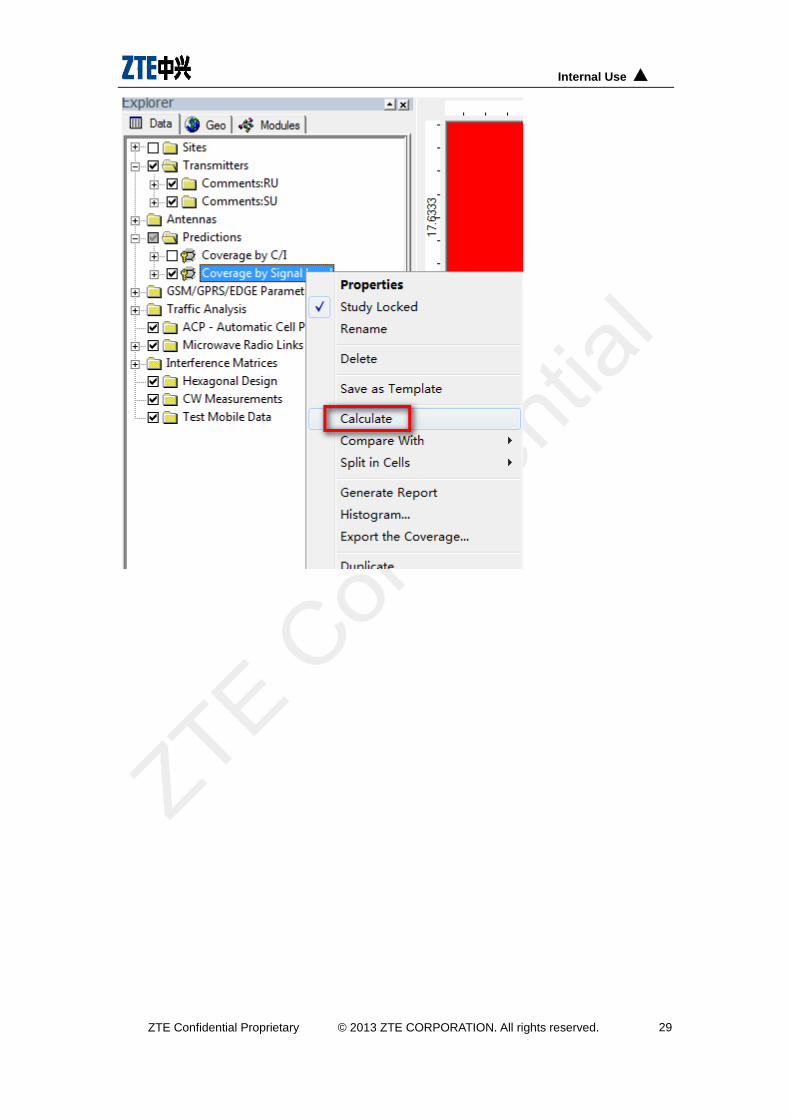
Then right click “RSCP”→“Calculate”, then we get the RSCP Plot.
Apply First Then Confirm
Internal Use ▲
ZTE Confidential Proprietary © 2013 ZTE CORPORATION. All rights reserved.
29
Internal Use ▲
ZTE Confidential Proprietary © 2013 ZTE CORPORATION. All rights reserved.
30
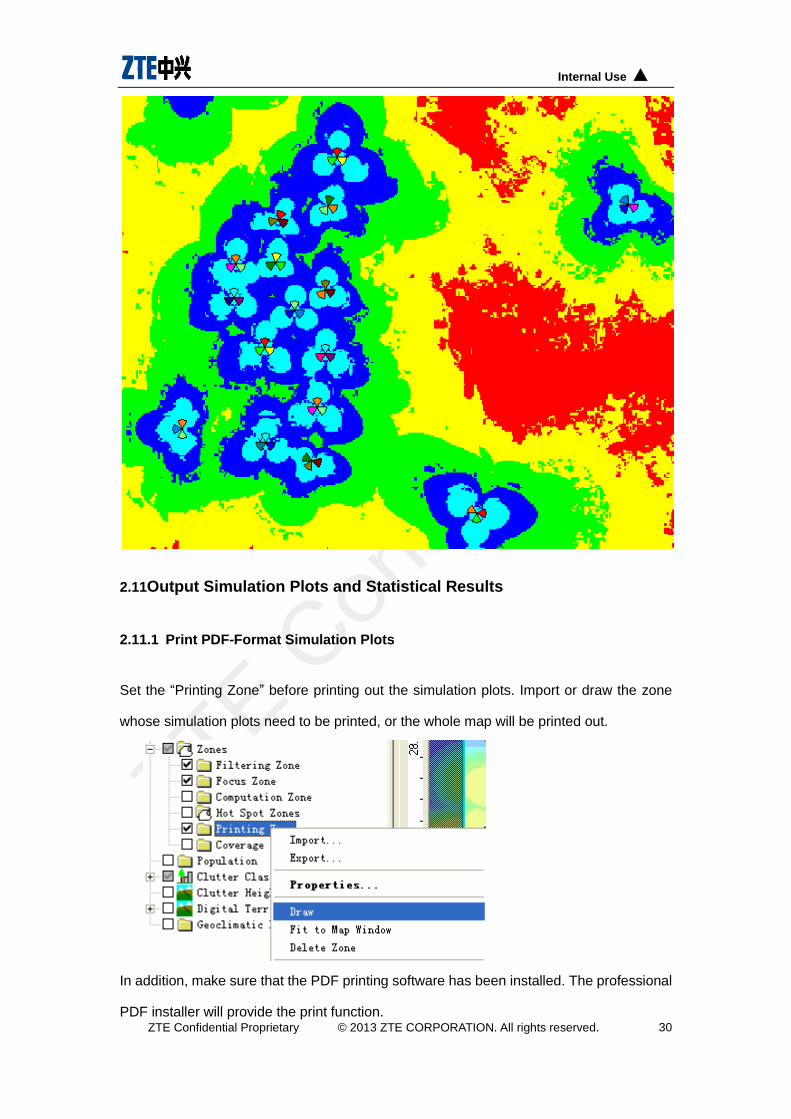
2.11Output Simulation Plots and Statistical Results
2.11.1 Print PDF-Format Simulation Plots
Set the “Printing Zone” before printing out the simulation plots. Import or draw the zone
whose simulation plots need to be printed, or the whole map will be printed out.
In addition, make sure that the PDF printing software has been installed. The professional
PDF installer will provide the print function.
Internal Use ▲
ZTE Confidential Proprietary © 2013 ZTE CORPORATION. All rights reserved.
31
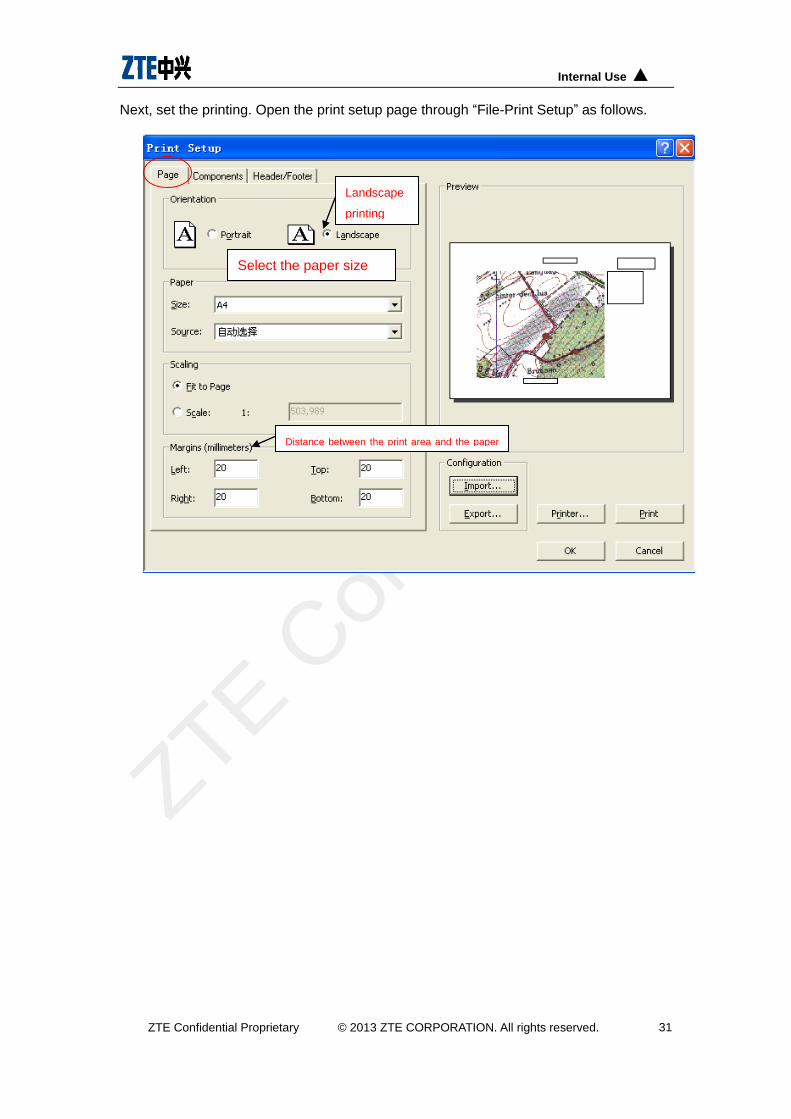
Next, set the printing. Open the print setup page through “File-Print Setup” as follows.
Landscape
printing
Select the paper size
Distance between the print area and the paper
edge
Internal Use ▲
ZTE Confidential Proprietary © 2013 ZTE CORPORATION. All rights reserved.
32
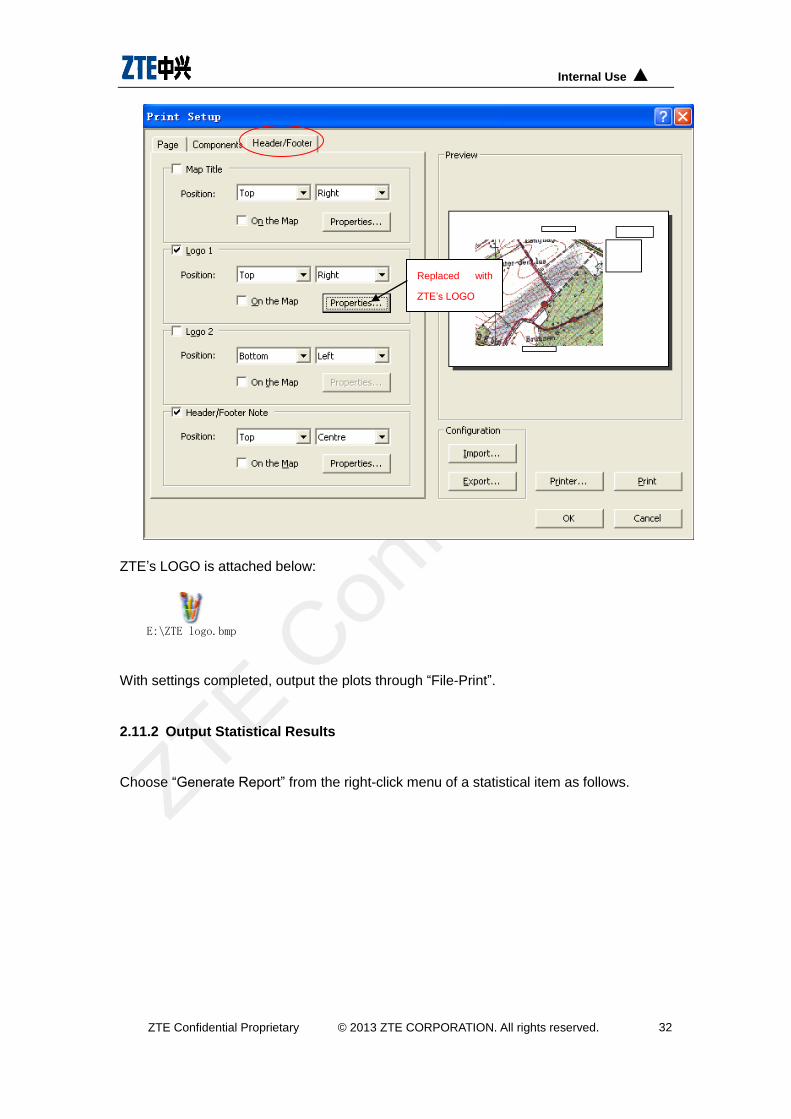
ZTE’s LOGO is attached below:
E:\ZTE logo.bmp
With settings completed, output the plots through “File-Print”.
2.11.2 Output Statistical Results
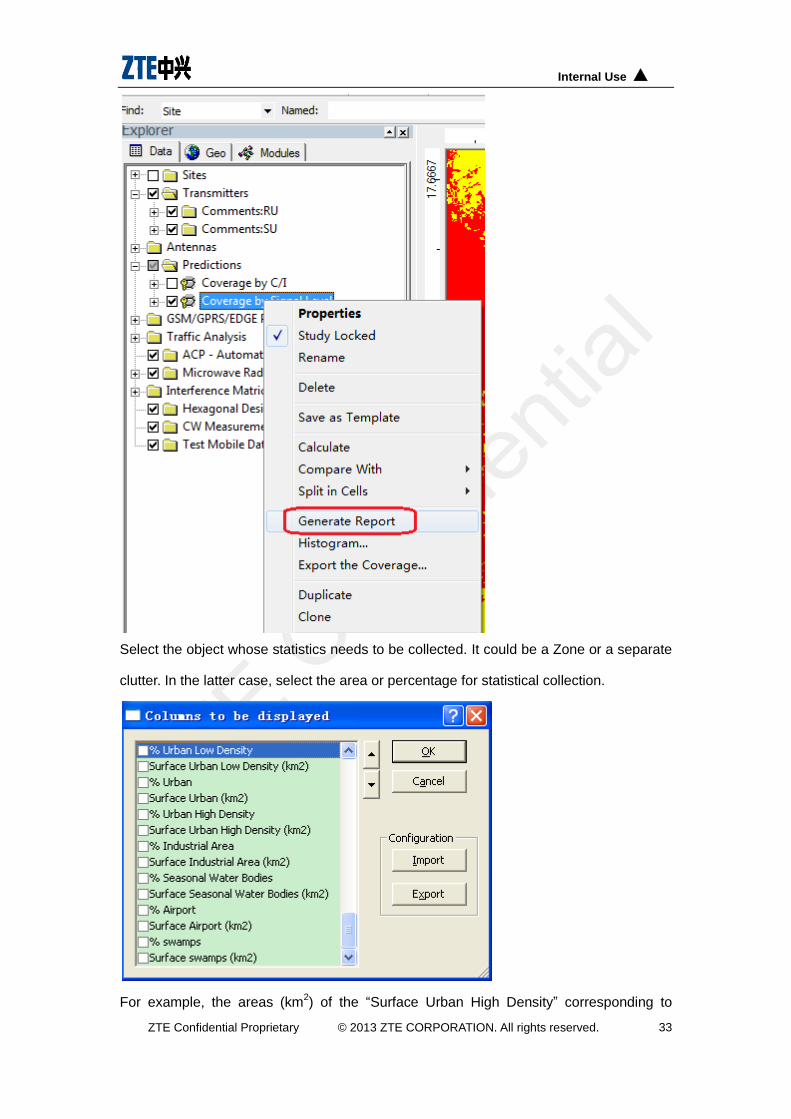
Choose “Generate Report” from the right-click menu of a statistical item as follows.
Replaced with
ZTE’s LOGO
Internal Use ▲
ZTE Confidential Proprietary © 2013 ZTE CORPORATION. All rights reserved.
33
Select the object whose statistics needs to be collected. It could be a Zone or a separate
clutter. In the latter case, select the area or percentage for statistical collection.
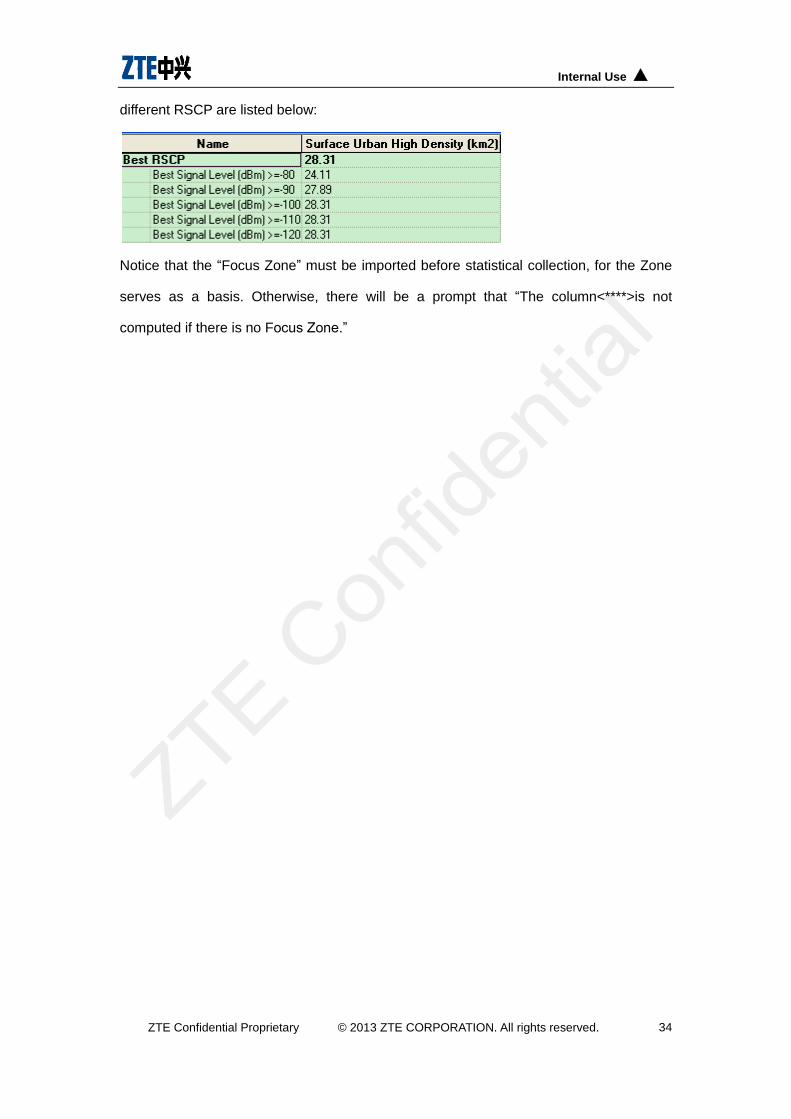
For example, the areas (km2) of the “Surface Urban High Density” corresponding to
Internal Use ▲
ZTE Confidential Proprietary © 2013 ZTE CORPORATION. All rights reserved.
34
different RSCP are listed below:
Notice that the “Focus Zone” must be imported before statistical collection, for the Zone
serves as a basis. Otherwise, there will be a prompt that “The column<****>is not
computed if there is no Focus Zone.”