Embed Size (px)
Citation preview
311
17. INDUSTRIES
17.1 SMALL SCALE INDUSTRIES – 2015-16
Sl.No Two
digit
code
Details of Classification No.of
Units
1 15 Mfg. of Food Products and Beverages 71
2 17 Mfg. of Textiles 19
3 18 Mfg.of Wearing apparel, Dressing and dyeing of fur 28
4 20 Mfg .of Wood and of products of wood and cork, except
furniture: Mfg .of articles of straw and plating materials 4
5 21 Mfg .of Paper and Paper products 11
6 22 Publishing, Printing and reproduction of recorded media 9
7 23 Mfg. Of Cocke & Refined Petroleum Products 1
8 24 Mfg.of Chemicals and Chemical products 5
9 25 Mfg .of Rubber and Plastic products 22
10 26 Mfg of other Non-metallic mineral products 24
11 27 Mfg. of Basic Metals 6
12 28 Mfg. of Fabricated metal products ,except machinery and
equipments 53
13 29 Mfg. of Machinery and equipments n.e.c. 29
14 31 Mfg. of Electrical and Equipment N.E.C. 4
15 32 Mfg. of Radio, TV and Communication Equipments 2
16 33 Mfg. of Medical Precision and Optical Instruments 1
17 34 Mfg. of Motor Vehicles, Trailers and semi trailors 5
18 36 Mfg. of Furniture, Manufacturing n.e.c. 10
19 40 Electricity, Gas, Stream and Water 7
20 41 Collection, Purification & Distribution of Water 10
21 45 Construction 1
22 50 Sale, Maintenance and Repair of Motor Vehicles and Motor
cycles: Retails sale of Automotive fuel 14
23 51 Whole sale trade service etc., 51
24 52 Retail Trade, Except of Motor vehicles and Motorcycles :
Repair of personal and Household Goods 118
25 55 Restaurant and Hotel service 17
26 60 Land Transport via Pipelines 30
27 63 Supporting and Auxiliary Transport 1
28 64 Post and Telecommunications 9
29 65 Financial Intermediation 5

312
Sl.No
Two
digit
code
Details of Classification No.of
Units
30 70 Real Estatate activities, Leasing & Renting services 6
31 72 Computer and Related activities 34
32 74 Other Business activities 181
33 80 Education 11
34 85 Health & Social Work 10
35 91 Activities of member ship organization 1
36 92 Recreational, Cultural & Sport activities 2
37 93 Other Service activities 21
TOTAL 833
Source: General Manager, District Industrial Centre,Pudukkottai.
17.2 NUMBER OF FOOD AND ALLIED MANUFACTURING UNITS – 2015-16
Sl.No. Name of the
Block
Description of the
industry
No.of Industries
All employees
Value of Output
Rs. In lakhs 1 Pudukkottai Food Product 22 673 199.24
2 Arimalam ,, 10 208 237.06
3 Kunnandarkoil ,, 3 13 20.00
4 Thiruvarankulam ,, 10 205 152.42
5 Karambakudi ,, 5 67 701.50
6 Aranthangi ,, 4 22 47.40
7 Avudaiyarkoil ,, 2 14 60.00
8 Manamelkudi ,, 2 82 42.00
9 Annavasal ,, 7 47 48.00
10 Viralimalai ,, 2 9 8.00
11 Gandaravakottai ,, 3 110 75.00
12 Thirumayam ,, 4 57 44.10
13 Ponnamaravathy ,, 2 10 6.25
TOTAL 76 1517 1640.97
Source: General Manager, DIC, Pudukkottai.
313
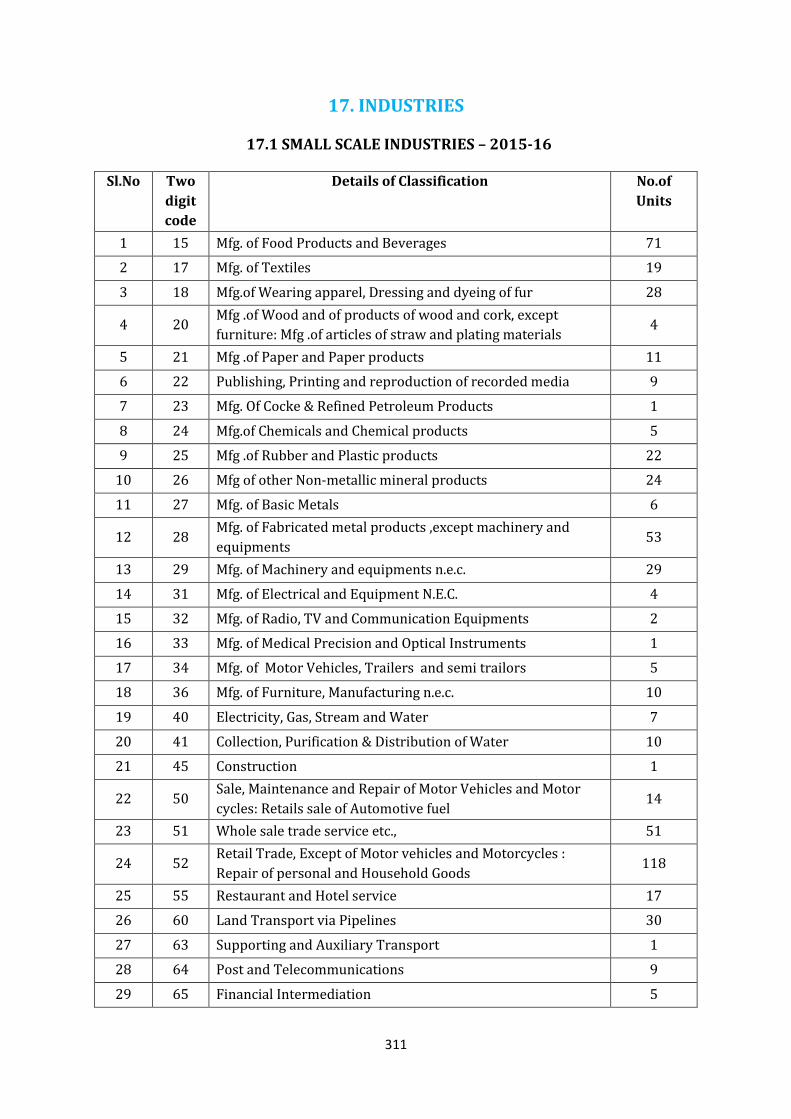
17.3 NUMBER OF NON-FOOD MANUFACTURING UNITS - 2015-16
Sl.No. Name of the Block No.of
Industries All
employees
Value of Output
Rs. In lakhs
1 Pudukkottai 395 2608 16105.95
2 Arimalam 10 46 15.47
3 Kunnandarkoil 16 153 224.00
4 Thiruvarankulam 39 198 825.55
5 Karambakudi 31 166 286.50
6 Aranthangi 65 342 268.02
7 Avudaiyarkoil 15 73 66.25
8 Manamelkudi 13 51 73.55
9 Annavasal 55 623 4423.67
10 Viralimalai 31 654 9353.28
11 Gandaravakottai 22 149 83.60
12 Thirumayam 40 209 197.85
13 Ponnamaravathy 25 109 133.10
TOTAL 757 5381 32056.79
Source: General Manager,DIC, Pudukkottai.

314
17.4 KHADI AND VILLAGE INDUSTRIES – 2015-16
Sl.
No Industry
Production
(Rs.in Lakhs)
Sales
(Rs in Lakhs) Employment
Earning
(Rs. in Lakhs)
1 Poly Yarn - - - -
2 Khadi Goods - 54.26 3 10.44
3 Village Industries - 78.81 1 3.42
4 Cotton Yarn Production 38.95 - 1 2.90
Total 38.95 133.07 5 16.76
Source: Asst.Director , Khadi and Village Industries, Pudukkottai
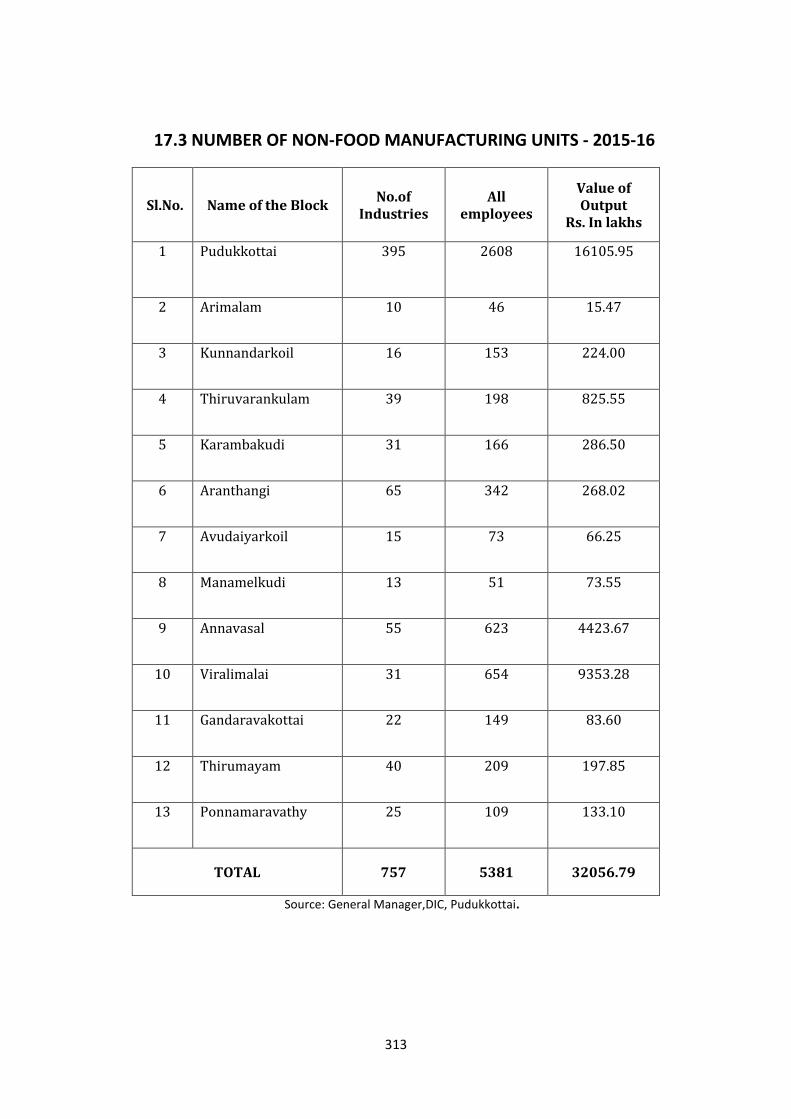
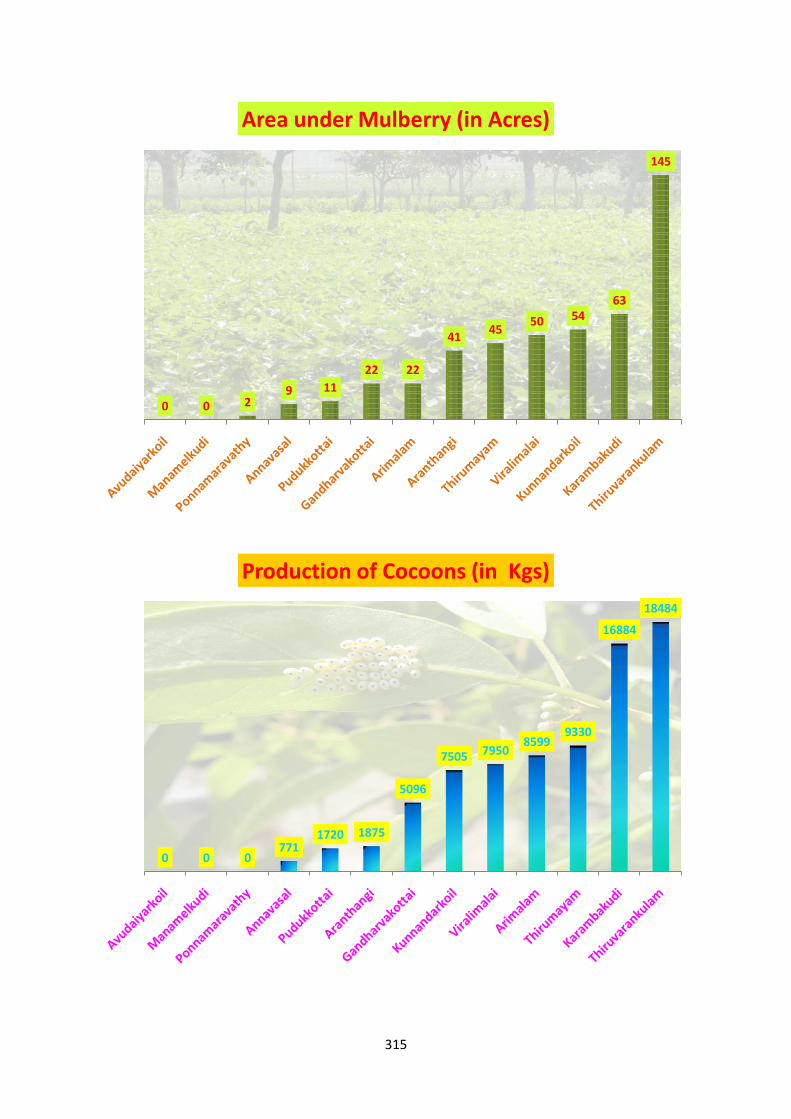
17.5 SERICULTURE – 2015-16
Sl. No.
Name of the block
Area under Mulberry (in Acres)
No.of Farmers
Production of Cocoons
(in Kgs)
Value in Rupees
1 Pudukkottai 11.00 5 1720.000 533200
2 Gandharvakottai 21.50 10 5096.000 1681680
3 Kunnandarkoil 53.50 47 7505.000 2551700
4 Annavasal 9.25 5 771.000 235155
5 Viralimalai 50.25 22 7950.000 2504250
6 Thiruvarankulam 145.00 68 18484.000 6561820
7 Karambakudi 62.65 31 16884.000 6044472
8 Thirumayam 45.40 23 9330.000 3078900
9 Ponnamaravathy 2.35 1 - -
10 Arimalam 21.50 10 8599.000 2811873
11 Aranthangi 41.00 27 1875.000 588750
12 Avudaiyarkoil - - - -
13 Manamelkudi - - - -
Total 463.000 249 78214.000 26591800
Source: Assistant Inspector, Sericulture, Pudukkottai.
315
0 0 29 11
22 22
4145
50 5463
145
Area under Mulberry (in Acres)
0 0 0771
1720 1875
5096
7505 79508599
9330
16884
18484
Production of Cocoons (in Kgs)

316
17.6 SERICULTURE 2013-14
District
Area under Mulberry
as on 01-04-2014 (Ha.) Mulberry
Area newly planted (Ha.)
During 2013-14
Irrigated Rainf
ed Total
Production of Reeling
Cocoon (MT)
Value of Reeling Cocoon
Lakhs Rs @ Rs.338/- per Kg.
Production of
Raw Silk (MT)
Value of Raw Silk Lakh Rs.
@ Rs 2932/- per Kg.
1 2 3 4 5 6 7 8 9
1. Kancheepura
m
15.30 - 15.30 - - - - -
2. Thiruvallur 15.10 - 15.10 - 0.800 2.70 0.100 2.932
3. Cuddalore 59.40 - 59.40 9.80 27.100 91.60 4.100 120.212
4. Villupuram 191.60 - 191.60 54.40 62.600 211.59 9.500 278.540
5. Vellore 745.60 38.84 784.44 168.20 516.000 1744.08 78.000 2286.960
6. Tiruvannamal
ai
224.36 43.60 267.96 70.50 96.300 325.49 14.700 431.004
7. Salem 613.94 - 613.94 141.76 236.400 799.03 36.700 1076.044
8. Namakkal 674.80 42.80 717.60 106.30 203.600 688.17 30.900 905.988
9. Dharmapuri 850.62 - 850.62 191.30 320.100 1081.94 49.600 1454.272
10. Krishnagiri 2090.92 - 2090.9
2
426.90 1614.600 5457.35 243.965 7153.054
11. Erode 1436.50 - 1436.5
0
220.60 974.700 3294.49 152.900 4483.028
12. Coimbatore 753.70 - 753.70 172.30 455.000 1537.90 72.800 2134.496
13. Tiruppur 1969.00 - 1969.0
0
284.50 1235.700 4176.67 197.700 5796.564
14. The Nilgiris 3.20 13.34 16.54 4.14 4.100 13.86 0.600 17.592
15. Tiruchirappal
li
288.32 - 288.32 51.20 61.400 207.53 9.200 269.744
16. Karur 54.80 - 54.80 18.80 17.300 58.47 2.700 79.164
17. Perambalur 23.20 - 23.20 9.20 8.600 29.07 1.400 41.048
18. Ariyalur 47.00 - 47.00 8.80 13.500 45.63 2.100 61.572
19. Pudukkottai 184.80 - 184.8
0
34.26 52.000 175.76 7.900 231.628
20. Thanjavur 72.20 - 72.20 6.60 9.200 31.10 1.400 41.048
21. Nagapattinam 28.20 - 28.20 5.20 7.300 24.67 1.200 35.184
22. Thiruvarur 22.20 - 22.20 6.40 6.800 22.98 1.100 32.252
23. Madurai 118.00 - 118.00 18.80 41.500 140.27 6.600 193.512
24. Theni 555.60 - 555.60 81.00 248.500 839.93 39.400 1155.208
25. Dindigul 1109.80 - 1109.8
0
146.80 696.100 2352.82 109.200 3201.744
26. Ramanathapu
ram
57.60 - 57.60 10.40 11.800 39.88 1.800 52.776
27. Virudhunagar 145.20 - 145.20 41.10 70.500 238.29 11.200 328.384
28. Sivaganga 51.20 - 51.20 13.80 10.800 36.50 1.600 46.912
29. Tirunelveli 436.84 - 436.84 93.94 169.500 572.91 26.500 776.980
30. Thoothukkud
i
43.84 - 43.84 13.40 12.900 43.60 2.000 58.640
31. Kanniyakuma
ri
40.18 - 40.18 10.00 21.100 71.32 3.300 96.756
TOTAL 12923.0
2
138.
58
13061
.60
2420.40 7205.800 24355.6
0
1120.16
5
32843.24
0 Source : Statistical Handbook of Tamilnadu - 2015

317
17.7 SALT PRODUCTION – 2014-15
YEAR Kattumavadi
1997 1504
1998 ---
1999 1899
2000 896
2001 1464
2002 1140
2003 ---
2004 965
2005 1840
2006 1500
2007 900
2008 830
2009 1095
2010 780
2011 850
2012 1150
2013 800
2014 1010
2015 NIL
Source : Salt Factory Officer, Kattumavady.
17.8 NO.OF PRINTING PRESSES- 2015-16
Sl.No. District Number Workers
1 Pudukkottai 2 62
Source : Statistical Handbook of Tamilnadu - 2015