Embed Size (px)
Citation preview

Optimum Sizing for Anaerobic Digestion
Emad Ghafoori and Peter Flynn
Department of Mechanical Engineering University of Alberta
March 2006
A BIOCAP Research Integration Program
Synthesis Paper

This paper was supported by BIOCAP through a targeted research program.
The report reflects the research findings and opinions of the research team and not necessarily those of BIOCAP Canada.

Ghafoori and Flynn March 2006 Page 1
Table of Contents
Objectives of the Work ………………………………….. 2
Summary of Conclusions ………………………………….. 3
Model Development ………………………………….. 5
Manure Sources …………………………………. 6
Transportation ………………………………… . 6
Processing ………………………………… 6
Application of the Model ………………………………….. 7
Red Deer County …………………………………. 7
Lethbridge-Calgary Corridor ………………………… 13
Discussion ………………..………………………………….. 17
Appendix 1: User’s Manual & Scope of the Model ………... 18
Appendix 2: Impact of Scale on Cost of Processing Manure …. 28
References ……………………………………………………. 30
The authors gratefully acknowledge financial support from the Alberta Energy Research Institute and Alberta Agricultural Research Institute, which have supported a long term study of manure processing. Additional specific research studies have been supported by the Biocap Canada Foundation and by the Edmonton Waste Management Centre of Excellence from funds provided by the sponsors of the Red Deer County Biogas Plant Feasibility Study.
Note: all cost figures in this report are in 2005 CAD unless otherwise noted.

Ghafoori and Flynn March 2006 Page 2
Objectives of the Work The objectives of this study are: • To develop a specific model of power
production from anaerobic digestion (AD) of manure for two regions of Canada for which detailed data on manure availability is accessible. The two regions are Red Deer County, Alberta, a mixed farming region with some urban and industrial development, and an area between Calgary and Lethbridge, Alberta, that contains many large feedlots associated with finishing beef cattle. Red Deer County would be typical of numerous agricultural regions in Canada; Lethbridge itself is known as “feedlot alley” and it and the surrounding areas are the highest concentration of animal manure in Canada. The specific model was designed so that key parameters can be varied to enable sensitivity studies of many factors including gas yield, transportation cost, and plant cost.
• To draw conclusions from the
application of the specific model about cut off sizes at which farm/feedlot processing is more economic than centralized digesters.
• To consider the implications of scale
on alternate processing schemes, such as digestate processing and the production of pipeline quality natural gas instead of electrical power.
• To adapt the specific model into two
general interactive models that would enable an analysis of the cost of producing power from anaerobic digestion (AD) of manure in farm-based and centralized digesters, and in particular to enable the determination of cost as a function of scale. The model is designed so that key parameters can be modified.
This study is based on a consistent scope for all cases of anaerobic digestion in well mixed digesters, with production of electrical power from the biogas. Yields are based on thermophilic AD, although the choice of thermophilic vs. mesophilic well mixed AD does not create a significant cost difference. We discuss the potential to produce two gas streams from an anaerobic digester, carbon dioxide and pipeline grade natural gas (meeting specification for sulfur and inert gas concentrations), instead of electrical power.
A Note to Producers The key message of this study is that small farm based manure digesters are less cost effective than centralized units that receive manure from many producers. Farmers that want to process manure and produce power are better to transport their manure than to process it on site. For the mixed farming area that was intensively studied, even a feedlot with 7,500 beef cattle could not make power from manure as economically as a centralized digester, and the cost penalty is greater for smaller farms. Centralized plants can’t share the waste heat from power production, available as warm water, with every farm in the area, but the savings in cost is greater than this penalty. Denmark is a country that has developed many centralized digesters that receive manure from many farm sources and return digestate, the material left after production of biogas, back to the farm. Digestate is spread on land, much like manure. It has all of the nutrients but none of the pathogens of manure. In Denmark most of the manure processing power plants are farmer cooperative units, i.e. they are owned by the farmers whose manure is processed in them. Digestate contains about 7% solids, and this material can be separated from the digestate. If solids are separated about half the phosphate in the manure ends up in the solid. This is one means of reducing phosphate application in areas that have excess phosphate levels in soils.

Ghafoori and Flynn March 2006 Page 3
This study is based on return of digestate, the liquid left after anaerobic digestion, to the source farm/feedlot for subsequent land spreading. We believe that no method of treating digestate is commercially demonstrated today other than separation of a moist solid stream from the digestate and a low solids liquid fraction, and further that no process for recovering solid fertilizer and dischargeable water from the liquid fraction is commercially demonstrated today. Thus land spreading remains the most common method of dealing with either whole digestate or the liquid fraction. We comment briefly on the impact on decisions about scale of the likely future development of digestate processing technologies. Summary of Conclusions Key conclusions of the specific models developed in this study are: • Red Deer County, Alberta, is a typical
mixed farming area; for the portion of the county included in our analysis the production of manure is 34 dry tonnes per square km per year. The cost of power from AD processing of manure is high, greater than $250 per MWh (25 cents per kWh) for all cases evaluated. One critical factor in estimating the cost of power is the yield of biogas per unit input of manure; default values in this study are consistent with reported Danish plant yields and the performance of the IMUS plant in Vegreville, AB. A second critical factor is the capital cost of an AD plant; default values in this study are based on 80% of the reported “as built” costs of Danish plants adjusted to include power generation, and are consistent with the estimated cost of the IMUS plant in Vegreville, AB excluding development costs. Recent “budgetary quotes” provided to Red Deer County for thermophilic and mesophilic plants ranged from 60% to 80% of the adjusted Danish “as built” costs; providers of budgetary quotes placed an estimated accuracy of +/- 25% on their submissions. Caution should be exercised with early stage budgetary estimate quotations.
• For Red Deer County, a single centralized AD plant is more economic than any combination of
multiple plants, including farm-based plants. It is more cost effective for even the largest single manure source in Red Deer County, a 7500 animal beef cattle feedlot, to ship its manure to a centralized AD plant and receive back digestate than it is to develop a stand alone unit at the feedlot. The critical factor favoring a centralized digester is the lower capital cost per unit of input/output realized in a large economically sized plant; this savings is greater than the cost of transporting manure to and digestate from the plant.
• Centralized manure processing offers advantages other than those factored into the cost
calculations in this study. These include:
a) The potential to economically process digestate into a concentrated dry fertilizer and a disposable water stream. Solids can be filtered from digestate and have some nitrogen and high levels of phosphorous. This material is suitable as a compost-type fertilizer. Remaining phosphorous and nitrogen can potentially be recovered from the liquid filtrate. We believe that
A Note to Designers and Researchers The generalized models of anaerobic digestion of manure and a User’s Manual are available for public use. It has been provided to Biocap, and is also available from the authors through a link on the web site: http://www.engineering.ualberta.ca/mece/peter_flynn.cfm The model is designed to allow maximum flexibility in the adjustment of parameters; a full description of adjustable parameters and their default values is in the User’s Manual.

Ghafoori and Flynn March 2006 Page 4
sophisticated processing of the liquid component of digestate could not be economically achieved in small distributed plants.
b) The potential to produce pipeline gas rather than electric power. There are two problems with
producing electric power from biogas: it is done at a small scale, and it is base loaded, i.e. typically operating on a 7x24 basis. For the case of Red Deer County, a single large centralized digester would support an 8.1 MW gross power production (6.5 MW net of internal usage); this size is tiny compared to 150 to 500 MW turbo-generators typical in the power industry. Most gas-fired power plants are either co-gen or peaking plants that generate only during periods of high power price; using a methane rich stream to generate power on a continual basis is an application that is virtually unique to AD.
• Producing pipeline quality gas from biogas requires the removal of CO2 (typically 1/3 of the biogas
stream) and traces of H2S, followed by compression. These process steps are simple and have an estimated capital cost that is lower than power generation, but would likely only be achievable from larger plants. Revenue from gas and power sale is variable by Province; in Alberta, gas sale even at futures gas prices of $8.50 per GJ gas sale revenue exceeds power sale revenue at the average wholesale price of $70 per MWh. Ontario is proposing a higher power price for green power, and hence the choice between producing gas and power may be driven by location based decisions on subsidy. One biogas plant in Texas has announced that it will separate CO2 and produce pipeline gas (Environmental Powers Inc. and South-Tex Treaters). Carbon credits for gas vs. power sale are also variable by Province, and depend on the power that is being displaced by generation from biogas. In Alberta, the carbon credit for power generation is higher than for pipeline gas production because coal is assumed to be the displaced power plant fuel; in Ontario gas would likely be the displaced fuel, and carbon credits for biogas power generation would accordingly be lower. We are uncertain of the generation mix in other Provinces, and this would require a project specific analysis.
• The fixed cost of transportation, i.e. the cost of the truck and trucker while loading solid or liquid
manure, is the largest component of transportation cost for any configuration of AD in Red Deer County. The fixed cost of loading and unloading manure is $4.2 per tonne for liquid manure and $6 per tonne for solid manure. Given the short haul distances within the county, this cost is higher than the cost of rolling transport ($0.11 per tonne km for both liquid and solid manure). Note that power costs in this study include manure pickup and digestate return transport costs for all centralized digesters, i.e. double handling of manure. The farm or feedlot carries the cost of local storage of returned digestate and of spreading it on land. In the case of a farm or feedlot based digester the power cost includes moving the manure to the digester, but does not include any cost for digestate transport. In essence, in all cases the manure generator (farm or feedlot) pays for one transport of manure or digestate; all other transport is absorbed in the power cost.
• One portion of Alberta, from north of Calgary through the County of Taber south and east of
Lethbridge, has over one million beef cattle in feedlots (Canfax, 2005). The cost of county-based and regional-based centralized digesters is compared to individual feedlot based AD units. At a size of approximately 20,000 animals the model forecasts that cost of power from a feedlot-based plant is $159 per MWh, which is lower than that from the best centralized digester case. A centralized digester serving Lethbridge and another adjacent county (Vulcan County) would produce 77 MW at an estimated cost of $163 per MWh; this is the lowest cost of a centralized digester in the cases evaluated for “feedlot alley”. A centralized AD plant serving the total area from Taber to north of Calgary could generate 135 MW at an estimate cost of $293 per MWh.
• The 20,000-animal cutoff for feedlot-based processing being more economic than centralized
processing would rise to 250,000 if digestate processing were adopted, based on a very preliminary and approximate estimate of digestate processing having a capital cost of 2/3 of an AD plant
Ghafoori and Flynn March 2006 Page 5
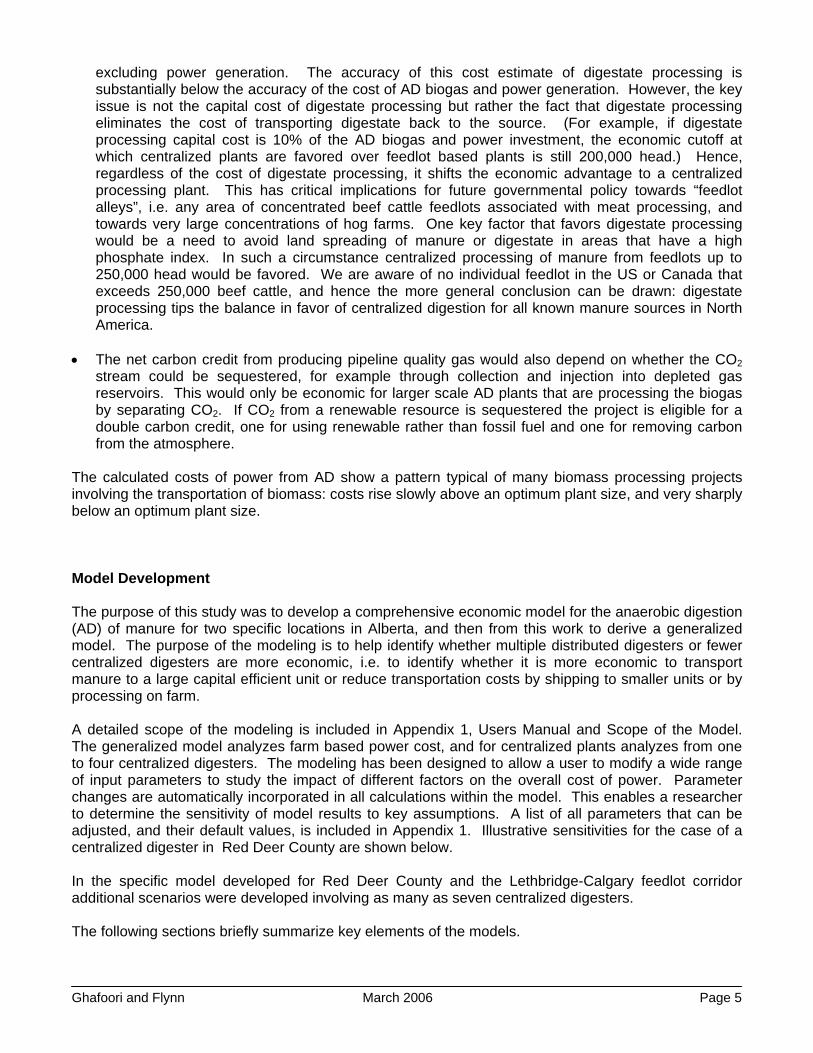
excluding power generation. The accuracy of this cost estimate of digestate processing is substantially below the accuracy of the cost of AD biogas and power generation. However, the key issue is not the capital cost of digestate processing but rather the fact that digestate processing eliminates the cost of transporting digestate back to the source. (For example, if digestate processing capital cost is 10% of the AD biogas and power investment, the economic cutoff at which centralized plants are favored over feedlot based plants is still 200,000 head.) Hence, regardless of the cost of digestate processing, it shifts the economic advantage to a centralized processing plant. This has critical implications for future governmental policy towards “feedlot alleys”, i.e. any area of concentrated beef cattle feedlots associated with meat processing, and towards very large concentrations of hog farms. One key factor that favors digestate processing would be a need to avoid land spreading of manure or digestate in areas that have a high phosphate index. In such a circumstance centralized processing of manure from feedlots up to 250,000 head would be favored. We are aware of no individual feedlot in the US or Canada that exceeds 250,000 beef cattle, and hence the more general conclusion can be drawn: digestate processing tips the balance in favor of centralized digestion for all known manure sources in North America.
• The net carbon credit from producing pipeline quality gas would also depend on whether the CO2
stream could be sequestered, for example through collection and injection into depleted gas reservoirs. This would only be economic for larger scale AD plants that are processing the biogas by separating CO2. If CO2 from a renewable resource is sequestered the project is eligible for a double carbon credit, one for using renewable rather than fossil fuel and one for removing carbon from the atmosphere.
The calculated costs of power from AD show a pattern typical of many biomass processing projects involving the transportation of biomass: costs rise slowly above an optimum plant size, and very sharply below an optimum plant size. Model Development The purpose of this study was to develop a comprehensive economic model for the anaerobic digestion (AD) of manure for two specific locations in Alberta, and then from this work to derive a generalized model. The purpose of the modeling is to help identify whether multiple distributed digesters or fewer centralized digesters are more economic, i.e. to identify whether it is more economic to transport manure to a large capital efficient unit or reduce transportation costs by shipping to smaller units or by processing on farm. A detailed scope of the modeling is included in Appendix 1, Users Manual and Scope of the Model. The generalized model analyzes farm based power cost, and for centralized plants analyzes from one to four centralized digesters. The modeling has been designed to allow a user to modify a wide range of input parameters to study the impact of different factors on the overall cost of power. Parameter changes are automatically incorporated in all calculations within the model. This enables a researcher to determine the sensitivity of model results to key assumptions. A list of all parameters that can be adjusted, and their default values, is included in Appendix 1. Illustrative sensitivities for the case of a centralized digester in Red Deer County are shown below. In the specific model developed for Red Deer County and the Lethbridge-Calgary feedlot corridor additional scenarios were developed involving as many as seven centralized digesters. The following sections briefly summarize key elements of the models.

Ghafoori and Flynn March 2006 Page 6
Manure Sources Two specific cases are analyzed in detail, incorporating the best available information on quantity and location of manure. The feedstock supply in this model for Red Deer County is based on a survey of the different sources of manure by size, type and location within the county. Red Deer Country is likely typical of many fixed farming areas in Canada, with manure sources from dairies, cow/calf operations, beef cattle feedlots, hog and poultry operations. In the initial stage of model building, 7 major areas in Red Deer County were thought to possibly produce enough feedstock to potentially supply a stand alone typical biogas plant. Manure quantities outside the seven areas are few and were not quantified or included in this model; however, additional manure sources and other types of waste, such as food processing waste, crop residues or purpose grown crops, can be added to the model in the future. The model can be used to evaluate whether including a distant source of manure helps or detracts from the economics of an AD plant. (Note that current regulations prohibit land spreading of digestate from an AD plant processing any part of ruminant animal waste; such material would have to be taken to a safe landfill or incinerated. Hence, it is very unlikely that a centralized AD plant would process such material, since a small amount of feed would in effect increase the cost of disposing of a large amount of end product.) In Red Deer County actual farm and feedlot locations were used to calculate the transportation distance to each of 14 different modeled AD plants. Precise confined feeding operation locations are not known for the Lethbridge to Calgary beef cattle feedlot corridor, but cattle numbers are so high in some counties that reasonable transportation numbers can be approximated by using the center of the county as the average transportation distance for shipment outside the county, and assuming the feedlots are dispersed evenly across the county for single county processing in the two areas of very high concentration. Transportation costs are hence less precise than for Red Deer County but within the accuracy of the overall study. Transportation In this study the manure source , i.e. farm or feedlot, is responsible for either loading solid manure onto an open truck during a scheduled delivery or making liquid manure available in a buried tank from which a truck can load year round independent of weather. The liquid manure storage would have sufficient volume to fill a “B Train”, i.e. trailer and pup, tank truck. The manure source is also responsible for the construction of a digestate receiving pit with sufficient volume to hold all returned material between periods of land spreading. Solid manure transport costs are based on a regression of extensive data on agricultural product shipping costs published by the Alberta Agriculture. The regression gives both the distance fixed cost that arises from loading and unloading time ($ per tonne) and the distance variable costs ($ per tonne km). Alberta has a well developed liquid trucking industry focused on the oil and gas sector, and estimates of distance fixed and distance variable costs are developed from loading and unloading times and the per hour cost and an assumed average transportation speed of 80 km/hr. Distance fixed and variable cost default values are $6 per tonne and $0.11 per tonne km (solid manure) and $4.2 per tonne and $0.11 per tonne km (liquid manure). As with most model parameters, these values can be adjusted. Processing For all cases in this study the technology is assumed to be thermophilic anaerobic digestion followed by minor gas cleanup (moisture control and some sulfur removal) and combustion of the gas. For all cases up to 25 MW the basis of power generation is an internal combustion engine electrical generation module with a generation efficiency of 37-43%; above 25 MW we assume the technology would change to combined cycle (gas turbine and heat recovery steam generator with a generation efficiency of about 55%) (Harrison, 2005; Shilling, 2005).

Ghafoori and Flynn March 2006 Page 7
Power production from biogas is more widely applied than production of pipeline quality gas, and hence costs are better defined. Based on limited data it appears that at 40,000 Nm3 the capital investment in three steps required to produce pipeline quality gas (sulfur removal, CO2 removal and compression) have a slightly lower capital cost than power generation; however, the quality of the data on which this estimate is based is not as reliable as the data for power generation (Mezei, 2006). Digestate is returned to each source in proportion to the amount of solids material received in the manure. Operating costs for AD plants were developed based on an estimate of annual maintenance costs as a percentage of capital costs; 3 % is the default model value. Operating labor is assumed to be zero for farm AD plants and for feedlot-based plants up to 7500 head of cattle. Note that this assumes that available labor at the farm or feedlot can accommodate the workload of operating the AD plant without additional staffing, an assumption that in effect reduces the cost of farm/feedlot AD power relative to centralized plants. Experience at the IMUS plant suggests that a full time skilled operator is required to operate a feedlot based plant processing the manure from as little as 5000 cattle. For centralized AD plants operating staffing levels increase with increasing size, as discussed in Appendix 1. Capital costs for AD plants are estimated based on a scaling capital costs. The default scale factor in the model is 0.6. Figure 1 shows estimated and actual AD plant costs from several sources, all adjusted to currency in 2005 US dollars (Al Saedi, 2000; Nielsen and Gregersen, 2002; Gregersen, 1999; Hashimoto et al, 1979; Mathony et al., 1999; Li, 2004; Tofani, 2006; AgStar, 2003). In Denmark AD plants typically sell gas across the fence to a nearby combined heat and power (CHP) plant. Cost data from Denmark in Figure 1 is therefore adjusted to include the estimated cost of an electrical generation unit. There are three major sets of data in Figure 1: adjusted data from actual Danish centralized AD plants, estimated costs from a Danish study of yet larger centralized AD plants, and a detailed study by A.G. Hashimoto over 20 years ago that drew on a detailed equipment list and individual scale factors for each piece of equipment. In addition, Figure 1 shows various other cost figures that included budgetary estimates prepared for Red Deer County, an estimated IMUS cost, and an estimate for a plant in Ireland. Best fit values for the scale factor for the three data sets in Figure 1 are all close to 0.6, a value that is also consistent with chemical process plants and with numerous prior studies of AD. Finally, Figure 1 also includes calculations from the US Department of Agriculture AgStar program for estimating on farm digester costs. Note that we have reservations about the accuracy and consistency of the AgStar estimating basis. Application of the Model Red Deer County In order to evaluate all options, the cost of power from each of the seven initially identified “hot spots” was developed by sizing a plant to the manure sources. Note that calculated power cost does not include a credit for sale of byproducts such as heat, carbon credits, or in the case of digestate processing, fertilizer. These items can be factored into revenue and can in the future be factored into a lower net power cost if reliable figures for ancillary revenue become available. To ensure all additional options were considered, comparable calculations were done for additional plants of a larger size, so that the county could be served by any of seven, six, four, three, two or one AD plants. Based on developing costs for a total of 14 plants, 9 different scenarios were developed that process all feedstock in the county. As an example, scenario 1 is based on building 7 individual plants, scenario 5 is based on building 4 plants to receive manure from all areas, and scenario 9 is based on building one centralized plant for the whole county. Power cost is calculated for each scenario, and for individual

Ghafoori and Flynn March 2006 Page 8
farm or feedlot based plants, including all operating costs and capital recovery with a default pretax return on equity of 12%.
y = 147,870 x0.5983
y = 360,280 x0.5608
y = 323,862 x0.5612
y = 25,500 x0.7327
$0
$4,000
$8,000
$12,000
$16,000
0 200 400 600 800 1,000 1,200 1,400 1,600
Biomass Input (m3/day)
Cap
ital C
osts
('10
00 U
SD)
Danish plants Hashimoto Irish CAD Danish studyIMUS AgStar RDC Plant
Figure 1. The Estimated Cost of Biogas Plants Generating Electric Power For biomass plants processing field sourced (transported biomass) two offsetting cost factors compete as size of plant increases. Transportation cost increases with increasing plant size, since biomass must be transported in from further distances, while capital cost per unit output decreases due to the economy of scale. For a detailed discussion of these cost factors, see Appendix 2. In this model we use a detailed calculation of all cost factors to measure the impact of this tradeoff. The model results included in Figure 2 show that for Red Deer County one centralized plant receiving all manure produced within the county has the lowest overall cost. From Figure 3 it can be seen that although one centralized plant has the lowest overall cost that plant size (8.1 MW gross power output) is still not an optimum size, i.e. additional manure would further reduce the net cost of power. Note, however, that the incremental cost reduction for increasing size is quite low, i.e. the curve of power cost as a function of size has flattened considerably. The results in Figure 3 also show the importance of transport costs in the overall costs. The cost of transporting manure to the plant and returning the digestate back to the farm is 35 to 60% of the total power cost. More than half of this is paid to return the digestate back to the incoming sources. As noted above a large portion of the transportation costs (70-90%) arises from loading and unloading costs (distance fixed costs). Table 1 and Table 2 contain the detailed transport costs and overall power costs for 14 different options analyzed for the county of Red Deer. Note that digestate processing to produce a compact dry fertilizer and a dischargeable water stream would significantly reduce the transportation cost of centralized AD processing of manure. Given the complex chemical and physical

Ghafoori and Flynn March 2006 Page 9
processing steps involved in the liquid digestate treatment steps, we believe that this will be uneconomic in small distributed plants.
$200
$230
$260
$290
$320
$350
Sc1: 7 Sc2: 6 Sc3: 6 Sc4: 5 Sc5: 4 Sc6: 3 Sc7: 2 Sc8: 2 Sc9: 1
Different Possible Scenarios
Wei
ghte
d A
vera
ge P
ower
Pro
duct
ion
Cos
ts ($
/MW
h)
Figure 2. Economics of the Different Scenarios for the Red Deer County
$0
$200
$400
$600
$800
$1,000
$1,200
0 1 2 3 4 5 6 7
Biogas Plant Size (MWe)
Pow
er P
rodu
ctio
n C
osts
($/M
Wh)
Power Costs
Processing Costs
Transport Costs
Figure 3. Cost of Producing Power at the Red Deer County

Ghafoori and Flynn March 2006 Page 10
Table 1. Cost of Transporting Manure and Digestate for Different Plant Options
Plant Size Manure Transport Digestate Transport
net MWe $/MWh % of overall $/MWh % of overall
0.06 $72 7% $70 7%
0.46 $59 13% $74 17%
0.67 $57 15% $75 19%
0.88 $50 15% $65 19%
1.02 $63 18% $75 22%
1.42 $59 20% $69 23%
1.75 $50 18% $68 24%
1.91 $60 20% $72 24%
2.06 $63 21% $80 27%
2.48 $55 20% $74 27%
2.66 $65 23% $83 29%
3.80 $64 23% $86 31%
3.97 $71 25% $91 32%
6.46 $71 27% $94 36%
Changes were applied to the model when dealing with farm and feedlot-based units. For farms with liquid manure streams, e.g. dairy and hog, no transportation charge is included and the operating labor is also removed from the cost model. In effect, we treat the cost of pumping liquid manure to the digester as a negligible cost. For feedlots or farms with a solid manure stream the fixed cost of loading the manure is included in the power cost since the operation will likely be moving from a single handling of manure (pen to field) to a double handling (manure to digester and digestate to field). However, as with liquid manure farms, operating labor is excluded from the cost of individual farm- or feedlot-based units. The overall cost of producing power in farm-based plants at different scales is assessed in the model and compared to the cost of producing power in a central plant. These results are included in Figure 4. The horizontal line in Figure 4 is the cost of producing power at a central plant and any source below this line can generate power in a farm-based plant at a net power cost less than that from a centralized digester. As is evident from Figure 4 even the largest manure source in the Red Deer County is not capable of producing power at a cheaper cost than a central plant. The critical conclusion from Figure 4 is that for Red Deer County no individual source of manure can produce power from an individual AD plant at a cost lower than that from a centralized digester.

Ghafoori and Flynn March 2006 Page 11
Table 2. Overall Cost of Producing Power for Different Plant Options
Plant Size Plant Annual Costs*
Total Transport Costs
Total Power Costs
net MWe $/MWh $/MWh $/MWh
0.06 $905 $143 $1,048
0.46 $304 $133 $437
0.67 $254 $132 $386
0.88 $220 $115 $334
1.02 $206 $138 $344
1.42 $172 $128 $299
1.75 $168 $118 $285
1.91 $162 $132 $293
2.06 $156 $143 $299
2.48 $144 $128 $272
2.66 $139 $148 $288
3.80 $124 $150 $274
3.97 $121 $162 $283
6.46 $98 $164 $262 * Plant annual costs include capital recovery.
Centralized digestion in Red Deer County has three advantages in addition to the cost factors included in this model. First, it would centralize a large quantity of digestate and enable the future processing of this digestate as technology emerges to do so. Filtration of digestate solids is a proven technology today, but leaves a liquid fraction that still must be spread on land; hence in this model the basis is disposal of a total digestate fraction onto land by returning the equivalent digestate volume to each farm or feedlot. Digestate could be stored in open ponds as it is virtually odor free. However, researchers and process developers are working towards processing schemes that will remove fertilizer components from the liquid fraction of digestate and produce a dischargeable water stream. This kind of processing would be sophisticated chemical or physical processing that would only be economic at a larger scale, i.e. it would not be economic to apply in small farm based units.
A second advantage of centralized digestion is that it gives the option of producing pipeline quality gas as an alternative to power. Producing pipeline quality gas would require gas cleaning (removal of CO2 and H2S), and easy chemical process but one that would only be economic at large scale. It would also require compression, a step that also has a significant economy of scale. Producing pipeline quality gas would allow the revenue from AD to shift from power sale to gas sale. Two factors limit the profitability of power sale from AD units: the power is generated at very small scales, and the power is produced on a base load 7x24 basis. The power industry today reaps the economy of scale by very

Ghafoori and Flynn March 2006 Page 12
large generation units (150 to 500 MW are typical) and by focusing gas fired power generation on peaking units, i.e. units that generate during peak pricing periods. AD power generation fails to achieve either of these economies.
1 source1 source1 source1 source
1 source2 sources
1 source2 sources
4 sources
7 sources
40 sources
$262
$0
$200
$400
$600
$800
$1,000
0-50 50-100 100-150 150-200 200-250 250-300 300-350 350-400 400-450 450-500 500-550 550-600 600-650 650-700
Size of Manure Source in Equivalent Power Potential (kWe)
Tota
l Pow
er C
osts
($/M
Wh)
Figure 4. Farm-based Power Cost as a Function of the Size of the Source A third advantage of centralized digestion is that it enables the option, if combined with CO2 removal, of sequestering the CO2, for example in a depleted natural gas formation. The use of a renewable energy source such as manure gives a single carbon credit for displacing fossil fuel; sequestration of carbon from a renewable energy source would give a second carbon credit for a net removal of carbon from the atmosphere. Again, the steps involved in sequestration, including compression and pipelining of the gas, would only be economic at larger scale. We did not develop the economics of producing pipeline gas in detail, because capital costs are less well known than for power generation, the relative value of gas vs. power varies widely on a province by province basis, carbon credits for producing gas vs. power will vary province by province, and opportunities for sequestering carbon also vary both by province and within a province based on local geological formations. However, capital cost data for producing pipeline quality gas should become more firm in the near future, particularly if one large scale project proceeds in Texas. Five different revenue streams are identified within the model for central plants; power sales, heat sales, tipping fees, carbon credits, and subsidies. It is assumed that a farm-based plant would only generate revenue from power sales and subsidies, but would benefit in some cases from reduced energy consumption because of heat recovery from an AD power plant. Farm-based units would likely be at too small a scale to participate in the sale of carbon credits and are too dispersed to sell heat to a third party.
Ghafoori and Flynn March 2006 Page 13
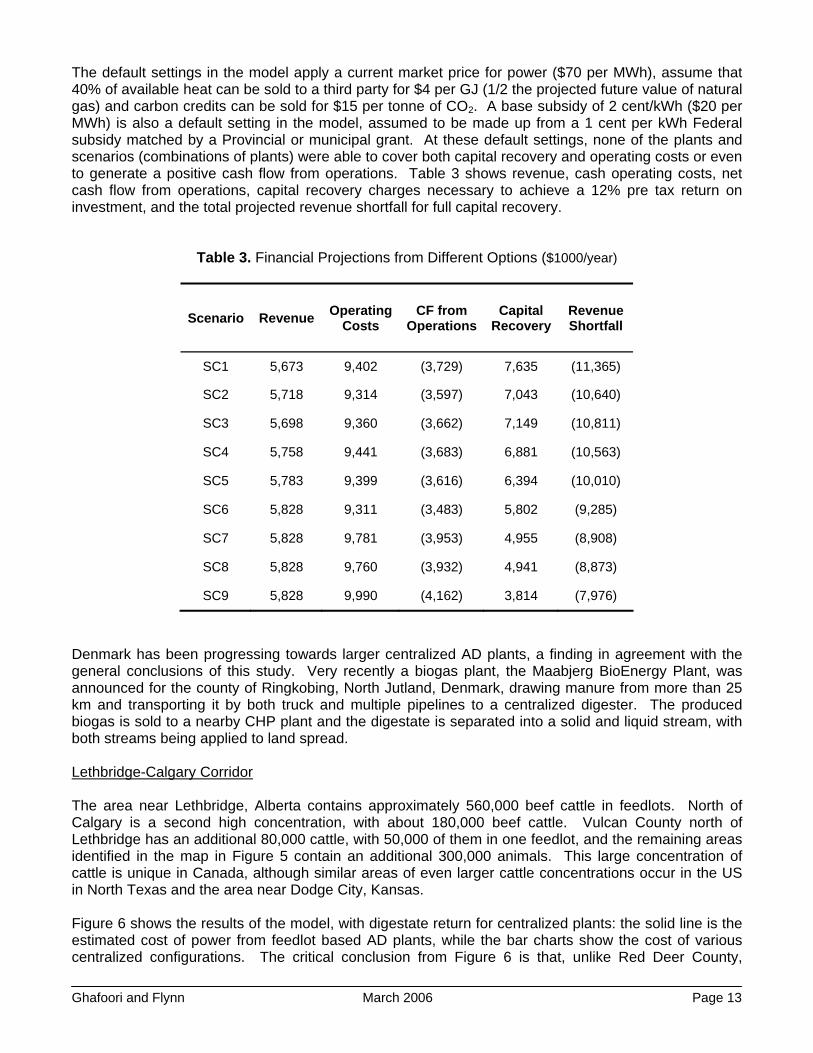
The default settings in the model apply a current market price for power ($70 per MWh), assume that 40% of available heat can be sold to a third party for $4 per GJ (1/2 the projected future value of natural gas) and carbon credits can be sold for $15 per tonne of CO2. A base subsidy of 2 cent/kWh ($20 per MWh) is also a default setting in the model, assumed to be made up from a 1 cent per kWh Federal subsidy matched by a Provincial or municipal grant. At these default settings, none of the plants and scenarios (combinations of plants) were able to cover both capital recovery and operating costs or even to generate a positive cash flow from operations. Table 3 shows revenue, cash operating costs, net cash flow from operations, capital recovery charges necessary to achieve a 12% pre tax return on investment, and the total projected revenue shortfall for full capital recovery.
Table 3. Financial Projections from Different Options ($1000/year)
Scenario Revenue Operating Costs
CF from Operations
Capital Recovery
Revenue Shortfall
SC1 5,673 9,402 (3,729) 7,635 (11,365)
SC2 5,718 9,314 (3,597) 7,043 (10,640)
SC3 5,698 9,360 (3,662) 7,149 (10,811)
SC4 5,758 9,441 (3,683) 6,881 (10,563)
SC5 5,783 9,399 (3,616) 6,394 (10,010)
SC6 5,828 9,311 (3,483) 5,802 (9,285)
SC7 5,828 9,781 (3,953) 4,955 (8,908)
SC8 5,828 9,760 (3,932) 4,941 (8,873)
SC9 5,828 9,990 (4,162) 3,814 (7,976)
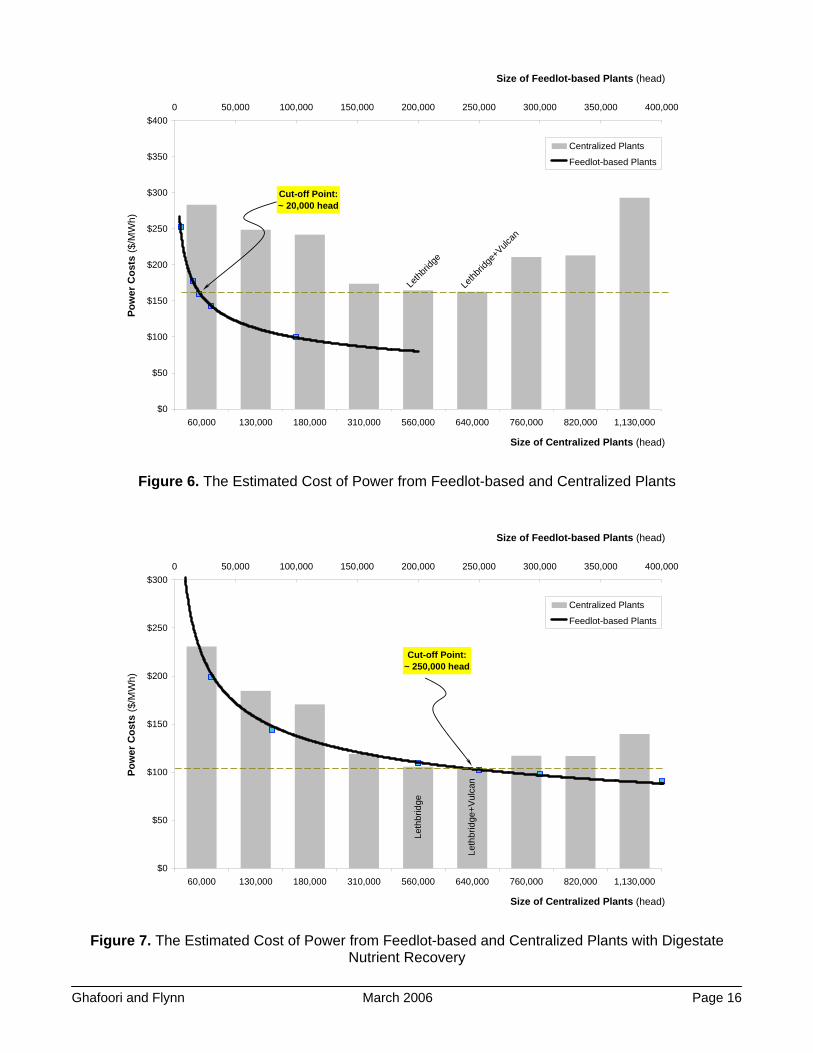
Denmark has been progressing towards larger centralized AD plants, a finding in agreement with the general conclusions of this study. Very recently a biogas plant, the Maabjerg BioEnergy Plant, was announced for the county of Ringkobing, North Jutland, Denmark, drawing manure from more than 25 km and transporting it by both truck and multiple pipelines to a centralized digester. The produced biogas is sold to a nearby CHP plant and the digestate is separated into a solid and liquid stream, with both streams being applied to land spread. Lethbridge-Calgary Corridor The area near Lethbridge, Alberta contains approximately 560,000 beef cattle in feedlots. North of Calgary is a second high concentration, with about 180,000 beef cattle. Vulcan County north of Lethbridge has an additional 80,000 cattle, with 50,000 of them in one feedlot, and the remaining areas identified in the map in Figure 5 contain an additional 300,000 animals. This large concentration of cattle is unique in Canada, although similar areas of even larger cattle concentrations occur in the US in North Texas and the area near Dodge City, Kansas. Figure 6 shows the results of the model, with digestate return for centralized plants: the solid line is the estimated cost of power from feedlot based AD plants, while the bar charts show the cost of various centralized configurations. The critical conclusion from Figure 6 is that, unlike Red Deer County,

Ghafoori and Flynn March 2006 Page 14
individual feedlot-based units are likely more economic than a centralized plant. In the absence of digestate processing, a feedlot with more than about 25,000 head of cattle can process its own manure more economically than a centralized digester.
As noted above, the capital and operating costs of digestate processing are not known because no process has been commercially applied past simple separation of solids and
Sensitivity Studies A major benefit from developing a model for manure digestion is that it allows the analysis of “what if” questions. For example, what if biogas yields were 10% higher - what is the impact on the cost of power? What if the cost of the manure digester plant is 30% less than the default value in the study? What if trucking costs increase by 50% because the cost of fuel goes up? The default values in the model of Red Deer County show that a single centralized digester could produce electrical power for $262 per MWh (26 cents per kWh). The four figures below show the impact on power cost for the following cases:
• Yield of biogas over the range of 35-105 m3 per m3 of manure (at 12% solids level). • Concentration of methane in the biogas of 57% to 71%. • The solids in the digestate are separated and sold for $0 to $70 per tonne. • The plant receives a carbon credit, calculated based on an Alberta generation mix of 66%
coal, 30% natural gas, and 4% from other sources, of $0 to $15 per tonne.
$0
$50
$100
$150
$200
$250
$300
35 45 55 65 75 85 95 105
Biogas Yield (m3/m3 of input at 12% TS)
Pow
er C
ost (
$/M
Wh)
$254
$256
$258
$260
$262
$264
$266
57% 59% 61% 63% 65% 67% 69% 71%
Methane Content (% of biogas)
Pow
er C
ost (
$/M
Wh)
$100
$130
$160
$190
$220
$250
$0 $10 $20 $30 $40 $50 $60 $70
Filtered Solid Digestate Value ($/dry tonne)
Pow
er C
ost (
$/M
Wh)
$240
$245
$250
$255
$260
$265
$0 $2 $4 $6 $8 $12 $14 $15
Carbon Credits Value ($/tonne)
Pow
er C
ost (
$/M
Wh)

Ghafoori and Flynn March 2006 Page 15
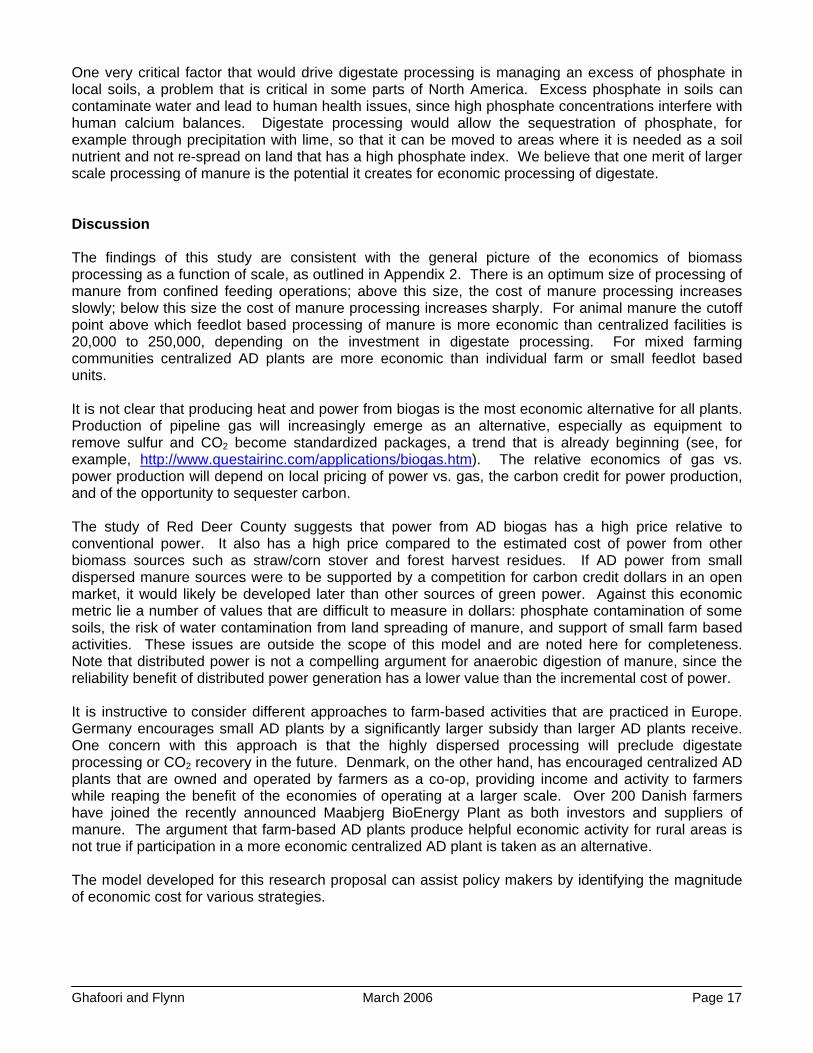
a liquid fraction. However, we have approximately modeled digestate processing by assuming that the capital cost would be 2/3 of the cost of the AD plant excluding power generation. We further assume that the products of digestate processing are solid or highly concentrated liquid ammonia fertilizers with a negligible cost of transport relative to digestate, and dischargeable water. (Note that if the basis of digestate processing is reverse osmosis a concentrated stream of potassium rich water would still require land spreading or mixing in irrigation water; this stream would be low in volume compared to the full digestate stream.) Increases in operating cost are not considered in this approximate model. Figure 7 shows the impact of these assumptions for digestate processing. Since digestate processing increases the capital cost and decreases the transportation cost, we would expect the optimum size of processing to increase. This effect is observed in Figure 7. However, most of this effect is coming from the enormous reduction in cost from not returning digestate back to the source feedlot for land spreading.
1. Rocky View County 180,000 head
2. Foothills County 130,000 head
3. Vulcan County 80,000 head
4. Lethbridge County 560,000 head
5. Taber County 60,000 head
6. Newell County 120,000 head
Figure 5. Counties in the Lethbridge-Calgary Corridor Included in the Model
As noted above, Figure 7 does not include any impact of sale of fertilizer byproducts. It should also be recognized that if digestate is not returned to the source that a payment for manure may be required to compensate for net loss of the fertilizer value of the manure/digestate. Current market data is inadequate to factor these elements into an economic model. The implications of Figure 7 are very significant for considering AD plants in very concentrated areas of confined feeding operations. If land spreading is the basis for ultimate disposal of digestate, feedlots greater than 20,000 head can economically “go it alone”. However, if the target is digestate processing then centralized processing of manure makes more economic sense up to 250,000 animal feedlots. We are not aware of a feedlot in North America with more than 150,000 animals, so in essence the implication of Figure 7 is that for all confined feeding operations centralized plants make sense if digestate processing is included in the scope.
Ghafoori and Flynn March 2006 Page 16
Lethb
ridge
+Vulcan
Lethb
ridge
Cut-off Point: ~ 20,000 head
$0
$50
$100
$150
$200
$250
$300
$350
$400
60,000 130,000 180,000 310,000 560,000 640,000 760,000 820,000 1,130,000
Size of Centralized Plants (head)
Pow
er C
osts
($/M
Wh)
0 50,000 100,000 150,000 200,000 250,000 300,000 350,000 400,000
Size of Feedlot-based Plants (head)
Centralized Plants
Feedlot-based Plants
Figure 6. The Estimated Cost of Power from Feedlot-based and Centralized Plants
Cut-off Point: ~ 250,000 head
Leth
brid
ge
Leth
brid
ge+V
ulca
n
$0
$50
$100
$150
$200
$250
$300
60,000 130,000 180,000 310,000 560,000 640,000 760,000 820,000 1,130,000
Size of Centralized Plants (head)
Pow
er C
osts
($/M
Wh)
0 50,000 100,000 150,000 200,000 250,000 300,000 350,000 400,000
Size of Feedlot-based Plants (head)
Centralized Plants
Feedlot-based Plants
Figure 7. The Estimated Cost of Power from Feedlot-based and Centralized Plants with Digestate Nutrient Recovery
Ghafoori and Flynn March 2006 Page 17
One very critical factor that would drive digestate processing is managing an excess of phosphate in local soils, a problem that is critical in some parts of North America. Excess phosphate in soils can contaminate water and lead to human health issues, since high phosphate concentrations interfere with human calcium balances. Digestate processing would allow the sequestration of phosphate, for example through precipitation with lime, so that it can be moved to areas where it is needed as a soil nutrient and not re-spread on land that has a high phosphate index. We believe that one merit of larger scale processing of manure is the potential it creates for economic processing of digestate. Discussion The findings of this study are consistent with the general picture of the economics of biomass processing as a function of scale, as outlined in Appendix 2. There is an optimum size of processing of manure from confined feeding operations; above this size, the cost of manure processing increases slowly; below this size the cost of manure processing increases sharply. For animal manure the cutoff point above which feedlot based processing of manure is more economic than centralized facilities is 20,000 to 250,000, depending on the investment in digestate processing. For mixed farming communities centralized AD plants are more economic than individual farm or small feedlot based units. It is not clear that producing heat and power from biogas is the most economic alternative for all plants. Production of pipeline gas will increasingly emerge as an alternative, especially as equipment to remove sulfur and CO2 become standardized packages, a trend that is already beginning (see, for example, http://www.questairinc.com/applications/biogas.htm). The relative economics of gas vs. power production will depend on local pricing of power vs. gas, the carbon credit for power production, and of the opportunity to sequester carbon. The study of Red Deer County suggests that power from AD biogas has a high price relative to conventional power. It also has a high price compared to the estimated cost of power from other biomass sources such as straw/corn stover and forest harvest residues. If AD power from small dispersed manure sources were to be supported by a competition for carbon credit dollars in an open market, it would likely be developed later than other sources of green power. Against this economic metric lie a number of values that are difficult to measure in dollars: phosphate contamination of some soils, the risk of water contamination from land spreading of manure, and support of small farm based activities. These issues are outside the scope of this model and are noted here for completeness. Note that distributed power is not a compelling argument for anaerobic digestion of manure, since the reliability benefit of distributed power generation has a lower value than the incremental cost of power. It is instructive to consider different approaches to farm-based activities that are practiced in Europe. Germany encourages small AD plants by a significantly larger subsidy than larger AD plants receive. One concern with this approach is that the highly dispersed processing will preclude digestate processing or CO2 recovery in the future. Denmark, on the other hand, has encouraged centralized AD plants that are owned and operated by farmers as a co-op, providing income and activity to farmers while reaping the benefit of the economies of operating at a larger scale. Over 200 Danish farmers have joined the recently announced Maabjerg BioEnergy Plant as both investors and suppliers of manure. The argument that farm-based AD plants produce helpful economic activity for rural areas is not true if participation in a more economic centralized AD plant is taken as an alternative. The model developed for this research proposal can assist policy makers by identifying the magnitude of economic cost for various strategies.

Ghafoori and Flynn March 2006 Page 18
Appendix 1: User’s Manual & Scope of the Model
Section I: User’s Manual
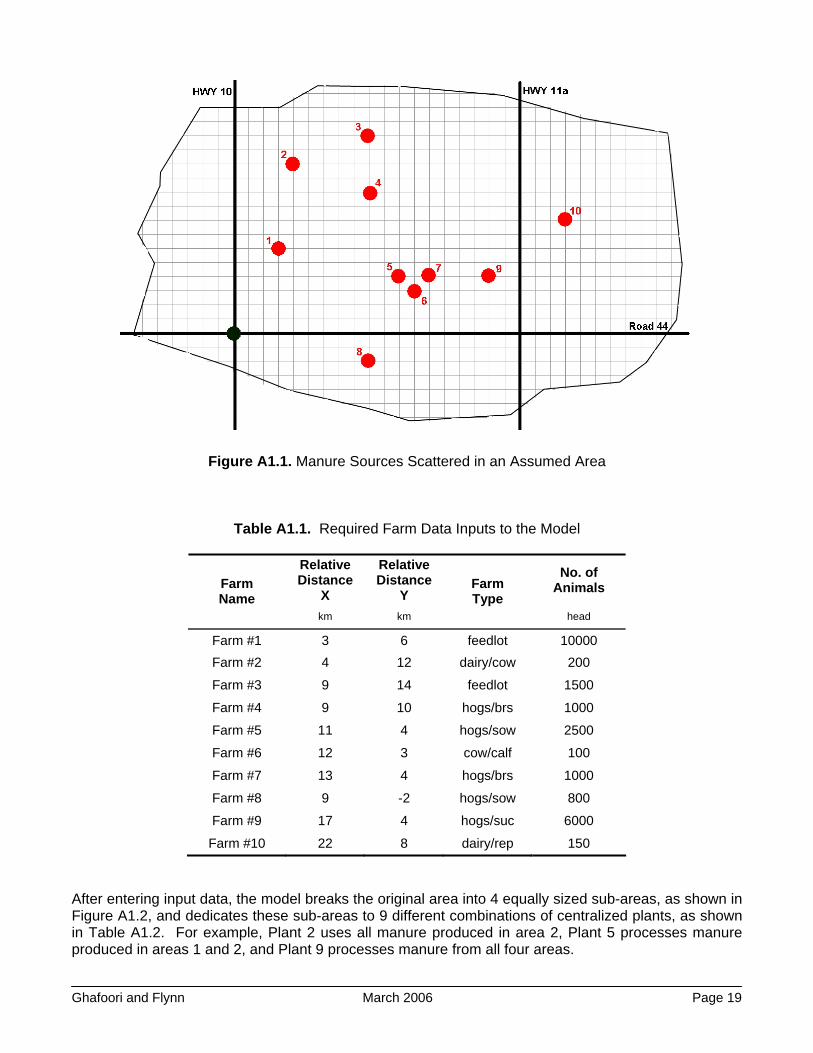
Model Overview: Centralized and Farm-Based The generalized economic models are developed to calculate the cost of producing power at anaerobic digestion (AD) plants utilizing animal manure. The purpose of the models is to help identify whether multiple distributed digesters or fewer centralized digesters are more economic, i.e. to identify whether it is more economic to transport manure to a large capital efficient unit or reduce transportation costs by shipping to smaller units or by processing on farm. The technology is assumed to be thermophilic anaerobic digestion followed by minor gas cleanup (moisture control) and combustion of the gas in an internal combustion engine electrical generation module. Cost of transporting manure from farms to a centralized anaerobic digestion (AD) plant and the digestate from the AD plant back to the farms are integrated with the cost of processing manure and producing power at the AD plant. The detailed scope of the model can be found in the second part of this document. The models are based on Microsoft Excel® software and consist of multiple spreadsheets put together in order of calculation. The user first enters required data on the location plus the type of farming practice and the number of animals for each source. After this, the model calculates the cost of producing power at 9 different centralized plant settings plus the cost of producing power, if each of those manure sources had its own small scale plant. Assumptions used in each of the options are discussed in detail below: Centralized Biogas Plants To better explain the way the general centralized model works, consider the following example: Suppose 10 different manure sources are located in an area crossed by the “Road 44”, “Highway 10” and “Highway 11a”. Figure A1.1 shows the location of these sources in the area. To enter the locations of these sources into the model, you need to assume an arbitrary base point and calculate the relative grid distances of each of these sources from that base point. This location of the base point has no impact on the final results of the model. For the purpose of this example, we choose the intersection of “Road 40” and “HWY 10”, identified with a black circle. Note that location and distance inputs to this model have to be based on grid measurements (in km) and not direct distances. In areas that have rectangular road layouts, grid measurements are an accurate measure of transportation distance. Where many or most roads run at an angle the model may overstate transportation distances. However, the impact is minor, particularly since for most centralized digesters the distance fixed cost of transportation, i.e. loading and unloading, far exceeds the distance variable cost of transportation, i.e. time on the road. Table A1.1 contains the input farm data plus the relative distance of each of the sources from the base point (we assume each grid is 1x1 km). Note that by choosing this base point, the relative distance of Farm #8 on the Y-axis is negative.
Ghafoori and Flynn March 2006 Page 19
Figure A1.1. Manure Sources Scattered in an Assumed Area
Table A1.1. Required Farm Data Inputs to the Model
Relative Distance
X
Relative Distance
Y No. of
Animals Farm Name
km km
Farm Type
head
Farm #1 3 6 feedlot 10000 Farm #2 4 12 dairy/cow 200
Farm #3 9 14 feedlot 1500
Farm #4 9 10 hogs/brs 1000
Farm #5 11 4 hogs/sow 2500
Farm #6 12 3 cow/calf 100
Farm #7 13 4 hogs/brs 1000
Farm #8 9 -2 hogs/sow 800
Farm #9 17 4 hogs/suc 6000
Farm #10 22 8 dairy/rep 150
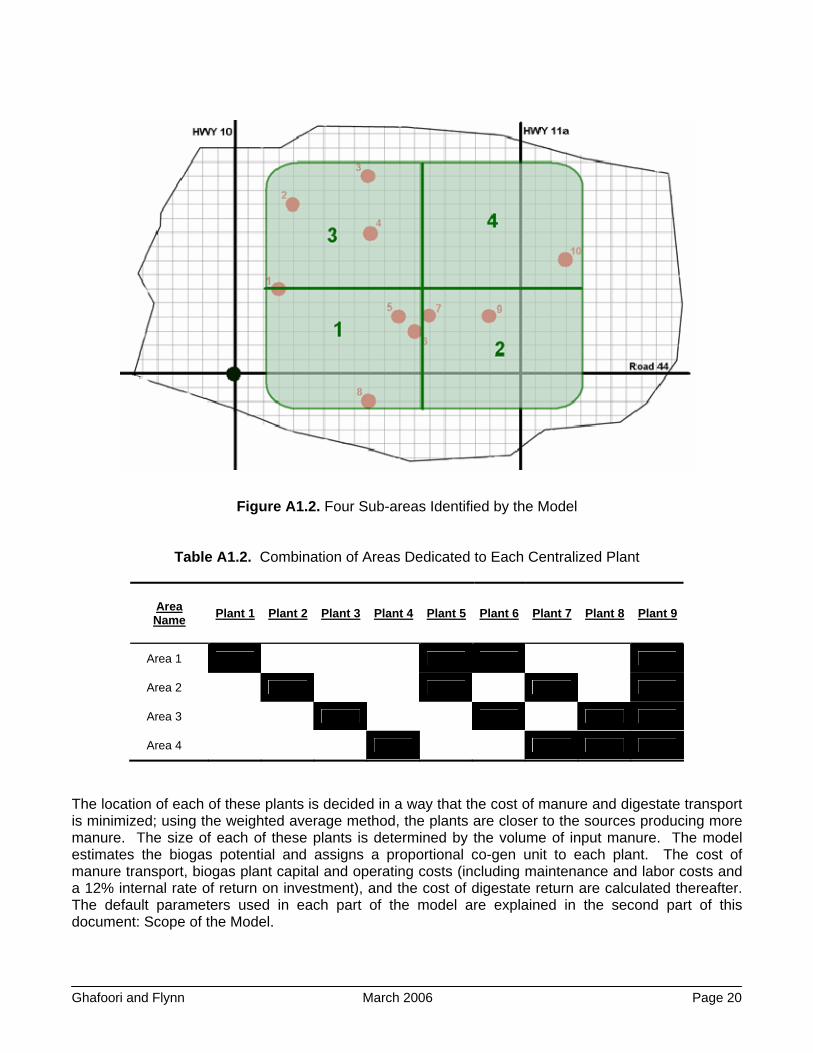
After entering input data, the model breaks the original area into 4 equally sized sub-areas, as shown in Figure A1.2, and dedicates these sub-areas to 9 different combinations of centralized plants, as shown in Table A1.2. For example, Plant 2 uses all manure produced in area 2, Plant 5 processes manure produced in areas 1 and 2, and Plant 9 processes manure from all four areas.
Ghafoori and Flynn March 2006 Page 20
Figure A1.2. Four Sub-areas Identified by the Model
Table A1.2. Combination of Areas Dedicated to Each Centralized Plant
Area Name Plant 1 Plant 2 Plant 3 Plant 4 Plant 5 Plant 6 Plant 7 Plant 8 Plant 9
Area 1
Area 2
Area 3
Area 4
The location of each of these plants is decided in a way that the cost of manure and digestate transport is minimized; using the weighted average method, the plants are closer to the sources producing more manure. The size of each of these plants is determined by the volume of input manure. The model estimates the biogas potential and assigns a proportional co-gen unit to each plant. The cost of manure transport, biogas plant capital and operating costs (including maintenance and labor costs and a 12% internal rate of return on investment), and the cost of digestate return are calculated thereafter. The default parameters used in each part of the model are explained in the second part of this document: Scope of the Model.

Ghafoori and Flynn March 2006 Page 21
The model then combines plants into scenarios, where every scenario processes all of the manure identified within the area. Thus, one scenario will be four separate plants, and one scenario would be a single plant serving all manure sources in the area. The Table A1.3 shows the configuration of the various scenarios. Weighted average power cost is calculated for each scenario.
Table A1.3. Scenario Definition Within the Generalized Centralized Model
Scenario # of Plants Configuration*
1 4 1, 2, 3, 4 2 3 1+2, 3, 4
3 3 1+3, 2, 4
4 3 2+4, 1, 3
5 3 3+4, 1, 2
6 2 1+2, 3+4
7 2 1+3, 2+4
* Configuration numbers refer to the areas identified in Figure A1.2
Farm-based (or Feedlot-based) Plants The parameters used for the farm-based plants are similar to those used for centralized plants with 2 exceptions:
- Unlike the centralized plants that incur double transportation (manure from farm to plant and digestate return to farm), there is no additional transport in farm-based plants since the biogas plants are located either within or beside the farms.
- Due to smaller size of the farm-base plants compared to the centralized ones, it can be assumed
that the farmers are capable of operating their plants (some technical training maybe required). This will eliminate the cost of dedicated professional operating labor from overall cost of running the plants. Caution should be taken while applying this assumption to the large farm-based plants (e.g., 500 kW and over) as running these plants maybe complicated enough and sufficiently time consuming to require hiring professional operators.
The model calculates the cost of producing power in small scale farm-based plants considering the assumptions made above and compares that with the cost of producing power in the centralized plant among the 9 plants discussed above that produces the cheapest power. Centralized Model Structure A complete list of worksheets in the centralized model is included below with a short description for each worksheet: “START HERE - Enter Farm Data”
Used for complete farm data input to the model. Very similar to Table A1.1 mentioned above in this document. This is the only place users enter manure source data. If one farm has more

Ghafoori and Flynn March 2006 Page 22
than one animal type, the data is entered on successive lines, with the same location parameters.
“1. Model Parameters”
Contains a complete list of parameters used within the model. All other worksheets are linked to this sheet, hence, users can change any of these parameters based on their own judgment and the change will be applied automatically throughout the model. A complete list of these parameters is included at the end of this appendix.
“2. Biomass Sources”
Used by the model to calculate amount of manure produced from each source and also each source is assigned to an appropriate area. Some other calculations are also done for further use throughout the model.
“3. Plant Combinations”
An illustration to show the users how the sources are assigned to areas and how the plants are dedicated to different combinations of areas. Similar to Figure 2 and Table 2 discussed above.
“4. Summary of Plants” This sheet contains a summary of all information about the capacity and location of each plant plus the annual manure and digestate transport costs for each plant option.
“5. Biogas Potential”
Biogas yield and the gross and net power potential for each plant are calculated in this sheet. “6. Manure Transport Costs”
The unit cost of transporting manure from sources/areas to each plant is calculated here. “7. Manure Processing Costs”
Calculates the capital cost of building the biogas plants plus the annual maintenance and operating labor costs to run the plants.
“8. Digestate Return Costs”
The unit cost of returning digestate to each source is calculated here. “9. Total Power Costs”
Contains a summary of the overall power costs at each plant. Also 8 different scenarios are developed to process all manure produced in the area in different combinations of plants.
“Chart-PowerCosts if Centralized”
A graphic illustration of the overall costs at each plant. The minimum power cost is also identified here.
“Chart-WeightedAveragePowerCosts” The weighted average cost of producing power for the entire area is included in this chart. “10. Revenue Analysis”
Four different revenue streams are identified in the model. In this sheet the annual sales revenue for each plant is calculated.
“11. Cost-Revenue Analysis”
The annual costs with or without capital recovery are compared against the annual revenues.
Ghafoori and Flynn March 2006 Page 23
“Chart-RevenueVsCost” A graphic illustration of the overall costs against the annual sales revenues for different scenarios.
“12. Farm-based Plants”
Assuming each manure source is supposed to have its own plant, the overall cost of producing power at each of these individual farm-based plants are calculated here. To facilitate further comparisons, farm-based plants are divided into groups with 100 kW incremental capacities. The weighted average power costs for each group are calculated and used thereafter.
“Chart-Centralized or Farm-based”
A graphic illustration of the overall costs of producing power in farm-based plants compared to the minimum cost scenario in centralized plants.
Farm-based Model Structure The structure of the farm-based model is identical to the centralized model with the exception that some unnecessary worksheets are removed. This model includes the following worksheets, with the description as above for the centralized model. “START HERE - Enter Farm Data”
“1. Model Parameters”
“2. Biogas Potential”
“3. Manure Transport Costs”
“4. Manure Processing Costs”
“5. Revenue Analysis”
“6. Cost-Revenue Analysis”
“Chart-RevenueVsCost”

Ghafoori and Flynn March 2006 Page 24
Section II: Scope of the Model General Assumptions
- The process utilized for feedstock processing is anaerobic digestion (AD) with subsequent biogas utilization in a cogeneration unit to produce both heat and electricity.
- The plants are located in the weighted average center of the areas based on the sources feeding
the plant. Hence, the plant is closer to those sources producing higher amount of feedstock, and the location of the plant minimizes total transportation cost.
- All cost components are converted to cost per net MWh of power output.
Feedstock
- The current feedstock sources in the model are livestock manure (hog, dairy, beef, etc.). Other biomass sources (organic wastes, slaughter house waste, etc.) are not included in the model due to insufficient information about the amount and type (e.g. moisture level) produced in each one. The model is fully capable of adding these sources in the future if information becomes available.
- Manure from dairy and hog operations is assumed to be delivered as liquid in tank trucks. Manure
from these sources is shipped at the same moisture content that it is produced from livestock.
- Manure from feedlot operations is assumed to be delivered as solid in open trucks. Manure as produced in the feedlot has a moisture level of 88%; however, the manure moisture level reduces while sitting in the pen. The moisture level of shipped feedlot manure is a variable in the model; the default value is 75%.
- The cost of transporting liquid and solid manure is estimated based on specific cost data for liquid
and bulk transport. The transportation cost is broken down into two components. The first is a distance fixed cost (DFC, charges independent of the haul distance), which primarily arise from loading and unloading. The second is a distance variable cost (DVC, charges proportional to haul distance). Both DFC and DVC for solid and liquid transport are variable in the model. Default values for DFC and DVC are estimated for solid manure hauling from figures from the Custom Rates Survey, published by the Alberta Agriculture. Default values for DFC and DVC for liquid transport have been based on per hour charges for a 20 and 40 tonne truck provided from the trucking industry. In each case, the default value of DVC is 11 cents per tonne km. The default value of DFC is $6 per tonne for dry manure and $4.20 per tonne for liquid manure.
- The density of manure is assumed to be the same for all types of manure; 1000 kg/m3 is used in
this model based on standards published by the American Society of Agricultural and Biological Engineers (ASABE). Manure density is a model variable.
- Incoming materials to each plant are mixed and water is added as needed to achieve a moisture
level of 88% in the processing plant.
- Materials receiving and digestate shipping take place 360 days per year.
- The plant is responsible to transport the feedstock to the plant and also to return the digestate back to the sources, i.e. the costs for transportation each way is included in the model. Each source will receive a proportional return of digestate based on the dry solids shipped to the plant. Each source of liquid manure is assumed to have underground storage of more than 40 cubic meters for raw

Ghafoori and Flynn March 2006 Page 25
manure, to allow year round pick up. All manure sources are assumed to have constructed lagoon capacity equivalent to 10 months of storage capacity for digestate, reflecting the short time window in which digestate is spread on fields. The model assumes that each source of manure is also responsible for spreading the digestate on fields, i.e. no cost for land spreading is included in the model.
- Digestate processing to recover nutrients or a semi-dry solids stream is not included in the base
model since technologies have not been demonstrated at a commercial scale. Solids removal would still require land spreading of the liquid only digestate due to its high nutrient content.
Biogas Plant
- The plant includes all necessary equipment for receiving feedstock, feedstock processing, biogas generation, power generation and digestate buffer storage and loading.
- The plants provide both solid and liquid storage capability for incoming materials.
- The model assumes an annual shutdown of 12 days and unscheduled downtime of 13 days per
year (340 days of operation). Hence, the combined availability of the plant, considering both scheduled and unscheduled downtime, is 93.2%. Plant availability is a model variable.
- All proposed plants have a typical design similar to existing Danish centralized AD plants and the
IMUS biogas plant, developed by the Alberta Research Council and the Highmark Renewables Inc. in Vegreville, AB.
- Input total solids to the digesters is 12%, default values in the model are volatile solids content of
85% of the total solids, and 45% of the added volatile solids are biodegraded/destroyed. The process produces 0.48 m3 of methane gas per kg of destroyed volatile solids. Hence, volume shrinkage due to gas production is 5%, i.e. digestate output volume is 95% of the incoming plant volume.
- The produced biogas is assumed to contain 63% methane, 33% carbon dioxide and 4% trance gas;
the biogas LHV is 20.7 MJ/m3.
- The cogeneration unit electrical and thermal efficiency is based on the size of the unit, ranging from 37-43% (electrical) and 44-49% (thermal).
- The plant parasitic power consumption is 20%; the net power output is 80% of the gross power
production.
- The default cost estimate for an installed biogas plant is based on the actual cost of Danish centralized biogas plants adjusted for inflation. A cost factor is a model parameter to scale estimated cost in proportion to actual Danish plant cost. The default value of the cost factor is 80% based on IMUS estimates of the cost of future plants in Canada.
- Based on the published literature and also the cost of actual plants built, there is a strong economy
of scale in building a biogas plant: doubling the size of the plant would not double the costs. A scale factor of 0.60 is used for the purpose of scaling up/down the size of the plants.
- The operating staff working hours are 12 hours a day on a 7 day week basis and the flat rate of 35
$/hr is paid including the salary and benefits.
Ghafoori and Flynn March 2006 Page 26
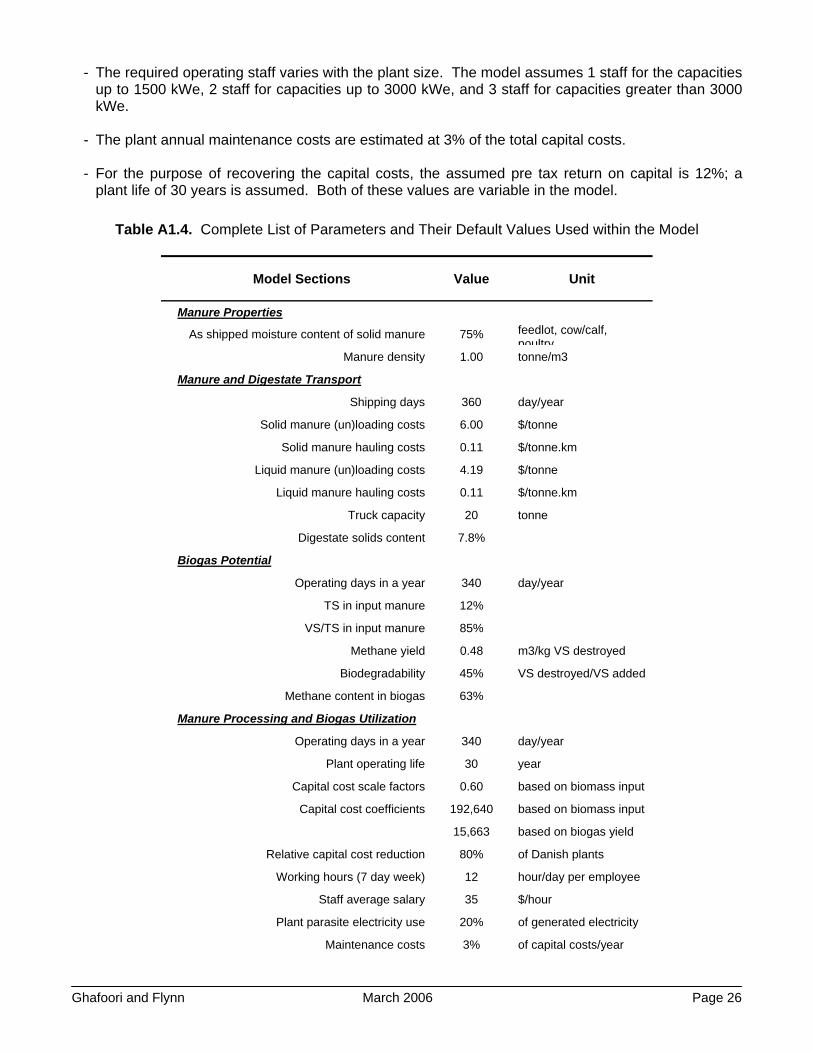
- The required operating staff varies with the plant size. The model assumes 1 staff for the capacities up to 1500 kWe, 2 staff for capacities up to 3000 kWe, and 3 staff for capacities greater than 3000 kWe.
- The plant annual maintenance costs are estimated at 3% of the total capital costs.
- For the purpose of recovering the capital costs, the assumed pre tax return on capital is 12%; a
plant life of 30 years is assumed. Both of these values are variable in the model.
Table A1.4. Complete List of Parameters and Their Default Values Used within the Model
Model Sections Value Unit
Manure Properties
As shipped moisture content of solid manure 75% feedlot, cow/calf, poultry
Manure density 1.00 tonne/m3
Manure and Digestate Transport
Shipping days 360 day/year
Solid manure (un)loading costs 6.00 $/tonne
Solid manure hauling costs 0.11 $/tonne.km
Liquid manure (un)loading costs 4.19 $/tonne
Liquid manure hauling costs 0.11 $/tonne.km
Truck capacity 20 tonne
Digestate solids content 7.8%
Biogas Potential
Operating days in a year 340 day/year
TS in input manure 12%
VS/TS in input manure 85%
Methane yield 0.48 m3/kg VS destroyed
Biodegradability 45% VS destroyed/VS added
Methane content in biogas 63%
Manure Processing and Biogas Utilization
Operating days in a year 340 day/year
Plant operating life 30 year
Capital cost scale factors 0.60 based on biomass input
Capital cost coefficients 192,640 based on biomass input
15,663 based on biogas yield
Relative capital cost reduction 80% of Danish plants
Working hours (7 day week) 12 hour/day per employee
Staff average salary 35 $/hour
Plant parasite electricity use 20% of generated electricity
Maintenance costs 3% of capital costs/year

Ghafoori and Flynn March 2006 Page 27
Discount rate 12%
Plant electrical efficiency 55%
Plant thermal efficiency 60%
Revenue Items
Power sales 70 $/Mwhe net
Fraction of available heat sold 40%
Heat sales 7 $/GJth gross
CO2.eq emission savings 0.880 tonne/Mwhe net
Carbon credits 15 $/tonne CO2.eq
Subsidies 20 $/Mwhe net
Plant Operating Labor
for capacities (in kW) over assumed operating labor requirements
0 1 person
300 1 person
1,500 2 person
3,000 3 person
5,000 3 person
Co-Gen Unit Electrical Efficiency
for capacities (input biogas in m3/day) over assumed electrical efficiency
0 37.2%
4,000 37.6%
6,000 38.0%
7,000 38.2%
9,000 39.0%
11,500 40.2%
15,000 42.9%
17,500 42.7%
23,000 42.4%
Co-Gen Unit Thermal Efficiency
for capacities (input biogas in m3/day) over assumed thermal efficiency
0 45.4%
4,000 49.2%
6,000 49.0%
7,000 49.0%
9,000 48.7%
11,500 45.9%
15,000 43.6%
17,500 43.8%
23,000 43.7%

Ghafoori and Flynn March 2006 Page 28
Appendix 2: Impact of Scale on Cost of Processing Manure Scale issues are critical in all biomass processing from field sourced (as opposed to mill waste) biomass. Implementing biomass usage at an appropriate scale is a critical need for project developers and for public policy, which will support carbon neutral energy programs. Biomass utilization based on field sourced material has an optimum size, which arises from competition between two of the three major cost elements in the overall cost of processing biomass. Three cost elements are:
- The harvesting cost of biomass, e.g. the cost of acquiring the material and bringing the material from the field to the edge of a road. These costs are typically independent of scale. For example, acquiring straw from farmers involves a cost that does not vary with plant size, since each farmer sells the straw, at roadside, for a price that reflects the market value of straw and presumably covers the cost of the capital and labor to bale the straw and move it to roadside, and the cost to replace the nutrients. In the case of animal manures, the harvesting cost would include the cost of scooping the manure out of the pens and onto its first mode of transportation, a truck, and whatever purchase cost, if any, was associated with the manure. In this study we assume that the manure is provided to the AD project at no net nutrient cost, since the digestate is returned to the farmer. The cost of the truck while loading manure and unloading digestate is charged to the AD project; the cost of any equipment or facility used by the farmer or feedlot, e.g. a digestate receiving pit, loaders or pumps, is not.
- The transportation cost of biomass, i.e. the total cost of moving the material from the field to the
processing plant. These costs have a strong dependency on scale because larger plant sizes require biomass to be moved over longer distances. For a large contiguous source of field biomass such as straw in a large grain growing area, forest harvest residues in a large forested area, or manure in an area where there are many feedlots, the scale dependency of transportation costs is typically a square root relationship: average driving distance increases with the square root of plant size, and transportation costs are linearly dependent on distance.
In this study the distance fixed cost of transportation, i.e. the cost of loading and unloading of manure, is large compared to the distance variable cost of moving the manure over a road. Note that for a feedlot-based unit the fixed cost of loading manure is included in the cost of power, since the feedlot will double handle the material (i.e. load manure and then later load digestate), whereas it will often only single handle manure if land spreading. This charge is not applied to farm-based units that would be processing liquid manure streams; the cost of double pumping (first manure and then digestate) is treated as insignificant.
- The processing cost of biomass, i.e. the cost of turning the biomass into power, ethanol, heat, or
some other useful end product. Biomass processing is typically capital intensive and shows the same economies of scale as other processing plants, such as coal or gas fired power plants or chemical processing plants. Typically scale factors for processing plants are in the range of 0.6 to 0.8, where scale factor relates the unit cost of capital from one size to another, i.e.
Costsize2 = Costsize1 x (Size2 / Size1)scale factor
Ghafoori and Flynn March 2006 Page 29
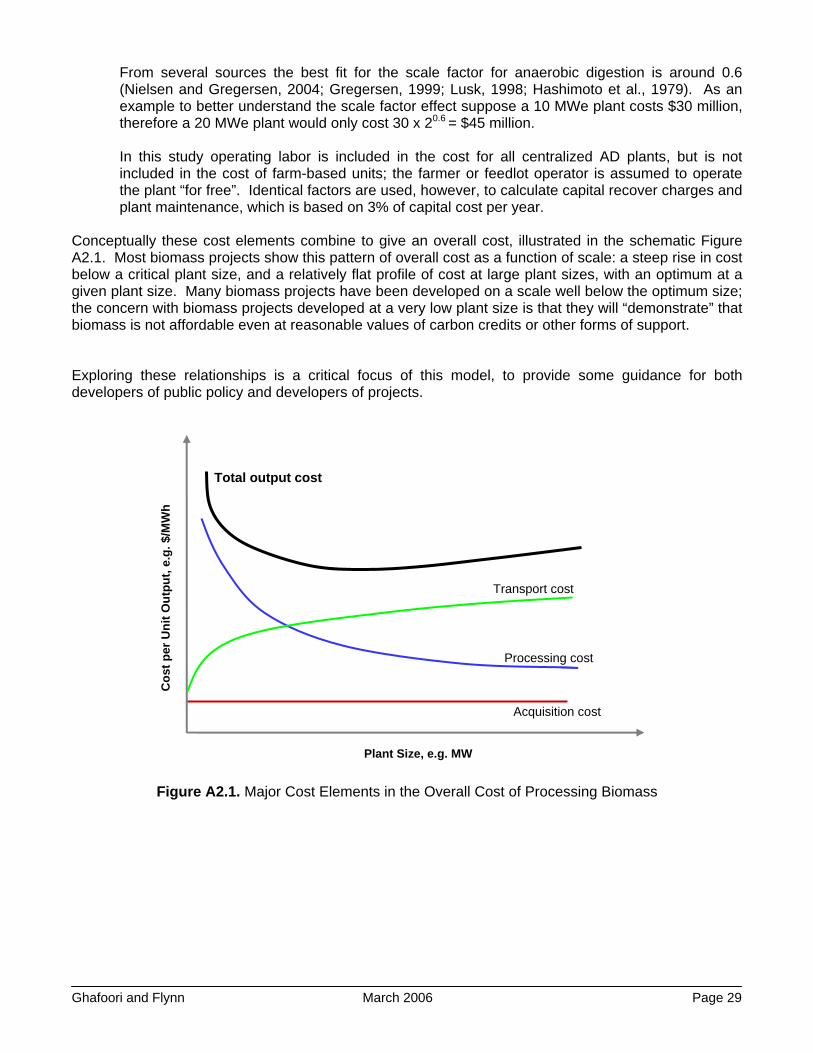
From several sources the best fit for the scale factor for anaerobic digestion is around 0.6 (Nielsen and Gregersen, 2004; Gregersen, 1999; Lusk, 1998; Hashimoto et al., 1979). As an example to better understand the scale factor effect suppose a 10 MWe plant costs $30 million, therefore a 20 MWe plant would only cost 30 x 20.6 = $45 million. In this study operating labor is included in the cost for all centralized AD plants, but is not included in the cost of farm-based units; the farmer or feedlot operator is assumed to operate the plant “for free”. Identical factors are used, however, to calculate capital recover charges and plant maintenance, which is based on 3% of capital cost per year.
Conceptually these cost elements combine to give an overall cost, illustrated in the schematic Figure A2.1. Most biomass projects show this pattern of overall cost as a function of scale: a steep rise in cost below a critical plant size, and a relatively flat profile of cost at large plant sizes, with an optimum at a given plant size. Many biomass projects have been developed on a scale well below the optimum size; the concern with biomass projects developed at a very low plant size is that they will “demonstrate” that biomass is not affordable even at reasonable values of carbon credits or other forms of support. Exploring these relationships is a critical focus of this model, to provide some guidance for both developers of public policy and developers of projects.
Acquisition cost
Transport cost
Processing cost
Total output cost
Plant Size, e.g. MW
Cos
t per
Uni
t Out
put,
e.g.
$/M
Wh
Figure A2.1. Major Cost Elements in the Overall Cost of Processing Biomass

Ghafoori and Flynn March 2006 Page 30
References AgSTAR, 2003. United States Office of Air and Radiation Environmental Protection. http://www.epa.gov/agstar/ Al Saedi, T. 2000. Danish centralized biogas plants - Plant descriptions. Bioenergy Department, University of Southern Denmark. Canfax website. 2005. Alberta and Saskatchewan Feedlot Capacity by Region http://www.canfax.ca/default.htm Environmental Powers Inc. website, 2006. News Release http://www.environmentalpower.com Gregersen KH, 1999. Centralized Biogas Plants -Integrated Energy Production, Waste Treatment and Nutrient Redistribution Facilities, Danish Institute of Agricultural and Fisheries Economics. Harrison, Graham. 2005. GE Jenbacher Corporation. Personal Communication. Hashimoto AG, Chen YR, Prior RL, 1979. Methane and protein production from animal feedlot wastes. JOURNAL OF SOIL AND WATER CONSERVATION 34 (1): 16-19. Li, Xiaomei, 2004. Alberta Research Council. Personal Communication. Lusk P, 1998. Methane Recovery from Animal Manures: the Current Opportunities Casebook, National Renewable Energy Laboratory, NREL/SR-580-25145. Mathony T, O’Flaherty V, Colleran E, and others. 1999. Feasibility Study for Centralized Anaerobic Digestion for Treatment of Various Wastes and Wastewaters in Sensitive Catchment Areas. Environmental Protection Agency. Ireland. Mezei, Sean. 2006. Personal Communication. QuestAir Corporation. Nielsen LH, Gregersen KH, 2002. Socio-economic Analysis of Centralized Biogas Plants, Danish Research Institute of Food Economics. Shilling, Norm. 2005. General Electric Corporation. Personal Communication. South-Tex Treaters website http://www.southtex.com/ Tofani, Rick, 2006. Innogy Consulting Limited. Personal Communication.