Embed Size (px)
Citation preview


4
Electricity Is A Great Value
ConsumerPrice Index
Sources: U.S. Department of Labor, Bureau of Labor Statistics (BLS), and U.S. Department of Energy, Energy Information Administration (EIA).
January 2018 © 2018 by the Edison Electric Institute. All rights reserved.
(Percent)
HousingNaturalGas
HealthCare
TransportationFood &Beverage
Gasoline Electricity0
20
40
60
80
100
120
140
160
180
169%
112%
89% 83%88% 80%63% 61%
Increase in cost of selected consumer goods1991–2017 (nominal dollars)
Sources: U.S. Department of Labor, Bureau of Labor Statistics, and U.S. Department of Energy, Energy Information Administration.

10
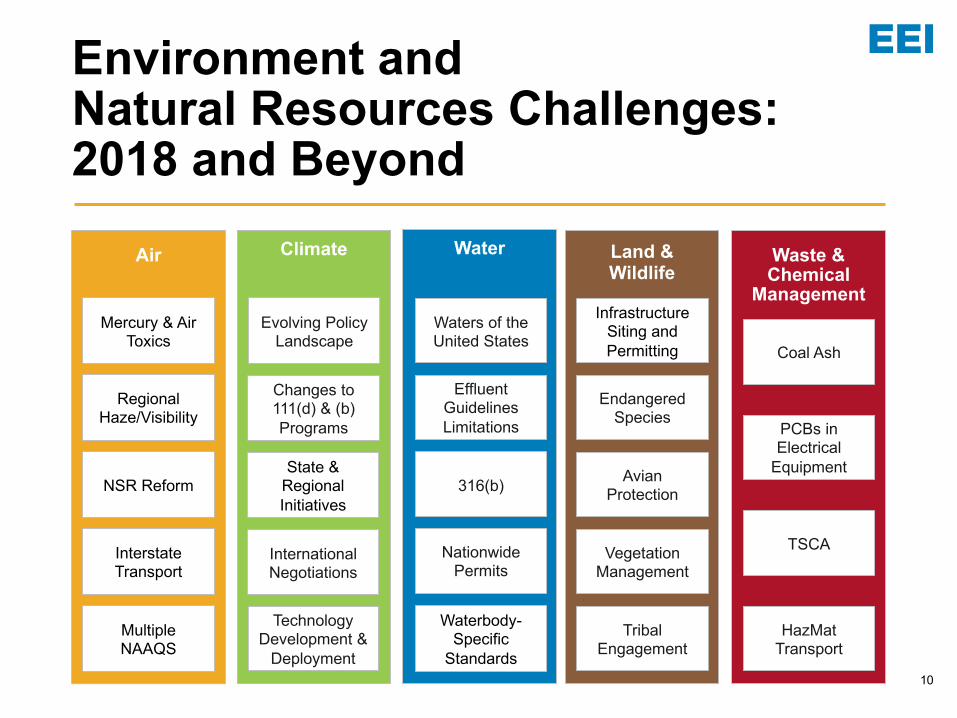
Environment and Natural Resources Challenges: 2018 and Beyond
Air Climate Water Land & Wildlife
Waste & Chemical
Management
Coal Ash
PCBs in Electrical
Equipment
HazMat Transport
Infrastructure Siting and Permitting
Endangered Species
Avian Protection
Vegetation Management
Waters of the United States
Effluent GuidelinesLimitations
316(b)
Nationwide Permits
Evolving Policy Landscape
Changes to 111(d) & (b) Programs
State & Regional Initiatives
International Negotiations
Mercury & Air Toxics
Regional Haze/Visibility
NSR Reform
Interstate Transport
Multiple NAAQS
Waterbody-Specific
Standards
TSCA
Technology Development &
Deployment
Tribal Engagement
14
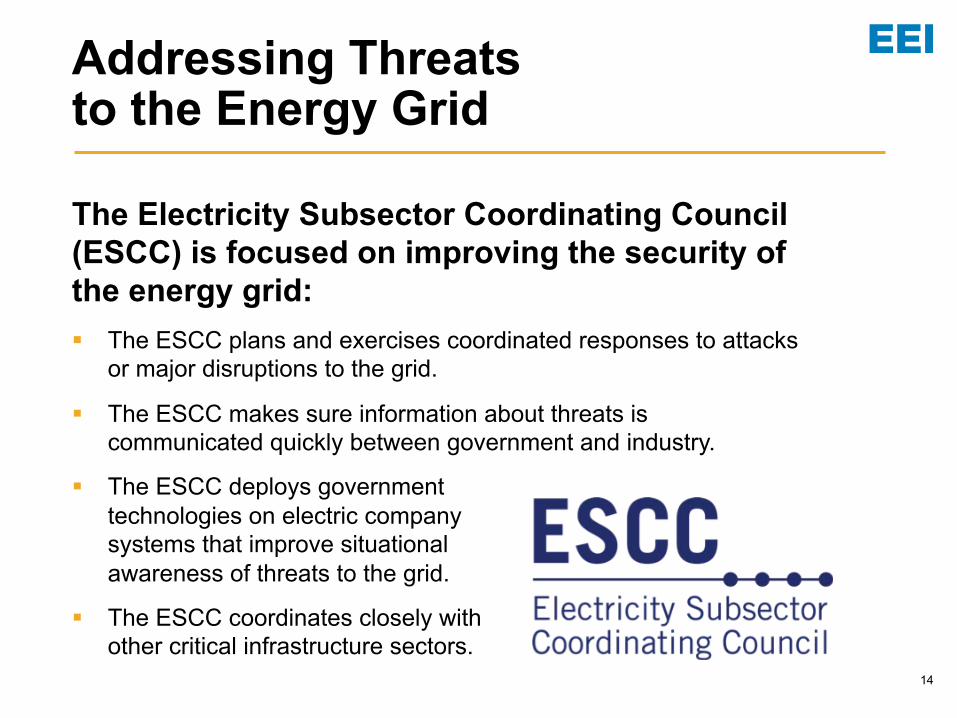
The Electricity Subsector Coordinating Council (ESCC) is focused on improving the security of the energy grid:§ The ESCC plans and exercises coordinated responses to attacks
or major disruptions to the grid.
§ The ESCC makes sure information about threats is communicated quickly between government and industry.
§ The ESCC deploys government technologies on electric company systems that improve situational awareness of threats to the grid.
§ The ESCC coordinates closely with other critical infrastructure sectors.
Addressing Threats to the Energy Grid
17
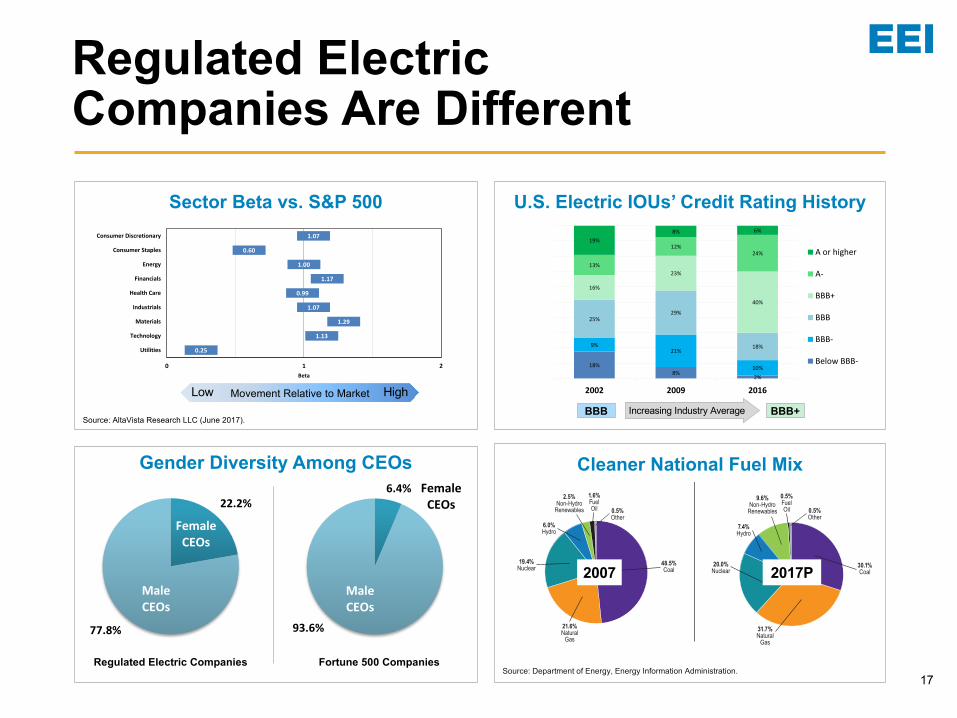
Cleaner National Fuel Mix
The Mix of Resources Used to Generate Electricity Is Changing Dramatically
Source: Department of Energy, Energy Information Administration.
2007 National Energy Resource Mix
2017 National Energy Resource Mix
(preliminary)
21.6%Natural
Gas
19.4%Nuclear
2.5%Non-Hydro
Renewables
6.0%Hydro
48.5%Coal
0.5%Other
1.6%FuelOil
31.7%Natural
Gas
20.0%Nuclear
9.6%Non-Hydro
Renewables
7.4%Hydro
30.1%Coal
0.5%Other
0.5%FuelOil
Sector Beta vs. S&P 500
0.25
1.13
1.29
1.07
0.99
1.17
1.00
0.60
1.07
0 1 2
Utilities
Technology
Materials
Industrials
Health Care
Financials
Energy
Consumer Staples
Consumer Discretionary
Beta
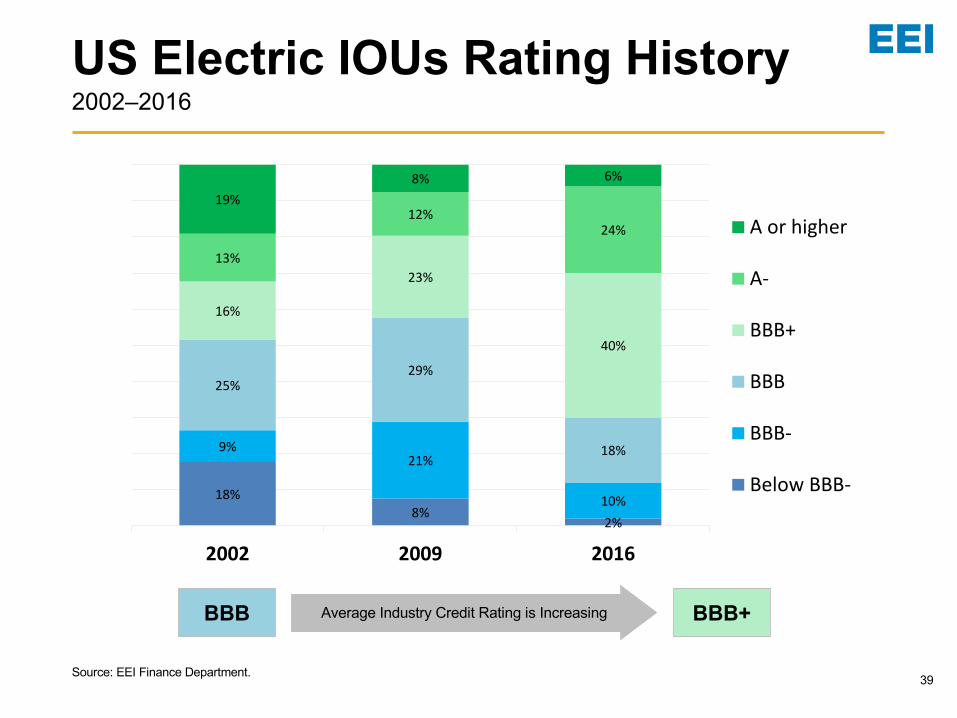
U.S. Electric IOUs’ Credit Rating History
18%8%
2%
9%21%
10%
25%29%
18%
16%
23%
40%
13%
12%24%
19%8% 6%
2002 2009 2016
A or higher
A-
BBB+
BBB
BBB-
Below BBB-
Regulated Electric Companies Are Different
Movement Relative to MarketLow High
Source: AltaVista Research LLC (June 2017).Increasing Industry AverageBBB BBB+
2007 2017P
Source: Department of Energy, Energy Information Administration.
Gender Diversity Among CEOs
22.2%
77.8%
Male CEOs
Female CEOs
6.4%
93.6%
Male CEOs
Female CEOs
Regulated Electric Companies Fortune 500 Companies
18
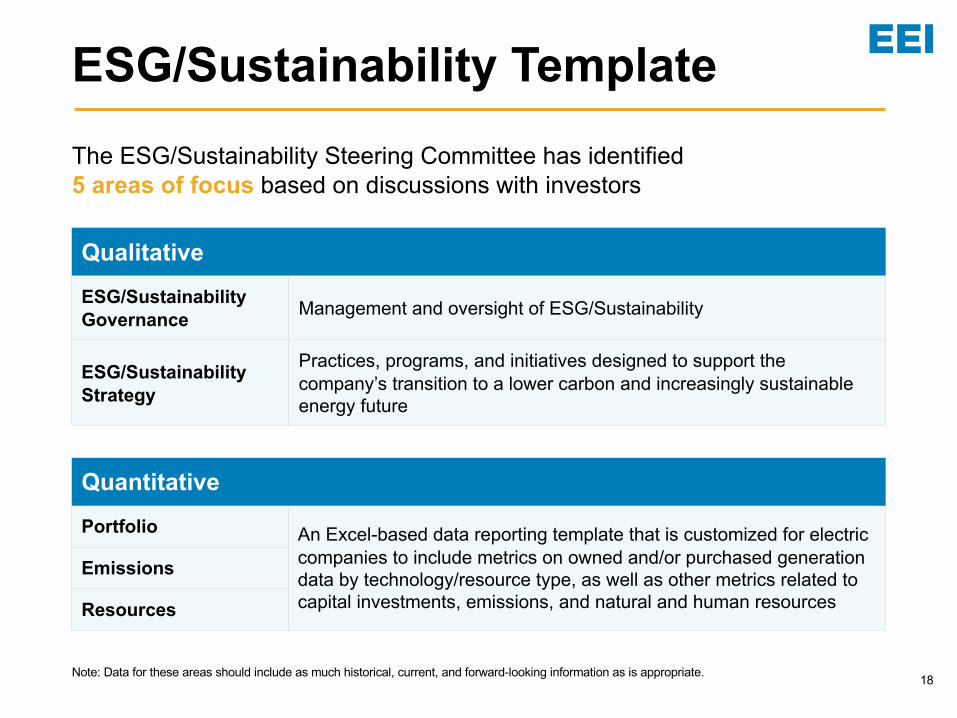
QualitativeESG/Sustainability Governance Management and oversight of ESG/Sustainability
ESG/Sustainability Strategy
Practices, programs, and initiatives designed to support the company’s transition to a lower carbon and increasingly sustainable energy future
ESG/Sustainability Template
QuantitativePortfolio An Excel-based data reporting template that is customized for electric
companies to include metrics on owned and/or purchased generation data by technology/resource type, as well as other metrics related to capital investments, emissions, and natural and human resources
Emissions
Resources
The ESG/Sustainability Steering Committee has identified 5 areas of focus based on discussions with investors
Note: Data for these areas should include as much historical, current, and forward-looking information as is appropriate.
19
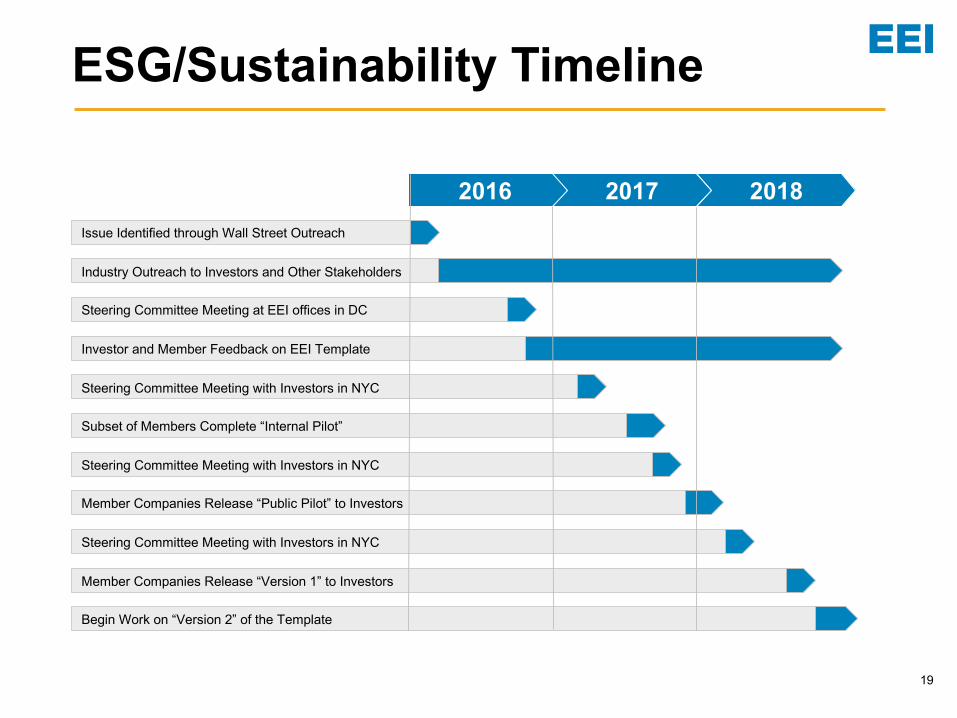
ESG/Sustainability Timeline
Subset of Members Complete “Internal Pilot”
Steering Committee Meeting at EEI offices in DC
Investor and Member Feedback on EEI Template
Industry Outreach to Investors and Other Stakeholders
Issue Identified through Wall Street Outreach
2016 2017 2018
Steering Committee Meeting with Investors in NYC
Steering Committee Meeting with Investors in NYC
Member Companies Release “Public Pilot” to Investors
Member Companies Release “Version 1” to Investors
Begin Work on “Version 2” of the Template
Steering Committee Meeting with Investors in NYC

21
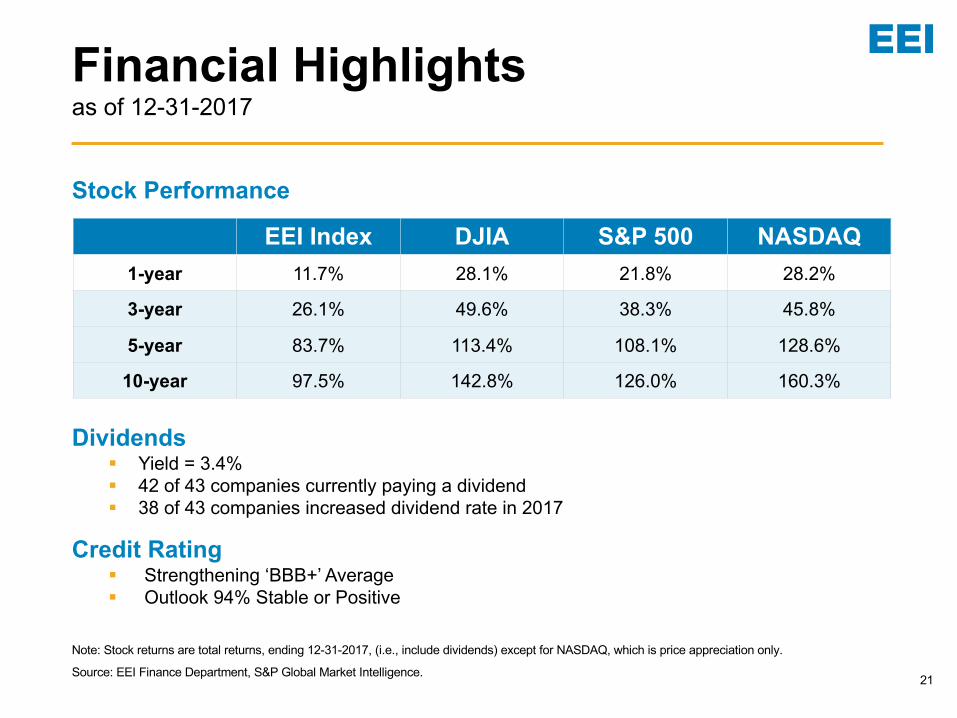
Financial Highlightsas of 12-31-2017
EEI Index DJIA S&P 500 NASDAQ1-year 11.7% 28.1% 21.8% 28.2%
3-year 26.1% 49.6% 38.3% 45.8%
5-year 83.7% 113.4% 108.1% 128.6%
10-year 97.5% 142.8% 126.0% 160.3%
Dividends§ Yield = 3.4%§ 42 of 43 companies currently paying a dividend§ 38 of 43 companies increased dividend rate in 2017
Credit Rating§ Strengthening ‘BBB+’ Average§ Outlook 94% Stable or Positive
Stock Performance
Note: Stock returns are total returns, ending 12-31-2017, (i.e., include dividends) except for NASDAQ, which is price appreciation only.
Source: EEI Finance Department, S&P Global Market Intelligence.

22
Industry Capital Expenditures
Actuals
Projections(Aug 2016)
Projections(Aug 2017)
Notes: Total company spending of U.S. Investor-Owned Electric Utilities, consolidated at the parent or appropriate holding company. Projections based on publicly available information and extrapolated for companies reporting fewer than three projected years (0.1% and 2.5% of the industry for 2018 and 2019, respectively).
Source: EEI Finance Department, company reports, S&P Global Market Intelligence (August 2017).
120.8
104.596.5
122.8114.0
109.0
74.1 82.8
77.7 74.378.6
90.3 90.396.1
104.0112.5
$30 B$40 B$50 B$60 B$70 B$80 B$90 B
$100 B$110 B$120 B$130 B
2007 2008 2009 2010 2011 2012 2013 2014 2015 2016 2017 2018 2019
23
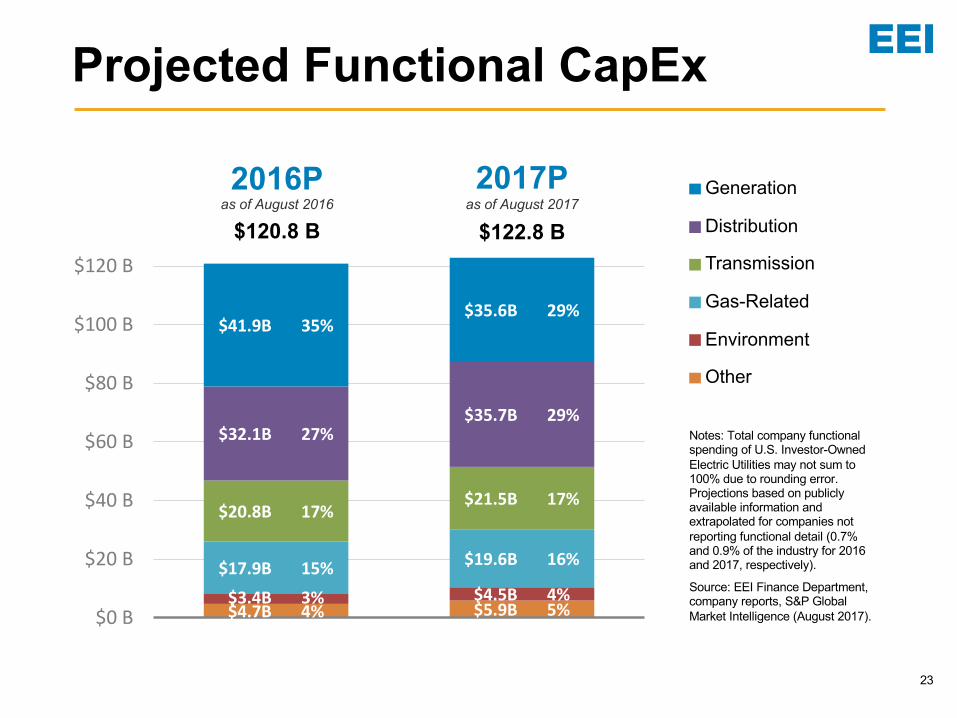
$4.7B 4% $5.9B 5%$3.4B 3% $4.5B 4%$17.9B 15% $19.6B 16%
$20.8B 17% $21.5B 17%
$32.1B 27%$35.7B 29%
$41.9B 35%$35.6B 29%
$0 B
$20 B
$40 B
$60 B
$80 B
$100 B
$120 B
Projected Functional CapEx
$120.8 Bas of August 2016 as of August 2017
$122.8 B
2016P 2017P Generation
Distribution
Transmission
Gas-Related
Environment
Other
Notes: Total company functional spending of U.S. Investor-Owned Electric Utilities may not sum to 100% due to rounding error. Projections based on publicly available information and extrapolated for companies not reporting functional detail (0.7% and 0.9% of the industry for 2016 and 2017, respectively).
Source: EEI Finance Department, company reports, S&P Global Market Intelligence (August 2017).

25
Outstanding Items§ Holding Company Debt—Interest Allocation Method§ Q4 2017 Depreciation clarification - (50% Bonus vs. MACRS vs. 100% Bonus)
§ Misc.
Next Steps§ Follow up with tax writing committees§ JCT Blue Book§ Ultimate guidance from Treasury/IRS
Tax Reform:Clarification & Next Steps


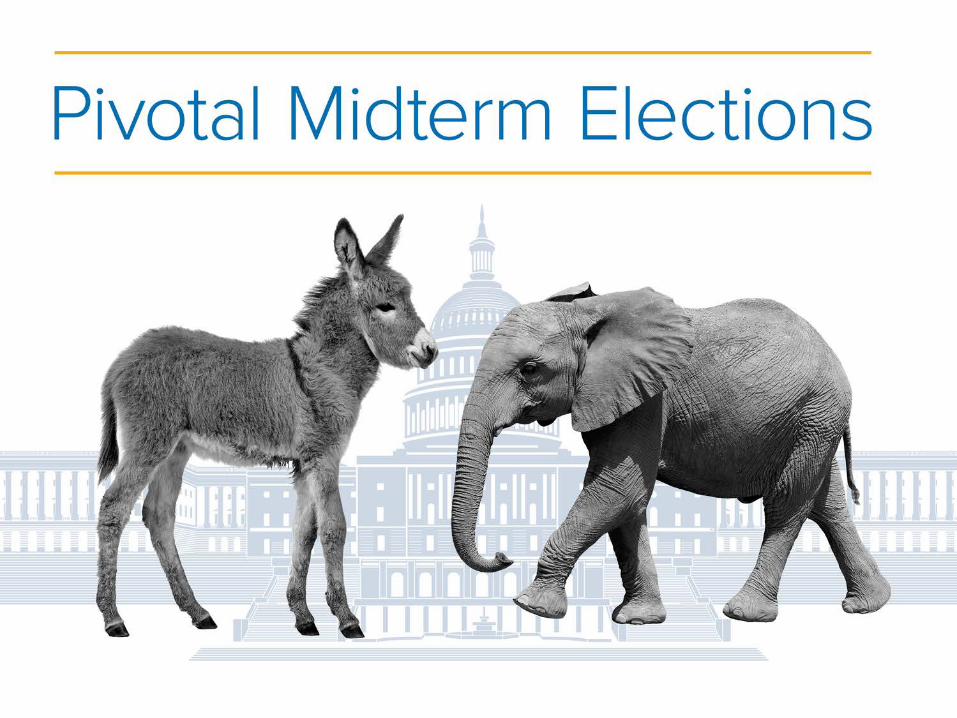
Source: https://www.cnn.com/2018/01/30/politics/2018-house-race-ratings/index.html. Accessed January 30, 2018.
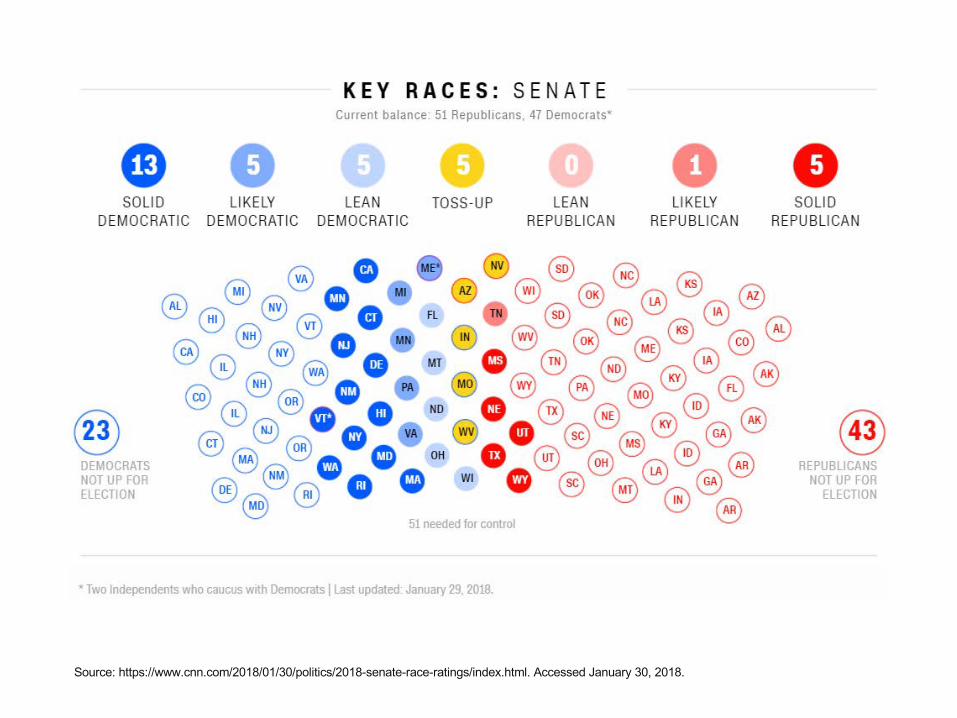
Source: https://www.cnn.com/2018/01/30/politics/2018-senate-race-ratings/index.html. Accessed January 30, 2018.

Source: https://www.washingtonpost.com/news/the-fix/wp/2018/01/29/republican-governors-association-to-cut-all-ties-with-steve-wynn-amid-sexual-misconduct-allegations/?utm_term=.48a326966336. Accessed January 29, 2018.
32
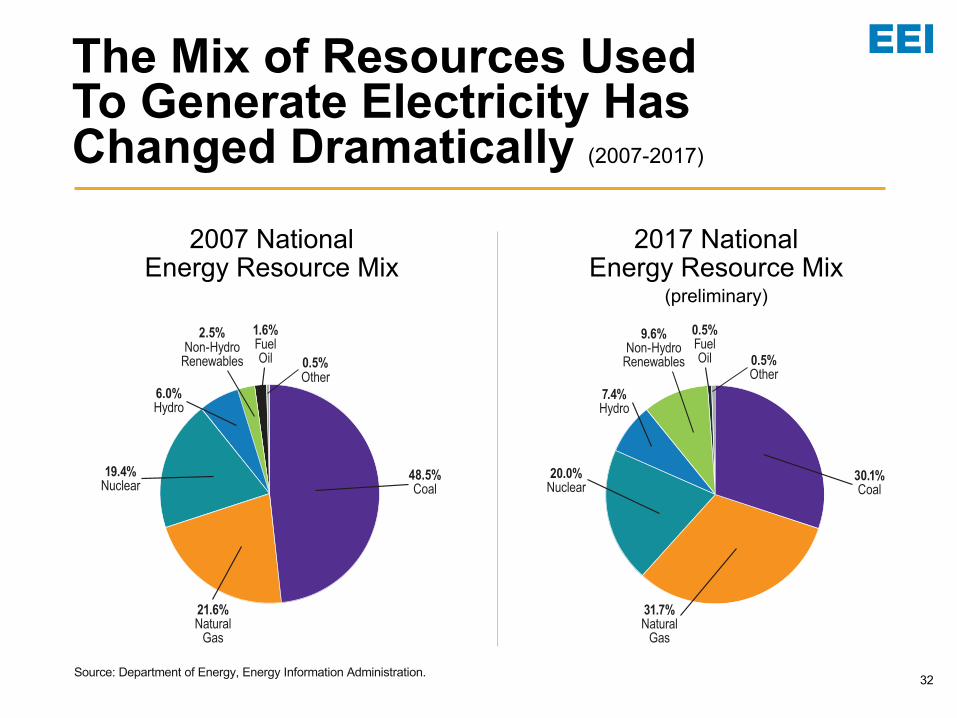
The Mix of Resources Used To Generate Electricity Has Changed Dramatically (2007-2017)
2007 National Energy Resource Mix
2017 National Energy Resource Mix
(preliminary)
21.6%Natural
Gas
19.4%Nuclear
2.5%Non-Hydro
Renewables
6.0%Hydro
48.5%Coal
0.5%Other
1.6%FuelOil
31.7%Natural
Gas
20.0%Nuclear
9.6%Non-Hydro
Renewables
7.4%Hydro
30.1%Coal
0.5%Other
0.5%FuelOil
Source: Department of Energy, Energy Information Administration.
33
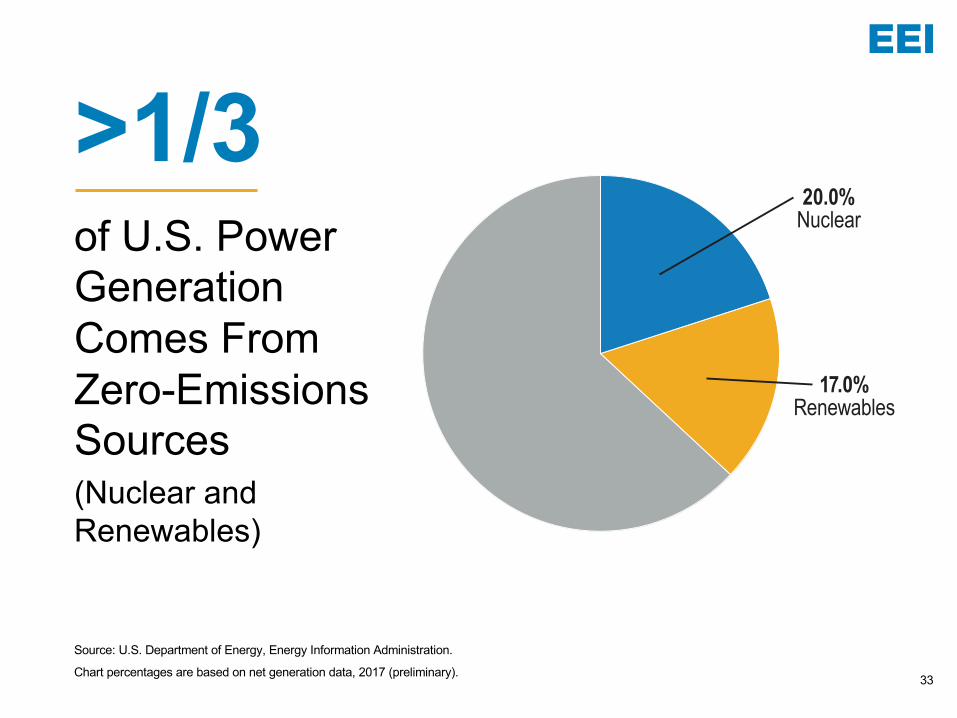
>1/3of U.S. Power Generation Comes From Zero-Emissions Sources (Nuclear and Renewables)
Source: U.S. Department of Energy, Energy Information Administration.
Chart percentages are based on net generation data, 2017 (preliminary).
17.0%Renewables
20.0%Nuclear
34
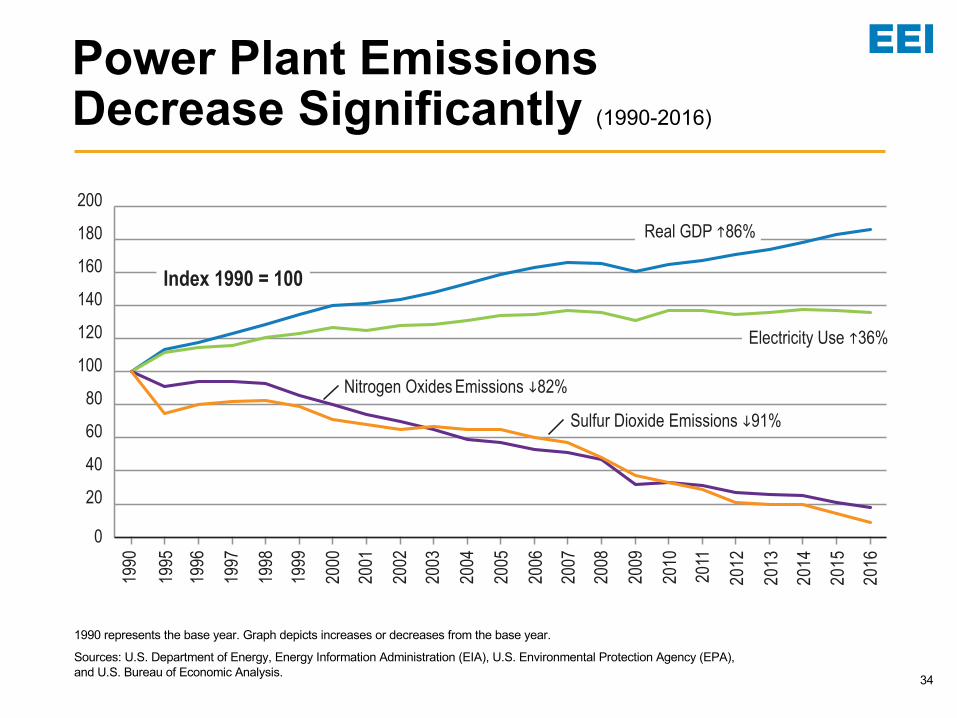
Power Plant Emissions Decrease Significantly (1990-2016)
0
20406080
100120140160180200
Index 1990 = 100
1995
1990
1996
1997
1998
1999
2000
2001
2002
2003
2004
2005
2006
2007
2008
2009
2010
Real GDP h86%
Electricity Use h36%
Nitrogen Oxides Emissions i82%
2011
2012
2013
2014
2016
Sulfur Dioxide Emissions i91%
1990 represents the base year. Graph depicts increases or decreases from the base year.
Sources: U.S. Department of Energy, Energy Information Administration (EIA), U.S. Environmental Protection Agency (EPA), and U.S. Bureau of Economic Analysis.
April 2017 © 2017 by the Edison Electric Institute. All rights reserved.
2015
1990 represents the base year. Graph depicts increases or decreases from the base year.
Sources: U.S. Department of Energy, Energy Information Administration (EIA), U.S. Environmental Protection Agency (EPA), and U.S. Bureau of Economic Analysis.

35
§ 1/3 of U.S. power generation comes from zero-emissions sources§ As of 2016, industry CO2 emissions were nearly 25 percent below 2005 levels§ Trajectory will continue based on current trends
U.S. Power Sector Carbon Dioxide Emissions Declining (2005-2016)
Source: Developed from U.S. Energy Information Administration, Monthly Energy Review, March 2017.
March 2017 © 2017 by the Edison Electric Institute. All rights reserved.
2005
2006
2007
2008
2009
2011
2012
2013
2015
2016
2014
2010
Million Metric Tons
1,800
1,900
2,000
2,100
2,200
2,300
2,400
2,500
Source: Developed from U.S. Energy Information Administration, Monthly Energy Review, March 2017.
36
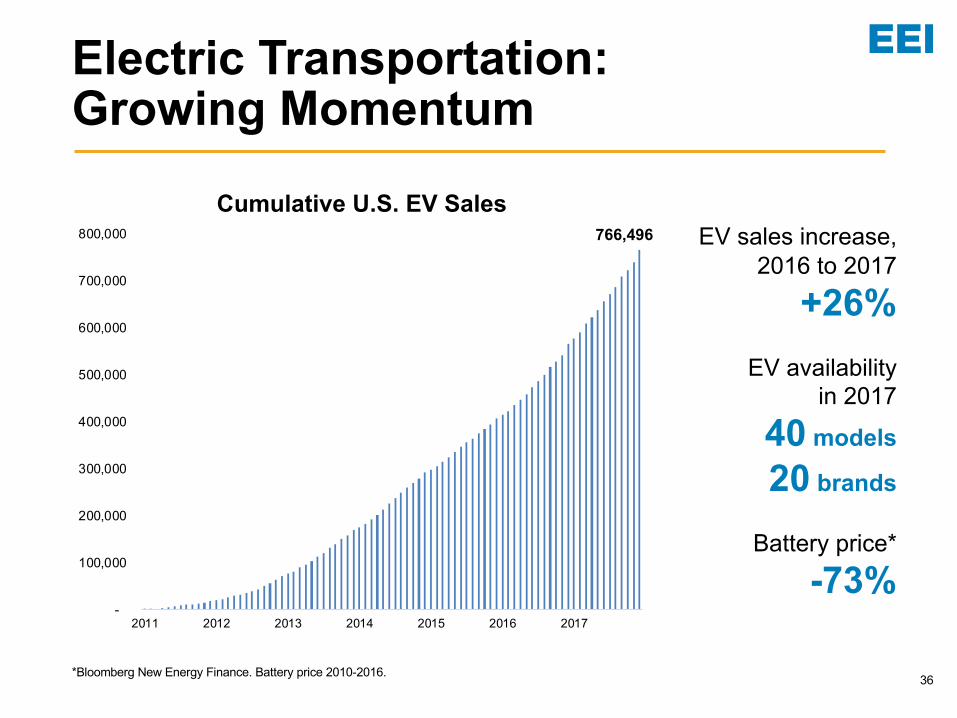
Electric Transportation:Growing Momentum
EV sales increase, 2016 to 2017
+26%EV availability
in 2017
40 models
20 brands
Battery price*
-73%
766,496
-
100,000
200,000
300,000
400,000
500,000
600,000
700,000
800,000
2011 2012 2013 2014 2015 2016 2017
Cumulative U.S. EV Sales
*Bloomberg New Energy Finance. Battery price 2010-2016.

37
6.4%
93.6%
Male CEOs
Female CEOs
22.2%
77.8%
Male CEOs
Female CEOs
Gender Diversity at Regulated Electric Companies
Pat Vincent-Collawn (EEI Chairman)Chairman, President and CEOPNM Resources
Lynn Good (EEI Vice Chairman)Chairman, President and CEODuke Energy
Patricia KamplingChairman, President and CEOAlliant Energy Corporation
Patricia Poppe President and CEOCMS Energy
Mary KippPresident and CEOEl Paso Electric Company
Mary Powell President and CEOGreen Mountain Power
Connie LauPresident and CEOHawaiian Electric Industries
Linda Aspey President and CEOITC Holdings Corp
Geisha WilliamsPresident and CEOPG&E Corporation
Maria PopePresident and CEOPortland General Electric Company
Kimberly Harris President and CEOPuget Sound Energy
Debra ReedChairman, President and CEOSempra Energy
Regulated Electric Companies
Fortune 500 Companies
Female Leadership in the Electric Industry
38
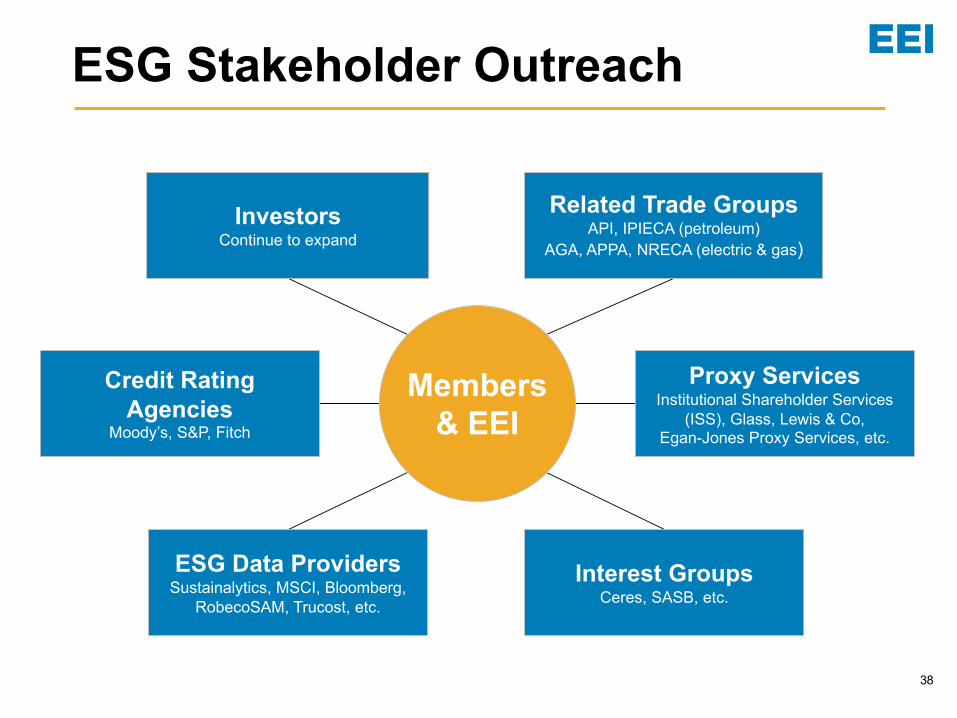
ESG Stakeholder Outreach
InvestorsContinue to expand
Related Trade GroupsAPI, IPIECA (petroleum)
AGA, APPA, NRECA (electric & gas)
Proxy ServicesInstitutional Shareholder Services
(ISS), Glass, Lewis & Co,
Egan-Jones Proxy Services, etc.
Credit Rating Agencies
Moody’s, S&P, Fitch
ESG Data ProvidersSustainalytics, MSCI, Bloomberg,
RobecoSAM, Trucost, etc.
Interest GroupsCeres, SASB, etc.
Members& EEI
39
US Electric IOUs Rating History
18%8%
2%
9%21%
10%
25%29%
18%
16%
23%
40%
13%
12%24%
19%8% 6%
2002 2009 2016
A or higher
A-
BBB+
BBB
BBB-
Below BBB-
Source: EEI Finance Department.
2002–2016
Average Industry Credit Rating is IncreasingBBB BBB+
40
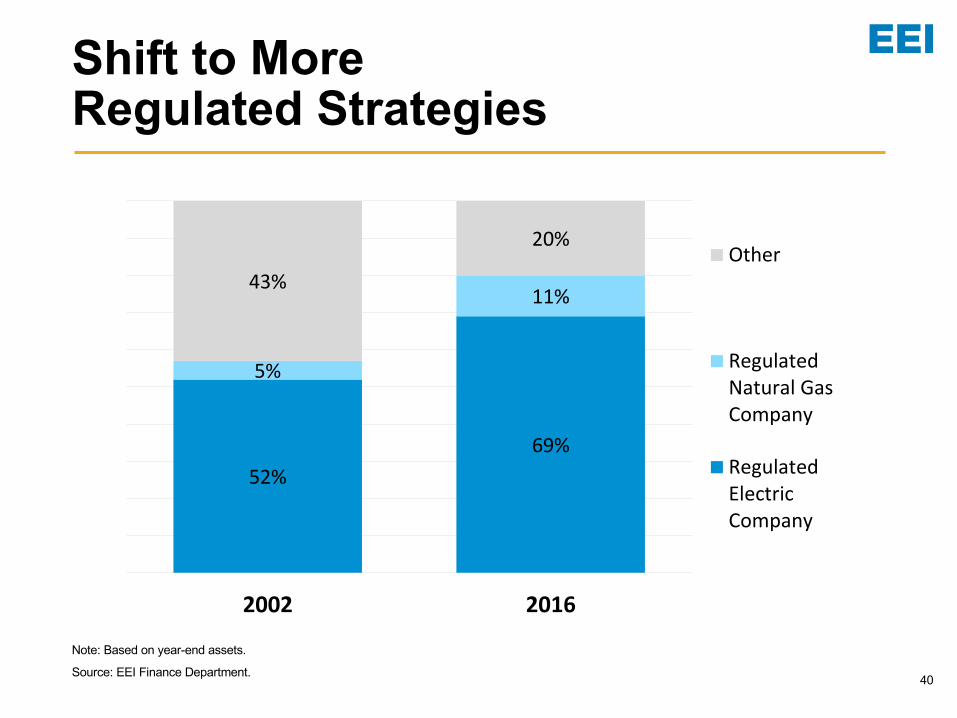
Shift to More Regulated Strategies
52%69%
5%
11%43%
20%
2002 2016
Other
RegulatedNatural GasCompany
RegulatedElectricCompany
Note: Based on year-end assets.
Source: EEI Finance Department.
41
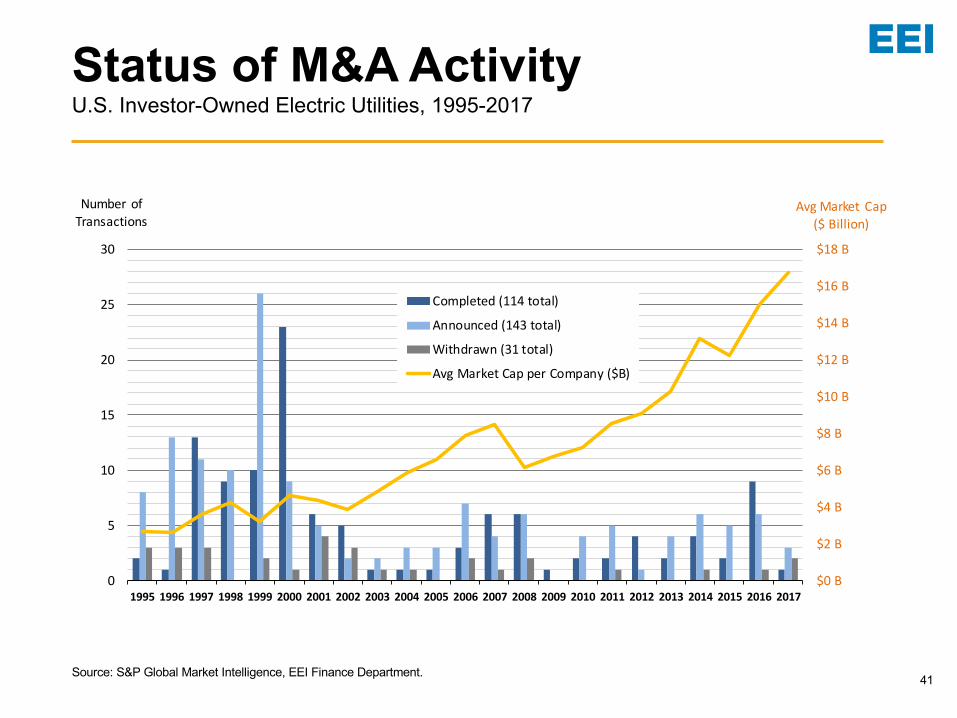
Status of M&A ActivityU.S. Investor-Owned Electric Utilities, 1995-2017
$0 B
$2 B
$4 B
$6 B
$8 B
$10 B
$12 B
$14 B
$16 B
$18 B
0
5
10
15
20
25
30
1995 1996 1997 1998 1999 2000 2001 2002 2003 2004 2005 2006 2007 2008 2009 2010 2011 2012 2013 2014 2015 2016 2017
Avg Market Cap($ Billion)
Number of Transactions
Completed (114 total)
Announced (143 total)
Withdrawn (31 total)
Avg Market Cap per Company ($B)
Source: S&P Global Market Intelligence, EEI Finance Department.
42
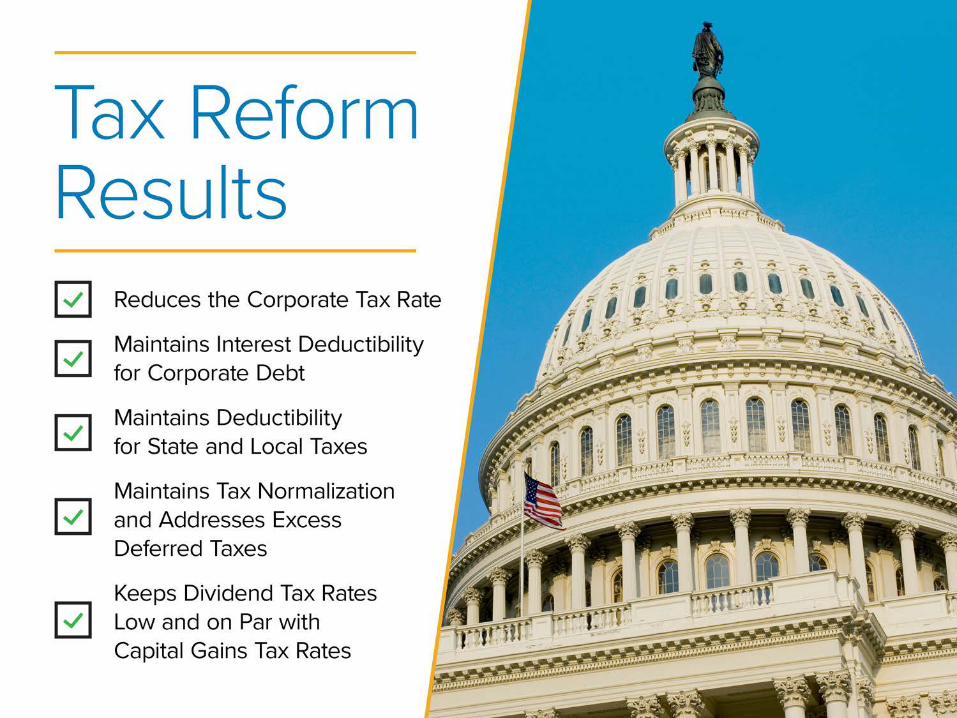
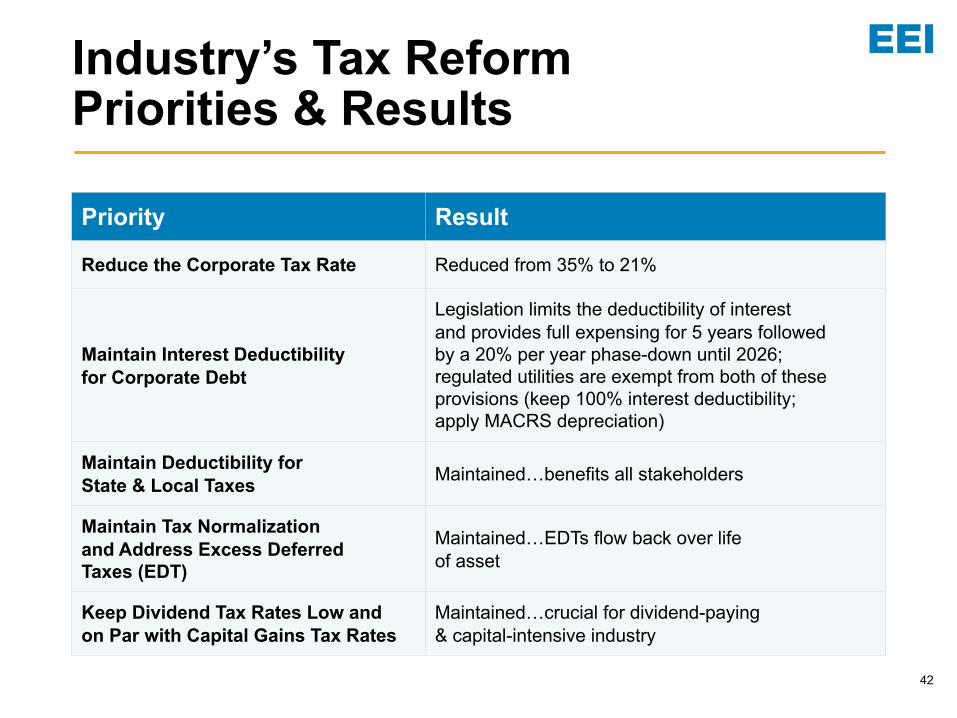
Industry’s Tax Reform Priorities & Results
Priority Result
Reduce the Corporate Tax Rate Reduced from 35% to 21%
Maintain Interest Deductibility for Corporate Debt
Legislation limits the deductibility of interest and provides full expensing for 5 years followed by a 20% per year phase-down until 2026; regulated utilities are exempt from both of these provisions (keep 100% interest deductibility; apply MACRS depreciation)
Maintain Deductibility for State & Local Taxes
Maintained…benefits all stakeholders
Maintain Tax Normalization and Address Excess Deferred Taxes (EDT)
Maintained…EDTs flow back over life of asset
Keep Dividend Tax Rates Low and on Par with Capital Gains Tax Rates
Maintained…crucial for dividend-paying & capital-intensive industry
43
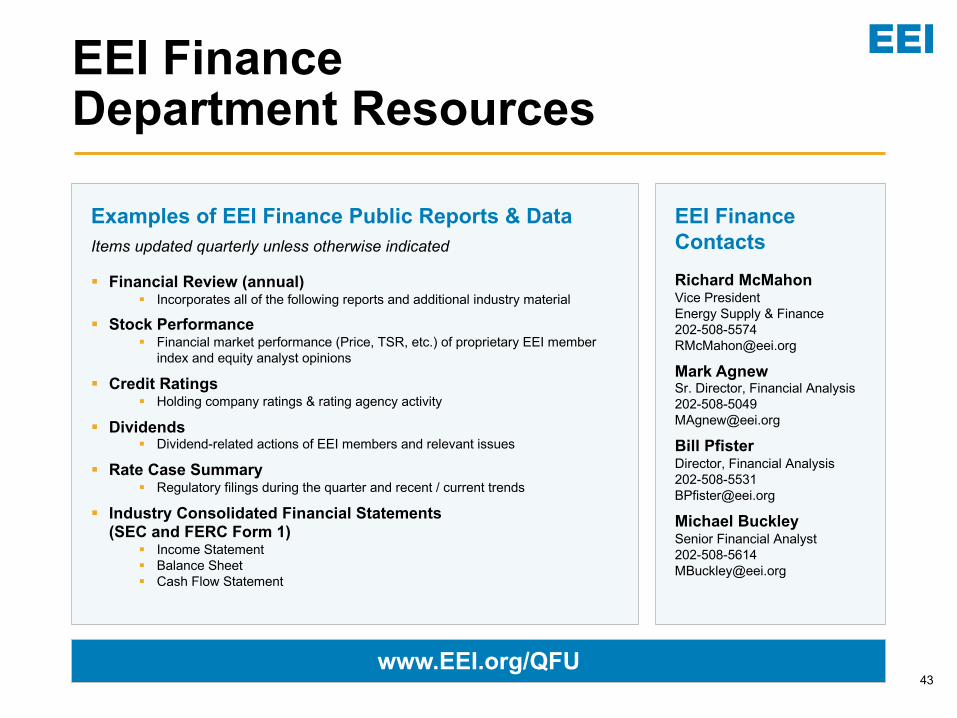
EEI Finance Contacts
Richard McMahonVice PresidentEnergy Supply & Finance [email protected]
Mark AgnewSr. Director, Financial [email protected]
Bill PfisterDirector, Financial [email protected]
Michael BuckleySenior Financial [email protected]
www.EEI.org/QFU
EEI Finance Department Resources
Examples of EEI Finance Public Reports & DataItems updated quarterly unless otherwise indicated
§ Financial Review (annual)§ Incorporates all of the following reports and additional industry material
§ Stock Performance§ Financial market performance (Price, TSR, etc.) of proprietary EEI member
index and equity analyst opinions
§ Credit Ratings§ Holding company ratings & rating agency activity
§ Dividends§ Dividend-related actions of EEI members and relevant issues
§ Rate Case Summary§ Regulatory filings during the quarter and recent / current trends
§ Industry Consolidated Financial Statements (SEC and FERC Form 1)
§ Income Statement§ Balance Sheet§ Cash Flow Statement