Embed Size (px)
Citation preview

181. PROFILE ON KINDERGARTEN

181 - 2
TABLE OF CONTENTS
PAGE
I. SUMMARY 181-3
II. SERIVE DESCRIPTION & APPLICATION 181-3
III. MARKET STUDY AND SERVICE CAPACITY 181-4
A. MARKET STUDY 181-4
B. SERVICE CAPACITY & PROGRAMME 181-9
IV. MATERIALS AND INPUTS 181-10
A. RAW MATERIALS 181-10
B. UTILITIES 181-11
V. TECHNOLOGY & ENGINEERING 181-11
A. TECHNOLOGY 181-11
B. ENGINEERING 181-13
VI. MANPOWER & TRAINING REQUIREMENT 181-17
A. MANPOWER REQUIREMENT 181-17
B. TRAINING REQUIREMENT 181-18
VII. FINANCIAL ANLYSIS 181-18
A. TOTAL INITIAL INVESTMENT COST 181-19
B. OPERATING COST 181-20
C. FINANCIAL EVALUATION 181-20
D. ECONOMIC BENEFITS 181-22

181 - 3
I. SUMMARY
This profile envisages the establishment of a kindergarten with a capacity of 1,800
children per annum.
The present demand for the proposed service is estimated at 1,551 school sections per
annum. The demand is expected to reach at 2,186 school sections by the year 2017.
The total investment requirement is estimated at Birr 9.49 million, out of which Birr
513.7 thousand is required for equipment. The service will create employment
opportunities for 79 persons.
The project is financially viable with an internal rate of return (IRR) of 17.32 % and a
net present value (NPV) of Birr 4.46 million, discounted at 8.5 %.
II. SERVICE DESCRIPTION AND APPLICATION
Kindergarten is a form of pre-school education in which children aged three to seven are
taught through creative play, social interaction, and natural expression. Play is a
significant aspect of a kindergarten employing games, songs, specially chosen work
materials, and stories to address the needs of small children. It is aimed at growing
children in a free atmosphere away from home. Accordingly it is some times called
“children’s garden”. It serves as a transitional stage from home to the more formal
schooling that followed.
In class, they are introduced to the alphabet, numbers, and colors; they study their bodies,
their families, and their communities; they listen to stories read aloud; they make art
projects; they participate in skits and dramatic productions; and they learn about holidays,
plants, animals, and other topics in science and social studies. Some kindergartens also
teach introductory reading and mathematical skills.
181 - 4
III. MARKET STUDY AND SERVICE CAPACITY
A. MARKET STUDY
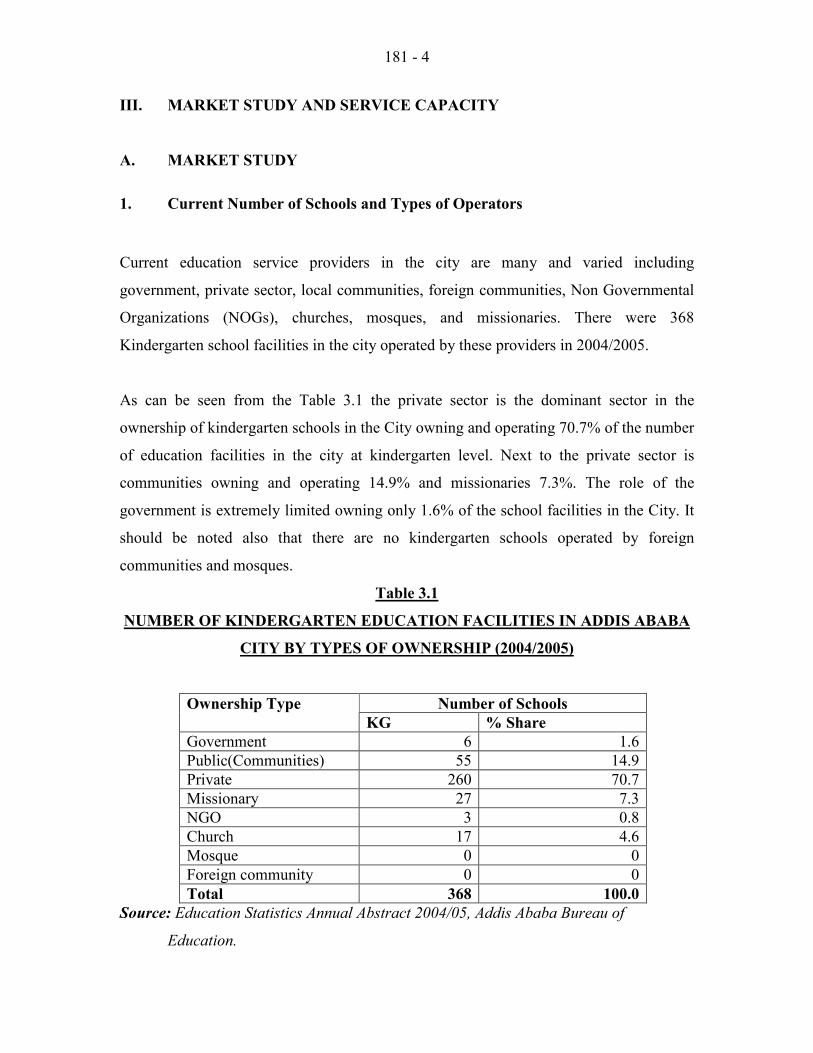
1. Current Number of Schools and Types of Operators
Current education service providers in the city are many and varied including
government, private sector, local communities, foreign communities, Non Governmental
Organizations (NOGs), churches, mosques, and missionaries. There were 368
Kindergarten school facilities in the city operated by these providers in 2004/2005.
As can be seen from the Table 3.1 the private sector is the dominant sector in the
ownership of kindergarten schools in the City owning and operating 70.7% of the number
of education facilities in the city at kindergarten level. Next to the private sector is
communities owning and operating 14.9% and missionaries 7.3%. The role of the
government is extremely limited owning only 1.6% of the school facilities in the City. It
should be noted also that there are no kindergarten schools operated by foreign
communities and mosques.
Table 3.1
NUMBER OF KINDERGARTEN EDUCATION FACILITIES IN ADDIS ABABA
CITY BY TYPES OF OWNERSHIP (2004/2005)
Number of Schools Ownership Type
KG % Share
Government 6 1.6
Public(Communities) 55 14.9
Private 260 70.7
Missionary 27 7.3
NGO 3 0.8
Church 17 4.6
Mosque 0 0
Foreign community 0 0
Total 368 100.0
Source: Education Statistics Annual Abstract 2004/05, Addis Ababa Bureau of
Education.
181 - 5
The basic reasons the private sector is dominating in KG are that:
• The governments policy that focuses on providing basic education to all and
accordingly the government is not investing in KG ,
• Traditionally in the City and in the country as a whole KG is the domain of the
private sector, and
• Compared with primary and secondary schools, investment required in KG is
small, which attracts the private investors with weak financial capacity.
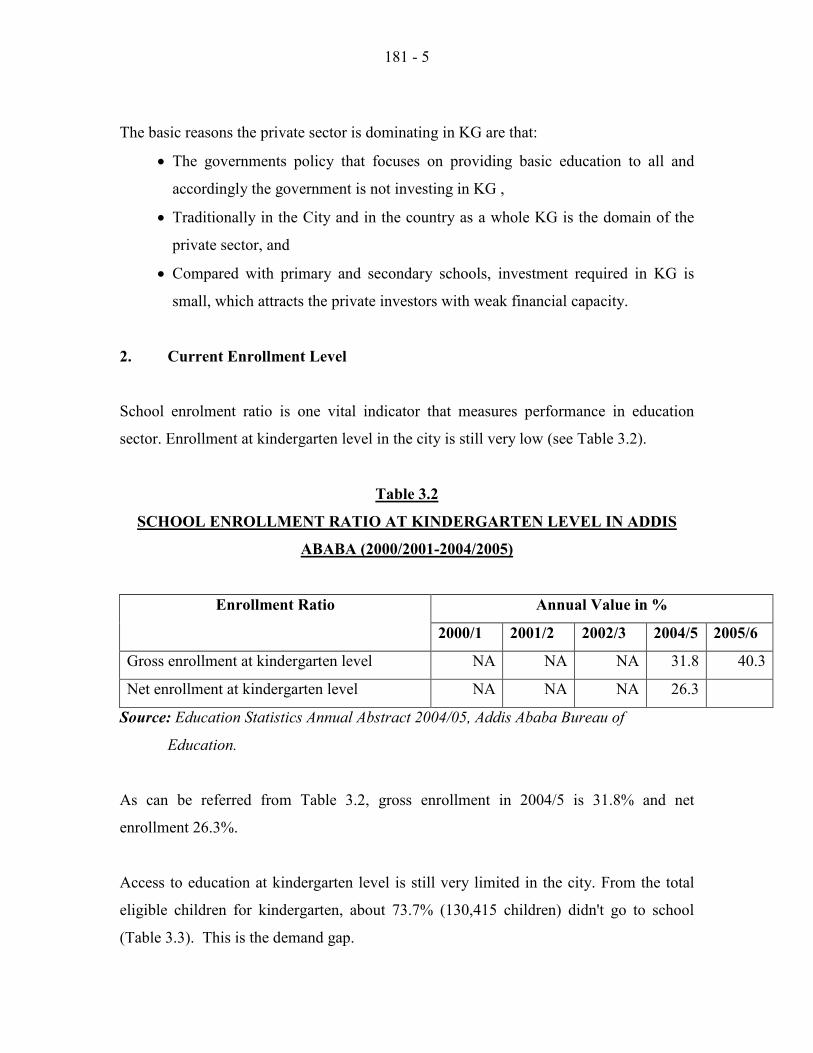
2. Current Enrollment Level
School enrolment ratio is one vital indicator that measures performance in education
sector. Enrollment at kindergarten level in the city is still very low (see Table 3.2).
Table 3.2
SCHOOL ENROLLMENT RATIO AT KINDERGARTEN LEVEL IN ADDIS
ABABA (2000/2001-2004/2005)
Annual Value in % Enrollment Ratio
2000/1 2001/2 2002/3 2004/5 2005/6
Gross enrollment at kindergarten level NA NA NA 31.8 40.3
Net enrollment at kindergarten level NA NA NA 26.3
Source: Education Statistics Annual Abstract 2004/05, Addis Ababa Bureau of
Education.
As can be referred from Table 3.2, gross enrollment in 2004/5 is 31.8% and net
enrollment 26.3%.
Access to education at kindergarten level is still very limited in the city. From the total
eligible children for kindergarten, about 73.7% (130,415 children) didn't go to school
(Table 3.3). This is the demand gap.

181 - 6
Table 3.3
NUMBER OF CHILDREN WITH NO ACCESS TO EDUCATION AND NUMBER
OF SCHOOL SECTIONS AND TEACHERS REQUIRED (2004/05)
Number of Children Level of Education
Number
Eligible
Number
Enrolled
Number
with No
Access
Additional
Number of
Sections
Required 1
Additional
Number of
Teachers
Required
Kindergarten 176,954 46,539 130,415 4, 347 4, 347
Source: Education Statistics Annual Abstract 2004/05, Addis Ababa Bureau of
Education.
Based on the standards of the Ministry of Education with respect to section to student and
teacher student ratio it is estimated that 3, 147 additional school sections and 3,347
additional teachers at kindergarten are required to accommodate the needs of those
children who currently have no access for education.
This does not mean however that the needs of these children would be addressed through
commercial service provision since most of the children are from poor families who
would not be able to afford to pay school fees and cover other educational expenses for
their children. On the other hand it is believed that commercial service providers can also
accommodate the partial needs of these children through innovative service provision.
1 It is estimated based on teacher to student ratio and section to student ratio standards acquired from the
Addis Ababa Bureau of Education. According to the Bureau the standard ratios at kindergarten level is 1
section for 30 students and one teacher for 30 students; at primary (grade 1-4) level one section for 50
students and one teacher for 50 students; at primary level (grade 5-8) one teacher for 50 students and one
section for 50 students; and at secondary level (grade 9-10) one section for 40 students and one teacher for
40 students. Moreover at primary level (grade 1-4) one additional assistant teacher is required for every
three sections.
181 - 7
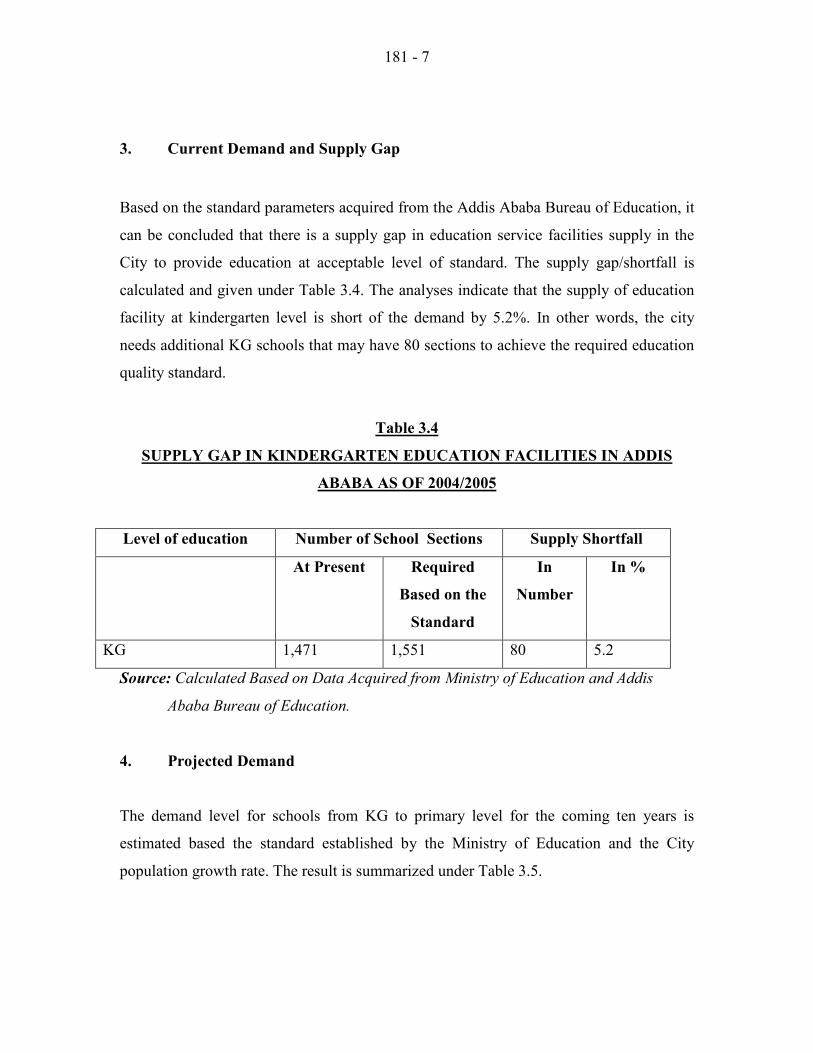
3. Current Demand and Supply Gap
Based on the standard parameters acquired from the Addis Ababa Bureau of Education, it
can be concluded that there is a supply gap in education service facilities supply in the
City to provide education at acceptable level of standard. The supply gap/shortfall is
calculated and given under Table 3.4. The analyses indicate that the supply of education
facility at kindergarten level is short of the demand by 5.2%. In other words, the city
needs additional KG schools that may have 80 sections to achieve the required education
quality standard.
Table 3.4
SUPPLY GAP IN KINDERGARTEN EDUCATION FACILITIES IN ADDIS
ABABA AS OF 2004/2005
Level of education Number of School Sections Supply Shortfall
At Present Required
Based on the
Standard
In
Number
In %
KG 1,471 1,551 80 5.2
Source: Calculated Based on Data Acquired from Ministry of Education and Addis
Ababa Bureau of Education.
4. Projected Demand
The demand level for schools from KG to primary level for the coming ten years is
estimated based the standard established by the Ministry of Education and the City
population growth rate. The result is summarized under Table 3.5.
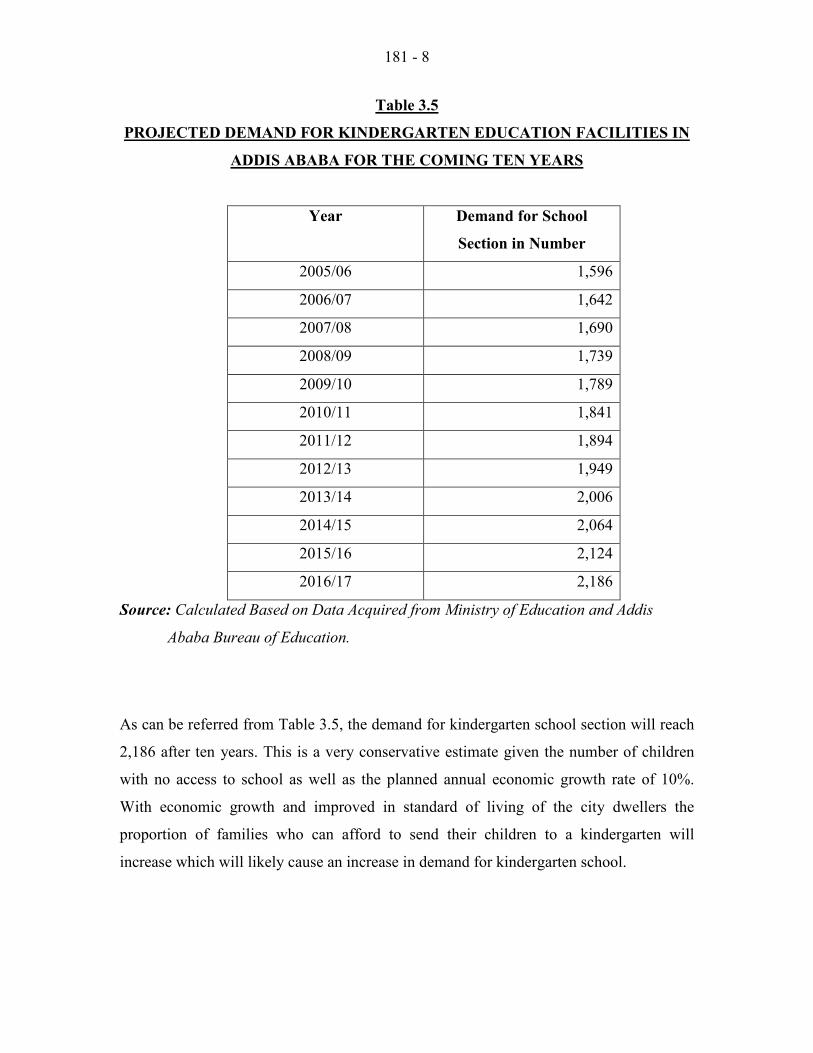
181 - 8
Table 3.5
PROJECTED DEMAND FOR KINDERGARTEN EDUCATION FACILITIES IN
ADDIS ABABA FOR THE COMING TEN YEARS
Year Demand for School
Section in Number
2005/06 1,596
2006/07 1,642
2007/08 1,690
2008/09 1,739
2009/10 1,789
2010/11 1,841
2011/12 1,894
2012/13 1,949
2013/14 2,006
2014/15 2,064
2015/16 2,124
2016/17 2,186
Source: Calculated Based on Data Acquired from Ministry of Education and Addis
Ababa Bureau of Education.
As can be referred from Table 3.5, the demand for kindergarten school section will reach
2,186 after ten years. This is a very conservative estimate given the number of children
with no access to school as well as the planned annual economic growth rate of 10%.
With economic growth and improved in standard of living of the city dwellers the
proportion of families who can afford to send their children to a kindergarten will
increase which will likely cause an increase in demand for kindergarten school.
181 - 9
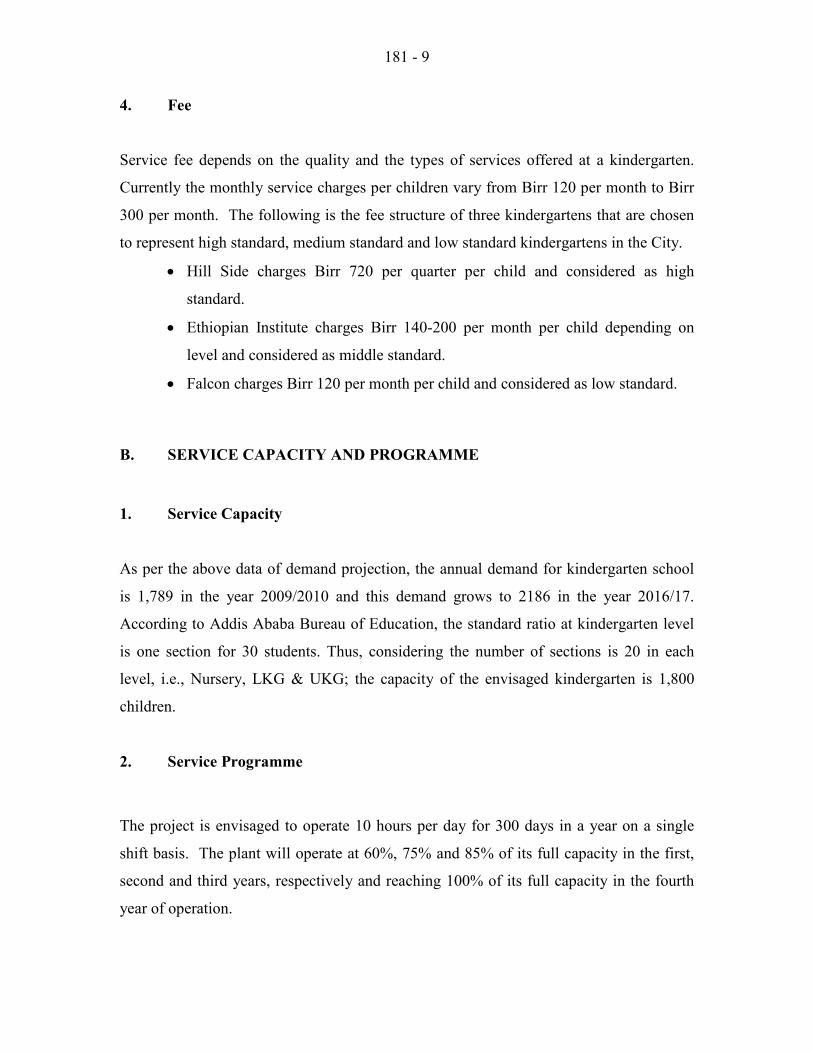
4. Fee
Service fee depends on the quality and the types of services offered at a kindergarten.
Currently the monthly service charges per children vary from Birr 120 per month to Birr
300 per month. The following is the fee structure of three kindergartens that are chosen
to represent high standard, medium standard and low standard kindergartens in the City.
• Hill Side charges Birr 720 per quarter per child and considered as high
standard.
• Ethiopian Institute charges Birr 140-200 per month per child depending on
level and considered as middle standard.
• Falcon charges Birr 120 per month per child and considered as low standard.
B. SERVICE CAPACITY AND PROGRAMME
1. Service Capacity
As per the above data of demand projection, the annual demand for kindergarten school
is 1,789 in the year 2009/2010 and this demand grows to 2186 in the year 2016/17.
According to Addis Ababa Bureau of Education, the standard ratio at kindergarten level
is one section for 30 students. Thus, considering the number of sections is 20 in each
level, i.e., Nursery, LKG & UKG; the capacity of the envisaged kindergarten is 1,800
children.
2. Service Programme
The project is envisaged to operate 10 hours per day for 300 days in a year on a single
shift basis. The plant will operate at 60%, 75% and 85% of its full capacity in the first,
second and third years, respectively and reaching 100% of its full capacity in the fourth
year of operation.

181 - 10
Table 3.4
BUILD-UP PROGRAMME OF THE TRAINING OPERATION
Year 1 2 3 4-10
Capacity Utilization (%) 60 75 85 100
No. of Students 1,040 1,350 1,530 1,800
IV. MATERIALS AND INPUT
A. RAW MATERIALS
The major raw materials required for the envisaged service are sanitary materials
(corrosive agent, pesticides, bleaches, detergent, cleansers, polishes, sheet tight –fitting
mattress made of water proof, etc). Most of the raw materials and inputs required for
running of the kindergarten are locally available. The estimated annual raw and auxiliary
materials cost at full capacity is about Birr 36,000. The list of raw materials requirement
is presented in Table 4.1.
Table 4.1
RAW MATERIALS REQUIREMENT AND COST
Total Cost Sr. No.
Material Qty. (MT) (‘000 Birr)
1 Sanitary materials 10 20
2 Sheet & others L.S 13
3 Teaching materials L.S 3
Total 36

181 - 11
B. UTILITIES
The utilities required for the envisaged project are electricity and water. The annual
required amount of utilities along with cost is shown in Table 4.2.
Table 4.2
ANNUAL UTILITY REQUIREMENT AND COST
Sr. No. Material Qty. Cost
(‘000 Birr)
1 Electricity 8,500 (kWh) 4.026
2 Water 6,500 (m3 )
21.125
Total 25.151
V. TECHNOLOGY AND ENGINEERING
A. TECHNOLOGY
1. Process Description
In Ethiopia children that will usually attend kindergartens are of age between three and
six. The three- year program, known as Nursery, Kindergarten 1(lower kindergarten-
LKG) and Kindergarten 2 (upper kindergarten-UKG) prepares children for their first year
in primary school education. Kindergarten is considered the first year of formal
education, although the child may have gone to preschool.
“High/Scope Learning” is a style of learning that is used in many kindergartens in
abroad. This learning style is very interactive and requires a great deal of the children and
the teacher.

181 - 12
A kindergarten schools shall comprise of the following:
. Shall be a full-day program with an option for a four-day or five-day format.
. Shall be integrated program that develops spiritual, physical, emotional and
social growth.
. The classrooms shall have a wide variety of materials that invite the students to
engage in learning through play and enhance the subjects that are taught
throughout the day.
. Systematic instruction shall be provided and progress is monitored through on
going assessments with the goal of mastering letter identification; beginning,
middle and ending sounds; rhymes and syllables.
. Letters shall be taught that can be manipulated to form words.
. Students are to be exposed to frequently used words and are given the
opportunity to read them through guided reading.
. Students shall be taught the formation of letters and numbers as they learn the
names and sounds of the letters each week. A wide variety of materials are used
to practice the letters after students have traced them on the chalkboard.
. Hands on activities, utilizing a wide variety of materials, are used to enhance the
math lessons in kindergarten. Math is a program that uses various materials to
teach the basic skills of counting, number concepts, patterning, graphing,
measuring, weighing, addition and subtraction. The goal is for students to
understand and articulate the concepts taught in math.
. The scientific method shall be introduced in conjunction with various books
about creation.
. Students have to be encouraged to hypothesize about clouds, water, rocks,
plants, apples. Pumpkins, fish, etc.
. Machines and the five senses are two of the favorite themes presented later in
the school year and serve to enhance the fun of science experiments.
. Students shall be exposed to books, songs, food and activities that teach about
friendship, holidays and famous people. These themes are emphasized

181 - 13
throughout the calendar years.
. Kindergarten students shall attend art, computer, library, music and
physical education each week.
. Field trips are designed to enhance lessons.
Play forms the key note for kindergarten while aiming at optimal development of
children. Interesting teacher guided activities like singing, dancing, dramatic play, oral
expression, story telling, informal physical education, the morning assembly and the
creative sessions expose the child to an entire new world where learning is fun, exciting
and something to look forward to.
To inculcate in them a sprit of confidence, participation and sportsmanship, the school
shall offer a range of indoor and outdoor games.
2. Sources of Technology
The machinery and equipment required can be obtained from the following company.
BABY STYLE UK LIMITED
36 Charles Street,
Sileby, Leicestershire
LE 12 7RJ
ENGLAND
Ph: +44 (0) 1509 816 444
Fax: + 44 (0) 1509 816 555
E-mail:[email protected]
B. ENGINEERING
1. Machinery and Equipment
The list of machinery and equipment is given in Table 5.1. The total machinery and
equipment cost is estimated at Birr 513,700, which is totally required in local currency.

181 - 14
Table 5.1
MACHINERY AND EQUIPMENT REQUIRMENT AND COST
Sr. No. Description Qty Total cost
1 Out door playing equipment (slides, swings, climbing frames, sand box, play houses, trampolines etc.)
7 Set 45,000
2 Indoor playing equipment (various child educational toys)
L.S 3,500
3 Children beds and kids bedroom accessories
L.S 10,000-
4 Computers 35 175,000-
5 TV & Video set 5 22,500-
6 Refrigeration 2 9,000-
7 Chairs and tables 1,850 231,250-
8 Teaching materials (Black boards, slides etc.)
L.S 17,450-
Total 513,700-
2. Land, Building and Civil Works
The envisaged project will require a total land area of 3,500m2 of which 1,950m
2 is built
up area. 150m2 will be covered by office buildings, 100m
2 by stores, 300m
2 by playing
rooms, 600m2 bed rooms, 800m
2 by class rooms etc. The total cost of building and civil
works at a rate of about Birr 2,300 per m2 will be Birr 4,485,000. .
According to the Federal Legislation on the Lease Holding of Urban Land (Proclamation
No 272/2002) in principle, urban land permit by lease is on auction or negotiation basis,
however, the time and condition of applying the proclamation shall be determined by the
concerned regional or city governments depending on the level of development.
In Addis Ababa the city’s Land Administration And Development Authority is directly
responsible in dealing with matters concerning land. Accordingly, the initial land lease
rate in Addis Ababa set by the Authority based on the location of land is as shown in
Table 5.2.

181 - 15
Table 5.2
INITIAL LAND LEASE RATE IN ADDIS ABABA
Sr.
No Location of the land
Land
Grade
Initial Price in
m2
1
Central Business zones
1
2
3
4
5
1167.3
1062.9
916.2
751.5
619.2
2
Places that are Under
Transit
1
2
3
4
5
716.4
647.1
559.8
472.5
384.3
3
Expansion Zones
1
2
3
4
245.7
207
150.3
132.3
Source; Addis Ababa City Land Administration Authority.
As can be seen from Table 5.2, the initial land lease rate ranges from Birr 1,167.3 to
132.3 per m2 .
Currently, most of the educational facilities in Addis Ababa are located on the central
business zones of the city. Therefore, expansion zones are recommended as the best
locations for the project. Accordingly, the average of the land lease rates in the expansion
zones which is Birr 183.8 m2 is adopted.
The Federal Legislation on the Lease Holding of Urban Land legislation has also set the
maximum on lease period and the payment of lease prices (see Table 5.3 and Table 5.4).

181 - 16
Table 5.3
LEASE PERIOD
Type of Service
Lease Period
( Years)
Residential area 99
Industry 80
Education, cultural research health, sport,
NGO and religious 99
Trade 70
Urban Agriculture 15
Other service 70
Table 5.4
LEASE PAYMENT PERIOD
Sr.
No. Service Type
Period of Payment
According to the Grade of
Towns
1
Private residential are obtained
through tender or negotiation 50 - 60 years
2 Trade 40 - 50 years
3 Industry 40 - 50 years
4 Real estate 40 years
5 Urban Agriculture 8 - 10 years
6 Trade and social service 40 - 50 years
7 Others 40 years
Moreover, advance payment of lease based on the type of investment ranges from 5% to
10%. For those that pay the entire amount of the lease will receive 0.5% discount from
the total lease value and those that pay in installments will be charged interest based on
the prevailing interest rate of banks. Moreover, based on the type of investment, two to
seven years grace period shall also be provided. The lease price is payable after the grace
period annually.

181 - 17
Regarding, the terms and conditions of land lease the Addis Ababa City Government
have adopted Article 6 of the Federal Legislation with very minimal changes. Therefore,
for the purpose of this project profile since the project is engaged in social service , 99
years lease period, 50 years lease payment completion period, 5% down payment and
seven years grace period is used.
Accordingly, the land lease cost of the project, at rate of Birr 183.8 per m2 for 99 years of
holding is estimated at Birr 63.69 million. Assuming 5% of the total cost ( Birr 3.18 ) will
be paid in advance as down payment and the remaining Birr 60.50 million will be paid in
equal installments with in 50 years, the annual lease payment is estimated at Birr
1,210,047.
VI. MANPOWER & TRAINING REQUIREMENT
A. MANPOWER REQUIREMENT
The plant will require 79 workers. The annual labour cost is estimated at Birr 729,750.
The detail breakdown of manpower requirement and annual salary expense is shown in
Table 6.1.

181 - 18
Table 6.1
MANPOWER REQUIREMENT AND COST
Salary (Birr) Sr. No.
Position Required
No. Monthly Annual
1 Director 1 3,500 42,000
2 Assistance Director 1 2,800 33,600
3 Unit leader 1 2,400 28,800
4 Accountant 1 1,500 18,000
5 Cashier 1 600 7,200
6 General Service 8 2,800 33,600
7 Guards 3 1,050 12,600
8 Nurse 1 1,500 18,000
9 Teachers 30 18,000 216,000
10 Assistance teachers 30 13,500 162,000
11 Driver 2 1,000 12,000
Sub-Total 79 583,800
Employee's Benefits ( 25% of Basic salary)
145,950
Total 79 729,750
B. TRAINING REQUIREMENT
It is suggested to train teachers and assistant teachers for a period of three month. The
training will be given by one of the institutions available locally. The cost of such
training is estimated at Birr 50,000.
VII. FINANCIAL ANALYSIS
The financial analysis of the kindergarten project is based on the data presented in the
previous chapters and the following assumptions:-
Construction period 1 year
Source of finance 30 % equity

181 - 19
70 % loan
Bank interest 8.5%
Discount cash flow 8.5%
Accounts receivable 30 days
Raw material local 30 days
Cash in hand 5 days
Accounts payable 30 days
Repair and maintenance 5% of machinery cost
A. TOTAL INITIAL INVESTMENT COST
The total investment cost of the project including working capital is estimated at Birr
9.49 million.. The major breakdown of the total initial investment cost is shown in Table
7.1.
Table 7.1
INITIAL INVESTMENT COST
Sr.
No.
Cost Items Local
Cost
Foreign
Cost
Total
Cost
1 Land lease value 3,180.00 - 3,180.00
2 Building and Civil Work 4,485.00 - 4,485.00
3 Machinery and Equipment 513.7 - 513.70
4 Office Furniture and Equipment 125.00 - 125.00
5 Vehicle 450.00 - 450.00
6 Pre-production Expenditure* 731.31 - 731.31
7 Working Capital 11.94 - 11.94
Total Investment cost 9,496.95 - 9,496.95
* N.B Pre-production expenditure includes interest during construction ( Birr 581.31
thousand), training ( Birr 50 thousand) and Birr 100 thousand costs of registration,
licensing and formation of the company including legal fees, commissioning
expenses, etc.

181 - 20
B. OPERATING COST
The annual operating cost at full capacity operation is estimated at Birr 1.65 million
(see Table 7.2). The major components of the operation cost are financial cost,
depreciation and direct labour which account for 28.05%, 24.68% and 21.18%
respectively. The remaining 26.08 % is the share of material and inputs, utility, labour
overhead, repair and maintenance and administration cost.
Table 7.2
ANNUAL PRODUCTION COST AT FULL CAPACITY ('000 BIRR)
Items Cost %
Material and Inputs 36.00 2.18
Utilities 25.15 1.52
Maintenance and repair 25.69 1.55
Labour direct 350.28 21.18
Labour overheads 145.95 8.83
Administration Costs 198.49 12.00
Land Lease Cost - -
Total Operating Costs 781.56 47.27
Depreciation 408.12 24.68
Cost of Finance 463.76 28.05
Total Production Cost
1,653.44 100
C. FINANCIAL EVALUATION
1. Profitability
Based on the projected profit and loss statement, the project will generate a profit through
out its operation life. Annual net profit after tax will grow from Birr 373.72 thousand to
Birr 1.33 million during the life of the project. Moreover, at the end of the project life the
accumulated cash flow amounts to Birr 11.10 million.

181 - 21
2. Ratios
In financial analysis financial ratios and efficiency ratios are used as an index or yard
stick for evaluating the financial position of a firm. It is also an indicator for the strength
and weakness of the firm or a project. Using the year-end balance sheet figures and other
relevant data, the most important ratios such as return on sales which is computed by
dividing net income by revenue, return on assets ( operating income divided by assets),
return on equity ( net profit divided by equity) and return on total investment ( net profit
plus interest divided by total investment) has been carried out over the period of the
project life and all the results are found to be satisfactory.
4. Break-even Analysis
The break-even analysis establishes a relationship between operation costs and revenues.
It indicates the level at which costs and revenue are in equilibrium. To this end, the
break-even point of the project including cost of finance when it starts to operate at full
capacity ( year 3) is estimated by using income statement projection.
BE = Fixed Cost = 28 %
Sales – Variable Cost
4. Payback Period
The pay back period, also called pay – off period is defined as the period required to
recover the original investment outlay through the accumulated net cash flows earned by
the project. Accordingly, based on the projected cash flow it is estimated that the
project’s initial investment will be fully recovered within 5 years.

181 - 22
5. Internal Rate of Return
The internal rate of return (IRR) is the annualized effective compounded return rate that
can be earned on the invested capital, i.e., the yield on the investment. Put another way,
the internal rate of return for an investment is the discount rate that makes the net present
value of the investment's income stream total to zero. It is an indicator of the efficiency or
quality of an investment. A project is a good investment proposition if its IRR is greater
than the rate of return that could be earned by alternate investments or putting the money
in a bank account. Accordingly, the IRR of this project is computed to be 17.32 %
indicating the viability of the project.
6. Net Present Value
Net present value (NPV) is defined as the total present ( discounted) value of a time
series of cash flows. NPV aggregates cash flows that occur during different periods of
time during the life of a project in to a common measuring unit i.e. present value. It is a
standard method for using the time value of money to appraise long-term projects. NPV
is an indicator of how much value an investment or project adds to the capital invested. In
principal a project is accepted if the NPV is non-negative.
Accordingly, the net present value of the project at 8.5% discount rate is found to be
Birr 4.46 million which is acceptable.
D. ECONOMIC BENEFITS
The project can create employment for 79 persons. In addition to supply of the domestic
needs, the project will generate Birr 2.84 million in terms of tax revenue.