Embed Size (px)
Citation preview

8/12/2019 189872695 Choosing the Right Eggs
http://slidepdf.com/reader/full/189872695-choosing-the-right-eggs 1/19
Inte rnationa l Journal of M arket Research Vol 54 Issue 5
Choosing the right baskets for your eggs
Deriving actionable customer segments using
supervised genetic algorithms
Sam DavisT
In the context of key d river analysis in applied customer satisfaction research, the
assumption of sample homog eneity (that single models perform adequately over
the entirety of a survey sample) can be shown to restrict the value of the insights
derived. While latent class regression has been used as a method of circumventing
some of these issues, it is proposed that there are major barriers to both uptake
and successful practical usage of the techn ique. Several of these issues are common
to any multivariate techn ique, w hile o thers are specific to latent class regression.
Following an exam ination of these issues, we introduce an alternative technique
for deriving discrete latent classes, using a combination of genetic algorithms
and (bivariate) correlations. This paper concludes that the proposed approachoutperforms latent class regression in its ability to deliver action-orientated
insights, and is better placed to assist marketers facing real-world research
questions and datasets.
ntroduction and theoretical perspectives
A common issue facing market researchers is determining the importanceof a particular variable, or set of variables, in influencing another:
W hat drives satisfaction? or How do I improve my brand image? are
particularly common questions. The analytic techniques used to answerthese questions can be grouped under the umbrella term of key driveranalysis (hereafter, KDA).
KDA can range from simply asking people directly what they think is
important, to a range of more complex statistical m ethods. D irect methods
are generally not commonplace in contemporary market research largely

8/12/2019 189872695 Choosing the Right Eggs
http://slidepdf.com/reader/full/189872695-choosing-the-right-eggs 2/19
Choosing the right baskets for your eggs
because of respondents propensity to focus on more obvious areas suchas price. It is also commonplace for respondents to claim that everythingis important (among others. Bacon 2003).
There is almost continual debate over the best indirect analytictechniques to answer these sorts of questions, but most arguments do notconsider that different people tend to be motivated by different things -or, more formally, they take the view that the sample is homogenous. Thisassumption of sample homogeneity can be limiting. A simple yet powerfulillustration is given below.
Imagine that we have been asked to determine the factors that most
influence the purchasing of digital cameras. We may develop a set ofscales designed to measure performance on areas that are thought toinfluence purchasing, and then attempt to determine their influencestatistically.
Three areas are tested: (1) price; (2) user-friendliness; and (3) the abilityto customise camera components. We could then use multiple regression(hereafter, MR) to determine both the combined effect of these three areason purchasing as well as the relative importance of each area. With sucha methodology we may well find that we achieve only a poor ability to
predict purchasing and that each of the three areas is a relatively weakdriver.
It is not uncommon to report these results as-is, and a fairly literaltranslation of this for the end-user of the research would be that they canafford to under-deliver in these areas. Outside of the narrow context ofthese statistics this is highly unlikely to be the case; the result may havecome about at least partly because of a violation of the assumption ofsample homogeneity. In reality, it is likely that there are several underlyinggroups with differing drivers of purchase. Grouping these together as asingle analysis sample cancels out these effects, and weakens the analysisand the conclusions we may draw.
Latent class regression (hereafter, LCR) is a variation of MR that doesnot assume sample homogeneity. It works by defining segments accordingto respondents motivations, and runs regression models for each of thesegroups separately (Pinnell 2003).
In the presence of underlying sample heterogeneity, LCR offersadvantages over single-sample models, yet seems not to have come into
widespread use. This paper asserts that this is likely to be a result of severalbarriers:

8/12/2019 189872695 Choosing the Right Eggs
http://slidepdf.com/reader/full/189872695-choosing-the-right-eggs 3/19
Intern ationa l Journa l of Ma rket Research Vol 54 Issue 5
• relatively low awareness of these techniques compared to single-samplemethods
• LCR tends to perform poorly in delivering a practically usefulframework
• a disconnect between the textbook data we often see in theoreticalliterature on this topic and the realities of live survey data.
While we argue that tbe objective of LCR is indeed conceptually imperativein many instances, we also contend tbat the application of LCR raisessome concerns.
This paper examines tbe issues associated with applied usage of LCR,and sbows how it may potentially lead to sub-optimal conclusions.Two further assertions are made, as follows.
1. Subjectivity is critical in this area - the expertise of the researchercounts a great deal.
2. In tbis field, multivariate analysis methods themselves may not be bestsuited to the research problem and/or data.
Once the case for these claims has been established, an alternative methodtbat upbolds the principles of LCR yet seems to offer more actionableresults will be introduced.
Before continuing, it is important to note that this paper is not intendedas a statistical discussion of this area, but is focused on pplied us ge forresearch practitioners and users. A basic understanding of the principles ofcorrelation and regression-based metbods is assumed.
Multiple regression in customer satisfaction research
he du l positioning of mu ltiple regression
Tbe objective of MR is to understand bow well a set of predictorsinfluences a single variable usually one that is linked to a criticalcommercial outcome), and in particular how important tbese predictorsare in relation to one another.
Any reader of introductory, or not so introductory, texts discussing
analytics in market research would assume tbat MR is not only amongour most powerful tools, but is also used with a great deal of frequency.

8/12/2019 189872695 Choosing the Right Eggs
http://slidepdf.com/reader/full/189872695-choosing-the-right-eggs 4/19
hoosing the righ t baskets for your eggs
research problems and, in our experience, its use is on the decline as a
result. Consequently it has given way to a range of more sophisticated
techniques, most of which remain related to MR, however.
We shall now turn to a brief discussion of these shortcomings and
describe how commonly applied statistical remedies to counteract them fail
to do so because these are not truly statistical in nature. Instead, these tend
to be a result of the divide between textbook statistics and the real-world
properties of customer satisfaction survey data. Grapentine (1997) notes
that textbook examples in the area tend to offer very little in the way of a
meaningful discussion of applied issues, leaving practitioners ill-equipped
to handle these.
ulticollinearity and the particular d ngers of spurious multicollinearity
Multicollinearity is defined as the scenario where the variables we are
using to predict an outcome are, themselves, related to each other (among
man y othe rs, Tabachnik Fidell 20 01 ). Let's imagine we we re testing
the combined effect of age and length of time in tertiary education on
intelligence test performance among university students.
MR will not work adequately here if our objective is to understandwhether age or duration is the more important factor. This is simply
because these are so interrelated that the influence of each cannot be
accurately divided between them.
This specific example is in contrast to many of the multicollinearity
problems we face in applied customer satisfaction research because the
relationship between these predictors is logically necessary, albeit imperfect.
ecessary relationships seldom exist in customer satisfaction data: it is
typical to observe very high levels of multicollinearity even where there is
not a logical relationship. This is often the result of the 'halo effect' of a
product or brand - i.e. these are generally just good or bad across a wide
range of areas we are measuring. This issue is compounded by research
users' need for a level of granularity that a survey respondent struggles
to provide. This paper will refer to this as spurious multicollinearity and
contends that this is a special (applied) case of the problem that statistical
interventions cannot solve.
The example in Table 1 shows a correlation matrix between variables
from a real-life study exam ining custom er satisfaction w ith an o rgan isation'swebsite.

8/12/2019 189872695 Choosing the Right Eggs
http://slidepdf.com/reader/full/189872695-choosing-the-right-eggs 5/19
Intern ationa l Journ al of Ma rket Research Vol. 54 Issue 5
Table 1 I l lustrat ion of spurious mu lt icol l inearity webs ite sat isfaction: Pearson correlat ion
Ease of nav igating website
Functionality of website
Speed of w ebsite
Reliability of website
Ease of navigatingwebsite
1
0.77
0.72
0.48
Functionalityof website
0.77
1
0.72
0.59
Speed ofwebsite
0.72
0 72
1
0.67
Reliability ofwebsite
0 48
0 59
0 67
1
four variables, and that all we have really been able to measure is that a
website is perceived by respondents as either good or bad. This does not
mean, of course, tbat these factors are unimportant in defining wbat goodor bad means.
We must also note here that, wbile tbese relationships make sense, they
are certainly not necessary Re liability as it is defined here is inte nd ed
to mean that the website does not crash. Clearly tbis has no necessary
relationship with tbe ease of navigating the website in the way that the
research user was intending - essentially tbat various components of the
website were easy to find while the website was functioning It follows,
tben, tbat tbe end user will require a separate understanding of these issues.
When we correlate these individual variables against an overallsatisfaction metric we would expect to find little to choose between them,
as is indeed tbe case (Table 2).
Table 2 Flat correlat ions em erging from mult icol l inear predictors: Pearson correlat ion
Ease of naviga ting website
Functionality of website
Speed of w ebsiteReliability of w ebsite
Overall company satisfaction m easure
0 40
0 44
0 530 42
These correlations suggest tbat all tbe variables in tbe analysis have a
moderate influence on satisfaction. Of course it would be a mistake to
presume a causal relationsbip.
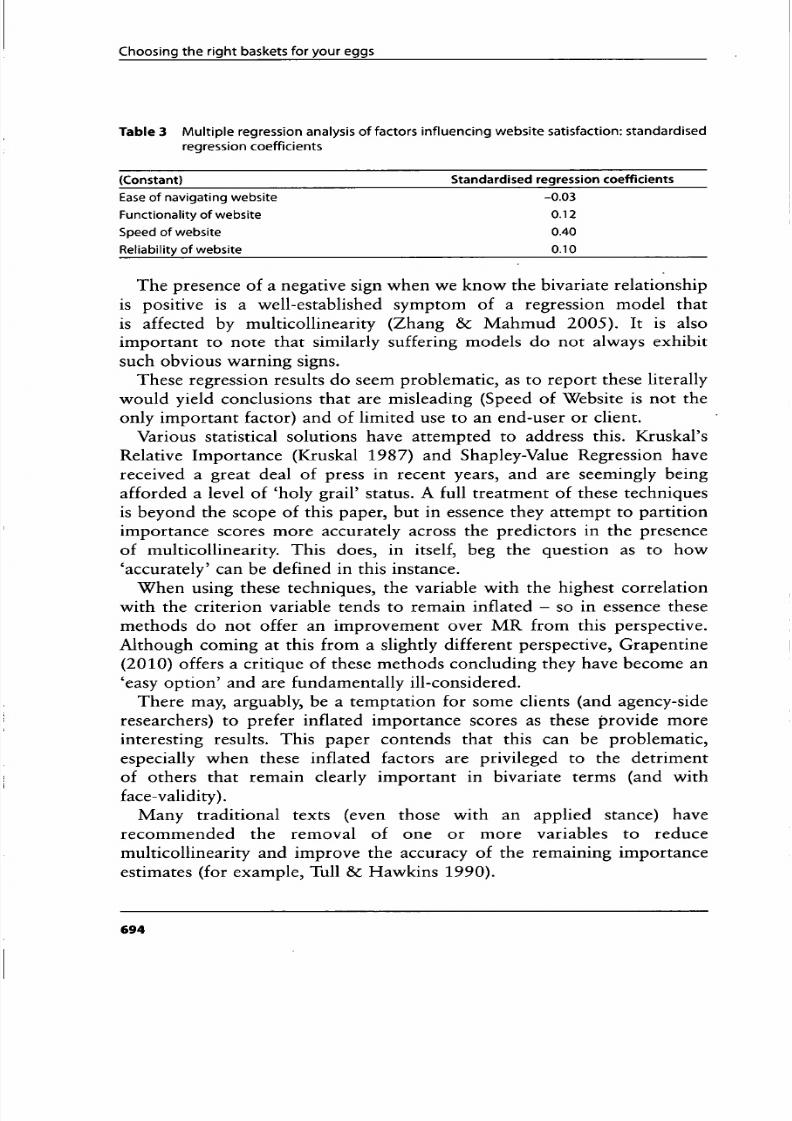
A regression analysis paints a very different picture. Tbe standardised
regression coefficients are given in Table 3.
It is clear from tbe re gression coefficients tba t Speed of Website is far and
away tbe most important factor. We know, however, that tbis extremityis not the case if we simply consider the correlations. In addition, a very
8/12/2019 189872695 Choosing the Right Eggs
http://slidepdf.com/reader/full/189872695-choosing-the-right-eggs 6/19
Choosing the right baskets for your eggs
Table Multiple regression analysis of factors influencing Vkiebsite satisfaction: standardised
regression coefficients
Constant)
Ease of navig atin g v>/ebsite
Fun ctionality of v\/ebsite
Speed of website
Reliability of website
Standardised regression coefficients
0.03
0.12
0.40
0.10
The presence of a negative sign when we know the bivariate relationshipis positive is a well-established symptom of a regression model that
is affected by multicollinearity (Zhang c Mahmud 2005). It is alsoimportant to note that similarly suffering models do not always exhibitsuch obvious warning signs.
These regression results do seem problematic, as to report these literallywould yield conclusions that are misleading (Speed of Website is not theonly important factor) and of hmited use to an end-user or client.
Various statistical solutions have attem pted to address this. Kruskal s
Relative Importance (Kruskal 1987) and Shapley-Value Regression havereceived a great deal of press in recent years, and are seemingly being
afforded a level of holy gra il status. A full trea tment of these techniquesis beyond the scope of this paper, but in essence they attempt to partition
importance scores more accurately across the predictors in the presenceof multicollinearity. This does, in itself beg the question as to how accurately can be defined in this instance.
When using these techniques, the variable with the highest correlationwith the criterion variable tends to remain inflated - so in essence thesemethods do not offer an improvement over MR from this perspective.
Although coming at this from a slightly different perspective, Grapentine(2010) offers a critique of these methods concluding they have become an easy op tion and are fundamentally ill-considered.
There may, arguably, be a temptation for some clients (and agency-sideresearchers) to prefer inflated importance scores as these provide moreinteresting results. This paper contends that this can be problematic,
especially when these inflated factors are privileged to the detrimentof others that remain clearly important in bivariate terms (and withface-validity).
Many traditional texts (even those with an applied stance) haverecommended the removal of one or more variables to reduce
8/12/2019 189872695 Choosing the Right Eggs
http://slidepdf.com/reader/full/189872695-choosing-the-right-eggs 7/19
Intern ation al Journal o f Mark et Research Vol 54 Issue 5
While there are obviously good statistical reasons for removing
variables, this tends to cause concern for clients and end-users. It isdifficult to recommend this approach as clients simply need a method thatallows them a view of all the areas included in the questionnaire.
Another frequently proposed remedy is to use factor analysis to reducethe predictors into a smaller number of independent factors. This willsolve the multicollinearity problem statistically but does not fare anybetter as clients tend not to be able to do much with 'factors'. This isparticularly true in the event of spurious multicollinearity as we will begrouping together areas with very little intuitive or practical connection.
Again, we should note that the same applied text (TuU Hawkins 1990)is one of many that advocate this approach.
Given the frequency of detecting spurious multicollinearity in customersatisfaction studies, it is clear that practical solutions are required. Itseems that proposed solutions are either not sufficiently cognisant of therealities of the practical needs of clients or simply do not offer a superioralternative to conventional MR.
ystematically missin data
further barrier to the use of MR is that multivariate analysis requiresthat all cases (usually respondents) contain usable data for all the variablesused in a model. This is seldom the case in customer satisfaction studies. Acommon study design will ask a set of satisfaction or performance questions(generally in the form of Likert scales) across a wide range of respondents'interactions with a product or brand. A single study, for example, may askrespondents to comment on their levels of satisfaction with both the taste
of a breakfast cereal as well as how satisfied they were with the customerhelpline in the event they needed to raise a complaint.
Most customers will have tasted the cereal but few will have calledthe helpline. As a result we do not have the complete dataset required toperform the analysis. It is notable that, when the helpline has been called,it is likely to have been in order to complain.
Again, many proposed solutions do not fully reflect the reality ofapplied research. Predictably, perhaps, one of these is the removal ofvariables that contain the most missing values in order to reduce the
amount of cases/respondents this affects (Hair et al 2010). This minimisesthe amount of sample that needs to be excluded from the analysis in order

8/12/2019 189872695 Choosing the Right Eggs
http://slidepdf.com/reader/full/189872695-choosing-the-right-eggs 8/19

8/12/2019 189872695 Choosing the Right Eggs
http://slidepdf.com/reader/full/189872695-choosing-the-right-eggs 9/19
Intern ationa l Journa l of Ma rket Research Vol 54 Issue 5
multivariate techniques grow in usage, their status becomes increasinglydifficult to challenge. While it is undoubtedly true that multivariate analysisoffers a wealth of power that bivariate techniques cannot hope to emulatein certain settings, this is certainly not true in all applications. Grapentine 1997) argues that researchers should exercise caution when using bivariatemethods to assess the importance of variables in KDA because of theadvantage of MR holding additional predictors constant when determiningimportance. This paper has already shown that there are other practicalconcerns to consider when using MR that may outweigh the advantages itoffers in some circumstances.
Late nt class regression
LCR works by finding a set of regression models that maximises theexplanatory power of the relationships between the predictors and thecriterion variable by finding groups with differing regression coefficients or importance scores). The end result is that the analysis produces anotherwise conventional M R analysis on these groups. In effect, then, it is acombination of regression modelling and segmentation analysis Vermunt
C Magidson 2002; Pinnell 2003) with the result that we are left withgroups that are motivated in different ways.
Generally we find that each of the latent classes/segments identifiedachieves substantially improved model fit compared to a single-samplemodel. This is generally considered an indication that the analysis has beensuccessful in uncovering and accounting for heterogeneous samples.
Support of this basic premise of LCR has already been noted, but it s nowimportant to discuss potential weaknesses that emerge in the course of theshift from theory to practice. Given that LCR is a multivariate technique,the problems relating to spurious multicollinearity and systematic missingdata already raise some serious challenges. In addition two further, morespecific, issues raise further questions over the usefulness of the method.These are discussed in more detail in the following sections.
h dangers of over fitting
In the context of MR the concept of over-fitting usually refers to a scenario
where the explanatory power of a model is inflated because of a highnumber of predictor variables. This is particularly the case with a high

8/12/2019 189872695 Choosing the Right Eggs
http://slidepdf.com/reader/full/189872695-choosing-the-right-eggs 10/19
hoosing the righ t baskets for your eggs
Using 12 random predictor variables in a single-sample MR yielded lowlevels of model fit (as we would expect). We tben performed LCR usingthe same variables and were able to detect four latent classes witb verystrong model fit:
Class 1:R2 = 0.83Class 2: K = 0.84Class 3: Ä^ = 0.87Class 4: R^ 0.84
In effect, we are able to use LCR to create a sense of order andpredictability where none can exist in reality. The fact is tha t we simply willfind statistically differentiated groups (witb high R} statistics) because tbeanalysis cannot fail to do so. To expect anytbing different would be akinto asking a computer to produce a sbape otber than a triangle out of threeadjoined sides.
If a similar result occurred in practice it is highly likely that tbe LCRapproach is modelling as much noise as it is signal in its effort to increasethe explanatory power achieved by a single-sample model. In addition,
while excellent levels of explanatory power may be acbieved in tbe singledataset in question, it is almost unfeasible tbat sucb an over-fitted modelcould be repeated in another sample.
Surely, then, tbe underlying reality of the scenario we may infer fromthese results can be questioned. With substantial marketing and productdevelopment budgets on tbe line, how much of the researcher s powershould really be surrendered to tbe results produced by tbe analytic software?
We sball return to tbis in more detail wben looking at a practicalexample below.
ifferentiation of raw input v ri bles cross latent cl sses
Wben profiling the segments detected using LCR we tend to find very littledifferentiation between classes wben looking at tbe raw r spons s to tbevariables used in the model (as opposed to a different pattern of regressioncoefficients). In otber words, tbere is often limited ability to describe theresulting segments using criteria external to tbe regression model itself
It is accepted tbat not providing for differentiation in the original modelvariables is not a self-evident disadvantage of LCR, given tbis is not an

8/12/2019 189872695 Choosing the Right Eggs
http://slidepdf.com/reader/full/189872695-choosing-the-right-eggs 11/19
Intern ationa l Journal of M arket Research Vol 54 Issue 5
the technique as a segmentation tool for that very reason. Analysts can(correctly, from a statistical perspective) explain the lack of differentiationin the original variables, but it takes an unusually statistics-driven client toaccept a solution with these characteristics.
So while we concede that achieving differentiation on additionalprofiling variables or the raw inputs themselves is not top priority, wewould certainly favour a technique that would enable us to achieve thisto some degree.
Offering an alternative supervised methods using genetic
algorithms
Up to this point we have raised several issues regarding the use of LCRin practice. We will now show that a technique using supervise geneticalgorithms can account for sample heterogeneity while achieving morepractically useful results.
The following section will briefly introduce the theory behind geneticalgorithms before describing how these can be brought to bear on theproblem. Finally, it will be demonstrated, through comparative analysis
between methods, that this approach offers some tangible practicaladvantages over LCR.
brief introduction to genetic algorithms
Genetic algorithms (hereafter, GAs) were proposed (Holland 1975) as amethod of solving optimisation problems based on the principles of naturalselection. The GA process is outlined more fully in other texts, (amongothers Steiner Hruschka 2003), but a basic overview is given here.
A set (or 'population', in GA terminology) of potential solutions to agiven problem is generated, and the performance of each is assessed with
respect to how well the problem is solved. Following a series of trials (thenumber of which is specified by the researcher) the 'fittest' solutions areselected to remain in the solution population. These potential solutionsthen give rise to a new generation of solutions by passing on characteristics
that are useful in solving the problem. The process is then repeated untila satisfactory level of performance is reached. In addition to this process
of 'adaptation' and 'breeding', solutions may also be allowed to randomlymutate. This ensures that the algorithm does not evolve along a single

8/12/2019 189872695 Choosing the Right Eggs
http://slidepdf.com/reader/full/189872695-choosing-the-right-eggs 12/19
Choosing the right baskets for your eggs
he role of supervision in the process
A useful characteristic of GAs is tbat a solution can be aimed not only
at improving a particular objective, but constraints can also be placed
on specific parameters of the solution. The importance of tbis will be
elaborated on more fully below, but it sbould be clear tbat it is tbis ability
to constrain tbe results tbat adds a great deal of power to tbe analysis,
given tbe concerns raised witb regard to over-fitting in LCR.
We should consider a potential objection tbat may stem from tbis
point: tbat a researcber should be in the business of finding answers, not
co-creating tbem. In tbe experience of tbe author, there are two types of
niarket research client: tbe first views statistical analysis as a tool to ssistin answering a business question, and the second believes in the objective
trutb of 'clean statistics' - or statistical truths that emerge from tbe data
that sbould not be tinkered witb at any cost.
Tbis paper argues that a balance between tbese two poles is optimal. We
sbould neither blindly accept the results generated by analytic software, nor
sbould we take so much of a lead role in shaping tbe analysis tbat the results
take on an overly 'manufactured' form, for botb practical and ethical reasons.
Co ntem po rary literature on tbe topic of ma rket segmentation s particularly
sensitive to this spectrum (Bottomley C Nairn 2004; Stewart-HunterBergentbal 2004). In tbis field, tbere is a sbift towards allowing a researcber
to generate tbe most useful results by employing a degree of subjectivity.
Otber applications of statistics in market researcb (KDA included)
seem to have fallen bebind a little and remain more witbin an 'emergent
truth' school of thought. We believe that allowing the researcher to take
a supervisory role minimises tbe risk of over-fitted results tbat we have
already demonstrated and allows for more usable results.
pplying genetic algorithms to accoun t for sample heterogeneity in key
driver analysis
We bave set up several experiments to assess bow we can combine
correlation analysis witb GAs to allow us to identify discrete 'latent classes'
while overcoming the issues illustrated above. Due to constraints of space,
bowever, we are able to discuss only one example in detail (given further
below in tbis paper).
Tbe key characteristics of the approacb are as follows:

8/12/2019 189872695 Choosing the Right Eggs
http://slidepdf.com/reader/full/189872695-choosing-the-right-eggs 13/19
8/12/2019 189872695 Choosing the Right Eggs
http://slidepdf.com/reader/full/189872695-choosing-the-right-eggs 14/19
Choosing the right baskets for your eggs
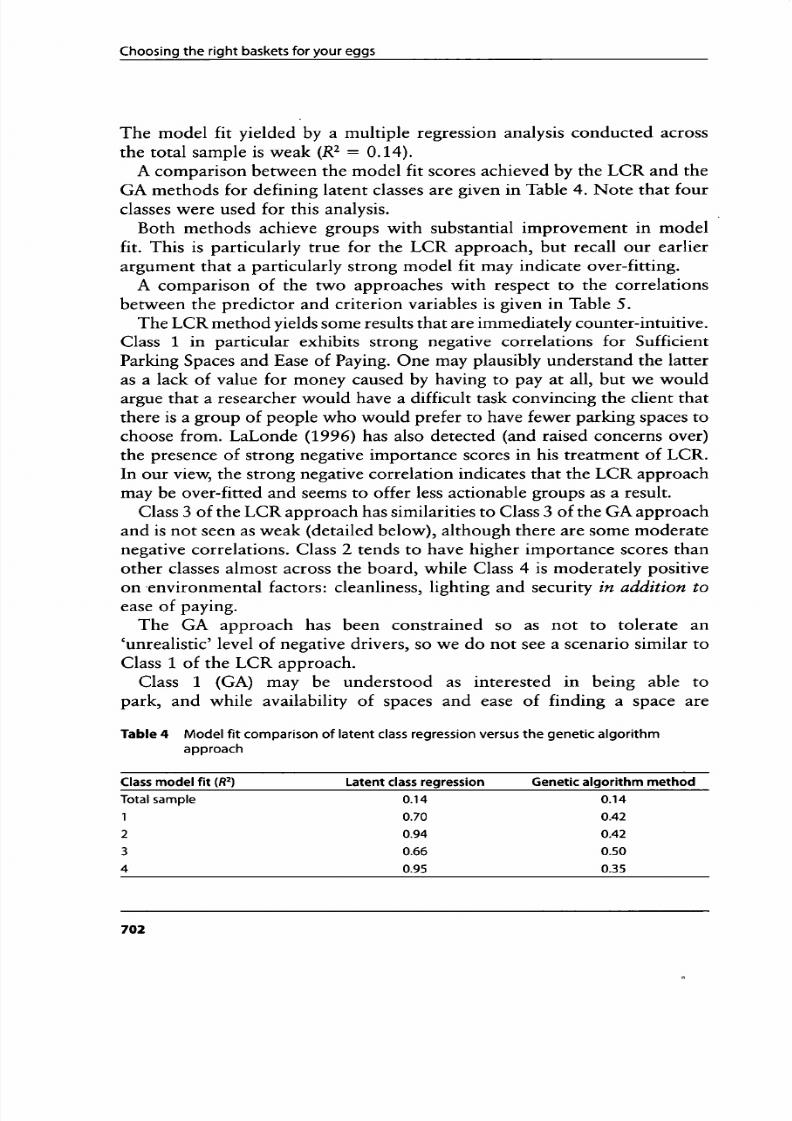
Tbe model fit yielded by a multiple regression analysis conducted across
tbe total sample is weak {R ̂ 0.14).
A comparison between tbe model fit scores achieved by tbe LCR and tbe
GA metbods for defining latent classes are given in Table 4. Note that four
classes were used for tbis analysis.
Both metbods acbieve groups witb substantial improvement in model
fit. Tbis is particularly true for tbe LCR approacb, but recall our earlier
argument that a particularly strong model fit may indicate over-fitting.
A comparison of tbe two approaches with respect to the correlations
between the predictor and criterion variables is given in Table 5.
Th e LCR m etho d yields some results that are imm ediately counter-intuitive.Class 1 in par ticula r exh ibits stro ng negative corre lations for Sufficient
Parking Spaces and Ease of Paying. One may plausibly understand tbe latter
as a lack of value for money caused by having to pay at all, but we would
argue tbat a researcber would have a difficult task convincing tbe client that
there is a grou p of people w ho w ould prefer to have fewer parking spaces to
choose from. LaLonde (1996) has also detected (and raised concerns over)
the presence of strong negative importance scores in bis treatment of LCR.
In our view, the strong negative correlation indicates that tbe LCR approach
may be over-fitted and seems to offer less actionable groups as a result.Class 3 of the LCR app roac h has similarities to Class 3 of the GA app roa cb
and is not seen as weak (detailed below), altbougb tbere are some moderate
negative correlations. Class 2 tends to bave higber importance scores tban
other classes almost across tbe board, wbile Class 4 is moderately positive
on environmental factors: cleanliness, lighting and security in addition to
ease of paying.
Tbe GA approacb has been constrained so as not to tolerate an
un rea listic level of nega tive drivers , so we d o no t see a scen ario similar to
Class 1 of the LCR approach.
Class 1 (GA) may be understood as interested in being able to
park, and while availability of spaces and ease of finding a space are
Table 4 Model fit comparison of latent class regression versus the genetic algorithmapproach
Class model f it (R )
Total sample
12
Latent class regression
0.14
0 700.94
Genetic algorithm method
0 14
0 420 42

8/12/2019 189872695 Choosing the Right Eggs
http://slidepdf.com/reader/full/189872695-choosing-the-right-eggs 15/19
Intern ationa l Journ al o f M arket Research Vol. 54 Issue 5
Table 5 Bivariate im por tan ce scores Pearson correlations): latent class regression versus
genet ic a lgor i thm approach
Latent class regression
Genetic algorithm
approach
Correlation with value for money 1
81
0.35
0.15
0.02
0.03
0.04
0.49
0.02
0.01
0.25
2
84
0.84
0.47
0.15
0.17
0.19
0.47
0.12
0.23
0.01
3
66
0.07
0.17
0.31
0.08
0.05
0.80
0.02
0.15
-0.20
4
94
0.06
0.07
0.11
0.04
0.27
0.43
0.49
0.26
0.25
1
70
0.35
0.35
0.60
0.22
0.27
0.14
0.04
0.03
0.04
2
81
0.61
0.40
0.07
0.02
0.09
0.03
0.00
0.07
0.05
3
98
0.05
0.03
0.09
0.04
0.02
0.66
0.10
0.10
0.03
4
76
0.22
0.29
0.19
0.12
0.12
0.29
0.52
0.20
0 34
Class size
Sufficient parking spaces available
Ab ility to fin d a space
Ease of m anoe uvring into a space
Ease of entr y/ex it in to and o ut of the car park
Navigation aroun d the car park
Ease of payin g
The cleanliness of the car park
The level of lig hting in the car park
Feelings of security whilst in the car park
Note: Cells w ith absolute correlations greater than 0.3 are highligh ted for ease of illustration .
certainly influencing factors, ease of getting into and out of spaces is thecritical single factor. This has clear implications, specifically, for the way
that spaces are designed and potentially fitted into existing architecture e.g. positioning pillars in relation to spaces, size of spaces). While the inputvariables do not offer this level of interpretation, it is certainly sufficient towarrant greater investigation of the issue. It is also important to note that
satisfaction with the ease of getting in and out of spaces is relatively low,so we have the additional benefit of being able to note that there is roomfor improvement in this area. This level of differentiation with respect tothe raw variables is not achieved by the LCR approach.
Class 2 GA) are unconcerned about anything other than having
spaces to park in. While Class 2 in the LCR model is also influencedby availability, it is not as distinct in this regard as Class 2 in the GAsolution. The action for this segment is clear, of course, but there arelikely to be barriers to increasing space in many car parks. This is likely
to be a group that it is simply going to be too expensive to please in theshort-term, so meeting their needs may be delayed while easier wins arefound.
Class GA) are focused on ease of paying, and it is worth noting that this
is a group with high levels of satisfaction. While this is an already-satisfiedgroup, they could well be responsive to further innovation in this area.

8/12/2019 189872695 Choosing the Right Eggs
http://slidepdf.com/reader/full/189872695-choosing-the-right-eggs 16/19
hoosing the righ t baskets for your eggs
Class 4 of tbe GA approacb (like Class 4 generated by LCR) is mostdriven by environmental factors of cleanliness, lighting and security. Wbilewe have noted that tbe LCR method yields a class where these issues arealso important it seems to be to the detriment of tbe importance of otheraspects of the car park. We believe that the moderate importance of tbe(potential) hygiene factors of being able to find a parking space addscredibility to the GA version of this group.
Our conclusion based on this comparative exercise is that using theGA approacb offers clear interpretive benefits and greater ability to assistdecision making.
pplying the method to data containing system atically missing v lues
As noted above, systematically missing values cause major problems inderiving importance measures in customer satisfaction studies. This ismost critically so in the specific context of multivariate analysis.
LCR simply cannot handle missing values without eitber removing somecombination of variables and/or cases from the analysis, or imputing datafrom an unrepresentative sub-sample. We have argued that adopting either
of tbese approacbes is a cause for concern.Bivariate metbods are not so hampered by missing data. By extension,
therefore, neither is the GA methodology described above.We do anticipate an objection to tbe application of tbe GA method to
datasets witb systematically missing values: can tbe method guarantee thata latent class placing high importance on a specific area bas a sufficientlylow level of missing values witbin tbat variable? While our position is thatit must be a strength of tbe approacb tbat tbe analysis is even possible, weshall give this some consideration.
The analysis above details a latent class wbere ease of paying was ofcritical importance. There may, however, be people in tbe sample wbo didnot have to pay for a range of possible reasons. As a result, tbese caseswould not bave valid data recorded for tbis variable.
These people can still, statistically speaking, be represented in tbis latentclass as tbeir otber responses will still contribute to tbe overall sbape ofthe solution. Our grouping still only formally means, among those intbe group wbere X is relevant, X is important . We appreciate that any
substantial number of instances wbere tbis takes place may reduce end-userconfidence in tbe resulting solution.
8/12/2019 189872695 Choosing the Right Eggs
http://slidepdf.com/reader/full/189872695-choosing-the-right-eggs 17/19
Intern ationa l Journal of M arket Research Vol 54 Issue 5
a large number of missing cases for those variables where importance is
high. While this will decrease the m odel fit and the levels of differentiation
between latent classes, the ability to apply this constraint does seem to bea further benefit of the GA approach.
onclusion
While this paper supports the principle of considering sample heterogeneity
in the context of key driver analysis, it also argues that the conventionalmethod used to overcome this - latent class regression - has some
drawbacks when used in applied customer satisfaction research.This paper has focused on four issues concerning the applied usage oflatent class regression:
1. spurious multicollinearity occurs in many customer satisfaction datasets2. systematically missing data are a common occurrence3. over-fitted results that are , at best, difficult to use
4. a tendency for latent classes to offer little differentiation with respectto the raw variables used in the analysis.
Most of these stem from a fundamental disconnect between (sound) theoryand the practical realities that tend to constrain the data generated inresearch of this kind.
Given these concerns we have proposed, and trialled, an alternativeapproach using supervised genetic algorithms to assess bivariate relationships
in order to achieve the primary objective of finding distinct latent classes.Our results showed that the genetic algorithm approach was superior
and, critically, provided us with a way of drawing better commercially
focused conclusions than a latent class regression solution.
cknowledgement
The author would like to thank Ian Brace, Director of Research Methods at
TNS, for his invaluable guidance throughout the preparation of this paper.
References
Allen, D. Rao, T. (2000) Analysis of Customer Satisfaction Data. Wisconsin: Quality Press.
Bacon, D. (2003) A comparison of approaches to importance-performance analysis.

8/12/2019 189872695 Choosing the Right Eggs
http://slidepdf.com/reader/full/189872695-choosing-the-right-eggs 18/19
hoosing the right baskets for your eggs
Bottomley, P. C Nairn, A. (2004) Blinded by science: the managerial consequences of
inadequately validated cluster analysis solutions. International Journal of M arket Research
46, 2, pp. 171-187.Grapentine, T. (1997) Managing mulricollinearity: real-world survey data can create
surrealistic analytic models. Marketing Research 9 3, pp. 10-21.
Grapentine, T. (2010) Taming the troublemaker: a critique of averaging over orderings as an
approach for managing multicollinearity. Marketing Research 22, 4, pp. 14-19.
Hair, J., Anderson , R., Tatham, R. Black, W. (1998) Multivariate Data Analysis. New
Jersey: Prentice Hall.
Hair, J., Black, W , Babin, B. Anderson , R. (2010) Multivariate Data Analysis: A Global .
Perspective. New Jersey: Pearson.
Holland, J.H. (1975) Adaptation in Natural and Artificial Systems. Ann Arbor: University of
Michigan Press.
Kruskal, W. (1987) Relative importance by averaging over orderings. The AmericanStatistician 41, 1, pp. 6—10.
LaLonde, S. (1996) Key driver analysis using latent class regression. Proceedings of the Survey
Research Methods Section, American Statistical Association. Online at: http://www.amstat.
org/sections/srms/proceedings/papers/1996_079.pdf (accessed 31 July 2012).
Pinnell, J. (2003) Improving healthcare markering through market segmentation and targeting.
ESOMAR Healthcare Conference, New York.
Steiner, W Hrusch ka, H . (2003) Genetic algorithms for prod uct design: how well do they
really w ork? International Journal of Market Research 45, 2, pp. 229-240 .
Stewart-Hunter, M. Sc Bergenthal, M. (2004 ) The art and science of consumer segmen tation.
Admap 454, pp. 65-68 .
Tabachnik, B. Fidell, L. (2001) Using Multivariate S tatistics. Needham Heights: AllynBacon.
Tull, D. Haw kins, D. (1990) Marketing Research: Measurement and M ethod (5th edn). New
York: Macmillan.
Vermunt, J. Sc Magidson , J. (2002) Latent class analysis, in J. Hagen aars C A. McCutcheon
(eds) Applied Latent Class Analysis. Cambridge, England: Cambridge University Press,
pp . 89-106.
Zha ng, J. Ma hm ud, L (2005) A simulation study on SPSS ridge regression and ordinary least
squares regression procedures for multicollinearity data. Journal of Applied Statistics 32, 6,
pp . 571-588.
Zucarro, C. (2010) Statistical alchemy - the misuse of factor scores in linear regression.
International Journal of Market Research 52, 4, pp. 511-531 .
bout the author
Sam Davis has been working in market researcb for ten years in operations,client-service and analytic roles - most recently as a director at TNS'sMarketing Science Centre in London. In this role he bas worked witb awide spectrum of clients across many sectors, ranging from government
agencies to EMCG products. Sam's main researcb interests are marketsegmentation and customer satisfaction/loyalty researcb.

8/12/2019 189872695 Choosing the Right Eggs
http://slidepdf.com/reader/full/189872695-choosing-the-right-eggs 19/19
Copyright of International Journal of Market Research is the property of Warc LTD and its content may not be
copied or emailed to multiple sites or posted to a listserv without the copyright holder's express written
permission. However, users may print, download, or email articles for individual use.