Embed Size (px)
Citation preview

19th EPIRA Implementation Status Report (Period Covering April 2011 to October 2011)
Prepared by the Department of Energy With Contributions from Energy Regulatory Commission National Electrification Administration National Power Corporation National Transmission Corporation Philippine Electricity Market Corporation Power Sector Assets and Liabilities Management Corporation

19th Status Report on EPIRA Implementation
CONTENTS I. INTRODUCTION ............................................................................................................................................................. 4 II. PRIVATIZATION ........................................................................................................................................................... 4
A. Privatization of Generating Assets ..................................................................................................................... 4 B. Remaining Assets for Privatization .................................................................................................................... 4 C. Privatization Proceeds............................................................................................................................................. 5 D. Transfer of NPC-IPP to Independent Administrators ................................................................................. 6 E. Concession of the National Transmission Network .................................................................................... 7 F. Sale of Sub-Transmission Assets (STAs) .......................................................................................................... 8
III. ELECTRICITY RATES ................................................................................................................................................ 8 A. PSALM/NPC Effective and Basic Generation Charges ................................................................................ 8 B. Transmission Rates ................................................................................................................................................... 9 C. Distribution Utilities (DUs) Rates ......................................................................................................................... 10
1. Average Effective Electricity Rates ......................................................................................................... 10 2. Regulatory Actions ........................................................................................................................................ 12
C. Administration of Universal Charge (UC) ...................................................................................................... 15 1. Total Collections/Disbursements for UC-ME and UC-EWR .......................................................... 15 2. UC for Stranded Contract Costs (SCC) and Stranded Debts (SD)................................................ 16
D. Assumption of Loans of Electric Cooperatives ............................................................................................ 16 E. Mandatory Rate Reduction (MRR) ................................................................................................................... 17 F. Lifeline Rate Subsidy Program ........................................................................................................................... 17
IV. COMPETITION .......................................................................................................................................................... 18 A. Wholesale Electricity Spot Market Implementation ................................................................................. 18 B. Open Access and Retail Competition ............................................................................................................... 23 C. Market Power Monitoring .................................................................................................................................... 26
V. POWER SUPPLY SECURITY AND RELIABILITY ........................................................................................... 27 VI. TOTAL ELECTRIFICATION .................................................................................................................................. 33
A. Qualified Third Party .............................................................................................................................................. 34 B. Implementation of E.R. 1-94 Program ............................................................................................................ 35 C. Challenges ................................................................................................................................................................... 36
LIST OF ANNEXES ......................................................................................................................................................... 37 Annex 1. TransCo Inspection Report Based on Concession Agreement ................................................ 38 Annex 2. NGCP Related Petitions to ERC as of October 2011..................................................................... 40 Annex 3 – Summary of MERALCO 2011 Residential Unbundled Power Rates .................................... 43 Annex 4. NPC Generation Charges in PhP/kWh ............................................................................................... 45 Annex 5. Status of Rules Change Proposal in RCC ............................................................................................ 48 Annex 6 – Status of Technical Committee’s Review and Monitoring of Technical Matters under the Grid Code, Distribution Code and the WESM Rules ................................................................................. 49 Annex 7. Metered Quantity, Spot Quantity, Bilateral Quantity (MWh) ................................................... 50 Annex 8. Demand and Energy Offers (MW) ....................................................................................................... 53 Annex 9. Generation Mix (%) .................................................................................................................................. 55 Annex 10. Effective Settlement Prices ................................................................................................................. 57 Annex 11. Private Sector Initiated Power Projects (Luzon) as of November 2011 .......................... 59 Annex 12. Private Sector Initiated Power Projects (Visayas) as of November 2011 ....................... 64 Annex 13. Private Sector Initiated Power Projects (Mindanao) as of November 2011 ................... 68 Annex 14 - ERC-Approved Capital Expenditure Projects (May 2011 – August 2011) ..................... 71 Annex 15. ECs Average Systems Rates as of January to October 2011 .................................................. 91

19th Status Report on EPIRA Implementation
LIST OF TABLES Table 1. Remaining Assets for Privatization ......................................................................................................... 4 Table 2. Generated and Collected Proceeds of Privatization ......................................................................... 6 Table 3. Utilization of Privatization Proceeds ..................................................................................................... 6 Table 4. Indicative Schedule for Appointment of IPP Administrator ........................................................ 6 Table 5. NPC Effective Generation Charges (PhP/kWh) .................................................................................. 8 Table 6. Average Systems Rates, June vs October 2011(PhP/kWh) ..................................................... 10 Table 7. EC's Unbundled Average Effective Residential Electricity Rates, September 2011
(PhP/kWh) ............................................................................................................................................................. 10 Table 8. PDUs Average Effective Rates (AER), October 2011 (PhP/kWh) .......................................... 11 Table 9. Summary of MERALCO Residential Unbundled Power Rates, October 2011 ..................... 11 Table 10. Total Base Generation Rate ................................................................................................................... 12 Table 11. Effective Maximum Allowable Revenue (MAR) 2011 (In PhP Million) ............................... 13 Table 12. Status of 2nd Entry Group PDUs Rate Application to ERC ........................................................ 14 Table 13. UC Collections & Disbursements, as of 31 October 2011 ( In Billion PhP) ........................ 15 Table 14. UC Collections and Disbursements for the Period January -September 2011 (In Billion
PhP) .......................................................................................................................................................................... 16 Table 15. Status of Loan as of September 2011 (in Billion PhP) ................................................................ 17 Table 17. Monthly Amount Incurred by NPC for Grant of MRR, April to October 2011 ................. 17 Table 16. Breakdown of Payments to NEA per Type of Loan (as of September 2011) ................... 17 Table 18. Summary of Lifeline Subsidy for the month of November 2011 ........................................... 18 Table 19. Luzon and Visayas Trading Results ................................................................................................... 19 Table 20. Metered Quantity ....................................................................................................................................... 19 Table 21. WESM Generation Mix ............................................................................................................................. 19 Table 22. Registration Update as of October 2011 (Luzon and Visayas) .............................................. 23 Table 23. PHILIPPINES, 2011 and 2010 Comparative Generation, GWh ............................................... 28 Table 24. LUZON Grid, 2011 and 2010 Comparative Generation, GWh ................................................ 28 Table 25. VISAYAS Grid, 2011 and 2010 Comparative Generation, GWh ............................................. 29 Table 26. MINDANAO Grid, 2011 and 2010 Comparative Generation, GWh ....................................... 29 Table 28. Barangay Electrification Status as of 31October2011 ............................................................... 33 Table 27. Targets Per Implementors ..................................................................................................................... 33 Table 29. Summary of Financial Benefits as of October 2011 (In PhP Billion) .................................... 35 LIST OF FIGURES Figure 1. Market Share (Philippines, Luzon, Visayas, and Mindanao) .................................................... 26 Figure 2. Dasmarinas Sub-Station Expansion .................................................................................................... 31 Figure 3. Bal-oi - Villanueva 230 kV Transmission Line Project ................................................................ 31 Figure 5. NPC Contractual Obligations for Luzon, Visayas and Mindanao............................................ 32 Figure 4. Mindanao S/S Expansion 2005 (Phase II) ........................................................................................ 32

11
19th Status Report on EPIRA Implementation
4
I. INTRODUCTION This report provides the summary update of the developments on the restructuring of the power sector covering the months of April to October 2011. The preparation for the attainment of the retail electricity market has noted significant events such as the Energy Regulatory Commission (ERC) declaring the completion of the pre-requisite relative to the implementation of Retail Competition and Open Access (RCOA). Accordingly, the DOE took the necessary actions to ensure that participants are ready in the eventual implementation. The report provides a glimpse of the continuing implementation of the Luzon-Visayas integrated electricity market while some updates on new market developments were tackled to include the study on the establishment of the Independent Market Operator. Electricity supply-demand highlights the status for the period January to June 2011. On the other hand, monitoring of market share shows significant transition to private sector ownership of the installed capacity in particular to Luzon and Visayas grids. With respect to privatization of remaining NPC assets and contracts, no significant developments were noted though PSALM continued to work on the requirements to continue the privatization in accordance with its mandate.
II. PRIVATIZATION For this report period, activities in the privatization of NPC/PSALM generating assets and Independent Power Producer (IPP) contracts were deferred with the new administration’s call for a review of the privatization plan and the need to address the seasonal supply interruptions. However, developments pertaining to PSALM’s continuing activity for the completion of the remaining legal, financial and technical requirements for the smooth turn-over of the privatized power plants and IPP contracts are hereunder enumerated and discussed:
A. Privatization of Generating Assets
For the second semester of 2011, the government’s privatization program for the remaining assets, i.e., generating assets and contracted capacities of IPPs, pursued in accordance with the PSALM Board’s approved timetable and the direction set by the DOE consistent with the Energy Reform Agenda. Hence, the bidding process commenced in July 2011. B. Remaining Assets for Privatization
The remaining assets for privatization are shown in Table 1 with the indicative privatization schedule as approved by the PSALM Board. The privatization of the remaining assets will continue depending on the policy direction to be set by the administration consistent with the Energy Reform Agenda, with the concurrence of the Joint Congressional Power Commission. However, the confluence of factors such as investors’ interest and plant-specific concerns may cause possible changes in the target dates.
Table 1. Remaining Assets for Privatization
Plant Name
Rated Capacity
(MW)
Bid Date
Turn Over Date
Owned Generating Plants Luzon Grid Malaya 650.00 2012 2013
Sub-total Luzon 650.00

11
19th Status Report on EPIRA Implementation
5
Plant Name
Rated Capacity
(MW)
Bid Date
Turn Over Date
Visayas Grid PB 101 32.00 Bidding process starts in July 2011
subject to completion of bidding documents
PB 102 32.00 PB 103 32.00
Sub-total Visayas 96.00 Mindanao Grid PB 104 32.00 Bidding process starts in July 2011
subject to completion of bidding documents
Agus 1 & 2 260.00
2014-2015
2015-2016 Agus 4& 5 213.00 Agus 6 & 7 254.00 Pulangui 255.00
Sub-total Mindanao 1,014.10 TOTAL 1,760.10
Decommissioned Plants Bataan Thermal 0.01 December 2011 October 2012 Sucat 0.01 February 2017 December 2017
Source: PSALM
Agus-Pulangui
PSALM, having signed the Operation and Maintenance Agreement with NPC, shall fund the rehabilitation of the Agus-Pulangui hydropower plant complexes. Said fund may either be sourced out from the income of power plant operations or through financing scheme.
Power Barges (PB) 101 to 104
The NPC bought the Power Barges (PB) 101, 102, 103 and 104 from a Japanese firm, Hitachi Zosen Corporation, to help ease severe power shortage in the Philippines, providing the required support in the Visayas and Mindanao regions. Commissioned in 1981, PB 101 and PB 102 are currently tied-up in Barrio Obrero, Iloilo City. PB 103 and 104, which were commissioned in 1985, are moored in Botongon, Estancia, Iloilo, and in Holcim Compound, Ilang, Davao City, respectively. These barges are movable and can be relocated anywhere with adequate mooring structures. Designed as base-load plants, PB 101, 102, 103 and 104 are nominal 32 MW barge-mounted bunker-fired diesel generating power stations that consist of four (4) identical Hitachi-Sulzer diesel generator units rated at 8 MW each. The privatization of PB 101 to 104 is set by PSALM to commence before the year ends. The sale of these power barges has been approved by the PSALM Board provided that said barges shall be transferred to Mindanao to augment its power supply but only after the power situation in the Visayas region has been stabilized.
C. Privatization Proceeds
As of 31 October 2011, the generated proceeds of PSALM amounted to US10.210 Billion. Table 2 indicates the sources of the privatization proceeds, namely: generating assets;

11
19th Status Report on EPIRA Implementation
6
decommissioned plants; transmission asset; and appointment of IPP Administrators. Total actual collection as of the same date amounts to US$5.272 Billion. PSALM generated most of the proceeds from the transmission assets but collected the most from generating assets.
Table 2. Generated and Collected Proceeds of Privatization
Privatization Proceeds (In US$Billion)
Generated Collected
Generating Assets 3.027 3.064 Decommissioned Plants 0.004 0.004
Transmission Asset (TransCo) 3.950 1.765 Appointment of IPPAs 3.229 0.439
TOTAL 10.210 5.272
Source: PSALM
Out of the total collected amount, Table 3 confirms that about ninety-eight percent (98%) of it has been utilized for the prepayment of NPC loans, debt service of NPC regular loans as well as IPP obligations and payment of privatization-related expenses.
Table 3. Utilization of Privatization Proceeds
Privatization Proceeds UTILIZED In US$ Billion Debt Prepayment 1.298 Regular Debt Service 2.411 Lease Obligations 1.398 Others 0.052
TOTAL 5.159 Source: PSALM
D. Transfer of NPC-IPP to Independent Administrators
Table 4 shows the indicative schedule for the appointment of an IPP Administrator in the remaining NPC-IPP contract in Luzon, Visayas and Mindanao Grids. The bidding process in the Visayas Grid started in July 2011 for the contracted energy with Unified Leyte and Naga Complexes.
Table 4. Indicative Schedule for Appointment of IPP Administrator
Plant Name Contracted Capacity (MW)
Bid Date Turn Over Date
Luzon Grid
CASECNAN MULTI-PURPOSE 140.00 2012 Sub-total Luzon 140.00
Visayas Grid 2012 Unified Leyte 559.00 Bidding process starts July 2011
CEBU THERMAL 1 & 2 95.80 CEBU DIESEL (1-6) 36.00
Sub-total Visayas 690.80 Mindanao Grid MT. APO GEOTHERMAL PP 44.52
2014
WMPC DIESEL PP 100.00
SPPC DIESEL PP 50.00 MT. APO 2 GEOTHERMAL 48.00 MINDANAO COAL-FIRED PP 200.00
Sub-total Mindanao 442.52 Total Luz-Vis-Min 1,273.32
Source: PSALM

11
19th Status Report on EPIRA Implementation
7
Naga Complex Power Plants
PSALM deferred its bidding process in the Naga Complex Power Plants for the appointment of the IPP administrators which was initially set on 10 October 2011. This is due to some critical issues integrated in the privatization design of the said plants that need to be addressed first as requested by the JCPC. The postponement gave way to the conduct of in-depth study and analysis on bidding practices, specifically the alleged unfair and illegal condition known as the ‘right to top’ the highest bid previously granted to SPC Power Corporation (SPC) in the Land Lease Agreement executed by and among PSALM, NPC and SPC in 2009. The Naga Complex comprises the 106.8MW Naga 1 and 2 coal thermal power plants and the 39MW Naga diesel power plant located in Naga, Cebu. These plants are under a Rehabilitate-Operate-Maintain-and-Manage Agreement / Energy Conversion Agreement with Korea Electric Power Corporation (KEPCO) Salcon Philippines which will expire in March 2012.
Casecnan
PSALM is also lining up this year the privatization of the power supply agreement for the 150MW Casecnan hydropower facility. The Casecnan Project, a combined irrigation and hydroelectric power project in the northern part of Luzon, is the first multi-purpose Build-Operate-and Transfer project in the Philippines. However, there is one major hitch – the facility’s ownership may still revert to the government through the National Irrigation Administration (NIA).
Unified Leyte
PSALM is likewise planning to sell the contracted capacity of the 640MW Unified Leyte geothermal power plants in tranches this year. But its supply contract has been proposed for “splitting” the capacities due to the concern of investors on the market cap for the Visayas. In order not to violate the market cap provisions under the Electric Power Industry Reform Act (EPIRA), the bidding rules has indicated that capacities will be divided at 60 - 40, which means that the capacities will bid out at 384 MW and 255 MW, respectively.
Four (4) investor groups have signified interest when the government announced in June last year the resumption for the bidding of the contracted capacity of the Unified Leyte geothermal power plants. However, the bidding was postponed in line with the government’s deferment of the privatization process.
E. Concession of the National Transmission Network
The Concession Agreement provides that TransCo has to conduct inspection of the assets condition and the Projects Under Construction (PUC) accomplishments consistent with the inspection protocol established with the concessionaire.
For February to October 2011, TransCo was able to inspect ten (10) PUCs, two (2) New Projects and sixteen (16) transmission facilities. The details of which, i.e. name of project/transmission facility, its location, date of inspection and the inspection report number, are provided in Annex 1.
11
19th Status Report on EPIRA Implementation
8
All the inspection reports were forwarded to the concessionaire for their appropriate action.
F. Sale of Sub-Transmission Assets (STAs)
As of 31 October 2011, TransCo has signed eighty-four (84) sale contracts amounting to about P4.09 billion with sixty-six (66) distribution utilities/electric cooperatives (ECs) /consortia. These sales cover an aggregate length of about 3,323 ckt-kms of sub-transmission lines and 30,200 sub-transmission structures. Out of the 84 sale contracts, forty-three (43) of them, with the total sale price of P2.08 billion, have been approved by the ERC. The forty-one (41) sale contracts are still for ERC filing, evaluation or approval. Consistent with the EPIRA provision to extend concessional financing to ECs, TransCo implemented the lease purchase arrangements with a 20-year term. Of the 84 sale contracts already signed, fifty-four (54) of which are under the lease purchase agreements with 50 ECs/consortia, valued at about P2.9 billion. The remaining thirty (30) contracts involved sales to private distribution utilities. TransCo is looking forward to a sale of about 800 ckt-kms of sub-transmission lines and 560 MVA of substation equipment among the thirty-three (33) interested distribution utilities/consortia for the next four years.
III. ELECTRICITY RATES The DOE continuously monitors data on electricity rates to provide the JCPC and the public an idea of what is the latest information on electricity rates. This section considers the reports submitted by the ERC and also the data and information gathered by the DOE from various sources to fully substantiate and provide the JCPC with significant updates to serve as reference in identifying areas that may require legislative actions.
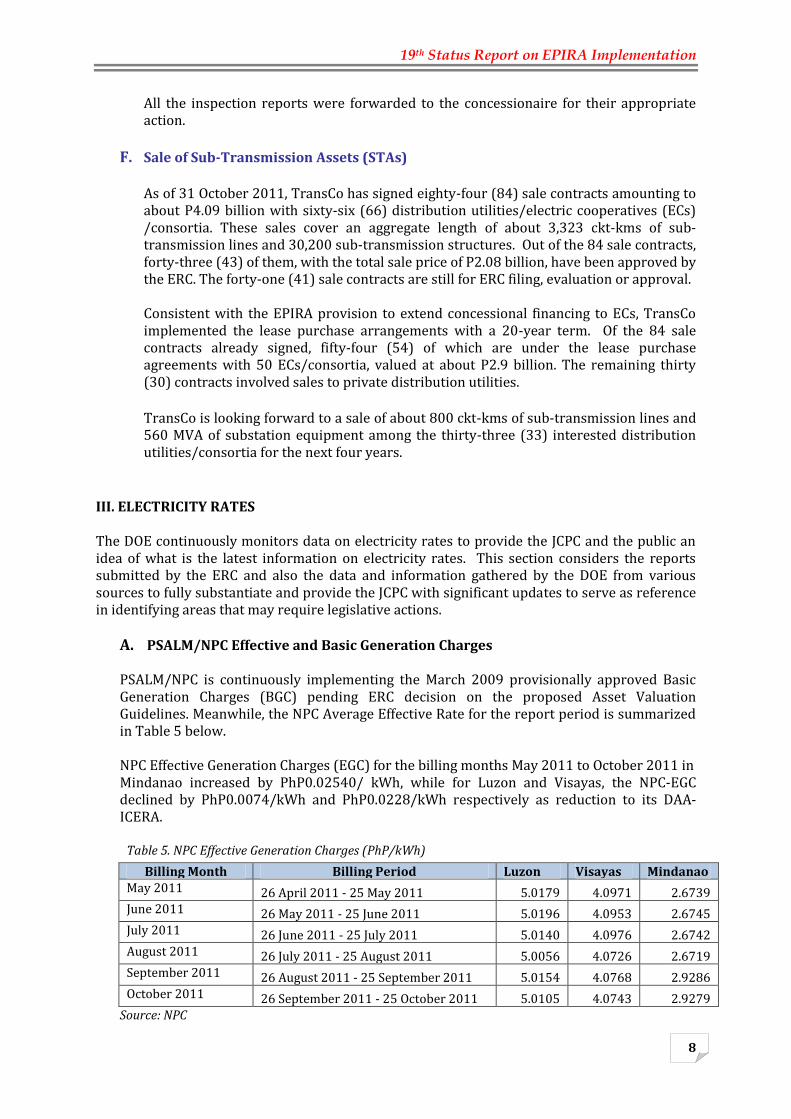
A. PSALM/NPC Effective and Basic Generation Charges PSALM/NPC is continuously implementing the March 2009 provisionally approved Basic Generation Charges (BGC) pending ERC decision on the proposed Asset Valuation Guidelines. Meanwhile, the NPC Average Effective Rate for the report period is summarized in Table 5 below. NPC Effective Generation Charges (EGC) for the billing months May 2011 to October 2011 in Mindanao increased by PhP0.02540/ kWh, while for Luzon and Visayas, the NPC-EGC declined by PhP0.0074/kWh and PhP0.0228/kWh respectively as reduction to its DAA-ICERA.
Table 5. NPC Effective Generation Charges (PhP/kWh)
Billing Month Billing Period Luzon Visayas Mindanao May 2011 26 April 2011 - 25 May 2011 5.0179 4.0971 2.6739 June 2011 26 May 2011 - 25 June 2011 5.0196 4.0953 2.6745 July 2011 26 June 2011 - 25 July 2011 5.0140 4.0976 2.6742 August 2011 26 July 2011 - 25 August 2011 5.0056 4.0726 2.6719 September 2011 26 August 2011 - 25 September 2011 5.0154 4.0768 2.9286 October 2011 26 September 2011 - 25 October 2011 5.0105 4.0743 2.9279
Source: NPC

11
19th Status Report on EPIRA Implementation
9
Relative to the pending NPC petition for the recovery of its costs under the deferred accounting adjustments, ERC issued its decision on 15 November 2010, on the 9th to 14th Incremental Costs on Foreign Currency Exchange Rate (ICERA) Fluctuation covering the test period January 2007 to June 2009. The said decision approved for refund adjustments to Luzon and Mindanao customers while a recovery was approved for Visayas grid.
PSALM through its letter dated 05 May 2011 sent to the ERC and NPC the notice to cease implementation of the said refund for certain customers effective 26 March-25 April billing period since the said costs/charges was already exhausted.
B. Transmission Rates
Following are the developments on the transmission rates charges imposed by the NGCP as approved by the ERC:
1. Maximum Annual Revenue Approval (MAR)
Under the Financial Determination (FD) for the Third Regulatory Period, ERC approved the Unsmoothed and Smoothed MAR (SMAR). The Smoothed MAR was based on the three percent (3%) Efficiency Factor which will be used in translating the ARR to the annual effective MAR for each of the regulatory year of the Third Regulatory Period. This annual rate translation of the maximum transmission wheeling rates should be determined in accordance with the timetable and process specified under Article VI of the RTWR. Likewise, the revenue cap form of price control for the Third Regulatory Period provided in Article V of the RTWR shall be continuously applied.
On 04 July 2011, the Commission approved NGCP’s Maximum Annual Revenue (MAR) for the calendar year 2011 in the amount of PhP44,889.03 million which was PhP1,395.71 million lower than the provisionally approved amount of PhP46,284.74 million last 17 January 2011 and Performance Incentive Scheme (PIS) in the amount of PhP322.00 million.
The difference was mainly due to the computation of the MAR 2010. NGCP proposed a MAR 2010 equal to the gross effective MAR 2010 while the Commission used the adjusted MAR to account for the initial price correction factor (Po) amounting to PhP1.435 billion as starting point for the smoothing process.
As discussed in the FD, the revenue smoothing is undertaken to reduce the likelihood of price shocks to customers and revenue shocks to the Regulated Entity. The objective of the process for smoothing revenue is to achieve a revenue path whereby the net present value (NPV) of the smoothed revenue path is equal to the NPV of the MAR at the end of 2010, including of any revenue adjustment that was applied in 2010.
The PIS rewards or penalizes NGCP to the extent that the actual level of performance of the grid for the regulatory year exceeds or falls below the target level of performance as defined in the Final Determination (FD). The commission found the computed PIS of PhP322 million for NGCP which is consistent with the provisions of the RTWR which is below the maximum reward of Php1,322.37 million as defined in Clause 1.7, Chapter 1 of the FD.

11
19th Status Report on EPIRA Implementation
10
C. Distribution Utilities (DUs) Rates
The following discussions provide updates on the electricity rates for the month of May to October 2011 as well as related developments on regulatory actions, with rate cases being under the exclusive jurisdiction of the ERC.
1. Average Effective Electricity Rates
The country’s average electricity rates rate as of October 2011 is PhP7.9653/kWh, PhP0.3864/kWh lower compared with the June 2011 average systems rate. Among the three major grids, Luzon has the highest rate of PhP8.4300/kWh while Mindanao remains the lowest at PhP6.1131/kWh for October 2011.
The ECs’ national unbundled electricity rate for September 2011 is PhP8.9377/kWh, a decrease of PhP0.1850/kWh from the June 2011 level. Generation costs comprised 47 percent of ECs’ national average effective electricity rates followed by distribution costs share of 24 percent of the total. The largest reduction in ECs’ rates was noted in the Luzon grid at PhP9.3293/kWh in June 2011 to PhP8.2594/kWh in October 2011. Mindanao however, posted the lowest generation costs at PhP2.9009/kWh comprising only 40 percent of the unbundled residential electricity rates.
The national average systems rates of private distribution utilities (PDUs) decreased by PhP0.0881/kWh from PhP8.5626/kWh in June 2011 to PhP8.4745/kWh in October
Table 6. Average Systems Rates, June vs October 2011(PhP/kWh)
Grid Electric Cooperatives Private Distribution Utilities National Average
June October Change June October Change June October Change
Luzon 9.3293 8.2594 -1.0699 8.8427 8.6006 -0.2421 9.0860 8.4300 -0.6560
Visayas 8.1718 8.0900 -0.0818 7.4332 7.9130 0.4798 7.8025 8.0015 0.1990
Mindanao 6.1715 5.9519 -0.2196 6.3158 6.2743 -0.0415 6.2437 6.1131 -0.1306
Philippines 8.1408 7.4561 -0.6847 8.5626 8.4745 -0.0881 8.3517 7.9653 -0.3864
Sources: : ECs – NEA’s Quarterly Unbundled Power Rate Schedules PDUs –Monthly Operations Report
Table 7. EC's Unbundled Average Effective Residential Electricity Rates, September 2011 (PhP/kWh)
Bill Subgroup LUZON VISAYAS MINDANAO NATIONAL
PhP/kWh Percent
share PhP/kWh
Percent share
PhP/kWh Percent
share PhP/kWh
Percent share
Generation 4.8264 48.60 4.8864 50.94 2.9009 39.80 4.2046 47.04
Transmission 1.1319 11.40 0.9885 10.31 1.4639 20.08 1.1948 13.37
System Loss 0.8392 8.45 0.7652 7.98 0.5377 7.38 0.7140 7.99
Distribution * 2.2383 22.54 2.2033 22.97 1.9203 26.34 2.1206 23.73
Subsidies 0.0684 0.69 0.0395 0.41 0.0573 0.79 0.0551 0.62
Government Taxes
0.8275 8.32 0.7093 7.39 0.4091 5.61 0.6486 7.25
Total 9.9317 100.00 9.5922 100.00 7.2892 100.00 8.9377 100.00
Source: NEA * Includes Distribution, Supply and Metering Charges Source: ECs’ submission of their unbundled effective rates to NEA

11
19th Status Report on EPIRA Implementation
11
2011 however there is an increase of PhP0.4798 in the Visayas grid. Among the PDUs, Manila Electric Company (MERALCO) has the highest average effective rate for the residential customers at PhP10.5705/kWh for the billing period October 2011. On the other hand, Iligan Light & Power, Inc. (ILPI) remains to have the lowest average effective residential rates at PhP5.6346/kWh for the same billing period.
For October 2011 billing, MERALCO’s effective residential rates for the different residential customer classes ranged from PhP10.2588/kWh to PhP11.6930/kWh of which the highest component was generation costs at PhP5.4202/kWh. Meanwhile, MERALCO distribution charges for its different residential customer classes comprised 19 percent to 28 percent of the total effective residential rates equivalent to PhP1.9417/kWh and PhP3.2235/kWh, respectively.
Table 8. PDUs Average Effective Rates (AER), October 2011 (PhP/kWh)
PDU Residential Commercial Industrial Average
Luzon Grid Average 10.4189 9.3571 7.5053 8.6006
MERALCO 10.5705 9.4091 7.5099 8.6273
DECORP 8.3844 8.1117 7.9401 8.2216
LUECO 8.1365 8.7401 8.8447 8.4167
AEC 8.1323 8.6216 11.5725 8.4160
CELCOR 9.4557 9.1799 8.9517 9.3071
SFELAPCO 7.5842 7.9245 6.4585 7.1987
TEI 8.8055 8.1111 7.2721 8.1830
IEEC 8.7126 7.4516 7.4677 8.2483
Visayas Grid Average 8.0300 8.7412 7.5641 7.9130
PECO 9.4167 9.1643 9.3180 9.1406 MECO 7.3134 7.2902 8.0051 7.4829
VECO 8.0103 9.2121 7.3108 7.8450
BLCI 5.5640 5.3387 - 5.4069 Mindanao Grid Average 6.6356 6.5339 5.8478 6.2743
CEPALCO 7.2350 6.7111 5.8566 6.4453
DALIGHT* 6.1413 6.4847 5.4324 5.7950
COLIGHT 6.2634 6.7161 5.8533 6.1678
ILPI 5.6346 5.8487 5.6636 5.7106
National Average 10.1120 9.2745 7.4580 8.4745
Source: PDUs –Monthly Operations Report Note: Based on Monthly Operations Report submitted by Private DUs (AER = Revenue over Sales) *September 2011 data
Table 9. Summary of MERALCO Residential Unbundled Power Rates, October 2011
BILL SUBGROUP 0 to 200 kWh
(P/kWh) %
201 to 300 kWh
(P/kWh) %
301 to 400 kWh
(P/kWh) %
Over 400kWh (P/kWh)
%
Generation 5.4202 53 5.4202 51 5.4202 49 5.4202 46 Transmission 1.0481 10 1.0481 10 1.0481 9 1.0481 9 System Loss 0.6501 6 0.6501 6 0.6501 6 0.6501 6 Distribution 1.9417 19 2.2990 22 2.6362 24 3.2235 28 Subsidies* 0.1349 1 0.1349 1 0.1349 1 0.1349 1 Universal Charge 0.1188 1 0.1188 1 0.1188 1 0.1188 1 Government Taxes 0.9450 9 0.9851 9 1.0250 9 1.0974 9 TOTAL** 10.2588 100 10.6562 100 11.0333 100 11.6930 100
Source: MERALCO Website * Lifeline Rate Charges (applicable to 101 kWh consumption and up) + Cross Subsidy Charge

11
19th Status Report on EPIRA Implementation
12
2. Regulatory Actions
The following report on regulatory actions on electricity rates are based on ERC issuances as gathered in the ERC website.
a. Generation
On June 9, 2011, First Bay Power Corporation (FBPC) and AP Renewables, Inc. (APRI) jointly filed Motion for Reconsideration (of the January 24, 2011 ERC Decision) on the approval of the power supply agreement (PSA) between FBPC and APRI. On the said Decision (24 January 2011), ERC considered and approved the provisional authority on the average generation rate requested by FBPC & APRI in the amount of PhP3.7772/kWh. Unfortunately, the said amount is much lower than the generation rate agreed upon in the PSA between FBPC and APRI, thus the said joint motion for reconsideration. FBPC and APRI provided the Commission various discussions/considerations i.e. indicative price (increase) structure of generation costs as of April 2011. Likewise, it was also cited the issue on the reasonableness of the PSA price, and APRI manifests to consider other factors affecting base generation rate; The Commission after thorough discussion granted APRI a Capital Cost Recovery Fee (CCRF) of 2.5356/kWh; WACC of 15.26%; Plant Operation and Maintenance Cost (O&M) of P1.8971/kWh; and General and Administrative Expenses (G&A Expenses) of P0.8212/kWh. The table below shows a comparison of the Commission’s recalculated Base Generation Rate, APRI’s Computed Base Generation Rate and APRI’s Proposed PSA Rate:
Table 10. Total Base Generation Rate
Particulars
Commission’s Recalculated Base Generation Rate
(P/kWh)
APRI’s Computed Base Generation Rate (PhP/kWh)
APRI’s PSA Rate
(PhP/kWh)
CCRF 2.5356 2.9376 - Plant O&M Costs 1.8971 2.0205 - Plant G & A Expenses 0.2812 0.2812 - 4.7139 5.2393 4.2096*
Source: ERC Website
Note: *Weighted Average Time-of-Use (TOU) Rate for the Billing Month June 2010. For December 2010, APRI’s
Weighted Average TOU Rate was PhP3.9496/kWh
The Commission’s recalculated Base Generation Rate, a lower by approximately PhP0.5254/kWh compared to APRI’s computed Base Generation Rate. However, the recalculated Base Generation Rate is higher than APRI’s Proposed PSA Rate by approximately PhP0.5043/kWh. This being the case, the Commission deems it prudent to peg the Base Generation Rate at APRI’s proposed PSA Rate of PhP4.2096/kWh.

11
19th Status Report on EPIRA Implementation
13
b. Transmission
The ERC on its decision on ERC Case No. 2008-041 RC dated May 16, 2011, on the application for approval of the Ancillary Services Procurement Agreement (ASPA) between TRANSCO and NPC approved and authorized to recover the cost relative to the ASPA for the period June 23, 2008 to June 23, 2009 with the following formula and rates:
Total Cost of Ancillary Services (AS) = Capacity Cost + Energy Cost – Energy Cost Adjustment
Where:
Capacity Cost per Month = ∑(kW as scheduled x hours per month) x Capacity Fee
Energy Cost per Month = kWh registered x the contracted Energy Fee + AFC3
kWh registered (adjusted by applicable Energy Cost Adjustments = loss factor) x ERC-approved NPC Visayas Grid rate Capacity Fee = 5.6204 PhP/kW (per hour) Energy Fee = 9.5040 PhP/kWh (per month) Fuel Rate = 0.264 liter/kWh at 33% load factor
On July 14, 2011 the ERC on its decision to ERC Case No. 2010-152 RC regarding the application of the National Grid Corporation (NGCP) for the approval of the Maximum Allowable Revenue (MAR) for calendar year 2011 and Performance Incentive Scheme (PIS) in compliance with the alternative form of rate setting methodology under the Rules for Setting Transmission Wheeling Rates (RTWR) under the following effective MAR:
Table 11. Effective Maximum Allowable Revenue (MAR) 2011 (In PhP Million) Particulars Effective MAR 2011
(PhP, Million) MAR 44,889.03
PIS 322.00
TOTAL 45,211.03
Source: NGCP Website
The said MAR 2011 of PhP45.2 Billion is lower by PhP1.40 Billion compared to the provisionally approved MAR2011 of PhP46.6 billion.
c. Private Distribution Utilities (PDUs) The ERC continued to adopt phased implementation of Performance-Base Rate Methodology for PDUs to Rules for Setting Distribution Wheeling Rates (RDWR).

11
19th Status Report on EPIRA Implementation
14
Following are the updates: 1st Entry Group (MERALCO, DECORP, CEPALCO) The PDUs under the 1st Entry Group have entered their 3rd Regulatory Period (July 1, 2011 to June 30, 2015). On various dates in June 2011, the ERC have already issued the Final Determination on their Annual Revenue Requirement (ARR) and Performance Incentive Scheme (PIS). The ERC has yet to approve the applications for rate translation for the DUs under this group. 2nd Entry Group (MECO, ILPI,CLPC) On February and June 2010, the ERC approved the rate translation for the 2nd Entry Group. The following are the approved rates:
d. Electric Cooperatives
1) On-Grid Electric Cooperatives
In preparation for the implementation of the revised Tariff Glide Path, pursuant to Article 7 (Tariff Glide Path Provision) of the Rules for Setting the Electric Cooperatives’ Wheeling Rates (RSEC-WR), the ERC conducted training on 8-9 June 2011. The participants included the General Managers, Finance Managers and the Technical Services Division (TSD) Managers of each Electric Cooperative.
The RSEC-WR TGP governs the movement of the initial tariffs caps which refer to the maximum rates for Distribution, Supply, and Metering. It includes the (1) escalation factor that will be used in adjusting the rates to reflect the combined impact of inflation and load growth; (2) efficiency factor to account for the operational efficiency of the ECs in setting their rates; and (3) performance incentive that will either reward or penalize the EC for performing above or below the performance standard.
Under the revised TGP Rules, the Regulatory Period will now be six (6) years and will impact the rates by the 4th year of the First Regulatory Period. The implementation of the TGP will be done by batch as arranged into three (3) Entry Groups (1st, 2nd, and 3rd Entrants). The filing for the rate adjustment resulting
Table 12. Status of 2nd Entry Group PDUs Rate Application to ERC
DU Case Number/ Date of Filing
Regulatory Year
RY 2009 Rate (PhP/kWh)
Status Previous
Rates ERC
Approved
Proposed Rates
(RY 2011) Difference
MECO 2010-154 RC/ 17-Dec-2010
2009-2013 1.0149 1.0839 1.0891 0.0052 Final Decision issued by ERC on Feb. 28, 2011.
ILPI 2010-153 RC 21-DEC-2010
2009-2013 1.1256 1.3669 1.3696 0.0027 Final Decision issued by ERC on June 21, 2011.
CLPC 2009-178 RC 2009-2013 1.3189 1.5056 1.7620 0.2564 Final Decision issued by ERC on Feb. 22, 2010.
Source: ERC
11
19th Status Report on EPIRA Implementation
15
from the TGP implementation will be done on the 3rd year of the First Regulatory Period. The Reset Process from the TGP implementation for data collection will be in 2011 to 2014 and the new classification will be effective in 2017.
In another development, on July 6, 2011, the ERC issued Resolution No. 14, series of 2011, “A Resolution Modifying the Terms Members’ Contribution for Capital Expenditures (MCC) to Reinvestment Fund for Sustainable Capital Expenditures (RFSC) and MCC-Real Property Tax (RPT) to Provision for RPT as Provided in the Rules for Setting Electric Cooperatives’ Wheeling Rates (RSEC-WR)”.
The move is due to the diverging interpretations of the MCC interpreting it as a capital build-up or compulsory “capital contributions” from member-consumers. The Resolution therefore clarified that the intent of the RSEC-WR in translating Reinvestment Fund into MCC is to recognize that fact that the said MCC Charge indeed represents contributions from the member-consumers for the expansion, rehabilitation and upgrading of the ECs’ distribution system which should be reflected in their bills for greater transparency.
2) Off-Grid Electric Cooperatives
The Public Consultations for the Issues Paper on the Proposed Alternative Regulatory Framework for Electric Cooperatives (ECs) Servicing Off-Grid Areas was conducted on May 30, 2011 for Luzon stakeholders and June 1, 2011 for the Visayas and Mindanao stakeholders.
The Issues Paper aims to implement a more responsive regulatory framework to the operations of off-grid ECs considering the challenges they face in servicing isolated and sparsely populated areas. The Issues Paper will be used to analyze selected financial parameters which can provide basis on determining appropriate regulatory framework for off-grid ECs.
C. Administration of Universal Charge (UC) This section provides development on the implementation of UC pursuant to Section 34 of the EPIRA. Highlights include status of collection and disbursements, updates on PSALM’s application for the recovery of stranded contract costs and stranded debts, and the implementation of UC collection from self-generating facilities.
1. Total Collections/Disbursements for UC-ME and UC-EWR
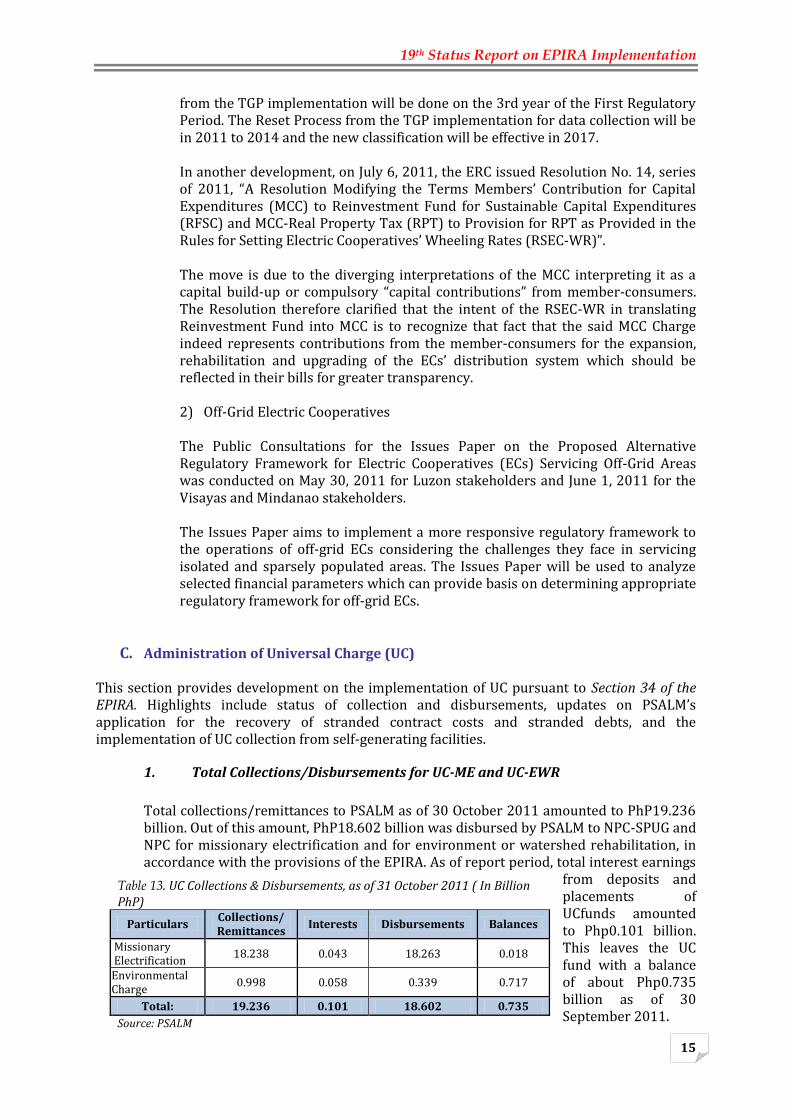
Total collections/remittances to PSALM as of 30 October 2011 amounted to PhP19.236 billion. Out of this amount, PhP18.602 billion was disbursed by PSALM to NPC-SPUG and NPC for missionary electrification and for environment or watershed rehabilitation, in accordance with the provisions of the EPIRA. As of report period, total interest earnings
from deposits and placements of UCfunds amounted to Php0.101 billion. This leaves the UC fund with a balance of about Php0.735 billion as of 30 September 2011.
Table 13. UC Collections & Disbursements, as of 31 October 2011 ( In Billion PhP)
Particulars Collections/ Remittances
Interests Disbursements Balances
Missionary Electrification
18.238 0.043 18.263 0.018
Environmental Charge
0.998 0.058 0.339 0.717
Total: 19.236 0.101 18.602 0.735
Source: PSALM
11
19th Status Report on EPIRA Implementation
16
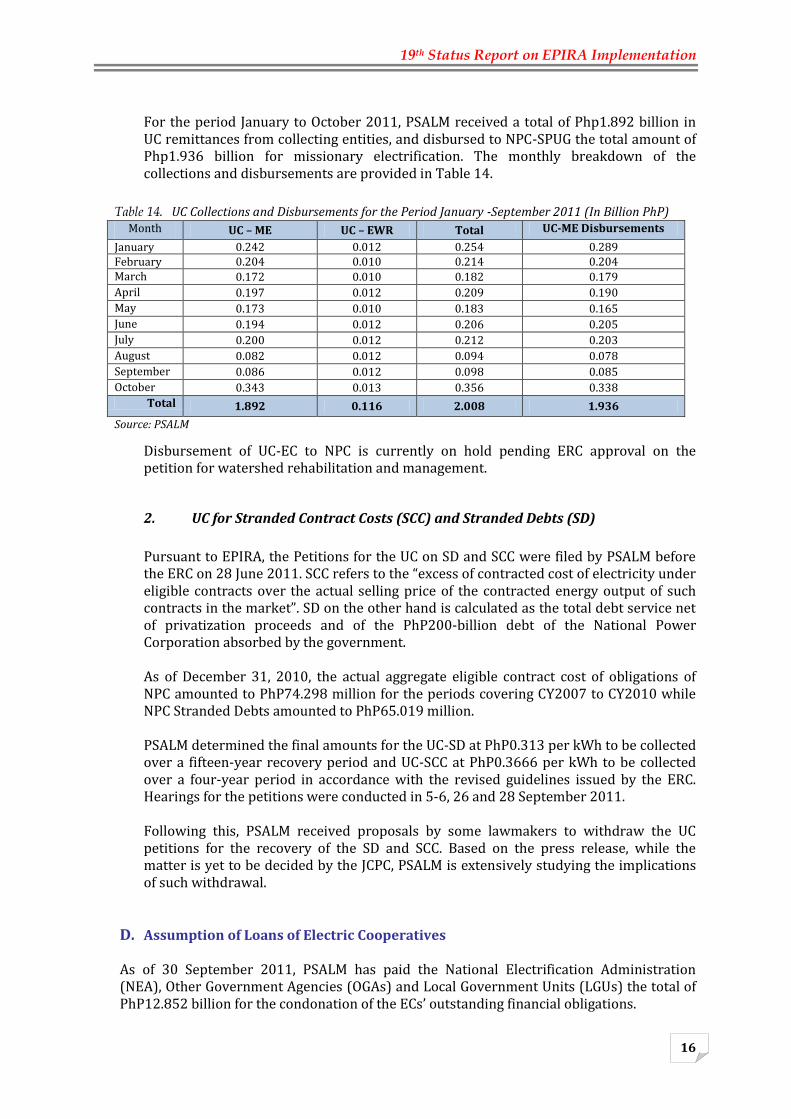
For the period January to October 2011, PSALM received a total of Php1.892 billion in UC remittances from collecting entities, and disbursed to NPC-SPUG the total amount of Php1.936 billion for missionary electrification. The monthly breakdown of the collections and disbursements are provided in Table 14.
Disbursement of UC-EC to NPC is currently on hold pending ERC approval on the petition for watershed rehabilitation and management.
2. UC for Stranded Contract Costs (SCC) and Stranded Debts (SD)
Pursuant to EPIRA, the Petitions for the UC on SD and SCC were filed by PSALM before the ERC on 28 June 2011. SCC refers to the “excess of contracted cost of electricity under eligible contracts over the actual selling price of the contracted energy output of such contracts in the market”. SD on the other hand is calculated as the total debt service net of privatization proceeds and of the PhP200-billion debt of the National Power Corporation absorbed by the government. As of December 31, 2010, the actual aggregate eligible contract cost of obligations of NPC amounted to PhP74.298 million for the periods covering CY2007 to CY2010 while NPC Stranded Debts amounted to PhP65.019 million. PSALM determined the final amounts for the UC-SD at PhP0.313 per kWh to be collected over a fifteen-year recovery period and UC-SCC at PhP0.3666 per kWh to be collected over a four-year period in accordance with the revised guidelines issued by the ERC. Hearings for the petitions were conducted in 5-6, 26 and 28 September 2011. Following this, PSALM received proposals by some lawmakers to withdraw the UC petitions for the recovery of the SD and SCC. Based on the press release, while the matter is yet to be decided by the JCPC, PSALM is extensively studying the implications of such withdrawal.
D. Assumption of Loans of Electric Cooperatives
As of 30 September 2011, PSALM has paid the National Electrification Administration (NEA), Other Government Agencies (OGAs) and Local Government Units (LGUs) the total of PhP12.852 billion for the condonation of the ECs’ outstanding financial obligations.
Table 14. UC Collections and Disbursements for the Period January -September 2011 (In Billion PhP) Month UC – ME UC – EWR Total UC-ME Disbursements
January 0.242 0.012 0.254 0.289 February 0.204 0.010 0.214 0.204 March 0.172 0.010 0.182 0.179
April 0.197 0.012 0.209 0.190
May 0.173 0.010 0.183 0.165
June 0.194 0.012 0.206 0.205
July 0.200 0.012 0.212 0.203
August 0.082 0.012 0.094 0.078
September 0.086 0.012 0.098 0.085
October 0.343 0.013 0.356 0.338
Total 1.892 0.116 2.008 1.936
Source: PSALM

11
19th Status Report on EPIRA Implementation
17
Table 15. Status of Loan as of September 2011 (in Billion PhP)
Total Assumption
Actual Payments Balance
Amount % Amount %
NEA 17.978 12.776 1/ 71.06 5.202 28.94
LGU/OGA 0.096 0.076 2/ 79.17 0.019 19.79
TOTAL 18.074 12.852 71.11 5.221 28.89
1/With application of the PhP2.215 Billion collection of NEA from ECs amounting to PhP369,652,000.00 2/ Net of discount from the Provincial Government of Palawan amounting to PhP3,725,000.97
Source: PSALM
Of the PhP12.776 billion total payments to NEA as of 30 September 2011, about 75.24% or Php9.612 billion was used to pay the Rural Electrification loans incurred by the ECs, 15.59% of Php1.992 billion was for Mini-hydro loans, 9.10% or Php1.162 billion was for Dendro Thermal loans. Payments intended for house wiring services only amounted to Php9.574 million or 0.07%. On Table 15 is the summary of these payments.
E. Mandatory Rate Reduction (MRR) Pursuant to Section 72 of the EPIRA, NPC continuously grant to residential customers the mandatory discount of 30-centavos/kWh. For the period April to October 2011, total discounts granted by NPC amounted to PhP676.47 million of which 65 percent were availed by residential customers in Mindanao, 22 percent in the Visayas and 13 percent in Luzon.
Table 17. Monthly Amount Incurred by NPC for Grant of MRR, April to October 2011
Billing Month
MERALCO REST OF LUZON TOTAL LUZON VISAYAS MINDANAO TOTAL
April 2011 5,172,690.30 4,263,910.08 9,436,600.38 20,084,581.86 58,855,190.04 88,376,372.28
May 2011 8,387,174.86 4,784,938.17 13,172,113.03 20,529,433.51 68,402,330.52 102,103,877.06
June 2011 11,310,086.13 4,973,382.86 16,283,468.99 22,250,391.59 62,851,407.75 101,385,268.33
July 2011 10,547,112.05 4,653,784.10 15,200,896.15 22,352,448.64 60,225,893.67 97,809,238.46
August 2011 9,207,207.46 2,838,448.20 12,045,655.66 20,978,035.54 62,271,564.88 95,295,256.08
September 2011
7,076,107.39 4,610,040.19 11,686,147.58 20,868,424.70 62,829,132.99 95,383,705.27
October 2011 5,551,114.71 4,515,770.27 10,066,884.98 21,339,283.45 62,856,303.08 94,262,471.51
TOTAL 57,251,492.90 32,493,191.17 89,744,684.07 148,402,599.29 438,291,822.93 676,469,106.29
Source: NPC
F. Lifeline Rate Subsidy Program
On 21 June 2011, Republic Act 10150 was signed into law. This extended the implementation of the lifeline rate subsidy by another 10 years. To date, coordination meetings are being conducted by the concerned government agencies with the ERC to study the possible changes in the current mechanism which is in placed to implement the subsidy program. Meanwhile, Table 18 shows the current status of lifeline rate subsidy implementation, as provided by the ERC.
Table 16. Breakdown of Payments to NEA per Type of Loan (as of September 2011)
Type of Payment
Amount Paid (In billion PhP)
Percentage to Total
Rural Electrification Loan 9.612 75.24%
Mini-hydro 1.992 15.59%
Dendro Thermal 1.162 9.10%
House wiring 0.010 0.07%
TOTAL 12.776 100.00%
Source: PSALM

11
19th Status Report on EPIRA Implementation
18
Table 18. Summary of Lifeline Subsidy for the month of November 2011
Particulars PDUs ECs Total
Amount of Subsidy Provided by Non-Lifeline Customers (Php) 338,362,947.54
36,307,228.30
374,670,175.84
Total Consumption of Lifeline Customers (kWh) 107,100,536
18,703,751
125,804,287
Total Number of Lifeline Customers 2,073,259
1,240,572
3,313,831
Total Number of Non-Lifeline Customers 3,305,120
4,869,173
8,174,293
Total Discounts to Lifeline Customers (Php) 329,427,265.65
40,716,261.46
370,143,527.11
Average Amount of Subsidy Provided to Lifeline Customers (In Peso/kWh) 3.16 1.94 2.98
Average Amount of Subsidy Provided to Lifeline Customers (In Peso/Customer)
163.20
29.27
113.06
Source: ERC
Based on the data above, lifeline electricity end-users consumed a total amount of 25 GWh of electricity in August 2011. Of the said amount, 23% were from Private Distribution Utilities (PDUs) while 77% were consumed by lifeline electricity end-users of ECs. This amount of consumption translated to PhP 61 Million of subsidy all over the country. This resulted to an average benefit to lifeline customers from PDU franchises amounting to PhP 2.59/kWh and PhP 2.40 in EC areas to a national average of PhP 2.44/kWh subsidy. IV. COMPETITION This section provides an update on key areas of competition to include the operation of the Wholesale Electricity Spot Market (WESM), preparation for open access and retail competition and monitoring of compliance to Section 45 of the EPIRA. Significant developments include declaration of the commencement date of Retail Competition and Open Access and the increase in number of WESM participants mainly due to the integration of the Visayas WESM as well as due to the continuous implementation of the Disconnection Policy promulgated by the DOE in 2010.
A. Wholesale Electricity Spot Market Implementation
As of October 2011, the integrated WESM has a total of 112 participants comprised of 47 generating companies and 65 customer trading participants comprised of 6 Private Distribution Utilities, 46 ECs, 6 Bulk end-users and 7 wholesale aggregators. There are 40 applications being evaluated in Luzon, mostly intending trading participants while there were no applications whether generators or customers in the Visayas.
1) Following are highlights of WESM trading for the period April 2011-October 2011:
Average system demand for Luzon and Visayas registered at 5,723 MW
Peak demand was recorded at 7,530 MW which ocurred in the month of June
Spot market transactions amounted to 2,494 GWH, translating to 8 percent of
the total energy consumed in the Luzon and Visayas regions during the six

11
19th Status Report on EPIRA Implementation
19
months period while the remaining 92 percent of the total volume was transacted and settled outside the market.
Effective Spot Settlement Price for customers amounted to Php 5,257 per MWH
Table 19. Luzon and Visayas Trading Results
Billing Month Peak Demand Coincidental
Energy Offers Average Demand
Average Energy Offers
58 Apr-2011 7,037 7,419 5,384 6,953 59 May-2011 7,507 7,326 6,059 6,892 60 Jun-2011 7,530 7,338 5,828 6,964 61 Jul-2011 7,404 7,742 5,814 6,722 62 Aug-2011 7,188 7,394 5,699 6,847
63 Sep-2011 7,099 7,039 5,686 6,789
64 Oct-2011 7,219 7,252 5,594 6,552
Table 20. Metered Quantity
Billing Month Metered Quantity
(Load), MWh
Spot Quantity (Load), MWh
%
Bilateral Contract
Quantity, MWh %
58 Apr-2011 4,313,514.71 202,777.98 5% 4,110,736.73 95%
59 May-2011 4,675,217.40 399,466.39 9% 4,275,751.00 91%
60 Jun-2011 4,665,692.14 453,082.12 10% 4,212,610.01 90%
61 Jul-2011 4,496,424.04 358,118.31 8% 4,138,305.73 92%
62 Aug-2011 4,588,527.67 280,049.63 6% 4,308,478.03 94%
63 Sep-2011 4,591,257.49 364,979.67 8% 4,226,277.81 92%
64 Oct-2011 4,359,048.50 435,802.47 10% 3,923,246.03 90%
Generation in Luzon and Visayas for the billing period May to October 2011 was
dominated by Coal Power Plants at 37.75 percent followed by Natural Gas Plants at 36.08 percent. Geothermal contributed a share of 14.9 percent, hydro with percent. Diesel powered power plants contributed about 2 percent, a minimum contribution of generation came from Wind-Based Plants at 0.07 percent.
Table 21. WESM Generation Mix
Billing Month
Hydro
Geo
Coal
Nat Gas
D/O
Wind
Biofuel
59 May-11 4.4% 14.6% 42.2% 35.7% 2.9% 0.056% 0.036% 60 Jun-11 5.8% 15.1% 41.1% 36.9% 1.0% 0.049% 0.000% 61 Jul-11 7.9% 15.4% 40.1% 34.6% 2.0% 0.095% 0.000% 62 Aug-11 9.4% 15.3% 34.6% 38.5% 2.1% 0.056% 0.000% 63 Sep-11 13.6% 14.7% 33.9% 36.5% 1.3% 0.081% 0.000% 64 Oct-11 13.7% 14.3% 34.6% 34.3% 3.1% 0.100% 0.006%
Source: PEMC-MO
Source: PEMC MO
Source: PEMC MO

11
19th Status Report on EPIRA Implementation
20
2) Status of Pending ERC Regulatory Filings a. Market Fees
ERC issued various Orders setting the hearings on PEMC’s application for the
approval of the level of Market Fees which were on 17 & 25 October, and 15 November 2011
On 15 September 2011, PEMC filed an application for the approval of additional market fees for the New Market Management System (NMMS) in the estimated amount of PhP841.05 M. On 26 September 2011, ERC Ordered set the application for public hearings on 24 & 25 October 2011, and 16 November 2011.
PEMC’s petition for the review of MMS Migration is still pending with the Court of Appeals (CA). An additional public hearing for PEMC’s application on the approval of Market Fees for the WESM Visayas, was conducted on 14 September 2011. On 29 September 2011, PEMC filed its Formal Offer of Evidence and Compliance, highlighting the MDOM Software Modification Project. As regard to the Market Fees Setting Rules (MFSR) on 29 September 2011, PEMC received the Resolution of the CA noting PEMC's Manifestation and considering the case closed and terminated for lack of interest on the part of petitioner.
b. Pricing and Cost Recovery Mechanism for Reserves (PCRM)
On 06 June 2011, the ERC issued an Order denying PEMC’s prayer for the approval of the phased-in implementation of the WESM PCRM for Reserves and the deferral of the filing for approval of the reserve market in the Visayas pending the ERC's resolution on the Luzon reserve market.
However, PEMC's motion to implead the System Operator (SO) was granted. The NGCP as SO was directed to coordinate and cooperate with PEMC to accomplish the operational enhancements earlier directed by the ERC. The Order further read: "Considering the integration of the Visayas to the Luzon Grid, the Commission reiterates PEMC's compliance, in coordination with the NGCP, with the directives embodied in the November 15, 2010 Order with modifications as follows:
a) Within three (3) months from receipt of this Order, to submit
measures to Mitigate Market Power; and
b) Within six (6) months from receipt of this Order to:
i. Implement an Ex-ante Partial Effectiveness Factors to allow broader competition in Reserve Market Categories;
ii. Realign the Specification of Reserve Services to create a Fast Contingency Service;
iii. Set up New Lower Reserve Service;
iv. Introduce ILD as a Fully Functioning Reserve Service;
v. Set up interim arrangement for ILD;

11
19th Status Report on EPIRA Implementation
21
vi. Set up appropriate changes in the PGC; and
vii. Submit Plans for future enhancements and develop interim plans." (hereinafter, collectively referred to as "Operational Enhancements")"
On 26 September 2011, PEMC filed a Manifestation and Motion where it prayed that an Order be issued:
Confirming PEMC's submission of Market Power Mitigation Measures for the WESM Reserve Market on 1 August 2011;
Directing service to NGCP-SO of a copy of the 6 June 2011 Order; and
Noting PEMC's Manifestation that it shall submit a conceptual framework to implement the directives of the Commission.
3) Update on WESM Governance Activities
Following are highlights of the activities of the various WESM governance committees for the report period.
c. Market Surveillance Committee (MSC)
Held consultative meeting with Grid Management Committee (GMC) on its monitoring of compliance with Clause 6.3.3 on the Operational Responsibilities of the generators under the Philippine Grid Code (PGC), which requires the generators to fully deliver the capabilities declared in their Connection Agreement or Amended Connection Agreement, and to provide accurate and timely planning operations data to the Grid Owner and System Operator. This is significant MSC’s monitoring of the trading participants’ compliance to the must-offer rule.
The MSC also approved the Revised Process Flowcharts in the Compliance Monitoring, Reporting and Evaluation on the Must Offer Rule and RTD Schedule/Instruction, as part of its ongoing initiative to review and streamline current procedures and processes.
d. Dispute Resolution Administrator (DRA)
The Dispute Resolution Group (DRG) recommended for WESM Rules amendments to separate the DRG from the governance structure of the PEMC and instead outsource mediators and arbitrators for disputes in the WESM from a pool of accredited mediators and arbitrators. This was approved by the PEM Board on 30 June 2011 leading to the dissolution of the DRG, the appointment of a new DRA under the new structure and the establishment of the Dispute Management Protocol (DMP).
e. Rules Change Committee (RCC)
The RCC is mandated to provide assistance to the PEM Board and the Department of Energy (DOE) in the formulation and amendment of the WESM Rules and the Market Manuals. The formulation and amendment of Rules and Manuals is aimed at enhancing market design, as well as refining market processes and operations appropriate for the current environment.

11
19th Status Report on EPIRA Implementation
22
During the covered period, the RCC deliberated and approved the proposed New WESM Manual on the Segregation of Line Rental Trading Amounts which documents the manner by which the line rental trading amount is computed in the WESM as well as provides the methodology for segregating line rental trading amounts into losses and congestion cost. It was subsequently approved by the PEM Board during its meeting on 25 August 2011.
The RCC likewise continued its deliberation on the Proposed Amendments to the WESM Manual on the Management of Must-Run Units which involve revisions on the compensation and settlement mechanism to comply with ERC Order dated 6 February 2008 in ERC Case No. 2006-007 RC, as well as provide for regional application of the methodology for allocating the MRU settlement. For this purpose, regional application means that the application of cost recovery will be applied only to the region where the must-run unit is implemented. The proposal also involves revisions on the flowchart to reflect the current procedures being followed by the System Operator (SO) in designating and scheduling of MRUs. Other RCC accomplishments during the report period are detailed in Annex No. 5.
f. Technical Committee (TC)
The TC provided recommendation to the RCC on the proposed amendments to the Management of MRU Manual Issue 4.0. It proposed that WESM should strictly enforce the must-offer rule and ensure the reliability and availability of Day-Ahead Projection (DAP) figures since SO is using it for ancillary service planning and scheduling.
The TC likewise reviewed the NGCP’s recommendations of still using the +/-3% dispatch deviation and lowering of trading interval (i.e. 30 minutes or lower) in which it highlighted that there is a need to determine the dispatch tolerance level per type of plant based on historical information.
On the issues on Automatic Load Dropping (ALD) and Manual Load Dropping (MLD), the TC raised concerns on the need to look at the infrastructure requirements to address MLD of Loads with Bilateral Contracts and the need to further review and provide new market policies. Other accomplishments of the Technical Committee during the report period are detailed in Annex No. 6.
g. PEM Audit Committee
PA Consulting Group Ltd. (PA) of New Zealand, the External Auditor for the 2nd MO presented its findings and recommendations to the PEM Board on 25 August 2011. On 26 August 2011, PA submitted the draft audit report to the PAC, for final review and comments/responses from PEMC management. The second MO Audit will conclude with the acceptance of the Final Audit Report and Audit Certificates for all WESM-related numerical software by the PAC, WESM Audit Technical Working Group (TWG) and PEMC.
The said audit covered the review of the systems and procedures on market operations, and the billing and settlement, including the interfaces with the System Operator (SO), the Metering Services Providers (MSP), WESM Participants, the ERC and the DOE for the period 26 June 2009 to 25 June 2011.

11
19th Status Report on EPIRA Implementation
23
4) WESM Registration
Table 22. Registration Update as of October 2011 (Luzon and Visayas)
CATEGORY EXPECTED (Luz& Vis)
REGISTERED APPLICANT
NOT REGISTERED DIRECT INDIRECT
LUZ VIS LUZ VIS LUZ VIS LUZ VIS
Generation Companies 48 25 22
1
Customer Trading Participants
Private DUs & LGUs
15 3 3 4 0 3 1
1
ECs 72 23 23 14 5 7
Bulk users 111 3 3 37 22 29
17
Wholesale aggregators
7 7
Total Customer Trading Participants
205 36 29 55 27 40
18 1
TOTAL PARTICIPANTS/ APPLICANTS
253 61 51 55 27 40 18 2
Source: PEMC Notes: 1. Changes from August 2011 WESM Registration Status Update:
a. Total number of expected participants is 253 from 254 and total expected customer
trading participants is 205 from 206. This is because the number of expected bulk users is reduced by 1 from 112 to 111 with the inclusion of Hanjin Heavy Industries and Construction under Subic Enerzone Corporation. It was explained that HHIC facilities are located within the SEZ facilities and as such, is not to be registered separately.
b. Panay Electric Company (PECO) is excluded from the list of registered Indirect WESM Members (private distribution utilities) in the Visayas, as its membership is recommended to be deferred due to pending issues in regards its connection to the grid. Thus, the total number of registered Indirect Members in the Visayas is now 27 instead of 28.
c. La Union Electric Cooperative, Inc. was approved as Direct WESM Member, bringing total number of Luzon ECs registered as Direct WESM Member to 23.
d. Applications were received from two bulk users in Luzon, namely Linde Philippines, Inc. (formerly CIGI) and Itogon Suyoc Resources bringing total number of bulk user applicants in Luzon to 29 and reducing non-registered bulk users to 17.
e. Application was received from Bohol Enterprises, Inc., bulk user in the Visayas, bringing total number of Visayas bulk users registered as Indirect WESM members to 22.
2. Expected number of wholesale aggregators is based on number of applicants, and not based on number of licensed aggregators.
B. Open Access and Retail Competition
On 06 June 2011, the ERC declared that the compliance to the pre-conditions under Section 31 of the EPIRA for the implementation of Retail Competition and Open Access (RCOA) has been fulfilled. Specifically for the compliance to Section 31 (d) and 31 (e), as well as the

11
19th Status Report on EPIRA Implementation
24
additional pre-condition stipulated under ERC Resolution No. 3, Series of 2007, the ERC declared the compliance as follows:
Fulfillment of the requirements under Section 31 (d) and (e)
As presented by PSALM the computation for the purpose of determining the compliance to the said pre-requisites was based on the list of power plants for privatization/disposal as approved and endorsed by the Joint Congressional Power Commission (JCPC) through Resolution No. 2002-02 issued in 29 August 2002.
Accordingly, the government has already turned-over 79.56 percent of its generating assets to the winning bidders as of March 2011. This is equivalent to 3,370.31 MW out of 4,236.18 MW total generating assets offered for privatization in Luzon and Visayas. With regard to the transfer of the contracted energy outputs of NPC-IPPs to IPP Administrators (IPPA), PSALM has already transferred 76.85 percent of the total NPC contracted energy outputs to the IPPAs which is equivalent to 3,593.91 MW out of 4,676.41 MW in Luzon and Visayas.
Readiness of the necessary infrastructures
One of the fundamental requirements of the RCOA is the adequacy of generation supply in order to prevent exercise of market power in the retail competition. In its decision on Case No. 2011-004 RM, the ERC cited DOE’s submission of the supply and demand outlook for the next five years in Luzon and Visayas to justify sufficiency of supply. Positive outlook were presented for both grids considering the commercial operations of about 710 MW coal power plants in the Visayas and 600 MW coal power in Luzon in 2013. On this basis, the ERC conclude that the supply conditions would be sufficient to sustain the operations of the retail market.
As regard to the readiness of the transmission network, the NGCP provided its list of ongoing and proposed transmission projects in Luzon and Visayas. The projects are intended to improve the performance of the transmission system and minimize possible occurrences of congestions. According to NGCP, the projects in the Visayas which are expected to be completed in 2011 will enable to transport power from Luzon to Leyte and provide adequate power to Cebu, Negros and Panay sub-grids which have been experiencing power shortages due to transmission constraints and increasing power demand. The ERC found this sufficient enough to support the wholesale market which in turn will also be sufficient enough to support the retail market.
With the completion of most of the requirements as provided in Section 31, based on the resolutions and decisions on various applications for unbundling and removal of cross subsidy and the commercial operation of the wholesale electricity spot market in Luzon and Visayas as presented at ERC Case no. 2011-004 the ERC determined that all legal pre-conditions have been fulfilled. Relative to this, the ERC issued Resolution No. 10, Series of 2011 declaring 26 December 2011 as the open access date to mark the commencement of the full operations of the competitive retail electricity market in Luzon and Visayas. Corollary to this, all electricity end-users with an average demand of at least one (1) MW for the past twelve months before 26 December 2011, as certified by the ERC to be a contestable customer, shall have the right to their own electricity suppliers. However, to ensure readiness of stakeholders and the market environment, the DOE created the RCOA Steering Committee (RCOA-SC) through Department Circular No. 2011-06-0006 to assist in recommending policies towards ensuring the sufficiency of existing rules, infrastructures and other institutional requirements necessary to achieve smooth transition to RCOA.

11
19th Status Report on EPIRA Implementation
25
Chaired by the DOE, RCOA-SC membership is composed of heads of DOF, ERC, TRANSCO, PSALM, NPC, NEA, PEMC, PEZA, and NGCP with ERC as observer and resource agency. Three (3) technical working groups (TWGs) were created to address technical, financial, and risk management issues concerning RCOA implementation. Each group was tasked to identify the potential issues respective to their areas of concerns and to regularly coordinate and interact with ERC to validate and determine if any identified issue had been considered and addressed in the ERC issuances.
From its creation to the date of this report, the RCOA-SC discussed the following possible recommendations:
i. Deferment of the Implementation of RCOA on 26 December 2011 to a later date
One of the major recommendations is the deferment of the RCOA implementation. As suggested by some proponents, the RCOA implementation should be deferred until such time that the necessary infrastructures and guidelines are all set-up or to any viable date which ensures the policy and operational success. Also, infrastructures needed for the Business-to-Business (B2B) System and Accounting, Billing and Settlement System (ABS) which are considered vital component of the retail market are yet to be organized. Insufficiency of time to conduct comprehensive review and analysis of new rules and guidelines that the regulator may issue is also a major concern considering the requirement to contract with the Retail Electricity Supplier (RES) 30 days before implementation of the RCOA. According to the various stakeholders, the postponement will allow Contestable Customers (CCs) to engage in more detailed preparations and will allow them to properly evaluate governing rules and regulations.
ii. Revisit RCOA Design/Framework
The concern raised by the TWGs with regard to the design/framework of the retail electricity market is whether RES and contestability will be mandatory. As provided under Section 31 of the EPIRA, it stipulates that “ERC shall allow all electricity end-users with a monthly average peak demand of at least one megawatt (1MW) for the preceding twelve (12) months to be the contestable market”. However, with the requirement for the Supplier of Last Resort if a CC is not able to contract with the RES, it seems to be understood that both RES and being part of the contestable market is mandatory. Therefore, this puts the CCs no choice but be part of the retail market.
iii. Establishment of the B2B Infrastructure
With regard to the establishment of the B2B System, there is still a need to see a clear guidance or direction where to source funding for the B2B system and a clear mechanism for the recovery of cost in putting up the system costs for its operation and maintenance. For the entity that acts as the Central Registry Body (CRB)/Central Registration Agent (CRA) the TWGs sees that it would be more beneficial that at the onset of the implementation of open access, the CRA/CRB is an independent 3rd party that will handle data bank, customer switching, monitoring and operation of the B2B system.
iv. Accounting, Billing and Settlement
With regard to the Accounting, Billing and Settlement System, the TWG recommends to develop ABS Manual. The imbalances in the WESM due to additional participants should be fully accounted under the B2B system, i.e., properly determine the responsible entity that

11
19th Status Report on EPIRA Implementation
26
should be charged. There should be an accurate, transparent and timely accounting of the energy quantity injected into the DU system and their attendant cost schedule and frequency of data submission.
C. Market Power Monitoring
There is not much movement with regard to capacity ownership for the last six months (April to October 2011). However in October, PSALM awarded in favor of the joint venture of SPC Light Company and SPC Power Corporation (SPC Power Consortium) the operation and maintenance service contract (OMSC) for the 650-megawatt (MW) Malaya Thermal Power Plant. Although SPC has been in operation for years, this will be the first plant in Luzon that they will operate.
Figure 1. Market Share (Philippines, Luzon, Visayas, and Mindanao)
Source: DOE
PSALM still holds 15 percent share in Luzon with SMEC still leads with 28 percent share, Lopez Group with 20 percent while Aboitiz has 17 percent. NPC is still left with 2 percent share due to still pending privatization of Angat Hydro Power Plant. In the Visayas, PSALM still has 35 percent share pending privatization of its contracted capacity with the EDC on the Leyte Geothermal Power Plants. Global Business Power continues to increase its share with 24 percent, SPC with 16 percent while Aboitiz Group has 6 percent.

11
19th Status Report on EPIRA Implementation
27
In Mindanao, the government still control the generation business with a total of 81 percent with NPC having 53 percent share while 28 percent for PSALM of the generation capacity in the grid. Aboitiz has a bit increased its share in the grid due to the commercial operation of the 42 MW Sibulan HEPP.
For the national grid, SMEC still lead the generation market with 21 percent share of the national capacity. Lopez group still has 17 percent, Aboitiz wit 16 percent, NPC with 8 percent while PSALM still has 19 percent. During the report period, no generating company was able to breach the limitation set in Section 45 (a) of the EPIRA.
V. POWER SUPPLY SECURITY AND RELIABILITY The data on installed generating capacity of each power plant are based on the Monthly Operations Report submitted to the DOE by the generating companies and are counter checked from the Daily Operation Report of the NGCP. Total installed capacity in the country of 2011 decreased to 16,128 MW from 16, 358 MW in 2010, equivalent to 1.4 percent decline. This is mainly attributed to the decommissioning of the 49MW Northern Negros geothermal power plants in June 2011 and the non-availability of the some diesel power plants in the country. In Luzon, the installed capacity dropped by 2 percent, from 11,981 MW in 2010 to 11,764 MW in 2011 as a result of the non-availability of some diesel power plants in the grid. However, the dependable capacity of Luzon grid grew by 2 percent buoyed by the testing and commissioning of the 3 x 25 MW Ambuklao hydro facilities during the latter part of the 1st semester of 2011. The first and second units started its operation last June 2011 and the 3rd unit in October 2011 respectively. Also, the recommissioned/transferred from PSALM to Udenna of the 116 MW diesel power plant in Subic during the 2nd quarter of the year contributed to the reported increase in dependable capacity of the Luzon grid. In the Visayas installed capacity also reduced slightly to 1 percent, traced mainly related to the decommissioning of the Northern Negros Geothermal facility. However, dependable capacity in Visayas reflects accelerating path with 17 percent increase, from 1,745 MW in 2010 to 2,046 MW in 2011. In Mindanao, the stability and reliability of power supply was still considered to be the major challenge in the country since the power reserve level in the island remained precariously low. Since 2006, the power supply in Mindanao has remained the same while the demand growth continues its strong growth. Even if the existing hydro power plants are running in full capacity, the need to curtail load is necessary due to a generation deficiency caused by the scheduled maintenance of some power plants, and the unexpected shutdown or reduced capability of others. The corresponding power curtailment, if any, is lifted once the demand recedes or once there is enough available capacity coming into the grid from the power plants. The Mindanao grid-wide power load curtailment is implemented to maintain the power grid’s security and reliability. In 2010, the long dry spell brought about by the El Nino aggravated the prevailing power deficiency in Mindanao. The shortage of power continued to accelerate in 2011 merely because there were no additional capacities goes on stream against the growing power demand in the grid. It was observed in 2011, available capacity in Mindanao on the average was 1,317MW as against the peak load of 1, 346 MW or a deficiency in reserves of 28 MW.

11
19th Status Report on EPIRA Implementation
28
A. Power Generation
Gross electricity generation of 2010 reached 68,279 GWh, posting a minimal increase of 0.79 percent compared to 67,743 GWh in 2010. Generation in Luzon grid registered a decline of 0.80 percent while Visayas registered a remarkable increase of 12.62 percent due to the commissioning of the coal-fired power plants in the grid. In Mindanao, due to suppressed demand in view of capacity constraints, electricity generation dropped by 2.48 percent.
Table 23. PHILIPPINES, 2011 and 2010 Comparative Generation, GWh
FUEL TYPE 2011 2010 Difference
GWh % GWh % GWh %
Coal 25,430 37.24 23,301 34.40 2,129 9.14
Oil-based 2,498 3.66 7,101 10.48 -4,603 -64.83
Natural Gas 20,277 29.70 19,518 28.81 759 3.89
Geothermal 10,494 15.37 9,929 14.66 565 5.69
Hydro 9,451 13.84 7,803 11.52 1,648 21.11
Wind 70 0.10 62 0.09 8 13.20
Solar 1 0.00 1 0.00 0 -30.61
Biomass 58 0.09 27 0.04 31 113.42
Total 68,279 67,743 536 0.79
Source: DOE Note: As of January 2012, excluding off-grid with embedded assumptions.
Luzon power supply was generally sufficient throughout the year of 2011. However, under-generation or load shedding were experienced by the grid towards the end of the year. These were brought about by the limited output of natural gas plants due to fuel supply restrictions from the SPEX Malampaya onshore gas plant on the last quarter of the 2011.
Table 24. LUZON Grid, 2011 and 2010 Comparative Generation, GWh
FUEL TYPE 2011 2010 Difference
GWh % GWh % GWh %
Coal 19,547 39.20 20,047 39.88 -500 -2.49
Oil-based 742 1.49 3,287 6.54 -2,546 -77.44
Natural Gas 20,277 40.66 19,518 38.83 759 3.89
Geothermal 4,395 8.81 3,323 6.61 1,072 32.25
Hydro 4,807 9.64 4,014 7.98 794 19.78
Wind 70 0.14 62 0.12 8 13.20
Biomass 26 0.05 14 0.03 12 81.87
Total 49,864 50,265 -400 -0.80
Source: DOE

11
19th Status Report on EPIRA Implementation
29
Table 25. VISAYAS Grid, 2011 and 2010 Comparative Generation, GWh
FUEL TYPE 2011 2010 Difference
GWh % GWh % GWh %
Coal 4,431 43.36 1,529 26.49 2,903 189.87
Oil-based 402 3.93 1,727 29.92 -1,325 -76.73
Biomass 32 0.31 13 0.22 19 148.57
Geothermal 5,308 51.94 5,771 100.00 -463 -8.02
Hydro 47 0.46 36 0.62 11 30.82
Total 10,220 9,075 1,145 12.62
Source: DOE
Table 26. MINDANAO Grid, 2011 and 2010 Comparative Generation, GWh
FUEL TYPE 2011 2010 Difference
GWh % GWh % GWh %
Coal 1,452 17.72 1,726 20.54 -274 -15.86
Oil-based 1,354 16.53 2,087 24.84 -733 -35.12
Solar 1 0.01 1 0.01 0 -30.61
Geothermal 790 9.65 834 9.93 -44 -5.28
Hydro 4,597 56.10 3,754 44.68 843 22.45
Total 8,194 8,403 -209 -2.48
Source: DOE
In 2010, the Mindanao shortfall in power supply was severely felt throughout the island when a prolonged dry season that brought the water level in Lake Lanao several centimeters below the critical level. But towards the end of the year, the Mindanao power situation has reached its critical level that requires new power stations to be built within the next succeeding years. Since the government was no longer allowed to generate new capacities following the enactment of the Electric Power Industry Reform Act Of 2001 (R.A. 9136), the state-owned company has been cutting power supply to distribution utilities. Also, the effect of the structural in the grid such as aging power plants that runs on limited capacity which entails more regular maintenance and assessment also contributed to the power supply condition in the grid.
The country’s total generation from hydroelectric power plants posted a significant increase of 21 percent, and was driven mainly by the Mindanao grid in which hydro plants were fully dispatched, since the plant capability of the hydroelectric plants in 2010 decreased as a result of low water elevation of the reservoir cause by El Nino Phenomenon.
Modest increase of 9 percent in the utilization of coal-fired power plants was noted. In the Visayas grid, the higher use of coal for power generation was mainly due to the entry of new coal generating power plants in the Grid. In Luzon and Mindanao, the timid decrease in coal-based electricity generation was compensated by the higher output of the geothermal and hydroelectric plants, respectively.
Meanwhile, in generation from national gas electricity generation, the insipid increase of about 4 percent in 2011 was driven mainly by the generation supply constraint brought about by the maintenance shutdown of the Malampaya natural gas pipeline from 20-26 October. The effect of the gas restriction causes the whole plant of Ilijan (1,200 MW) not

11
19th Status Report on EPIRA Implementation
30
available from the whole period of 20-26 October 2011 in parallel with the Malampaya Natgas shutdown. Thus, overall generation sourced from the indigenous gas fuels dripped, as a result of the natural gas restriction of Malampaya, which led to the use of the liquid fuel.
On the other hand, the country’s total generation from oil-based power plants reflects a decelerating path, with 65 percent decline from 7,101GWh in 2010 to 2, 498 GWh in 2011. As recalled in 2010, oil-based power plants were frequently dispatched as a must run unit to address the insufficient reserve capacity in the Luzon grid. While in the Mindanao, while the grid was able to cope up with the limited hydroelectric power plants output, from 2,087 GWh in 2010 to 1,354 GWh in 2011, a 35 percent decline in the generation sourced from oil-based generating facilities was recorded.
Year-on-year (y-o-y) gross power generation from geothermal power plant accelerated by 6 percent or 759 GWh from 9,929 GWh in 2010 compared to 10, 494 GWh in 2011. The slight increase of generation from geothermal power plants was attributed to the following reasons: 1) The unit 1 of Bacman (55 MW), after being out of service since March 2009, synchronized to the system last December 2011 to conduct tests and commissioning and it is expected that two (2) other units of Bacman will also conduct commissioning tests in the first quarter of 2012; 2) Decommissioned of Northern Negros Geothermal Power Plant (49 MW); and 3) Palinpinon Geothermal Power Plant Unit 2 was out for 85 days ( Sept 19 to Nov 29) due to main transformer failure.
Contributions from renewable energy such as wind, solar and biomass combined, inclined by 43 percent or 39 GWh with a share of only 19 percent to the total generation. The prevalence of the substantial increase was attributed from the 4MW San Pedro Landfill Methane Recovery and Electricity Generation in Luzon and 15 MW of Central Azucarera de San Antonio (CASA).
B. System Peak Demand
Luzon demand in the 1st semester of 2011 was generally lower relative to the previous year due to lower energy demand on account of cooler temperatures. It will be recalled that the extensive heat all over the country brought by El Niño Phenomenon in the first half of 2010 drove up the demand for electricity. However, the inception of La Niña from the latter half of 2010 until 1st semester of 2011 brought cooler temperatures. System peak intensity during the month of June posted a remarkable figure of 7, 552 MW or 1 percent lower compared to the same period of 2010 and 1 percent lower compared to the previous year’s maximum peak which occurred on May 2010.
Meanwhile, average electricity requirement in Luzon for the 2nd semester of 2011 accelerated to 3 percent from the semester-ago level decrease of 1 percent but was slightly lower than the year-ago level of 5 percent.
In the Visayas, coincident peak demand in December 2011 reached 1,481 MW, higher by about 4 percent compared from the previous year of the same month with 1,431 MW. In sub-grid level, Cebu reflected highest average demand for the whole year of 2011 with a 48 percent share to the total average demand of Visayas grid. The lowest recorded system demand in the grid was on 25 December 2011 (Christmas Day) with 1,202 MW.
The rapid expansion of business activity in Visayas continued to edge higher, affecting the grid’s power demand growth. With the fast-paced development of the key cities in Visayas, the region’s power generation capacity for the year 2010 remained tight. The integration of the new capacity to the grid due to the commercial operation of the new power plants on

11
19th Status Report on EPIRA Implementation
31
the 1st semester of 2011 (3 x 72MW Coal by CEDC), (2x72 MW Coal by PEDC) and the (2 x 100MW Coal by Kepco-Salcon) contributed to avert the power shortage in the grid.
Meanwhile, the recorded maximum peak demand on December 2011 is 1,346 MW, a 5 percent increase compared to 2010 actual coincident peak with 1,288 MW of the same period while the lowest recorded demand was on 25 December 2011 (Christmas Day) with 996 MW.
The continued deficiency of available supply in Mindanao despite the increasing demand for power has a significant adverse effect on the grid. As such, suppressed demand was observed throughout the grid since the power shortage was looming in the horizon. With limited available capacities to meet the demand for power supply, Mindanao braces for a shortage of power.
In line with this, the government and private sector initiated mitigation measures against the worsening power scenario in the grid. This includes the close monitoring of the power situation in Mindanao and exploring all the possible measures to help mitigate the occurrence of power outages in the grid until new capacities come in.
C. Status of Transmission Projects
In the transmission sector in Luzon, the project Dasmariñas Substation Expansion, a component of Luzon Transmission Line Upgrading I, which originally aims to provide N-1 (as the third 300 MVA transformer) at the substation but will now be installed as a replacement to the damaged unit in Dasmariñas. Target delivery of transformer and high voltage equipments is by 12 October 2012 and the target date for the completion of this project is by 31 January 2012.
To support the long term power requirements of Samar and improve the delivery of quality and reliable power in the island, NGCP is constructing the 138 kV Paranas (Wright) – Carayman (Calbayog) transmission line. The new line will replace the old 69 kV woodpole transmission line and will address the overloading of Paranas Substation. As of 31 August 2011, both substation and transmission component of this project is expected to be energized with load by 31 November 2011.
In the Mindanao Grid, the Balo-I (Abaga) – Villanueva (Kirahon) 230 kV TL Project, a project component the Mindanao 230 kV Backbone Transmission, will provide additional transmission corridor to the 888 MW Agus Hydro Complex (including expected entry of Agus 3 HEP). Currently Agus 2-Kibawe and Balo-i-Tagoloan 138 kV lines serve as Agus Complex’s link to the Grid. Over-time, the N-1 being provided by these lines to the Agus Complex has been lost due to increase in demand. In addition, this project will also serve as an initial step in developing a higher capacity transmission highway from north to south of the grid to meet the
Figure 2. Dasmarinas Sub-Station Expansion
Figure 3. Bal-oi - Villanueva 230 kV Transmission Line Project

11
19th Status Report on EPIRA Implementation
32
Figure 4. Mindanao S/S Expansion 2005 (Phase II)
increasing demand in Davao area.
Another project in is the Mindanao S/S Expansion – 2005 (Phase II) involves the installation of additional transformers at Butuan and Sta. Clara Substation in order to meet load growth. In additional this will provide N-1 capability to the other substations to mitigate supply interruption during planned and unplanned outages for transformers. As of 31 August 2011 the Butuan S/S is 92 percent complete and is scheduled to be completed by 31 August 2011 while the Sta.Clara expansion is 90 percent complete and is scheduled to be completed by 30 November 2011.
D. ERC-Approved Capital Expenditure Projects
The ERC has approved a total of four (4) Capital Expenditure (CAPEX) Projects applied by South Cotabato II Electric Cooperative, Inc. (SOCOTECO II), Cebu II Electric Cooperative, Inc. (CEBECO II), Surigao del Sur I Electric Cooperative, Inc. (SURSECO I), Batanes Electric Cooperative, Inc. (BATANELCO) for the period May 2011 – August 2011 as reflected in Annex 14.
E. Transition Supply Contracts (TSCs)
PSALM has already privatized 79 percent of the NPC generating assets and 76 percent of its contracted capacities from the Independent Power Producers (IPPs). Due to this development, NPC together with PSALM now reduced its controls of the generation sector equivalent to 19 percent or 2,807 MW of generating capacity from almost 90 percent or about 12,500 MW before privatization.
Relative to this, PSALM has given up most of its TSCs with its customers including distribution utilities in Luzon. While significant capacity still remain in the Visayas for NPC/PSALM, these still not enough to suffice the demand of DUs in the area resulting to rationalization of supply that resulted to reduction of TSC capacities. This also happened in Mindanao after the expiration of most of the TSCs with 28 ECs in August 2011 and renewed until December 2012. This however encouraged the DUs to contract with other suppliers in order to satisfy the requirements of their consumers. Further, this also helped the DUs manage their supply mix and attain optimal price.
Figure 5. NPC Contractual Obligations for Luzon, Visayas and Mindanao
0
200
400
600
800
1000
1200
Jan-
12Fe
b-12
Mar
-12
Apr-
12M
ay-1
2Ju
n-12
Jul-1
2Au
g-12
Sep-
12O
ct-1
2No
v-12
Dec-
12Ja
n-13
Feb-
13M
ar-1
3Ap
r-13
May
-13
Jun-
13Ju
l-13
Aug-
13Se
p-13
Oct
-13
Nov-
13De
c-13
Jan-
14Fe
b-14
Mar
-14
Apr-
14M
ay-1
4Ju
n-14
Jul-1
4Au
g-14
Sep-
14O
ct-1
4No
v-14
Dec-
14Ja
n-15
Feb-
15M
ar-1
5Ap
r-15
May
-15
Jun-
15Ju
l-15
Aug-
15Se
p-15
Oct
-15
Nov-
15De
c-15
Luzon Visayas Mindanao

11
19th Status Report on EPIRA Implementation
33
VI. TOTAL ELECTRIFICATION As of 31 October 2011, the Program has already achieved 99.91 percent of the total potential barangay nationwide. Prior to the launching of ABEP, barangay electrificatio n level only stood at 76.9%, having energized only 32,281 out of 41,975 total barangay coverage. Under the program, the energization of 41,939 barangays was spearheaded by the DOE with assistance from the NEA, NPC-SPUG, and PNOC and its subsidiaries.
Among the remaining 36 unenergized barangays, seven (7) barangays have implementation issues especially in ARMM areas which have right-of-way problem and liquidation issues on previous projects. MERALCO, on the other hand, has committed to accelerate electrification of the 20 barangays yet to be energized in its franchise area. The DOE is closely coordinating with NEA and concerned LUGs on the possible options to pursue electrification of these barangays. Please note that five barangays (5) were delisted from the target due to no inhabitants and located on permanent danger zone (Albay near Mt. Mayon).
NEA reported that attained 100 percent barangay energization under the area coverage of ECs as of December 2009. It is currently developing a Sitio Electrification Program Masterplan to energize the remaining sitios in the country without access to electricity. In addition, NEA is finalizing the Barangay Enhancement Masterplan which aims to upgrade the electric facilities of off-grid barangays. However, these efforts of NEA will be done in coordination with the DOE as part of attaining 90 percent household electrification by 2017.
Table 28. Barangay Electrification Status as of 31October2011
Region
Potential
Barangays
Electrified Barangays
Unelectrified
Barangays
Electrification
Level (%) CAR 1,176 1,176 0 100.00 I 3,265 3,265 0 100.00 II 2,311 2,311 0 100.00 III 3,102 3,102 0 100.00 IV-A 4,010 3,990 20 99.50 IV-B 1,458 1,458 0 100.00 V 3,469 3,469 0 100.00 NCR 1,695 1,695 - 100.0 SUB-TOTAL LUZON
20,486 20,466 20 99.90
VI 4,050 4,050 0 100.00 VII 3,003 3,003 - 100.00 VIII 4,389 4,389 0 100.00 SUB-TOTAL VISAYAS
11,442 11,442 0 100.00
IX 1,904 1,904 0 100.00 X 2,020 2,020 0 100.00 XI 1,160 1,160 0 100.00 XII 1,194 1,194 0 100.00 ARMM 2,459 2,443 16 99.35 CARAGA 1,310 1,310 0 100.00 SUB-TOTAL MINDANAO 10,047 10,031 16 99.84
TOTAL PHILIPPINES 41,975
41,939
36 99.91
Source: DOE
Table 27. Targets Per Implementors DOE 35
BEP 1 RAES 4 ER 1-94 10 MERALCO 20
AMORE 1 Total 36

11
19th Status Report on EPIRA Implementation
34
Following are the developments in various activities that were instrumental to the near completion of barangay electrification:
A. Qualified Third Party
Chapter VII, Section 59 of the EPIRA provides that the “provision of electric service in remote and unviable villages that the franchised utility is unable to service for any reason shall be opened to other qualified third parties”.
Following are the updates on the QTP Program being spearheaded by the DOE:
1) PowerSource Philippines, Incorporated (PSPI) Rio Tuba QTP Project in Bataraza,Palawan The current active customer connections of PSPI that are being served with 24-hour electricity services are 1374. PSPI has high collection fee index of above 95% for their electricity tariff in their QTP service area. There was a decrease of about 46 household connections from the previous reporting period due to the active disconnection program imposed by PSPI as the customers think that they have no longer have to keep current on their bills because of the subsidy being availed by PSPI from UC-ME. However, PSPI think that the household connections will go up in the coming few months as customers shall realize that PSPI is strictly imposing disciplined billing payment practices. The average sales (in kwhrs) for 2011 are around 100,000kwhr per month compared to last year average sales of around 70,000kwhr per month. The substantial increase in electricity sales is due to the subsidy being collected from UC-ME. It is being projected by PSPI that the rise in electricity sales shall continue to go up.
Due to upsurge in load consumption/use, PSPI is working on the additional capacity for their existing Community Energizer Platform Power Generation Project, which only have an installed capacity of 420 kW, consisting of two diesel power plants of 210 kW each, by bringing soon a 70 kW biomass gasifier fuelled by coconut and wood chips. PSPI intends to commission the biomass plant by the first quarter of next year. Said biomass plant intends to take a third of their present load from their existing generation system.
2) PSPI Malapascua QTP Project in Bantayan, Cebu PSPI was not deterred to undertake additional in missionary areas despite the long gestation of its pilot QTP project in Rio Tuba, Bataraza, Palawan. At present, it is working on the full documentation for the filing of its 2nd QTP Project in Malapascua, Bantayan, Cebu. It has already secured a waiver agreement with the concerned Electric Cooperative, Cebu Electric II Cooperative, Incorporated and is now coordinating with NPC-SPUG for the QTP Service Contract as one of the requisite documents for packaging their QTP application for submission to DOE and endorsement to ERC.
PSPI is also actively undertaking project sites identification for the possible roll-out of their planned multi-investments for QTP. It has initially identified Liminangcong in the Province of Palawan as their third potential QTP project.

11
19th Status Report on EPIRA Implementation
35
3) QTP Project in Semirara Island, Municipality of Caluya, Antique The recent corporate restructuring of Semirara Mining Corporation (SMC) created a subsidiary group, DMCI Power to serve as the QTP applicant for the three barangays in Semirara Island, Barangays Alegria, Tinogboc and Semirara waived by the Antique Electric Cooperative (ANTECO) for possible take-over by a QTP. As a result, DMCI Power has to make the necessary amendments and modifications on the previous documentation prepared by SMC to be consistent with its proposed QTP project for the three (3) barangays in the island.
Accordingly, DMCI Power requested ANTECO to revise its previous Board Resolution it has issued and furnished to NEA, ERC and Semirara Mining Corporation taking into consideration the DOE’s Department Circular No. DC-2005-121-011 (QTP Participation Guidelines), such as the recognition of the DOE and ERCs’ mandate in the actual selection of the QTP to be authorized to operate in waived areas.
4) PRES Project in Masbate
After PAMATEC/ETDE, the Project Contractor, completed installation of the PV systems in 108 barangays benefitting 5,129 household and mini-grid systems in 102 barangays with 12,183 households’ beneficiaries, the DOE, in close coordination with NPC, worked out the development of necessary contractual and/or commercial arrangements suitable for PRES project as well as timelines and action plan to ensure the target barangays under the PRES project may be assured of least-cost electricity services that is sustainable.
Although NPC-SPUG is acting as Interim QTP and had put in place administrative guidelines for the operation of the PRES Project, the preparation of the draft O&M Contractor’s Agreement by DOE and NPC is in reference to Article 6 of the Financial Protocol between the Philippines and French Governments requiring the designation of a private party to operate and maintain the electric services provided for under the PRES Project
The DOE also suggested to NPC that it convenes a meeting with a composite team composed of DOE, NEDA, DOF and NEA to study and review the technical and economic aspects of the draft O&M Service Agreement particularly on the cost structure, subsidy computation and project duration as well as seek a common ground in finalizing the draft bidding documents including the timeline and schedule for bidding the subject Project consistent with existing government procurement and privatization policies.
B. Implementation of E.R. 1-94 Program As specified under Energy Regulations 1-94 (ER 1-94) as amended, the DOE ensures that communities hosting generating facilities or energy resource development projects are benefited. It is a way of recognizing the contribution of host communities for sharing and using their territory to put up generating facilities to energize the rest of the country.
Table 29. Summary of Financial Benefits as of October 2011 (In PhP Billion)
Particulars EF DLF RWMHEEF Total
Accrued Financial Benefit
2.54 2.96 2.27 6.77
Approved 2.33 0.94 1.21 4.48
Available/Collectible Balance
0.21 1.02 1.06 2.29
Source: DOE

11
19th Status Report on EPIRA Implementation
36
ER 1-94 provides for funds that can be accessed by host communities to further foster progress in their respective areas. However, availment of such benefits requires host communities to submit proposals which may be under any of the following: electrification fund (EF), development and livelihood fund (DLF) and reforestation, watershed management, health and/or environment enhancement fund (RWMHEEF).
From May 2011 to October 2011, the DOE approved 148 projects with a total amount of PhP159M funded under E.R. 1-94 program from which 111 projects were funded under EF amounting to PhP66.1M, 23 under DLF amounting to PhP38.37M and 14 under RWMHEEF amounting to PhP54.53M.
The total accrued financial benefit from inception is PhP 7.59 billion from which PhP 4.72 billion was obligated for the implementation of projects. The available funds as of October 2011 stood at around PhP2.87 billion. C. Challenges The main challenge that faces the power sector is the security of supply. With the country under the Aquino Administration enjoying interests from investors and the government bidding out various infrastructure projects under the public-private partnership (PPP) program in various parts of the country, it will not take time that the current capacity additions will be diluted by the surge of demand. As indicated in the Philippine Power Development Plan (PDP) 2013 -2030, the country’s demand for electricity will grow by about 4.5 percent per year. With this, the country may need a total additional capacity of about 14,400 MW during the period. To date, there are about 650 MW of capacity that would about to be commissioned between years 2013 and 2015 while there are about 1,172 MW committed capacity. These committed power projects are those which have complied with the necessary permits and clearances of various agencies and concerned local government and in the process of financial closing. While the government is receiving expressions of interest to expand existing plant or put up new plants with a total capacity of 5,023 MW, these are still at the different stage of development. Thus, there is still a possibility that these could not proceed to development status. With these, the government may need to involve itself once again into power generation to avoid power shortages in the future and keep hold of the current momentum being enjoyed as an investment attractive economy.

11
19th Status Report on EPIRA Implementation
37
LIST OF ANNEXES

19th Status Report on EPIRA Implementation
38
Annex 1. TransCo Inspection Report Based on Concession Agreement
No. Inspection Report No.
Location Name of Project/ transmission facilities Inspection Date
LUZON
1 PUC-11-18 North Luzon New Clark Substation Feb.23 to 25, 2011
2 PUC-11-18 North Luzon New Clark – Concepcion Transmission Lines, Clark and Concepcion Substations
Feb. 23 to 25, 2011
3 PUC-11-19 North Luzon Upgrading of San Manuel, Concepcion, Mexico Substations Feb. 21 to 22, 2011
4 PUC-11-19 North Luzon Upgrading of San Manuel – Concepcion – Mexico Transmission Lines
Feb. 21 to 22, 2011
5 NLRD1-11-01 Olongapo, Hermosa, Subic, Limay and Botolan North Luzon District 5 March 28 to April 1,
2011
6 NLRD1-11-03 Bauang S/S, San Esteban S/S, Bantay S/S, Curimao
S/S, Laoag S/S North Luzon District 1 May 9 to 13, 2011
7 NLRD4-11-04 Santiago S/S, Cauayan S/S, Gamu S/S, Ilagan S/S,
Tuguegarao, Bayombong, Lagawe S/S North Luzon District 4 May 23 to 27, 2011
8 NLRD6-11-05 Central Luzon Area Control Center Mexico S/S
Cabanatuan S/S Pantabangan S/S Cruz na Daan S/S North Luzon District 6 June 13 to 17, 2011
9 NLRD3-11-08 San Manuel, Nagsaag Kadampat, Labrador,
Mangaldan Substation, Pangasinan North Luzon District 3 July 25 to 29, 2011
10 NLRD7-11-09 San Jose, Araneta Dolores, Malaya, Balintawak North Luzon District 7 August 8 to 11, 2011
11 SLRD2-11-10 Tayabas, Gumaca, Makban, Kalayaan, Caliraya South Luzon District 2 August 22 to 26,
2011
12 NLRD7-11-26 San Jose Del Monte, Bulacan San Jose 750MVA Transformer Project January 25 to 28,
2011
13 NP-11-16 Kadampat, Pangasinan and San Jose, Bulacan 2x90MVAR Shunt Reactor July 25 to 29, 2011
VISAYAS
1 VISD3-11-02 Bacolod, Cadiz, Kabankalan, Mabinay, Amlan Visayas District 3 April 13 to 15, 2011
2 PUC-11-21 Amlan, Mabinay & Bacolod S/S Visayas PCB Replacement Project April 13 to 15, 2011
3 VISD2-11-07 Cebu, Talisay, Compostela, Naga, Suba, Ubay, Garcia,
Hernandez, and Bohol Substations Visayas District 2 July 11 to 15, 2011

19th Status Report on EPIRA Implementation
39
No. Inspection Report No.
Location Name of Project/ transmission facilities Inspection Date
4 PUC-11-22 Corella, Ubay, Bohol Bohol Backbone 138 kV Transmission Project March 9 to 11, 2011
5 VISD-11-18 Sta. Barbara, Dingle, San Juan, Panit-an, Baldoza Visayas District 4 October 24 to 27,
2011
MINDANAO
1 PUC-11-20 Zamboanga Sibugay Zamboanga 138kV Transmission Project March 9 to 11, 2011
2 MRD2-11-06 Overton, Lugait, Balo-I Substation and Agus 6
Switchyard Mindanao District 2 June 27 to July 1,
2011
3 PUC-11-23 Cagayan De Oro, Abaga, Kirahon Abaga-Kirahon 230kV Transmission Project August 15 to 18,
2011
4 PUC-11-23 Cagayan De Oro, Abaga, Kirahon Abaga-Kirahon 230kV Substation Project August 15 to 18,
2011
5 PUC-11-24 Kirahon, Misamis Oriental, Maramag, Bukidnon,
Mindanao Kirahon-Maramag 230kV Transmission Line Project August 15 to 18,
2011
6 MIND1-11-11 Zamboanga, Lunzuran, Sangali, Sta. Clara, Aurora Mindanao District 1 September 5 to 9,
2011
7 MIND4-11-12 Butuan, Nasipit, Anislagan, San Francisco, Bislig Mindanao District 4 September 12 to 16,
2011
8 MIND5-11-13 Davao, Kidapawan, Bunawan, Maco, Matanao,
Nabunturan Mindanao District 5 September 19 to 23,
2011
9 MIND6-14 Gen. Santos, Tacurong, Sultan Kudarat Mindanao District 6 September 26 to 30,
2011
10 MIND3-11-15 Carmen, Tagoloan, Jasaan, Kibawe, Maramag Mindanao District 3 October 3 to 7, 2011
Source: TRANSCO
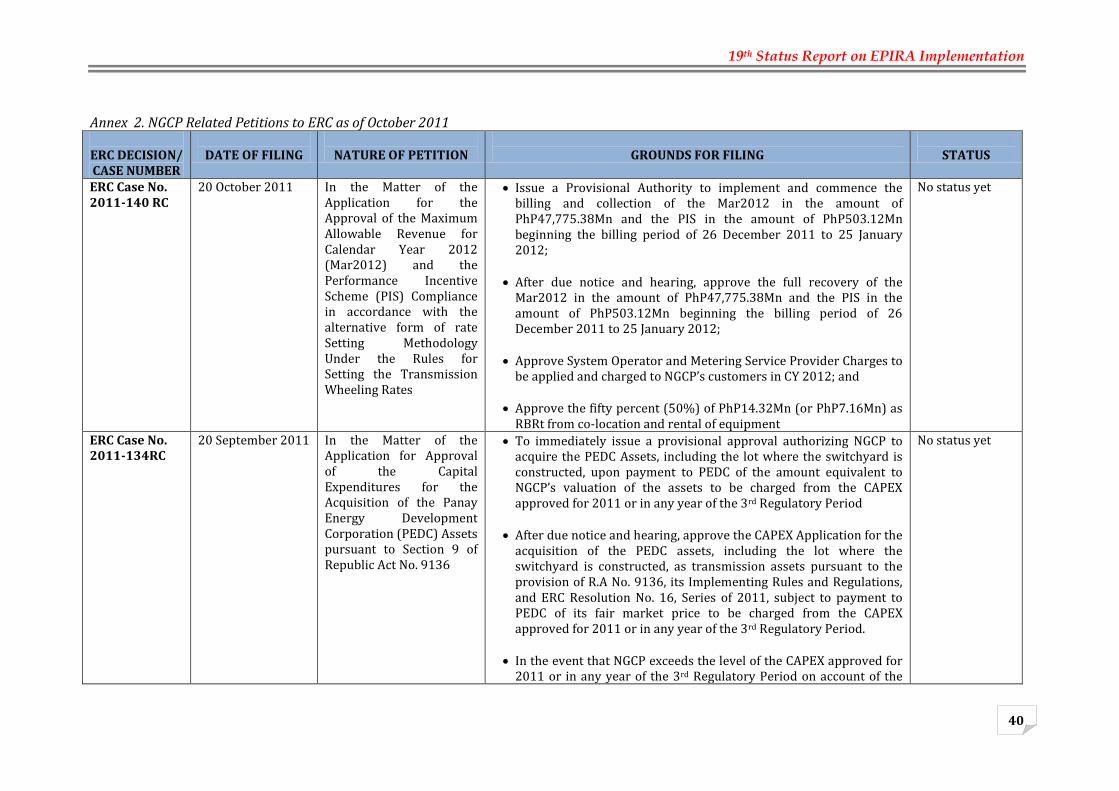
19th Status Report on EPIRA Implementation
40
Annex 2. NGCP Related Petitions to ERC as of October 2011
ERC DECISION/ CASE NUMBER
DATE OF FILING
NATURE OF PETITION
GROUNDS FOR FILING
STATUS
ERC Case No. 2011-140 RC
20 October 2011 In the Matter of the Application for the Approval of the Maximum Allowable Revenue for Calendar Year 2012 (Mar2012) and the Performance Incentive Scheme (PIS) Compliance in accordance with the alternative form of rate Setting Methodology Under the Rules for Setting the Transmission Wheeling Rates
Issue a Provisional Authority to implement and commence the billing and collection of the Mar2012 in the amount of PhP47,775.38Mn and the PIS in the amount of PhP503.12Mn beginning the billing period of 26 December 2011 to 25 January 2012;
After due notice and hearing, approve the full recovery of the Mar2012 in the amount of PhP47,775.38Mn and the PIS in the amount of PhP503.12Mn beginning the billing period of 26 December 2011 to 25 January 2012;
Approve System Operator and Metering Service Provider Charges to
be applied and charged to NGCP’s customers in CY 2012; and
Approve the fifty percent (50%) of PhP14.32Mn (or PhP7.16Mn) as RBRt from co-location and rental of equipment
No status yet
ERC Case No. 2011-134RC
20 September 2011 In the Matter of the Application for Approval of the Capital Expenditures for the Acquisition of the Panay Energy Development Corporation (PEDC) Assets pursuant to Section 9 of Republic Act No. 9136
To immediately issue a provisional approval authorizing NGCP to acquire the PEDC Assets, including the lot where the switchyard is constructed, upon payment to PEDC of the amount equivalent to NGCP’s valuation of the assets to be charged from the CAPEX approved for 2011 or in any year of the 3rd Regulatory Period
After due notice and hearing, approve the CAPEX Application for the acquisition of the PEDC assets, including the lot where the switchyard is constructed, as transmission assets pursuant to the provision of R.A No. 9136, its Implementing Rules and Regulations, and ERC Resolution No. 16, Series of 2011, subject to payment to PEDC of its fair market price to be charged from the CAPEX approved for 2011 or in any year of the 3rd Regulatory Period.
In the event that NGCP exceeds the level of the CAPEX approved for
2011 or in any year of the 3rd Regulatory Period on account of the
No status yet

19th Status Report on EPIRA Implementation
41
ERC DECISION/ CASE NUMBER
DATE OF FILING
NATURE OF PETITION
GROUNDS FOR FILING
STATUS
acquisition of the PEDC assets, the difference in amount between the actual CAPEX and the ERC-approved levels be considered exempted and excluded from the computation of the CAPEX Efficiency Adjustment as provided in Article IX of the RTWR.
ERC Case No. 2011-133RC
19 September 2011 In the Matter of the Application for the Approval of the Capital Expenditure for the acquisition of the Cebu Energy Development Corporation (CEDC) Assets pursuant to section 9 Republic act No. 9136, with prayer for Provisional Authority
Immediately issue a Provisional Approval authorizing NGCP to acquire the CEDC Assets, including the lot where the switchyard is constructed, upon payment to CEDC of the amount equivalent to NGCP’s valuation of the assets to be charged from the CAPEX approved for 2011 or in any year of the 3rd Regulatory Period.
After due notice and hearing, approve the CAPEX application for the acquisition of the CEDC Assets, including the lot where the switchyard is constructed, as transmission assets pursuant to the provisions of R.A. No. 9136, its Implementing Rules and Regulations, and ERC Resolution No. 16, series of 2011 subject to payment to CEDC of its fair market price to be charged from the CAPEX approved for 2011 or in any year of the 3rd Regulatory Period
In the event that NGCP exceeds the level of the CAPEX approved for
2011 or in any year of the 3rd Regulatory Period on account of the acquisition of the CEDC Assets, the difference in amount between the actual CAPEX and the ERC-approved levels to be considered exempted and excluded from the computation of the CAPEX Efficiency adjustment as provided in Article IX of the RTWR.
No status yet
ERC Case No. 2011-112RC
12 August 2011 In the Matter of the Application for Approval of Force Majeure (FM) event regulated FM Pass through for typhoons Basyang and Juan in accordance with the Rules for setting Transmission Wheeling Rates.
Declare the Typhoons Basyang and Juan as Force Majeure events Approve the expenditures incurred for the restoration/rehabilitation/repair of the damaged transmission facilities and proposed pass-through amount representing return on and of the capital expenditure associated with the emergency responses and repair and rehabilitation of facilities damaged due to the said events.
Grant provisional authority to implement and bill the FME Pass-
On November 22, 2010, ERC issued the Final Determination.

19th Status Report on EPIRA Implementation
42
ERC DECISION/ CASE NUMBER
DATE OF FILING
NATURE OF PETITION
GROUNDS FOR FILING
STATUS
through amount to Luzon customers from 26 September 2011 to 25 December 2015 or until such time that the amount incurred is fully recovered; and
Exclude the proposed pass-through Amount from the side constraint calculation.
Source: TRANSCO

19th Status Report on EPIRA Implementation
43
Annex 3 – Summary of MERALCO 2011 Residential Unbundled Power Rates 0 to 200 kWh (P/kWh)
BILL SUBGROUP Jan Feb Mar Apr May Jun Jul Aug Sep Oct
Generation 4.0539 4.9047 5.8183 6.7582 5.4862 5.5740 5.6334 6.0769 5.4113 4.3604
Transmission 0.7281 0.8773 0.7369 0.8195 0.7742 0.6201 0.9082 1.0067 0.9594 0.9750
System Loss 0.5761 0.7062 0.7755 0.8445 0.7193 0.6911 0.7011 0.7515 0.6491 0.5435
Distribution * 1.8832 1.5017 1.5017 1.8555 1.8555 1.8555 1.8555 1.8555 1.8555 1.8555
Subsidies** 0.1249 0.1264 0.1388 0.1474 0.1555 0.1487 0.1219 0.1106 0.1368 0.1442
Universal Charge 0.1003 0.1003 0.1003 0.1003 0.1003 0.1003 0.1003 0.1003 0.1003 0.0479
TOTAL*** 7.4665 8.2166 9.0715 10.5254 9.0910 8.9897 9.3204 9.9015 9.1124 7.9265
201 to 300 kWh (P/kWh)
BILL SUBGROUP Jan Feb Mar Apr May Jun Jul Aug Sep Oct
Generation 4.0539 4.9047 5.8183 6.7582 5.4862 5.5740 5.6334 6.0769 5.4113 4.3604
Transmission 0.7281 0.8773 0.7369 0.8195 0.7742 0.6201 0.9082 1.0067 0.9594 0.9750
System Loss 0.5761 0.7062 0.7755 0.8445 0.7193 0.6911 0.7011 0.7515 0.6491 0.5435
Distribution * 2.1868 1.8053 1.8053 2.2306 2.2306 2.2306 2.2306 2.2306 2.2306 2.2306
Subsidies** 0.1249 0.1264 0.1388 0.1474 0.1555 0.1487 0.1219 0.1106 0.1368 0.1442
Universal Charge 0.1003 0.1003 0.1003 0.1003 0.1003 0.1003 0.1003 0.1003 0.1003 0.0479
TOTAL*** 7.7701 8.5202 9.3751 10.9005 9.4661 9.3648 9.6955 10.2766 9.4875 8.3016
301 to 400 kWh(P/kWh)
BILL SUBGROUP Jan-10 Feb-10 Mar-10 Apr-10 May-10 Jun-10 Jul-10 Aug-10 Sep-10 Oct-10
Generation 4.0539 4.9047 5.8183 6.7582 5.4862 5.5740 5.6334 6.0769 5.4113 4.3604
Transmission 0.7281 0.8773 0.7369 0.8195 0.7742 0.6201 0.9082 1.0067 0.9594 0.9750
System Loss 0.5761 0.7062 0.7755 0.8445 0.7193 0.6911 0.7011 0.7515 0.6491 0.5435
Distribution * 2.4731 2.0916 2.0916 2.5844 2.5844 2.5844 2.5844 2.5844 2.5844 2.5844
Subsidies** 0.1249 0.1264 0.1388 0.1474 0.1555 0.1487 0.1219 0.1106 0.1368 0.1442
Universal Charge 0.1003 0.1003 0.1003 0.1003 0.1003 0.1003 0.1003 0.1003 0.1003 0.0479
TOTAL*** 8.0564 8.8065 9.6614 11.2543 9.8199 9.7186 10.0493 10.6304 9.8413 8.6554
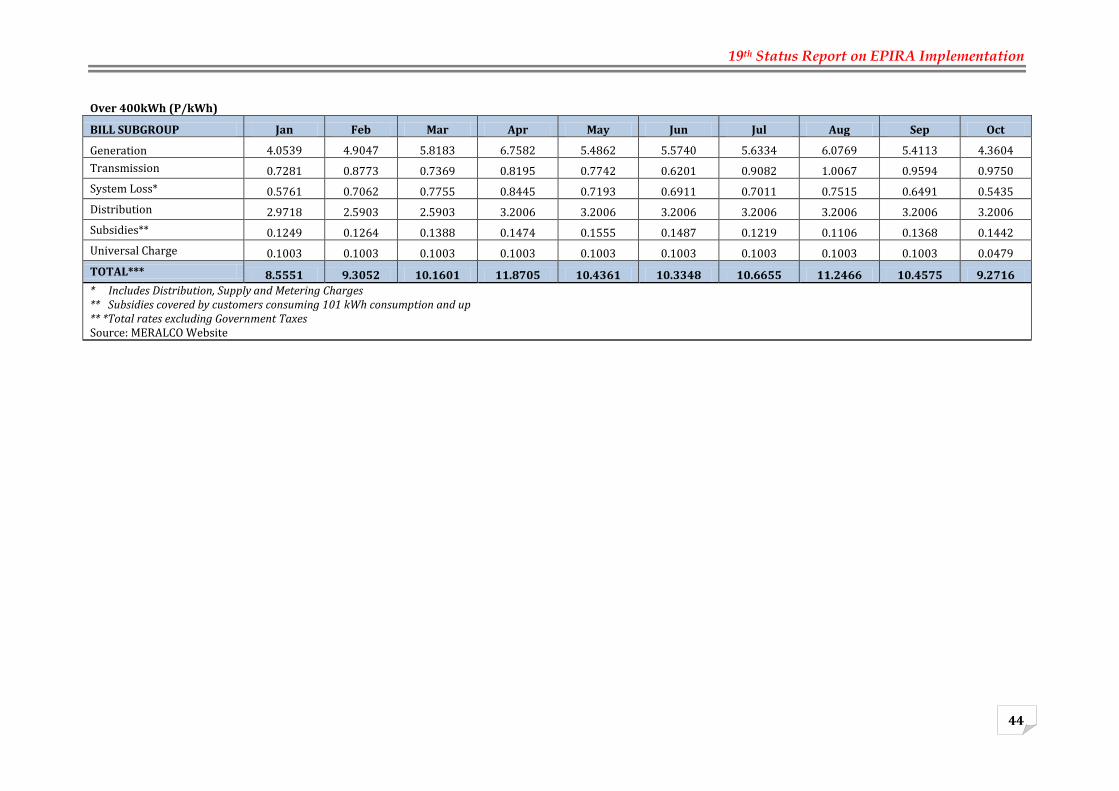
19th Status Report on EPIRA Implementation
44
Over 400kWh (P/kWh)
BILL SUBGROUP Jan Feb Mar Apr May Jun Jul Aug Sep Oct
Generation 4.0539 4.9047 5.8183 6.7582 5.4862 5.5740 5.6334 6.0769 5.4113 4.3604
Transmission 0.7281 0.8773 0.7369 0.8195 0.7742 0.6201 0.9082 1.0067 0.9594 0.9750
System Loss* 0.5761 0.7062 0.7755 0.8445 0.7193 0.6911 0.7011 0.7515 0.6491 0.5435
Distribution 2.9718 2.5903 2.5903 3.2006 3.2006 3.2006 3.2006 3.2006 3.2006 3.2006
Subsidies** 0.1249 0.1264 0.1388 0.1474 0.1555 0.1487 0.1219 0.1106 0.1368 0.1442
Universal Charge 0.1003 0.1003 0.1003 0.1003 0.1003 0.1003 0.1003 0.1003 0.1003 0.0479
TOTAL*** 8.5551 9.3052 10.1601 11.8705 10.4361 10.3348 10.6655 11.2466 10.4575 9.2716
* Includes Distribution, Supply and Metering Charges ** Subsidies covered by customers consuming 101 kWh consumption and up ** *Total rates excluding Government Taxes Source: MERALCO Website

19th Status Report on EPIRA Implementation
45
Annex 4. NPC Generation Charges in PhP/kWh
Month & YEAR LUZON VISAYAS MINDANAO
2003
January 2.4573 2.3429 1.2914
February 2.4664 2.3520 1.3005
March 2.4664 2.3520 1.3005
April 2.4664 2.3520 1.3005
May 2.4009 2.5095 1.3050
June 2.4009 2.5095 1.3050
July 2.4009 2.5095 1.3050
August 2.0065 2.5095 1.3050
September 2.0065 2.5095 1.3050
October 2.4962 2.6429 1.2933
November 2.4962 2.6429 1.2965
December 2.4897 2.6364 1.2666
2004
January 2.4897 2.7199 1.2666
February 2.3887 2.8391 1.3219
March 2.3887 2.8391 1.3219
April 2.3887 2.8391 1.3219
May 2.4614 2.9118 1.4499
June 2.5981 2.9338 1.8317
July 2.5981 2.9338 1.8317
August 2.5981 2.8349 1.8317
September 2.5981 2.8349 1.8317
October 3.9662 3.1888 2.2787
November 3.9384 3.1610 2.2509
December 3.9384 3.1610 2.2509
2005
January 3.9384 3.1610 2.2509
February 3.9384 3.1610 2.2509
March 3.9384 3.1610 2.2509
April 3.9384 3.1610 2.2509
May 4.4080 3.2823 2.5307
June 4.4080 3.2823 2.5307
July 4.4080 3.2823 2.5307
August 4.4080 3.2823 2.5307
September 4.4080 3.2823 2.5307
October 4.4080 3.2823 2.5307
November 4.4080 3.2823 2.5307
December 4.5303 3.3654 2.5965

19th Status Report on EPIRA Implementation
46
Annex 4. NPC Generation Charges in PhP/kWh
Month & YEAR LUZON VISAYAS MINDANAO
2006
January 4.5303 3.3654 2.5965
February 4.5303 3.3654 2.5965
March 4.5303 3.3654 2.5965
April 4.5303 3.3654 2.5965
May 4.5303 3.3654 2.5965
June 4.5303 3.2259 2.5965
July 4.5303 3.4043 2.5965
August 4.9100 3.4043 2.6205
September 4.9100 3.4043 2.6205
October 4.9100 3.4043 2.6205
November 4.9100 3.4043 2.6205
December 4.9100 3.4043 2.6205
2007
January 4.9100 3.4043 2.6205
February 4.9100 3.4043 2.6205
March 4.8670 3.0892 2.6160
April 4.8670 3.0892 2.6160
May 4.7857 3.0892 2.6160
June 4.7857 2.9056 2.6160
July 4.6636 2.9056 2.6160
August 4.6636 2.9056 2.6160
September 4.5887 2.9056 2.6160
October 4.3344 2.8343 2.5523
November 4.3344 2.8343 2.5523
December 3.6745 2.8343 2.5523
2008
January 4.3184 2.8343 2.5523
February 3.6469 2.8343 2.5523
March 3.6469 2.8043 2.5523
April 3.8896 2.8043 2.5523
May 3.8896 2.9056 2.5523
June 3.1780 2.9934 2.5277
July 3.1780 2.9934 2.5277
August 3.1780 2.9934 2.5277
September 3.1780 2.9934 2.5277
October 3.1780 2.9934 2.5277
November 3.1780 2.9934 2.5277
December 3.3611 2.9934 2.5277
2009
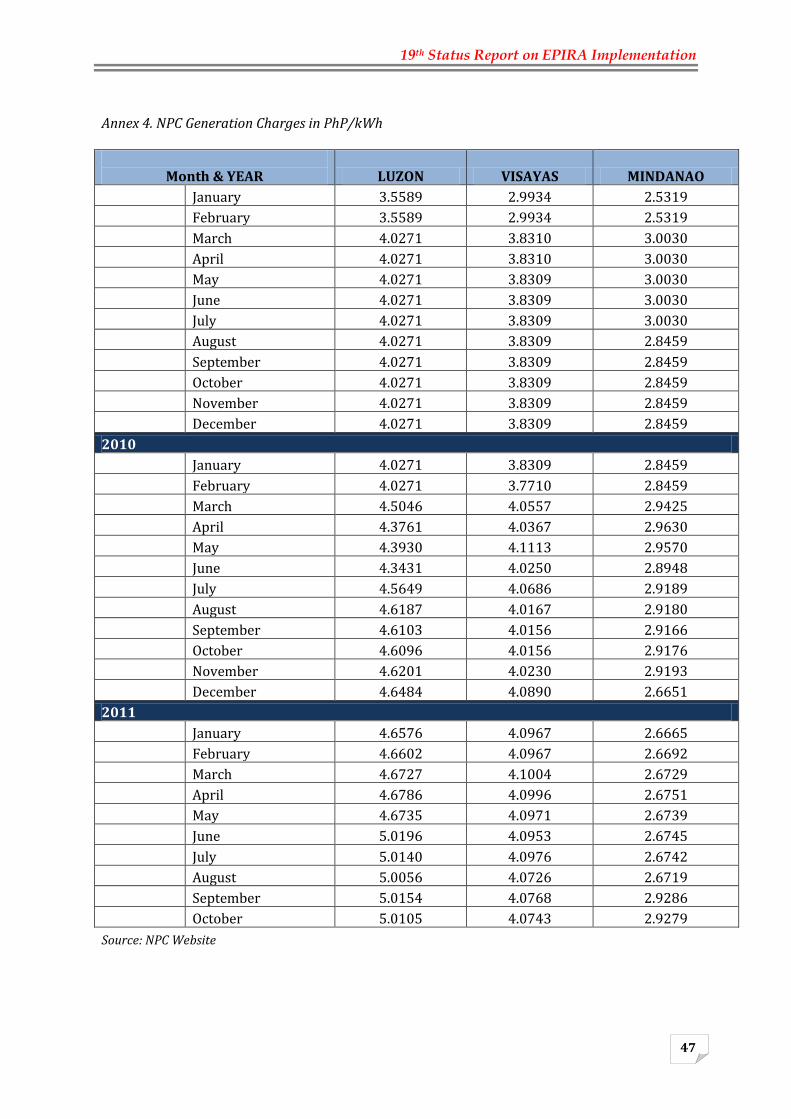
19th Status Report on EPIRA Implementation
47
Annex 4. NPC Generation Charges in PhP/kWh
Month & YEAR LUZON VISAYAS MINDANAO
January 3.5589 2.9934 2.5319
February 3.5589 2.9934 2.5319
March 4.0271 3.8310 3.0030
April 4.0271 3.8310 3.0030
May 4.0271 3.8309 3.0030
June 4.0271 3.8309 3.0030
July 4.0271 3.8309 3.0030
August 4.0271 3.8309 2.8459
September 4.0271 3.8309 2.8459
October 4.0271 3.8309 2.8459
November 4.0271 3.8309 2.8459
December 4.0271 3.8309 2.8459
2010
January 4.0271 3.8309 2.8459
February 4.0271 3.7710 2.8459
March 4.5046 4.0557 2.9425
April 4.3761 4.0367 2.9630
May 4.3930 4.1113 2.9570
June 4.3431 4.0250 2.8948
July 4.5649 4.0686 2.9189
August 4.6187 4.0167 2.9180
September 4.6103 4.0156 2.9166
October 4.6096 4.0156 2.9176
November 4.6201 4.0230 2.9193
December 4.6484 4.0890 2.6651
2011
January 4.6576 4.0967 2.6665
February 4.6602 4.0967 2.6692
March 4.6727 4.1004 2.6729
April 4.6786 4.0996 2.6751
May 4.6735 4.0971 2.6739
June 5.0196 4.0953 2.6745
July 5.0140 4.0976 2.6742
August 5.0056 4.0726 2.6719
September 5.0154 4.0768 2.9286
October 5.0105 4.0743 2.9279
Source: NPC Website

19th Status Report on EPIRA Implementation
48
Annex 5. Status of Rules Change Proposal in RCC
Proposed Changes Rationale of Changes Status Proposed new WESM Manual on Registration, Suspension and Deregistration Criteria and Procedures.
The proposed new WESM Manual sets out the rules and procedures on registration and suspension set forth in the WESM Rules and the DOE Circular No. DC2010-08-0010 dated 23 August 2010 on the implementation of the disconnection policy.
On 04 May 2011, the RCC Deliberated and approved by the RCC on 04 May 2011 with general amendments, which were subsequently submitted to the PEM Board on 12 May 2011, for approval.
Proposed amendments to the WESM Rules and Billing & Settlement Manual.
The proposed changes specify a prescribed period within which the Market Operator shall issue the final statement adjustments. Specifically, the MO should already issue the adjustments within twelve (12) calendar months after the dispute on the final statement has been resolved or six (6) calendar months after the error has been identified.
On 04 May 2011, the RCC deliberated and approved the following as general amendments, which were subsequently submitted to the PEM Board on 12 May 2011, for approval.
Proposed Changes to the WESM Rules on Dispute Resolution Provisions.
The urgent rules change proposal introduces changes to the existing WESM dispute resolution structure/mechanism where the mediator and arbitrators shall no longer form part of the Dispute Resolution Group (DRG) and the DRG shall no longer be a PEM Board Committee. The proposal likewise provides that the mediators and arbitrators for dispute resolution cases shall be sourced from a pool of accredited mediators and arbitrators from certified alternative dispute resolution providers.
The proposed urgent amendments were approved by the RCC during its meeting on 08 June 2011.
Proposed Amendments to the WESM Manual on the Management of Must-Run Units.
The proposed amendments involve revisions on the compensation and settlement mechanism to comply with ERC Order dated 6 February 2008 in ERC Case No. 2006-007 RC, as well as provide for regional application of the methodology for allocating the MRU settlement. For this purpose, regional application means that the application of cost recovery will be applied only to the region where the must-run unit is implemented. The proposal likewise involves revisions on the flowchart to reflect the current procedures being followed by the System Operator (SO) in designating and scheduling of MRUs.
Submitted by PEMC on 07 June 2011
Proposed New WESM Manual on the Segregation of Line Rental.
The proposed new WESM Manual documents the manner by which the line rental trading amount is computed in the WESM and provides the methodology for segregating line rental trading amounts into cost of losses and congestion.
It was approved by the PEM Board during its meeting on 25 August 2011.

19th Status Report on EPIRA Implementation
49
Annex 6 – Status of Technical Committee’s Review and Monitoring of Technical Matters under the Grid Code, Distribution Code and the WESM Rules
Proposed Changes Rationale of Changes/Review Status Proposed Amendments to the “Must-Offer” Rule;
In general, the TC does not agree with the said proposal to include the coal requirement as a constraint in not offering all its available capacity considering that this commercial in nature.
The Technical Committee submitted its comments regarding the proposal to the RCC on 5 April 2011. This amendment is proposed the Aboitiz Power Corp.
Proposed WESM Manual for Registration, Suspension and Deregistration
The TC recommended the use of information contained in the Certificate of Compliance issued by the ERC, such as the generator’s maximum and minimum stable loading (Pmax/min) and ramp rates.
The Technical Committee submitted its comments regarding the proposal to the RCC on 5 April 2011.
Review of Forced and Scheduled Outages, including Deactivated and Reserve Shutdown
The review suggests the need to harmonize the definition and the use of these terms to the current market set up consistent with the Grid Code and the WESM Rules and Manuals.
On 09 June 2011, the TC submitted the result of its review of the power plant outage classifications such as forced and scheduled outages, and deactivated and reserve shutdown to the MSC.
Review of Dispatch Tolerance Limits
Upon the request of the MSC, the TC commenced its technical review of the WESM dispatch tolerance limit, which is initially set at +/- 3 %. The initial results of the review showed that under the WESM Rules Sections 3.8.7.1 and 3.8.7.2, dispatch tolerances must be issued by the System Operator for each type of plant and location in accordance with the Grid Code and Distribution Code.
The TC has requested inputs from NGCP on the dispatch tolerance standards, which will serve as reference for the TC’s review.
Proposed Definition of Adverse Effect
To determine the extent of impact to the grid of a non-compliance to the WESM Rules, the TC has requested from the NGCP-SO information on actual incidents of material incidences of non-compliance with the RTD schedule/ dispatch instruction that have affected the safety of the grid leading to problems involving power quality, system reliability, system loss and safety.
The TC has agreed to adopt the definition of “material effect” under the Grid Code.
Source: PEMC

19th Status Report on EPIRA Implementation
50
Annex 7. Metered Quantity, Spot Quantity, Bilateral Quantity (MWh)
Billing Month Metered Quantity
(Load), MWh
Spot Quantity (Load), MWh
% Bilateral Contract
Quantity, MWh %
1 Jul-2006 3,094,164.95
1,355,434.37
44% 1,738,730.58
56%
2 Aug-2006 3,147,800.36
1,159,428.23
37% 1,988,372.13
63%
3 Sep-2006 3,314,855.13
1,291,334.84
39% 2,023,520.30
61%
4 Oct-2006 2,873,285.25
1,224,467.60
43% 1,648,817.65
57%
5 Nov-2006 3,234,958.03
1,069,288.10
33% 2,165,669.93
67%
6 Dec-2006 2,972,091.65
519,152.06
17% 2,452,939.59
83%
7 Jan-2007 3,035,805.04
589,925.05
19% 2,445,879.99
81%
8 Feb-2007 3,102,610.89
510,281.30
16% 2,592,329.59
84%
9 Mar-2007 2,980,658.77
536,155.65
18% 2,444,503.12
82%
10 Apr-2007 3,407,504.68
698,602.96
21% 2,708,901.72
79%
11 May-2007 3,460,944.49
503,878.03
15% 2,957,066.46
85%
12 Jun-2007 3,561,655.99
805,535.91
23% 2,756,120.08
77%
13 Jul-2007 3,408,973.90
531,237.60
16% 2,877,736.29
84%
14 Aug-2007 3,286,050.22
460,225.65
14% 2,825,824.57
86%
15 Sep-2007 3,362,494.13
358,578.07
11% 3,003,916.06
89%
16 Oct-2007 3,229,031.96
247,585.19
8% 2,981,446.77
92%
17 Nov-2007 3,204,655.78
346,596.90
11% 2,858,058.88
89%
18 Dec-2007 3,083,441.24
371,343.26
12% 2,712,097.98
88%
19 Jan-2008
3,131,009.80
411,372.54 13%
2,719,637.26
87%
20 Feb-2008 3,212,635.82
454,532.74
14% 2,758,103.08
86%
21 Mar-2008 3,041,008.30
354,398.37
12% 2,686,609.93
88%
22 Apr-2008 3,634,855.57
634,329.07
17% 3,000,526.50
83%
23 May-2008 3,323,367.13
356,234.23
11% 2,967,132.90
89%
24 Jun-2008 3,538,106.32
400,132.11
11% 3,137,974.21
89%
25 Jul-2008 3,435,104.78
408,863.87
12% 3,026,240.91
88%
26 Aug-2008 3,399,912.16
372,803.00
11% 3,027,109.16
89%
27 Sep-2008 3,530,050.75
511,447.58
14% 3,018,603.17
86%
28 Oct-2008 3,421,671.57
466,154.42
13.6% 2,955,517.15
86%
29 Nov-2008 3,447,266.38
535,759.02
15.5% 2,911,507.37
84%
30 Dec-2008 3,151,245.74
545,175.13
17.3% 2,606,070.61
83%

19th Status Report on EPIRA Implementation
51
Annex 7. Metered Quantity, Spot Quantity, Bilateral Quantity (MWh)
Billing Month Metered Quantity
(Load), MWh
Spot Quantity (Load), MWh
% Bilateral Contract
Quantity, MWh %
31 Jan-2009 2,906,720.56
604,622.65
20.8% 2,302,097.92
79%
32 Feb-2009 3,358,810.66
766,465.14
22.8% 2,592,345.53
77%
33 Mar-2009 3,222,969.29
537,701.69
16.7% 2,685,267.60
83%
34 Apr-2009 3,503,547.55
414,910.72
11.8% 3,088,636.83
88%
35 May-2009 3,463,438.29
516,030.34 14.9%
2,947,407.95
85%
36 Jun-2009 3,608,313.89
475,456.08 13.2%
3,132,857.82
87%
37 Jul-2009 3,538,571.31
357,675.26 10.1%
3,180,896.05
90%
38 Aug-2009 3,671,459.51
586,189.83 16.0%
3,085,269.69
84%
39 Sep-2009 3,652,903.81
486,078.85 13.3%
3,166,824.96
87%
40 Oct-2009 3,347,101.84
512,979.44 15.3%
2,834,122.40
85%
41 Nov-2009 3,575,986.76
474,059.82 13.3%
3,101,926.94
87%
42 Dec-2009 3,381,576.00
447,970.83 13.2%
2,933,605.16
87%
43 Jan-2010 3,391,691.08
464,968.76 13.7%
2,926,722.32
86%
44 Feb-2010 3,709,258.54
678,908.20 18.3%
3,030,350.34
82%
45 Mar-2010 3,496,870.27
479,469.01 13.7%
3,017,401.26
86%
46 Apr-2010 3,785,877.48
587,784.31 15.5%
3,198,093.17
84%
47 May-2010 4,025,236.25
632,741.76 15.7%
3,392,494.49
84%
48 Jun-2010 4,120,067.20
711,151.61 17.3%
3,408,915.59
83%
49 Jul-2010 3,705,460.47
594,644.27 16.0%
3,110,816.20
84%
50 Aug-2010 3,900,844.43
462,747.56 11.9%
3,438,096.86
88%
51 Sep-2010 3,893,171.32
321,815.88 8.3%
3,571,355.44
92%
52 Oct-2010 3,721,843.57
363,704.17 9.8%
3,358,139.40
90%
53 Nov-2010 3,791,123.99
448,742.73 11.8%
3,342,381.26
88%
54 Dec-2010 3,618,918.64
403,623.82 11.2%
3,215,294.82
89%
55 Jan-2011 4,065,400.56
272,481.78 6.7%
3,792,918.77
93%
56 Feb-2011 4,405,384.21
470,203.49 10.7%
3,935,180.72
89%
57 Mar-2011 4,072,738.35
263,789.55 6.5%
3,808,948.79
94%
58 Apr-2011 4,313,514.71 202,777.98 5% 4,110,736.73 95%
59 May-2011 4,675,217.40 399,466.39 9% 4,275,751.00 91%
60 Jun-2011 4,665,692.14 453,082.12 10% 4,212,610.01 90%

19th Status Report on EPIRA Implementation
52
Annex 7. Metered Quantity, Spot Quantity, Bilateral Quantity (MWh)
Billing Month Metered Quantity
(Load), MWh
Spot Quantity (Load), MWh
% Bilateral Contract
Quantity, MWh %
61 Jul-2011 4,496,424.04 358,118.31 8% 4,138,305.73 92%
62 Aug-2011 4,588,527.67 280,049.63 6% 4,308,478.03 94%
63 Sep-2011 4,591,257.49 364,979.67 8% 4,226,277.81 92%
64 Oct-2011 4,359,048.50 435,802.47 10% 3,923,246.03 90%
Source: PEMC

19th Status Report on EPIRA Implementation
53
Annex 8. Demand and Energy Offers (MW)
Billing Month Peak
Demand Coincidental
Energy Offers Average Demand
Average Energy Offers
Average Capacity on
Outage
1 Jul-2006 6,111 7,185 4,778 6,242 2,634
2 Aug-2006 5,888 5,950 4,634 6,027 2,094
3 Sep-2006 6,113 6,705 4,887 6,446 1,743
4 Oct-2006 5,895 6,653 4,323 5,818 1,866
5 Nov-2006 5,894 5,808 4,715 5,769 2,223
6 Dec-2006 5,869 5,925 4,468 5,257 3,188
7 Jan-2007 5,739 5,794 4,407 5,250 1,815
8 Feb-2007 6,021 5,965 4,529 5,371 1,737
9 Mar-2007 6,108 5,747 4,845 5,362 1,846
10 Apr-2007 6,559 6,268 4,991 5,284 1,769
11 May-2007 6,590 6,831 5,249 5,766 770
12 Jun-2007 6,547 6,308 5,187 5,631 1,137
13 Jul-2007 6,413 5,384 5,124 5,099 1,454
14 Aug-2007 6,339 6,015 4,880 5,675 953
15 Sep-2007 6,376 6,073 4,894 5,568 1,440
16 Oct-2007 6,103 6,260 4,872 5,723 1,725
17 Nov-2007 6,088 5,964 4,659 5,833 1,608
18 Dec-2007 6,092 5,989 4,645 5,529 1,106
19 Jan-2008 5,949 6,495 4,564 5,594 1,166
20 Feb-2008 6,034 5,880 4,676 5,410 1,618
21 Mar-2008 6,205 5,664 4,725 5,337 1,800
22 Apr-2008 6,619 6,584 5,301 5,949 1,149
23 May-2008 6,590 7,141 5,035 6,344 967
24 Jun-2008 6,681 6,733 5,159 6,639 860
25 Jul-2008 6,512 6,401 5,164 5,909 1,168
26 Aug-2008 6,373 6,795 4,948 6,189 1,459
27 Sep-2008 6,448 6,516 5,120 6,534 1,300
28 Oct-2008 6,520 6,316 5,124 5,825 1,845
29 Nov-2008 6,395 6,361 4,986 5,828 1,204
30 Dec-2008 6,338 6,826 4,711 6,327 946
31 Jan-2009 6,050 6,512 4,191 5,603 1,472
32 Feb-2009 6,421 6,240 4,853 5,969 1,281
33 Mar-2009 6,638 6,721 5,167 6,315 1,104
34 Apr-2009 6,810 7,220 5,068 6,374 1,383
35 May-2009 6,842 7,493 5,157 6,788 1,250
36 Jun-2009 6,932 7,374 5,203 6,876 1,432
37 Jul-2009 6,819 7,482 5,258 6,875 980
38 Aug-2009 6,833 7,263 5,255 6,692 1,577
39 Sep-2009 6,870 7,044 5,228 7,007 1,592
40 Oct-2009 6,501 6,532 4,935 6,511 2,427
41 Nov-2009 6,585 7,474 5,141 6,912 1,024

19th Status Report on EPIRA Implementation
54
Annex 8. Demand and Energy Offers (MW)
Billing Month Peak
Demand Coincidental
Energy Offers Average Demand
Average Energy Offers
Average Capacity on
Outage
42 Dec-2009 6,564 7,195 5,070 6,720 1,176
43 Jan-2010 6,391 6,266 4,902 5,813 2,071
44 Feb-2010 6,877 6,783 5,435 5,592 2,520
45 Mar-2010 7,037 6,347 5,683 5,864 1,867
46 Apr-2010 7,296 7,169 5,574 6,079 1,696
47 May-2010 7,558 7,152 6,101 6,932 631
48 Jun-2010 7,643 7,791 6,027 6,618 1,245
49 Jul-2010 7,242 7,447 5,605 6,247 1,712
50 Aug-2010 7,042 7,049 5,699 6,780 1,737
51 Sep-2010 7,039 7,170 5,656 6,480 2,193
52 Oct-2010 7,044 6,731 5,576 5,986 2,445
53 Nov-2010 6,842 6,857 5,512 6,229 2,214
54 Dec-2010 6,902 7,028 5,543 6,354 2,121
55 Jan-2011 6,587 6,778 5,035 6,299
56 Feb-2011 6,864 7,161 5,366 6,796
57 Mar-2011 6,973 7,655 5,484 7,279
58 Apr-2011 7,037 7,419 5,384 6,953
59 May-2011 7,507 7,326 6,059 6,892
60 Jun-2011 7,530 7,338 5,828 6,964
61 Jul-2011 7,404 7,742 5,814 6,722
62 Aug-2011 7,188 7,394 5,699 6,847
63 Sep-2011 7,099 7,039 5,686 6,789
Source: PEMC
Note: For the average capacity on outage column, data for the previous months pertain to outage based on ACNO (available capacity not offered)
Starting Feb 2010, data will be based on per unit; the same is also published in monthly reports and WESM exchange.
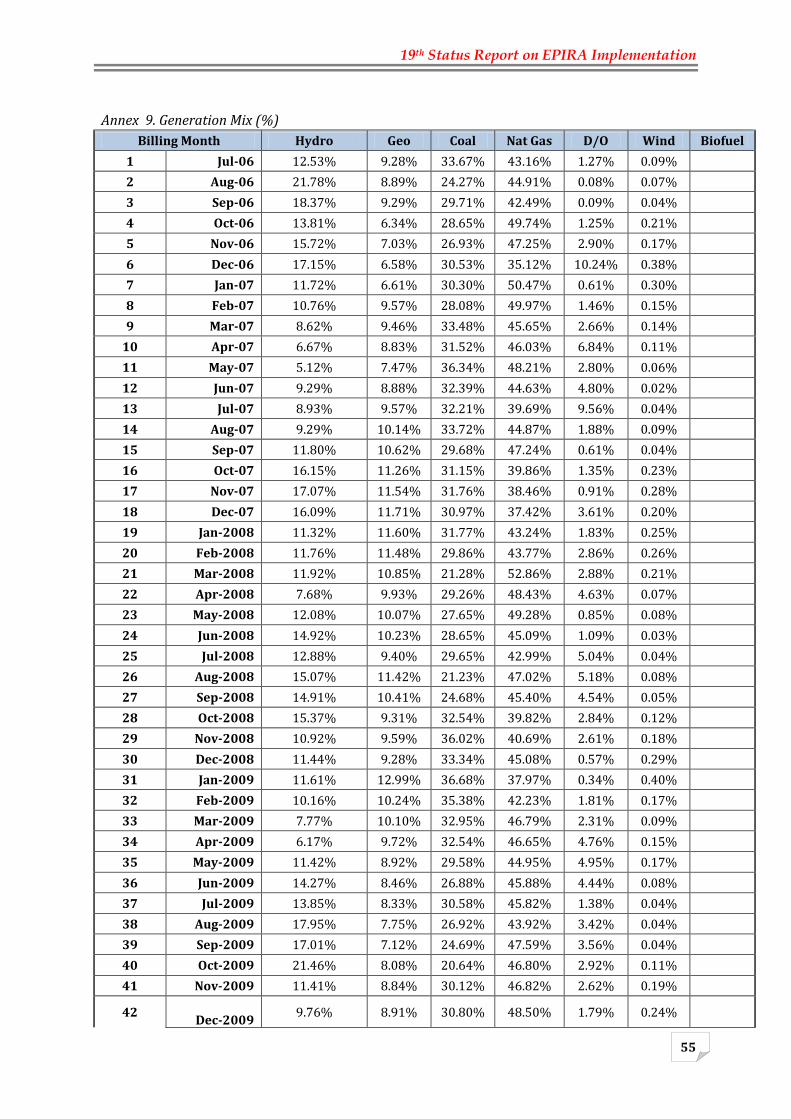
19th Status Report on EPIRA Implementation
55
Annex 9. Generation Mix (%)
Billing Month Hydro Geo Coal Nat Gas D/O Wind Biofuel
1 Jul-06 12.53% 9.28% 33.67% 43.16% 1.27% 0.09%
2 Aug-06 21.78% 8.89% 24.27% 44.91% 0.08% 0.07%
3 Sep-06 18.37% 9.29% 29.71% 42.49% 0.09% 0.04%
4 Oct-06 13.81% 6.34% 28.65% 49.74% 1.25% 0.21%
5 Nov-06 15.72% 7.03% 26.93% 47.25% 2.90% 0.17%
6 Dec-06 17.15% 6.58% 30.53% 35.12% 10.24% 0.38%
7 Jan-07 11.72% 6.61% 30.30% 50.47% 0.61% 0.30%
8 Feb-07 10.76% 9.57% 28.08% 49.97% 1.46% 0.15%
9 Mar-07 8.62% 9.46% 33.48% 45.65% 2.66% 0.14%
10 Apr-07 6.67% 8.83% 31.52% 46.03% 6.84% 0.11%
11 May-07 5.12% 7.47% 36.34% 48.21% 2.80% 0.06%
12 Jun-07 9.29% 8.88% 32.39% 44.63% 4.80% 0.02%
13 Jul-07 8.93% 9.57% 32.21% 39.69% 9.56% 0.04%
14 Aug-07 9.29% 10.14% 33.72% 44.87% 1.88% 0.09%
15 Sep-07 11.80% 10.62% 29.68% 47.24% 0.61% 0.04%
16 Oct-07 16.15% 11.26% 31.15% 39.86% 1.35% 0.23%
17 Nov-07 17.07% 11.54% 31.76% 38.46% 0.91% 0.28%
18 Dec-07 16.09% 11.71% 30.97% 37.42% 3.61% 0.20%
19 Jan-2008 11.32% 11.60% 31.77% 43.24% 1.83% 0.25%
20 Feb-2008 11.76% 11.48% 29.86% 43.77% 2.86% 0.26%
21 Mar-2008 11.92% 10.85% 21.28% 52.86% 2.88% 0.21%
22 Apr-2008 7.68% 9.93% 29.26% 48.43% 4.63% 0.07%
23 May-2008 12.08% 10.07% 27.65% 49.28% 0.85% 0.08%
24 Jun-2008 14.92% 10.23% 28.65% 45.09% 1.09% 0.03%
25 Jul-2008 12.88% 9.40% 29.65% 42.99% 5.04% 0.04%
26 Aug-2008 15.07% 11.42% 21.23% 47.02% 5.18% 0.08%
27 Sep-2008 14.91% 10.41% 24.68% 45.40% 4.54% 0.05%
28 Oct-2008 15.37% 9.31% 32.54% 39.82% 2.84% 0.12%
29 Nov-2008 10.92% 9.59% 36.02% 40.69% 2.61% 0.18%
30 Dec-2008 11.44% 9.28% 33.34% 45.08% 0.57% 0.29%
31 Jan-2009 11.61% 12.99% 36.68% 37.97% 0.34% 0.40%
32 Feb-2009 10.16% 10.24% 35.38% 42.23% 1.81% 0.17%
33 Mar-2009 7.77% 10.10% 32.95% 46.79% 2.31% 0.09%
34 Apr-2009 6.17% 9.72% 32.54% 46.65% 4.76% 0.15%
35 May-2009 11.42% 8.92% 29.58% 44.95% 4.95% 0.17%
36 Jun-2009 14.27% 8.46% 26.88% 45.88% 4.44% 0.08%
37 Jul-2009 13.85% 8.33% 30.58% 45.82% 1.38% 0.04%
38 Aug-2009 17.95% 7.75% 26.92% 43.92% 3.42% 0.04%
39 Sep-2009 17.01% 7.12% 24.69% 47.59% 3.56% 0.04%
40 Oct-2009 21.46% 8.08% 20.64% 46.80% 2.92% 0.11%
41 Nov-2009 11.41% 8.84% 30.12% 46.82% 2.62% 0.19%
42
Dec-2009 9.76% 8.91% 30.80% 48.50% 1.79% 0.24%

19th Status Report on EPIRA Implementation
56
Annex 9. Generation Mix (%)
Billing Month Hydro Geo Coal Nat Gas D/O Wind Biofuel
43 Jan-2010 9.58% 9.76% 30.48% 45.93% 3.97% 0.28%
44 Feb-2010 8.19% 8.04% 42.71% 32.69% 8.27% 0.10%
45 Mar-2010 6.45% 8.56% 46.90% 28.70% 9.30% 0.08%
46 Apr-2010 4.53% 7.46% 43.11% 37.75% 7.00% 0.15%
47 May-2010 3.86% 6.51% 44.52% 40.50% 4.57% 0.04%
48 Jun-2010 4.69% 6.46% 42.54% 40.69% 5.58% 0.04%
49 Jul-2010 8.75% 6.47% 35.74% 41.20% 7.81% 0.02%
50 Aug-2010 11.25% 6.51% 35.38% 41.44% 5.28% 0.14%
51 Sep-2010 11.36% 6.56% 33.22% 44.17% 4.62% 0.06%
52 Oct-2010 9.87% 7.46% 33.21% 43.92% 5.46% 0.08%
53 Nov-2010 12.15% 7.51% 34.93% 42.51% 2.64% 0.26%
54 Dec-2010 9.70% 7.70% 37.60% 42.70% 2.00% 0.30%
55 Jan-2011 8.30% 18.00% 39.10% 33.10% 1.10% 0.30% 0.006%
56 Feb-2011 7.66% 16.58% 34.94% 39.66% 0.93% 0.22% 0.009%
57 Mar-2011 7.07% 15.25% 38.49% 38.16% 0.72% 0.25% 0.071%
58 Apr-2011 8.3% 18.0% 39.8% 32.9% 0.7% 0.312% 0.013%
59 May-2011 7.6% 16.7% 35.0% 39.4% 1.0% 0.218% 0.023%
60 Jun-2011 7.1% 15.2% 38.4% 38.0% 1.1% 0.239% 0.050%
61 Jul-2011 5.6% 15.9% 39.8% 37.6% 0.8% 0.219% 0.122%
62 Aug-2011 4.4% 14.6% 42.2% 35.7% 2.9% 0.056% 0.036%
63 Sep-2011 5.8% 15.1% 41.1% 36.9% 1.0% 0.049% 0.000%
64 Oct-11 13.7% 14.3% 34.6% 34.3% 3.1% 0.100% 0.006%
Source: PEMC

19th Status Report on EPIRA Implementation
57
Annex 10. Effective Settlement Prices
EFFECTIVE SETTLEMENT PRICES (PhP/MWh)
Billing Month ESP (w/ Surplus) ESP (w/o Surplus)
Cumulative Average ESP
1 Jul-2006 3,255.36 3,094.12 3,152
2 Aug-2006 3,767.94 3,577.67 3,373
3 Sep-2006 4,129.05 4,129.05 3,624
4 Oct-2006 4,159.09 4,159.09 3,750
5 Nov-2006 6,092.03 5,746.92 4,115
6 Dec-2006 9,807.99 8,731.92 4,542
7 Jan-2007 3,981.62 3,791.67 4,481
8 Feb-2007 4,932.45 4,810.36 4,501
9 Mar-2007 5,936.19 5,370.34 4,560
10 Apr-2007 8,738.61 8,592.97 4,871
11 May-2007 7,555.25 6,484.51 4,962
12 Jun-2007 7,164.04 6,031.63 5,062
13 Jul-2007 8,768.71 8,350.31 5,223
14 Aug-2007 4,626.97 4,348.65 5,196
15 Sep-2007 4,309.14 3,538.37 5,147
16 Oct-2007 6,244.44 3,599.09 5,119
17 Nov-2007 5,276.00 2,618.23 5,056
18 Dec-2007 6,793.73 6,425.61 5,098
19 Jan-2008 2,551.23 2,278.66 5,010
20 Feb-2008 5,729.20 5,389.93 5,024
21 Mar-2008 6,723.81 6,373.18 5,060
22 Apr-2008 6,006.01 5,545.63 5,085
23 May-2008 2,315.63 1,734.50 5,005
24 Jun-2008 3,370.16 2,100.68 4,933
25 Jul-2008 16,600.93 7,872.34 5,037
26 Aug-2008 4,124.77 4,124.77 5,016
27 Sep-2008 3,911.62 3,911.62 4,981
28 Oct-2008 4,009.38 4,009.38 4,955
29 Nov-2008 5,520.95 4,833.61 4,954
30 Dec-2008 1,244.97 786.69 4,831
31 Jan-2009 1,881.33 1,797.76 4,733
32 Feb-2009 3,062.87 2,893.06 4,662
33 Mar-2009 3,395.09 2,774.35 4,614
34 Apr-2009 4,350.10 3,798.38 4,598
35 May-2009 2,871.07 2,516.38 4,548
36 Jun-2009 2,519.61 2,207.39 4,497
37 Jul-2009 3,294.88 2,041.02 4,459
38 Aug-2009 2,291.13 1,986.39 4,395
39 Sep-2009 2,080.29 1,148.78 4,328
40 Oct-2009 1,445.37 1,396.63 4,264

19th Status Report on EPIRA Implementation
58
EFFECTIVE SETTLEMENT PRICES (PhP/MWh)
Billing Month ESP (w/ Surplus) ESP (w/o Surplus)
Cumulative Average ESP
41 Nov-2009 2,287.51 2,089.83 4,221
42 Dec-2009 3,656.20 3,304.74 4,205
43 Jan-2010 4,559.03 4,425.10 4,209
44 Feb-2010 11,286.94 10,999.48 4,393
45 Mar-2010 13,383.73 12,253.53 4,541
46 Apr-2010 8,873.98 8,725.72 4,635
47 May-2010 8,467.56 7,933.40 4,714
48 Jun-2010 8,737.16 8,265.95 4,807
49 Jul-2010 10,542.92 9,089.57 4,902
50 Aug-2010 5,952.68 5,034.90 4,906
51 Sep-2010 8,980.91 7,508.47 4,936
52 Oct-2010 10,276.10 9,543.00 4,993
53 Nov-2010 7,492.27 7,011.72 5,024
54 Dec-2010 6,824.19 6,394.00 5,043
Billing Month Customer ESSP
55 Jan-2011 3,388
56 Feb-2011 3,453
57 Mar-2011 2,554
58 Apr-2011 3,404
59 May-2011 6,408
60 Jun-2011 4,189
61 Jul-2011 5,179
62 Aug-2011 4,395
63 Sep-2011 5,035
64 Oct-2011 8,192
Source: PEMC

19th Status Report on EPIRA Implementation
59
Annex 11. Private Sector Initiated Power Projects (Luzon) as of November 2011
Committed /
Indicative Name of the Project
Project Proponent
Location Rated
Capacity (MW)
Project Status Target
Commissioning
COAL
3,035.00
Committed 2 X 300 MW Coal-Fired Power Plant
GN Power Mariveles,
Bataan 600 Under construction
Unit 1 (300 MW) - August 2012 Unit 2 (300 MW) - October 2012
Indicative Puting Bato Coal Fired Power Plant
Trans-Asia Oil and Energy Development Corporation
Brgy. Puting Bato West,
Calaca, Batangas
135
Purchase of land signed on January 2010; EPC contractor was awarded to DMCI; DENR-ECC issued on April 2010; on-going negotiations with financial institutions and Semirara Corporation for the coal supply.
September 2014
Indicative 2 X 300 MW Coal-Fired Power Plant
Redondo Peninsula Energy, Inc.
Sitio Naglatore, Cawag, Subic
600
Environmental Compliance Certificate Unit 1 on 2007 and Unit II on Q4 2011, Grid Impact Studies, other permits obtained; on-going financing arrangements; request for proposal of engineering, equipment procurement and construction of plant issued with award to be given on Dec. 2011; site preparation construction ongoing; 52% owned by Meralco PowerGen Corp. (MPGC)
Phase I - Q4 2014 Phase II - Q2 2015
Indicative Quezon Power Expansion Project
Quezon Power Phils.
Mauban, Quezon
500 Development Stage December 2016
Indicative SLPGC Coal-Fired Power Plant
Southwest Luzon Power Generation Corporation
Brgy. San Rafael, Calaca,
Batangas 600
Land Lease Agreement with PSALM secured; SEC registration approved; on-going negotiations with off-takers; ECC application submitted to DENR; on-going GIS with NGCP
Phase I - 2014 Phase II - 2017
Indicative 2 X 300 Masinloc Expansion
AES Masinloc Power Partners Co., Inc.
Zambales 600
Grid Impact Studies obtained on January 7, 2011; Undergoing consultation with international / local banks; ECC Permit by August 2011.
Unit 3 (300 MW) - 1st Quarter 2015 Unit 4 (300 MW) - 2nd Quarter 2018

19th Status Report on EPIRA Implementation
60
Annex 11. Private Sector Initiated Power Projects (Luzon) as of November 2011
Committed /
Indicative Name of the Project
Project Proponent
Location Rated
Capacity (MW)
Project Status Target
Commissioning
DIESEL
171.00
Committed CIP 2 Bunker Fired Power Plant
CIP II Power Corporation (TAOil)
Bacnotan, La Union
21
Completed ECC Ongoing GIS; EPC contractor awarded; financing from internal funds; construction started February 2011
February 2012
Indicative Aero Derivative Combined Cycle Power Plant
Calamba Aero Power Corporation
Calamba, Laguna
150 On-going securing of permits and other regulatory requirements; granted clearance by DOE for the conduct of GIS
June 2013
NATURAL GAS
850.00
Indicative
2 X 100 MW Gas Turbine Power Project 2 X 50 MW Steam Turbine Power Project
Energy World International, Ltd
Brgy. Ibabang Polo, Grande
Island, Pagbilao, Quezon
300 Various permits obtained; with financing from Standard Chartered Bank; awaiting DOE's permits for the LNG terminal
December 2013
Indicative San Gabriel Power Plant
First Gas Power Corp.
San Gabriel, Batangas
550
Various permits obtained; Negotiations for financing arrangements to commence in 3Q 2011 with target completion in 2Q 2012; Discussion with OEM and EPC providers ongoing; Selection of equipment supplier and EPC provider by end 2011 to 1Q 2012
4th Quarter 2013
GEOTHERMAL
140.00
Committed Maibarara Geothermal Power Project
Maibarara Geothermal, Inc.
Sto. Tomas, Batangas
20
Obtained Geothermal Service Contract with DOE; ECC obtained in August 2010; BOI Registration obtained in January 2011; Selected IEE Corp & Fuji Electric as main and subcontractors for the power plant EPC; Secured project financing with RCBC and BPI Capital; GIS from NGCP
September 2013

19th Status Report on EPIRA Implementation
61
Annex 11. Private Sector Initiated Power Projects (Luzon) as of November 2011
Committed /
Indicative Name of the Project
Project Proponent
Location Rated
Capacity (MW)
Project Status Target
Commissioning
completed in March 2011; Set signing of ESA with aggregator TAOil on Aug. 4, 2011
Indicative Tanawon Geothermal Project
Energy Development Corporation
Bacman Geothermal
Field, Sorsogon 40
ECC certificate ongoing; LGU endorsement obtained; Water rights secured; turnkey contract for bidding
September 2015
Indicative Rangas Geothermal Project
Energy Development Corporation
Bacman Geothermal
Field, Sorsogon 40
ECC certificate ongoing LGU endorsement obtained; Water rights secured; Turnkey contract for bidding
September 2015
Indicative Manito-Kayabon Geothermal Project
Energy Development Corporation
Bacman Geothermal
Field, Sorsogon 40
ECC certificate obtained; LGU endorsement obtained; Water rights secured;
March 2017
HYDROPOWER
150.00
Indicative Kanan Hydro Power Project
Kanan Hydro Electric Power Corp.
Gen. Nakar, Quezon
Province 150
Fully complied with RE requirements; awaiting RE contract signing
December 2020
WIND
453.50
Committed Pililla Wind Power Project
Alternergy Wind One Corporation
Pililla, Rizal 67.5 AWOC to finance 100% of the project Q4 2012 (Subject to FIT)
Indicative Pasuquin East Wind Energy Project Phase One
Energy Logistics Philippines, Inc.
Pasuquin, Ilocos Norte
45
ECC secured 15 June 2010; GIS secured Dec. 2010; Equity Investors committment secured; Selected Preferred EPC Turn-key Tenderer for both the wind energy farm and the connection assets
June 2013 (Subject to FIT)
Indicative Burgos Wind Power Project
Energy Development Corporation
Nagsurot-Saoit, Burgos, Ilocos
Norte 86
DOE Service contracts obtained; Civil Aviation Authority clearance obtained; DENR-ECC obtained; LGU endorsement obtained
December 2013 (Subject to FIT)

19th Status Report on EPIRA Implementation
62
Annex 11. Private Sector Initiated Power Projects (Luzon) as of November 2011
Committed /
Indicative Name of the Project
Project Proponent
Location Rated
Capacity (MW)
Project Status Target
Commissioning
Indicative Mabitac Wind Power Project
Altenergy Sembrano Wind Corporation
Mabitac, Rizal 90 2013
Indicative Pasuquin East Wind Energy Project Phase Two
Energy Logistics Philippines, Inc.
Pasuquin, Ilocos Norte
75
ECC secured 15 June 2010; GIS secured Dec. 2010; Equity Investors commitment secured; Selected Preferred EPC Turn-key Tenderer for both the wind energy farm and the connection assets
February 2014 (Subject to FIT)
Indicative Cavinti Wind Power Project
Altenergy Cavinti Wind Corporation
Cavinti, Laguna 50 2014
Indicative Abra de Ilog Wind Power Project
Altenergy Abra de Ilog Wind Corporation
Abra de Ilog, Mindoro
40 2015
BIOMASS
56.30
Committed Green Future Biomass Project
Green Future Innovations Inc.
Isabela 13
Construction started October 2010; 4.3 Billion loan from Banco de Oro already approved; permits and other requirements obtained
April 2012
Indicative Unisan Biogas Project Unisan Biogen Corporation
Quezon Province
11.2 LGU permits obtained; BOI certification obtained; EPC contract with Areva Bioenergy India; awaiting financial closure
December 2013
Indicative Lucky PPH Biomass project
Lucky PPH International
Isabela 3.6 Various permits obtained; awaiting loan approval from Land Bank; awaiting PSA approval with ISELCO
December 2013
Indicative 17.5 MW Nueva Ecija Biomass Power Project
Green Power Nueva Ecija Philippines, Inc.
Brgy. Tambo-Tabuating, San
Leonardo, Nueva Ecija
17.5
Various permits issued, MOA on the Establishment of Trust Account Obtained; ECC issued, Biomass Supply Contract obtained
December 2014
Indicative San Jose City I Power Corporations' Biomass Project
San Jose City I Power Corporation
Nueva Ecija 11 Various permits obtained; awaiting financial closure
December 2014

19th Status Report on EPIRA Implementation
63
Annex 11. Private Sector Initiated Power Projects (Luzon) as of November 2011
Committed /
Indicative Name of the Project
Project Proponent
Location Rated
Capacity (MW)
Project Status Target
Commissioning
Total Rated Capacity 4,855.80
* Committed Project(s)
COAL DIESEL / OIL NATURAL GAS GEOTHERMAL HYDROPOWER WIND BIOMASS

19th Status Report on EPIRA Implementation
64
Annex 12. Private Sector Initiated Power Projects (Visayas) as of November 2011
Committed / Indicative
Name of the Project
Project Proponent
Location Rated
Capacity (MW)
Project Status Target Commissioning
COAL
446.00
Indicative
CEDC Expansion Project (2 X 82 MW Coal-Fired Power Plant
Cebu Energy Development Corporation
Brgy. Daanlungsod, Toledo City, Cebu
164 Securing necessary permits; secured clearance from DOE for the conduct of GIS.
2015
Indicative
PEDC Expansion Project (1 X 82 MW Coal-Fired Power Plant)
Panay Energy Development Corporation
Brgy. Ingore, La Paz, Iloilo
82 Securing necessary permits; secured clearance from DOE for the conduct of GIS.
2015
Indicative 2 x 100 MW Concepcion Coal-fired power plant
Palm Thermal Consolidated Holdings Corp. (Formerly DMCI Concepcion Power Corp.)
Concepcion, Iloilo 200
Acquired land on Nov. 2010; permits and other requirements obtained; on-going negotiations with offtakers and DUs; on-going negotiation for financing, target financial closing is Q2 2012; secured clearance from DOE for the conduct of GIS.
1st Unit - 3rd Qtr. 2014 2nd Unit - Sept. 2016
GEOTHERMAL
100.00
Committed Nasulo Geothermal
Energy Development Corporation
Nasuji, Valencia, Negros Oriental
20 Obtaining necessary permits and requirements; Turnkey contracts for bidding
December 2013

19th Status Report on EPIRA Implementation
65
Annex 12. Private Sector Initiated Power Projects (Visayas) as of November 2011
Committed / Indicative
Name of the Project
Project Proponent
Location Rated
Capacity (MW)
Project Status Target Commissioning
Indicative Dauin Geothermal
Energy Development Corporation
Dauin, Negros Oriental
40 On-going feasibility studies; LGU endorsement obtained; water rights obtained
2017
Indicative
Southern Leyte Geothermal Project (formerly Cabalian Geothermal Project)
Energy Development Corporation
Southern Leyte 40 ECC obtained; LGU Endorsement obtained;
2019
HYDROPOWER
8.00
Committed Villasiga HEP
Sunwest Water & Electric Co., Inc.
Sibalom, Antique 8
LGU endorsement done; Water Permit done; Reconnaisance Permit done; ECC certificate done; DOE Hydropower Service Contract done; BOI Registration done; with financing from Land Bank of the Philippines
December 2012
WIND
54.00

19th Status Report on EPIRA Implementation
66
Annex 12. Private Sector Initiated Power Projects (Visayas) as of November 2011
Committed / Indicative
Name of the Project
Project Proponent
Location Rated
Capacity (MW)
Project Status Target Commissioning
Indicative Guimaras Wind Power Project (8 MW & 46 MW)
Trans-Asia Oil and Energy Development Corporation
San Lorenzo, Guimaras Island
54
Securing various LGU permit; obtained DENR land classification; obtained ECC permit; submitted application for NCIP non covergae certificate to DENR; Grid Impact Studies under negotiation
8 MW - July 2012 46 MW - January 2013
BIOMASS
116.00
Committed Asian Energy System Biomass Project
Asian Energy System Corporation
Cebu 4 Obtained necessary permits; Obtained ECC on February 2010; Loan approval from DBP granted on 25 May 2011.
2015
Indicative 2 x 17.5 MW Green Power Panay
Green Power Panay Philippines, Inc.
Brgy. Cabalabaguan, Mina, Iloilo
35
Various permits obtained (ECC, NWRB, LGU, DAR, NCIP, etc.); Electricity Supply Agreement with Ileco I (3 MW) and Ileco II (7 MW); Biomass supply contract obtained; Certificate of Endorsement from DOE obtained on April 30, 2010; Signed Engineering, Procurement and Construction Contract with Poyry Energy, Inc.
Phase I - December 2013 Phase II - December 2014
Indicative Asea One Biomass Project
Asea One Power Corporation
Banga, Aklan 12 Obtaining necessary permits; Signed PSA with AKELCO; on-going negotiation for financing and EPC contractor
December 2013

19th Status Report on EPIRA Implementation
67
Annex 12. Private Sector Initiated Power Projects (Visayas) as of November 2011
Committed / Indicative
Name of the Project
Project Proponent
Location Rated
Capacity (MW)
Project Status Target Commissioning
Indicative Negros Biomass Power Project Phase 2
Green Power Negros Philippines, Inc.
Negros 35
Obtaining necessary permits, negotiation with NGCP on the conduct of GIS is on-going; negotiation with local banks for financing is on-going
December 2014
Indicative Asea One Biomass Project
Asea One Power Corporation
Ajuy, Iloilo 30 Obtained necessary permits; signed PSA with ILECO; awaiting financial closure
December 2014
Total Rated Capacity 724.00
* Committed Project(s)
COAL
GEOTHERMAL
HYDROPOWER
WIND
BIOMASS

19th Status Report on EPIRA Implementation
68
Annex 13. Private Sector Initiated Power Projects (Mindanao) as of November 2011
Committed / Indicative
Name of the Project Project
Proponent Location
Rated Capacity
(MW) Project Status
Target Commissioning
COAL 700.00
Indicative
2 X 100 MW Southern Mindanao Coal Fired Power Station
Conal Holdings Corp.
Maasim, Sarangani 200
Various permits obtained; BDO, DBP, RCBC and UCPB have obtained their respective pre-clearances to enter into the transaction; financial closure expected by October 2011; Issuance of Notice to Proceed to the EPC Contractor is scheduled on November 2011; Testing and commissioning will commence 29 months after Notice to Proceed
2014
Indicative 2 X 150 MW Coal-Fired Therma South Energy Project
Therma South Inc. (Aboitiz Power Corporation)
Brgy. Binugao, Toril, Davao City and Brgy. Inawayan, Sta. Cruz,
Davao Del Sur
300
Project cost Php 24B; Secured right to land; on-going negotiation for financing; various permits obtained; secured SEC, BIR, BOC, BOI, ECC permits
1st Quarter 2014
Indicative Steag Expansion Project
Steag State Power Corp.
Phividec, Misamis Oriental
200 On-going feasibility study; on -going discussions with NPC/PSALM regarding the common facilities
December 2014
OIL 27.50
Committed 2 X 13.75 MW Bunker Fired Power Plant
Mindanao Energy Systems, Inc.
Tablon, Cagayan de Oro
27.5 Waiting for ERC approval on the Power Supply Agreement with CEPALCO December 2011
GEOTHERMAL 50.00
Committed Mindanao 3 Geothermal
Energy Development Corporation
Kidapawan, North Cotabato
50
Ongoing resource assessment; DENR ECC obtained; Land use permits obtained
September 2014

19th Status Report on EPIRA Implementation
69
Annex 13. Private Sector Initiated Power Projects (Mindanao) as of November 2011
Committed / Indicative
Name of the Project Project
Proponent Location
Rated Capacity
(MW) Project Status
Target Commissioning
HYDROPOWER 265.00
Committed 2 X 4 MW Cabulig Mini-Hydro Power Plant
Mindanao Energy Systems, Inc.
Plaridel, Jasaan, Misamis Oriental
8
RE Service contract from DOE obtained; civil works started in November 2009; actual accomplishments as of Dec. 2010 is 27.33%
December 2012
Indicative Agus 3 Hydroelectric Plant
Lanao Hydropower Development Corporation
Lanao del Norte 225
Updated feasibility study; secured ECC; signed Joint Sales agreement with NPC; Submitted application to DOE for the issuance of service contract on 07 June 2011.
December 2015
Indicative Tagoloan Hydropower
Mindanao Hydro Power Corp.
Bukidnon 20 Completed feasibility study December 2016
Indicative 12 MW Tamugan Hydropower Project
Hedcor Baguio District,
Davao City 12
Permits/government requirements already obtained: Certificate of Endorsement from DOE, GIS by NGCP, registered as Pioneering project from BOI
July 2018
WIND 5.00
Indicative 5 MW Camiguin Island Wind Power
Energy Development Corporation
Camiguin 5 Issued service contract; on going negotiations with lot owners
September 2015 (subject to FIT approval)
BIOMASS 35.00
Indicative Bukidnon Biomass Power Project
Green Power Bukidnon Philippines, Inc.
Maramag, Bukidnon 35
Permits and other requirements obtained; selection process is on-going among local banks; letter of intent executed on March 24, 2009 with Poyry Energy, Inc. as EPC contractor
September 2013

19th Status Report on EPIRA Implementation
70
Annex 13. Private Sector Initiated Power Projects (Mindanao) as of November 2011
Committed / Indicative
Name of the Project Project
Proponent Location
Rated Capacity
(MW) Project Status
Target Commissioning
Total Rated Capacity 1,082.50
* Committed Project(s)
COAL
OIL
GEOTHERMAL
HYDROPOWER
WIND
BIOMASS

19th Status Report on EPIRA Implementation
71
Annex 14 - ERC-Approved Capital Expenditure Projects (May 2011 – August 2011)
APPLICANT PROJECT DESCRIPTION RATIONALE PROJECT COST
(MPhP)
DATE FILED/
APPROVED
South Cotabato II
Electric
Cooperative, Inc.
(SOCOTECO II)
2009 Network Projects
August 11,
2009/May 2,
2011
Ligaya Substation Uprating
Uprating of the Ligaya Substation from 5 MVA to 10
MVA To meet the increasing load and
power needs of the customers
To provide the reliable,
environmentally acceptable
service at reasonable cost
9,091,705.00
Installation of 5 MVA Substation at
the Municipality of Tupi
Construction of new 5 MVA Substation at the
Municipality of Tupi (adjacent Municipality of
Polomolok)
To address the overloading
problem of the existing 10 MVA
Polomolok Substation and the
power quality problem at the
Municipality of Tupi
41,354,082.00
Installation of Voltage Regulator at
Purok Pulutana and at the
Municipality of Malungon
Installation of 3-167 KVA Volatage Regulator at
Purok Pulutana and 2-300 KVAR Capacitor at
Malungon
To improve the power quality
and the system capacity
2,622,573.00
Installation of Voltage Regulator at
the Municipality of Glan
Installation of 2-57.2 KVA Voltage Regulator at P189
Glan To improve the power quality in
the area to year 2020
750,000.00
Rehabilitation with Conductor
Uprating of Leon Lliedo Street to
National Highway, 3 Phase Line
2.8 km conductor uprating project feeder 14-1 from
Lliedo Street going to the National Highway To improve the ampacity rating
of the conductor and to develop
feeder 14-1 into a loop system
that can carry additional loads
888,290.00
Rehabilitation with Conductor
Uprating at Rajah Muda, Barangay
Bula
Conductor uprating for the portion of Rajah Muda,
Barangay Bula using 1/0 insulated aluminum
conductor
To enhance the power reliability,
safety, and efficiency in the area
70,375.00
Additional Circuit Feeder going to
the Municipality of Maitum
Creation of another circuit feeder (feeder 13-3) going
to Municipality of Maitum To provide first rate power
quality and improve power
reliability
To enhance the reliability
performance of the substation
2,772,290.00
Installation of Down Line Feeder
Sectionalizing Equipment
Installation of one (1) sectionalizing device and fuse
cut out at Feeder 6-3 To develop a very reliable
system
1,897,500.00

19th Status Report on EPIRA Implementation
72
APPLICANT PROJECT DESCRIPTION RATIONALE PROJECT COST
(MPhP)
DATE FILED/
APPROVED
Installation of Down Line Feeder
Sectionalizing Equipment
Installation of one (1) sectionalizing device and thirty
(30) units of cut out fuse at Feeder 3-2 To develop a very reliable
system
952,500.00
Installation of Down Line
Electronically Controlled Recloser at
Feeder 7-3
Installation of Down Line Electronically Controlled
Recloser at Feeder 7-3 To ensure public protection and
safety
750,000.00
Installation of Down Line
Electronically Controlled Recloser at
Feeder 1-3
Installation of down line electronically controlled
recloser at feeder 1-3 To ensure public protection and
safety
750,000.00
Installation of Down Line
Electronically Controlled Recloser at
Feeder 11-1
Installation of Down Line Electronically Controlled
Recloser at Feeder 11-1 To ensure public protection and
safety
750,000.00
Procurement of Three (3) Units 15
kV (Noja) Outdoor Type Circuit
Breaker
Procurement of three units 15 kV (Noja) outdoor type
circuit breaker To provide insurance against
possible breakdown or failure of
an equipment/component
1,750,000.00
Acquisition of 69 kV
Subtransmission Lines from the
National Transmission Corporation
(TRANSCO)
Acquisition of the following lines:
Klinan – New Society 69 kV Line – 8.56 km
New Society – Lanoy 69 kV Line – 5.50 km
Lanoy – GSDP 69 kV Line – 1.27 km
Cargill – Siguel 69 kV Line – 10.13 km
Klinan – Dolephil 69 kV Line – 10.81 km
Klinan - Sari 69 kV Line – 17.36 km
Sari – Glan 69 kV Line (with 1 ABS – 40.21 km
GSC Airport 69 kV Line– 1.68 km
Klinan - Maasim SC 69 kV Line (with 2 ABS) –
51.46 km
Maasim – Kiamba SC 69 kV Line (with 2 ABS)
– 44.01 km
To improve reliability 13,765,143.00
Construction of Primary Lines
Extension of primary distribution lines in the
Municipalities of Polomolok, Maasim and General
Santos City, with an estimated length of 3.962 kms of
3-phase primary lines and 2.462 kms of single phase
line and meterings
To guarantee the availability of
power for forecasted/anticipated
eight (8) large load customers
6,012,654.00
Installation of Free Service Drop and
kWhr Meter
Installation of free service drop of 30 meters, #6
duplex wire and kWh meters each for the
forecasted/anticipated 6,087 residential customers
To ensure availability of electric
power for forecasted/anticipated
residential customers in various
areas
14,670,422.00

19th Status Report on EPIRA Implementation
73
APPLICANT PROJECT DESCRIPTION RATIONALE PROJECT COST
(MPhP)
DATE FILED/
APPROVED
Purchase and Installation of
Distribution Transformers and
Accessories
Purchase and installation of 77 units of distribution
transformers (DT) of various capacity and DT
accessories for the forecasted/anticipated 6,087
residential customers
To ensure availability of electric
power for forecasted/anticipated
residential customers in various
areas
7,720,273.00
Construction of Low Voltage Lines
Construction of 51 meters low voltage line for the
forecasted/anticipated 6,087 residential customers To ensure availability of electric
power for forecasted/anticipated
residential customers in various
areas
10,003,341.00
2010 Network Projects
Power Factor Correction Projects
(Capacitor Installation)
Correction of power factor of 93.7% To improve the systems power
factor to 99%
10,000,000.00
Rehabilitation with Conductor
Uprating of Aparente Road 3 Phase
Line
Rehabilitation of the 1.8 km phase line and uprating
for feeder 14-2 at Apparente Street, Barangay City
Heights
To enhance power efficiency and
reliability
502,290.00
Looping of 69 kV Line to have a
Dual Feed Substation (m1, m14)
Creation of a 4.65 km 69 kV subtransmission line from
Leon Lliedo Street going to Crossing Makar To increase reliability level 13,080,619
Installation of Down Line Feeder
Sectionalizing Equipment
Installation of forty- five (45) pieces fuse cut out at
Feeder 11-1 To improve system reliability 247,500.00
Installation of Down Line Feeder
Sectionalizing Equipment
Installation of one (1) sectionalizing device and fuse
cut out at Feeder 7-2 To improve system reliability 660,000.00
Installation of Down Line Feeder
Sectionalizing Equipment
Installation of eighteen (18) pieces cut out fuse
assembly at Feeder 3-1 To improve system reliability 99,000.00
Installation of Down Line Feeder
Sectionalizing Equipment
Installation of two (2) sectionalizing device at feeder
4-1 To improve system reliability 2,394,500.00
Rehabilitation and Reconductoring
of Duplex Secondary Lines at
Barangay Bula (1.5 km total length)
Rehabilitation and Reconductoring of Duplex
Secondary Lines at Barangay Bula To ensure public protection and
safety
250,000.00
Installation of Supervisory Control
and Data Acquisition (SCADA) for
20/25 MVA Main Office Substation
Installation of SCADA for 20/25 MVA Main Office
Substation To improve data gathering and
analysis on real time
3,000,000.00

19th Status Report on EPIRA Implementation
74
APPLICANT PROJECT DESCRIPTION RATIONALE PROJECT COST
(MPhP)
DATE FILED/
APPROVED
Installation of Supervisory Control
and Data Acquisition (SCADA) for
20/25 MVA Leon Lliedo Substation
Installation of SCADA for 20/25 MVA Leon Lliedo
Substation To improve data gathering and
analysis on real time
3,000,000.00
Installation of Supervisory Control
and Data Acquisition (SCADA)
Control Station with Complete
Facilities
Installation of SCADA Control Station with complete
facilities at the Main Office Substation To improve data gathering and
analysis on real time
5,000,000.00
Procurement of one (1) unit 69 kV
Outdoor Breaker and Control
Procurement of one (1) 69 kV outdoor breaker and
control To avoid/eliminate possible
breakdown or failure of an
equipment/component
2,600,000.00
Procurement of one (1) unit 15 kV
(Siemens) Outdoor Type Circuit
Breaker
Procurement of one (1) unit 15 kV (Siemens) Outdoor
Type Circuit Breaker To avoid/eliminate possible
breakdown or failure of an
equipment/component
1,900,000.00
Procurement of one (1) Set Station
Class 69 kV Lightning Arresters
Procurement of one (1) Set Station Class 69 kV
Lightning Arresters To avoid/eliminate possible
breakdown or failure of an
equipment/component
500,000.00
Procurement of Two (2) Sets Station
Class 15 kV Lightning Arresters
Procurement of Two (2) Sets Station Class 15 kV
Lightning Arresters To avoid/eliminate possible
breakdown or failure of an
equipment/component
150,000.00
Construction of Primary Lines
Extension of primary distribution lines in the
Municipalities of Polomolok, Maasim and General
Santos City, with an estimated length of 3.704 kms of
3-phase primary lines and 2.757 kms of single phase
line and meterings
To guarantee the availability of
power for prospective six (6)
large load customers
5,722,903.00
Installation of Free Service Drop
and Kwh Meter
Installation of free service drop of 30 mtrs, #6 duplex
wire and kWhr meters each for the
forecasted/anticipated 6,226 residential customers
To ensure availability of electric
power for prospective residential
customers in various areas
15,005,753.00
Purchase and Installation of
Distribution Transformers and
Accessories
Purchase and installation of 62 units of distribution
transformers (DT) of various capacity and DT
accessories for the forecasted/anticipated 6,226
residential customers
To ensure electric facilities for
new customers
6,623,477.00
Construction of Low Voltage Lines
Construction of 41 meter low voltage line for the
forecasted/anticipated 6,226 residential customers To ensure availability of electric
power for prospective residential
customers in various areas
8,115,735.00
2011 Network Projects
Supervisory Control and Data
Acquisition (SCADA) for 20/25
MVA Lanoy Calumpang
Installation of SCADA for 20/25 MVA Lanoy
Calumpang Substation To improve data gathering and
analysis on real time
3,000,000.00

19th Status Report on EPIRA Implementation
75
APPLICANT PROJECT DESCRIPTION RATIONALE PROJECT COST
(MPhP)
DATE FILED/
APPROVED
Construction of Primary Lines
Extension of primary distribution lines in the
Municipalities of Polomolok, Maasim and General
Santos City with an estimated length of 1.211 kms. Of
3-phase primary lines and 3.070 kms of single phase
line and meterings
To guarantee the availability of
electric power for prospective
new five (5) large load
customers
2,669,366.00
Installation of Free Service Drop and
Kwh Meter
Installation of free service drop of 30 meters, #6
duplex wire and kWh meter each for the prospective
6,368 residential customers
To ensure availability of electric
power for prospective residential
customers in various areas
15,347,699.00
Purchase and Installation of
Distribution Transformers and
Accessories
Purchase and installation of 54 units of distribution
transformers (DT) of various capacity and DT
accessories for the forecasted/anticipated6,368
residential customers
To ensure availability of electric
power for forecasted/anticipated
residential customers in various
areas
5,473,281.00
Construction of Low Voltage Lines
Construction of 36 meters low voltage line for the
prospective 6,368 residential customers To ensure availability of electric
power for prospective residential
customers in various areas
7,091,859.00
2012 Network Projects
Installation of 25 MVA Substation
in-between M1 and M14
Installation of 25 MVA Substation in-between M1 and
M14 To address substation capacity
deficiency including customers
requirements
40,000,000.00
Installation of Down Line Feeder
Sectionalizing Equipment
Installation of one (1) sectionalizing device and twelve
(12) units of cut out fuse at Feeder 4-3 To improve system reliability 748,500.00
Installation of Down Line Feeder
Sectionalizing Equipment
Installation of one (1) sectionalizing device at Feeder
9-3 To improve system reliability 866,250.00
Installation of Down Line
Electronically Controlled Recloser at
Feeder 13-1
Installation of Down Line Electronically Controlled
Recloser at Feeder 13-1 To ensure public protection and
safety
750,000.00
Construction of primary Lines
Extension of primary distribution lines in the
Municipalities of Polomolok, Maasim and General
Santos City, with an estimated length of 2.719 kms of
3-phase primary lines and metering
To guarantee the availability of
power for prospective three (3)
large load customers
2,595,227.00
Installation of Free Service Drop and
kWh Meter
Installation of free service drop of 30 mtrs, #6 duplex
wire and kWh meters each for the prospective 6,513
residential customers
To ensure availability of electric
power for prospective residential
customers in various areas
5,349,685.00
Purchase and Installation of
Distribution Transformers and
Accessories
Purchase and installation of 53 units of distribution
transformers (DT) of various capacity and DT
accessories for the prospective 6,513 residential
customers
To ensure availability of electric
power for forecasted/anticipated
residential customers in various
areas
15,695,883.00

19th Status Report on EPIRA Implementation
76
APPLICANT PROJECT DESCRIPTION RATIONALE PROJECT COST
(MPhP)
DATE FILED/
APPROVED
Construction of Low Voltage Lines
Construction of 35 meters low voltage line for the
prospective 6,513 residential customers To ensure availability of electric
power for prospective residential
customers in various areas
6,931,713.00
2013 Network Projects
Installation of 25 MVA Substation
in-between Calumpang and Fishport
Substation
Installation of 25 MVA Substation in-between
Calumpang and Fishport Substation To reduce technical losses and
improve power reliability
58,435,561.00
Installation of Down Line Feeder
Electronically Controlled Recloser at
Feeder 13-3
Installation of Down Line Feeder Electronically
Controlled Recloser at Feeder 13-3 To ensure public protection and
safety
750,000.00
Supervisory Control and Data
Acquisition (SCADA) for 20/25
MVA Fishport Substation
Installation of SCADA for 20/25 MVA Fishport
Substation To improve data gathering and
analyses on real time
3,000,000.00
Supervisory Control and Data
Acquisition (SCADA) for 20 MVA
New Society Substation
Installation of SCADA for 20 MVA New Society
Substation To improve data gathering and
analyses on real time
3,000,000.00
Construction for Primary Lines
Extension of primary distribution lines in the
Municipalities of Polomolok, Maasim and General
Santos City, with an estimated length of 1.533 kms of
3-phase primary lines and meterings
To guarantee the availability of
power for prospective three (3)
new customers
2,206,049.00
Installation of Free Service Drop and
kWh Meter
Installation of free service drop of 30 meters, #6
duplex wire and kWh meters each for the prospective
8,660 residential customers
To ensure availability of electric
power for forecasted/anticipated
residential customers in various
areas
5,892,688.00
Construction of Low Voltage Lines
Construction of 39 meters low voltage for the
prospective 6,660 residential customers To ensure availability of electric
power for prospective
residential customers in various
areas
7,635,296.00
2009 Non-Network Projects
Procurement of Laptop Computers
Procurement of twenty-six (26) units high-end laptop
computers To improve the performance of
the engineers and technical staff
To eliminate computational
errors
910,000.00
Acquisition of Engineering
Softwares
Procurement of engineering softwares To identify and quantify
distribution system and
efficiently manage distribution
system data
500,000.00

19th Status Report on EPIRA Implementation
77
APPLICANT PROJECT DESCRIPTION RATIONALE PROJECT COST
(MPhP)
DATE FILED/
APPROVED
Acquisition of Calport Metering
Equipment
Acquisition of Calport 300 metering equipment To test the accuracy and
diagnose problems in the
connection of electronic type of
kWh meters installed
4,000,000.00
Procurement of Metering Laboratory
Procurement of an advance meter equipment test
laboratory To test the effectiveness and
efficiency of meters
To ensure efficient and reliable
service to the customers by
upgrading the system and
equipment
1,500,000.00
Sub-office Online Wireless
Connection
Centralized and comprehensive online wireless
connection of ten (10) sub-offices to main office To improve and align operations 2,065,000.00
Procurement of Read and Bill
System using Rugged Meter
Reading Device
Procurement of read and bill system using rugged
meter reading device To develop a fast, accurate and
on-time billing to customers
2,600,000.00
Purchase of Five (5 Units Honda XR
200 Motorcycle
Purchase of five (5) units Honda XR 200 motorcycle
for the use of the Technical Services Department To improve response time in
serving customers specially in
remote and rural areas
500,000.00
2010 Non-Network Projects
Acquisition of Hotline/Live-Line
Maintenance Tools
Use of hotline/live-line maintenance tools To lessen frequency of
interruption and shorten duration
of power shutdowns
2,600,000.00
Procurement of Power Quality
Analyzer
Procurement of Fluke 435 three-phase power quality
analyzer To address power quality
problems
550,000.00
Procurement of Thermal Scanner Purchase of thermal scanner To detect equipment and
distribution line hot spots
1,500,000.00
Substation Communication
Improvement for Maasim and
Kiamba Substations
Purchase of portable two-way radios with multi-
features and channel choices To improve communication
between Maasim and Kiamba
Substations
500,000.00
Purchase of One (1) Isuzu Pick-Up Purchase of one (1) unit Isuzu pick-up for the use of
the West Business unit To improve customer service 1,700, 000.00
Purchase of One (1) Isuzu Pick-Up Purchase of one (1) unit Isuzu pick-up for the use of
the East Business unit To improve customer service 1,700, 000.00
Purchase of One (1) Isuzu Pick-Up Purchase of one (1) unit Isuzu pick-up for the use of
the Technical Services Department To improve customer service 1,700, 000.00

19th Status Report on EPIRA Implementation
78
APPLICANT PROJECT DESCRIPTION RATIONALE PROJECT COST
(MPhP)
DATE FILED/
APPROVED
2011 Non-Network Projects
Acquisition of Plotter Printer Purchase of plotter printer To improve productivity 959,500.00
Purchase of One (1) Unit Isuzu
Service Utility Vehicle (S.U.V.)
Purchase of One (1) Unit Isuzu Service Utility Vehicle
(S.U.V.) for the use of the Institutional Services
Department
To improve customer service 1,700,000.00
Purchase of Three (3) Units Honda
XR-200 Motorcycles
Purchase of Three (3) Units Honda XR-200
motorcycles for the use of the Central Business Unit To improve response time in
serving customers specially
those in remote and rural areas
300,000.00
Purchase of Three (3) Units Honda
XR-200 Motorcycles
Purchase of Three (3) Units Honda XR-200
motorcycles for the use of the West Business Unit To improve response time in
serving customers specially
those in remote and rural areas
300,000.00
Purchase of Three (3) Units Honda
XR-200 Motorcycles
Purchase of Three (3) Units Honda XR-200
motorcycles for the use of the East Business Unit To improve response time in
serving customers specially
those in remote and rural areas
300,000.00
Purchase of Three (3) Units
Maintenance truck with Boom
Purchase of three (3) units maintenance truck with
boom To improve systems reliability 7,500,000.00
2012 Non-Network Projects
Purchase of One (1) Unit Isuzu Pick
Up
Purchase of One (1) Unit Isuzu Pick Up for the use of
Central Business Unit To improve customer service 1,700,000.00
Purchase of Twelve (12) Units
Honda XR-200 Motorcycles
Purchase of one (1) unit Isuzu pick up for the use of
meter readers To improve response time in
serving customers specially
those in remote and rural areas
1,200,000.00
Cebu II Electric
Cooperative, Inc.
(CEBECO II)
2011 Network Projects
January 7,
2011/June 21,
2011
Procurement and Installation of
Voltage Regulators, Reclosers and
Disconnect Switches
Procurement and installation of several units of voltage
regulators, reclosers and switches at various feeders To improve system reliability
and minimize the energy not
served of the system
12,949,000.00
Installation of 10 MVA Carmen
Substation
Procurement and installation of a new 10 MVA
Substation in the Municipality of Carmen To provide power reliability and
additional substation and
capacity
40,326,000.00
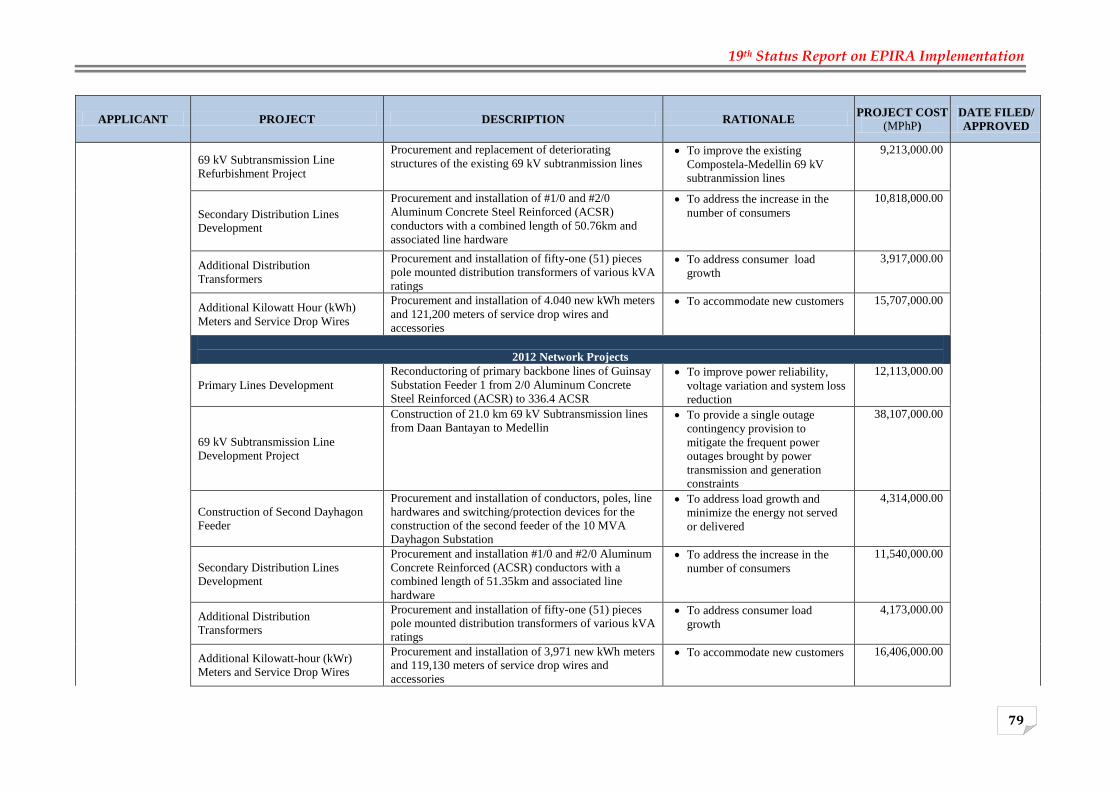
19th Status Report on EPIRA Implementation
79
APPLICANT PROJECT DESCRIPTION RATIONALE PROJECT COST
(MPhP)
DATE FILED/
APPROVED
69 kV Subtransmission Line
Refurbishment Project
Procurement and replacement of deteriorating
structures of the existing 69 kV subtranmission lines To improve the existing
Compostela-Medellin 69 kV
subtranmission lines
9,213,000.00
Secondary Distribution Lines
Development
Procurement and installation of #1/0 and #2/0
Aluminum Concrete Steel Reinforced (ACSR)
conductors with a combined length of 50.76km and
associated line hardware
To address the increase in the
number of consumers
10,818,000.00
Additional Distribution
Transformers
Procurement and installation of fifty-one (51) pieces
pole mounted distribution transformers of various kVA
ratings
To address consumer load
growth
3,917,000.00
Additional Kilowatt Hour (kWh)
Meters and Service Drop Wires
Procurement and installation of 4.040 new kWh meters
and 121,200 meters of service drop wires and
accessories
To accommodate new customers 15,707,000.00
2012 Network Projects
Primary Lines Development
Reconductoring of primary backbone lines of Guinsay
Substation Feeder 1 from 2/0 Aluminum Concrete
Steel Reinforced (ACSR) to 336.4 ACSR
To improve power reliability,
voltage variation and system loss
reduction
12,113,000.00
69 kV Subtransmission Line
Development Project
Construction of 21.0 km 69 kV Subtransmission lines
from Daan Bantayan to Medellin To provide a single outage
contingency provision to
mitigate the frequent power
outages brought by power
transmission and generation
constraints
38,107,000.00
Construction of Second Dayhagon
Feeder
Procurement and installation of conductors, poles, line
hardwares and switching/protection devices for the
construction of the second feeder of the 10 MVA
Dayhagon Substation
To address load growth and
minimize the energy not served
or delivered
4,314,000.00
Secondary Distribution Lines
Development
Procurement and installation #1/0 and #2/0 Aluminum
Concrete Reinforced (ACSR) conductors with a
combined length of 51.35km and associated line
hardware
To address the increase in the
number of consumers
11,540,000.00
Additional Distribution
Transformers
Procurement and installation of fifty-one (51) pieces
pole mounted distribution transformers of various kVA
ratings
To address consumer load
growth
4,173,000.00
Additional Kilowatt-hour (kWr)
Meters and Service Drop Wires
Procurement and installation of 3,971 new kWh meters
and 119,130 meters of service drop wires and
accessories
To accommodate new customers 16,406,000.00

19th Status Report on EPIRA Implementation
80
APPLICANT PROJECT DESCRIPTION RATIONALE PROJECT COST
(MPhP)
DATE FILED/
APPROVED
2013 Network Projects
69 kV Substransmission Line
Development Project
Installation of new customer accessories and kilowatt-
hour meter in compliance with the connection standard
set by PEC and PDC
To accommodate new customers 38,107,000.00
Secondary Distribution Lines
Development
Procurement and installation of #1/0 and #2/0
Aluminum Concrete Steel Reinforced (ACSR)
conductors with a combined length of 50.68 and
associated line hardware
To address the consumer load
growth
12,262,000.00
Additional Distribution
Transformers
Procurement and installation of fifty-one (51) pieces
pole mounted distribution transformers of various kVA
ratings
To address load growth 4,429,000.00
Additional Kilowatt Hour (kWh)
Meters and Service Drop Wires
Procurement and installation of 3.906 new kWh meters
and 117,180 meters of service drop wires and
accessories
To accommodate new customers 17,077,000.00
2014 Network Projects
Secondary Distribution Lines
Development
Procurement and installation of #1/0 and #2/0
Aluminum Concrete Steel Reinforced (ACSR)
conductors with a combined length of 50.91 and
associated line hardware
To address the increase in the
number of consumers
12,984,000.00
Additional Distribution
Transformers
Procurement and installation of fifty-two (52) pieces
pole mounted distribution transformers of various kVA
ratings
To address the consumer load
growth
4,788,000.00
Additional Kilowatt Hour (kWh)
Meters and Service Drop Wires
Procurement and installation of 3,842 new kWh meters
and 115,260 meters of drop wires and accessories To accommodate new customers 17,717,000.00
2015 Network Projects
Secondary Distribution Lines
Development
Procurement and installation of #1/0 and #2/0
Aluminum Concrete Steel Reinforced (ACSR)
conductors with a combined length of 50.96 and
associated line hardware
To address the increase in the
number of consumers of
different classes in the
developing urban and rural areas
13,707,000.00
Additional Distribution
Transformers
Procurement and installation of fifty-two (52) pieces
pole mounted distribution transformers of various kVA
ratings
To address the consumer load
growth
5,050,000.00
Additional Kilowatt Hour (kWh)
Meters and Service Drop Wires
Procurement and installation of 3,780 new kWh meters
and 113,417.01 meters of service drop wires and
accessories
To accommodate new customers 18,392,000.00

19th Status Report on EPIRA Implementation
81
APPLICANT PROJECT DESCRIPTION RATIONALE PROJECT COST
(MPhP)
DATE FILED/
APPROVED
2011 Non-Network Projects
Purchase of Vehicles
Procurement and maintenance of 31 units motorcycles,
7 units service trucks and 2 units boom trucks To improve mobility and
response time in serving
customers
14,225,000.00
Purchase of Geographic Information
System (GIS) and Segregator
Procurement of one (1) Geographic Information
System (GIS) and one (1) Segregator To increase operations efficiency
through system automation,
centralized data gathering and
monitoring
3,600,000.00
Construction and Refurbishment of
Offices
Construction of Carmen, Medillin, and Daan Bantayan
Action Centers and Carmen Substation Lot To improve consumer service
efficiency and optimize available
working space
11,500,000.00
Purchase of Generator Sets
Procurement of one (1) generator set for Bogo
CEBECO II Office To maximize office work output
such as billing, collection, and
resolution of consumer
complaints by providing
uninterrupted power to both
offices
1,048,000.00
Insulation Power Factor Test Tool
Procurement of power factor test tool To increase the level of accuracy
of substation power transformers
and other power equipment
particularly during the conduct
of annual preventive
maintenance
1,800,000.00
Hot Line Tools and Equipment
Procurement of twelve (12) units hot line tools and
insulated boom truck To minimize power interruptions
through maintenance/repair
works on energized lines
475,000.00
Computers, Softwares, and
Accessories
Procurement of three (3) units desktops, four (4) units
laptops, two (2) units servers and forty (40) units
softwares
To upgrade the level of computer
operating system and data
processing
978,000.00
Personnel Trainings and Seminars Personnel trainings and seminars comprising of eight
(8) sessions management seminars Provision for personnel
competence
600,000.00
Communication Equipment Procurement of one (1) unit repeater, eleven (11) units
hand held radio and nine (9) units base radio To upgrade and speed-up
relaying of information
461,000.00
Meter Test Rack
Procurement of equipment for testing and calibrating
single and three phase energy meters To increase the level of accuracy
of demand
monitoring/registration of
member-consumers’ billing
1,300,000.00

19th Status Report on EPIRA Implementation
82
APPLICANT PROJECT DESCRIPTION RATIONALE PROJECT COST
(MPhP)
DATE FILED/
APPROVED
meters
2012 Non-Network Projects
Purchase of Vehicles
Procurement and maintenance of 13 units motorcycles,
8 units service trucks and 2 units boom trucks To improve mobility and
response time in serving
customers
14,220,000.00
Purchase of Supervisory Control and
Data Acquisition (SCADA) System
Procurement of one (1) Supervisory Control and Data
Acquisition (SCADA) System To increase operations efficiency
through system automation,
centralized data gathering and
monitoring
2,675,000.00
Construction and Refurbishment of
Offices
Construction of San Remegio Action Center and
Refurbishment of Bogo and Danao offices To improve customer service
efficiency and optimize available
working space
35,310,000.00
Purchase of Generator Sets
Procurement of one (1) generator set for Danao City
CEBECO II Office To maximize office work output
such as billing, collection, and
resolution of consumer
complaints by providing
uninterrupted power of both
offices
42,000.00
Hot Line Tools and Equipment
Procurement of eight (8) units hot line tools and
insulated boom truck for emergency and maintenance
works
To minimize power interruptions
through maintenance/repair
works on energized lines
5,941,000.00
Computers, Softwares, and
Accessories
Purchase of two (2) units printers, three (3) units
uninterrupted power supplies (UPS) and ten (10) units
softwares
To modernize outdated
computers and upgrade the level
of operating system and data
processing
182,000.00
Personnel Trainings and Seminars
Personnel training and seminars comprising of three
(3) sessions competency trainings and ten (10) sessions
management seminars
Provision for personnel
competence
310,000.00
Communication Equipment Purchase of one (1) unit repeater To upgrade and speed-up
relaying of information
161,000.00
2013 Non-Network Projects
Purchase of Vehicles
Purchase and maintenance of 3 units of motorcycles, 6
units service trucks and 1 unit boom truck To improve mobility and
response time in serving
customers
9,892,000.00
Construction and Refurbishment of
Offices
Construction of Tabogon and Bogo Action Centers and
refurbishment of Compostela office To improve customer service
efficiency and optimize available
8,014,000.00

19th Status Report on EPIRA Implementation
83
APPLICANT PROJECT DESCRIPTION RATIONALE PROJECT COST
(MPhP)
DATE FILED/
APPROVED
working space
Hot Line Tools and Equipment
Procurement of ten (10) hot line tools and insulated
boom truck for emergency and maintenance works To minimize power interruptions
through maintenance/repair
works on energized lines
315,000.00
Computers, Softwares, and
Accessories
Procurement of three (3) units desk tops, four (4) units
lap tops and ten (10) units software To modernize outdated
computers and upgrade the level
of computer operating system
and data processing
454,000.00
Trainings and Seminars
Personnel training and seminars comprising of nine (9)
sessions competency trainings and ten (10) sessions
management seminars
Provision for personnel
competence
767,000.00
Communication Equipment Procurement of five (5) units hand held radio and five
(5) units base radio To upgrade and speed-up
relaying of information
180,000.00
2014 Non-Network Projects
Purchase of Vehicles
Procurement and maintenance of 4 units motorcycles,
2 units service trucks and 1 unit boom truck To improve mobility and
response time in serving
customers
2,965,000.00
Construction and Refurbishment of
Offices
Construction of Catmon Action Center To improve customer service
efficiency and optimize
available working space
3,675,000.00
Hot Line Tools and Equipment
Procurement of five (5) hot line tools and insulated
boom truck for emergency and maintenance works To minimize power interruptions
through maintenance/repair
works on energized lines
245,000.00
Computers, Software and
Accessories
Procurement of two (2) units printers, three units
uninterrupted power supply (UPS) and ten (10) units
software
To modernize outdated
computers and upgrade the level
of computer operating system
and data processing
209,000.00
Personnel Trainings and Seminars Personnel trainings and seminars comprising of ten
(10) sessions management seminars Provision for personnel
competence
98,000.00
Communication Equipment Procurement of two (2) units repeater To upgrade and speed-up
relaying of information
368,000.00
Purchase of Vehicles
Procurement and maintenance of 9 units motorcycles,
3 units service trucks and 1 unit boom truck To improve mobility and
response time in serving
customers
9,969,000.00
Construction and Refurbishment of
Offices
Refurbishment of Tuburan and Tabuelan Offices To improve customer service
efficiency and optimize available
working space
5,243,000.00

19th Status Report on EPIRA Implementation
84
APPLICANT PROJECT DESCRIPTION RATIONALE PROJECT COST
(MPhP)
DATE FILED/
APPROVED
Hot Line Tools and Equipment
Procurement of five (5) hot line tools and insulated
boom truck for emergency and maintenance works To minimize power interruptions
through maintenance/repair
works on energized lines
203,000.00
Computers, Software and
Accessories
Procurement of ten (10) units software To modernize outdated
computers and upgrade the level
of computer operating system
and data processing
166,000.00
Trainings and Seminars Personnel training and seminars comprising of ten (10)
sessions management seminars Provision for personnel
competence
105,000.00
Surigao Del Sur I
Electric
Cooperative, Inc.
(SURSECO I)
Projects for 2009
December 1,
2009/ July 25,
2011
Repair and installation of 5MVA
Power Transformer
Repair and installation of 5MVA power transformer in
Tabon Substation To address load growth and
provisions for additional
substation capacity
To address power demand of
MG Mining
4,612,298.81
Conversion and upgrading of a
Single Phase Line to Three (3) Phase
Line and Extension of Three (3)
Phase Line
Conversion and upgrading of a single phase line to a
three (3) phase line from Nursery to Sikahoy, and
extension of three (3) phase line from Sikahoy to
Mendoza
To address load growth
To improve overall technical
loss of the distribution feeders
7,072,259.31
Procurement, Replacement, and
Installation of Kilowatt-hour (kWh)
Meters
Procurement, replacement, and installation of two
thousand four hundred (2,400) units of defective kWh
meter of various types
To promote accuracy in the
meter registration of energy sales
2,688,000.00
Procurement of Additional Poles and
Replacement of Rotten Place
Procurement of additional poles and replacement of
one hundred twenty (120) rotten poles To address load growth and
improve power quality and
system reliability
To promote safety in the
maintenance of the distribution
system
1,720,107.20
Conversion of Lines from One (1)
Phase Line to Vee (V) Phase Line
Conversion of existing one (1) phase line to Vee (V)
phase line involving the lines in the following: 1) from
Barangay Bito-on to barangay Portlamon, Hinatuan;
and 2) from Barangay San Juan to Barangay
Pamanlinan, Bislig City
To address load growth, reduce
technical losses and improve
voltage quality
3,052,029.33
Expansion of Distribution Line and
Construction of One (1) Phase Line
Expansion of distribution line involving the
construction of one (1) phase line to serve unenergized
Sitios within its franchise area namely: 1) Sitio
Mabog, San Jose City, 2) Sitio Puerto, Maharlika,
Bislig City, 3) Sitio Dreamland, Tagbina, 4) Sitio
To comply with the
government’s thrust of one
hundred percent (100%)
energization through the
Department of Energy’s (DOE)
8,169,911.59

19th Status Report on EPIRA Implementation
85
APPLICANT PROJECT DESCRIPTION RATIONALE PROJECT COST
(MPhP)
DATE FILED/
APPROVED
Haguimitan, Lingig, and 5) Sitios Tabuk in Santo
Niño, Bil-At in Loyola, and Mahaba in San Juan, all in
the Municipality of Hinatuan
“O Ilaw” program
Procurement and Replacement of
Inefficient Transformers
Procurement of the following Distribution
Transformers (DTs): 1) ten (10) units of 10 kVA DT;
2) 10 units of 15 kVA DT; 3) five (5) units of 25
kVA DT; 4) four (4) units of 37.5 kVA DT; and five
(5) one (1) unit of 50 kVA DT
To address load growth and
improve power quality
1,120,000.00
Procurement of Computer Software
and Equipment
Procurement of a computer software (SynerGee) and a
thermal scanner To monitor and properly
evaluate distribution of electric
system
2,184,000.00
Construction of a 69 kV
Subtransmission Line
Construction of four hundred forty meters (440 m) of
69 kV subtransmission lines to serve the Tabon
Substation
To improve power quality, and
provide connection for the
delivery of power to the 10
MVA Tabon Substation
771,307.28
Projects for 2010
Procurement, Replacement, and
Installation of kWh Meters
Procurement, replacement, and installation of two
thousand four hundred (2,400) units of defective kWh
meter of various types
To promote accuracy in the
meter registration of energy sales
2,688,000.00
Procurement of Additional Poles and
Replacement of Rotten Poles
Procurement of additional poles and replacement of
one hundred nine (109) rotten poles To address load growth and
improve power quality and
system reliability
To promote safety in the
maintenance of the distribution
system
1,623,753.60
Conversion of Lines from One (1)
Phase Line to Vee (V) Phase Line
Conversion of existing one (1) phase line to Vee (V)
phase line involving the following lines: 1) from
kilometer four (4) to Barangay Lawigan, Bislig City;
2) from Barangay Kahayag to Barangay Coleto; 3)
from Barangay San Vicente to Barangay Tidman
To address load growth, reduce
technical losses and improve
voltage quality
1,951,887.53
Expansion of Distribution Line and
Construction of One (1) Phase Line
Expansion of distribution line involving the
construction of one (1) phase line to serve the
unenergized Sitios within its franchise area, namely: 1)
Sitio Pagasa, Tagbina, 2) Sitios Kopot, Katipunan,
Mahogany, Agsaban and Paradise in Barangay
Tagpupuran, all in the municipality of Lingig, 3) Sitios
Barobo of San Juan, Kasikuhan and Agsaban, Talisay,
all in the municipality of Hinatuan
To comply with the
government’s thrust of one
hundred percent (100%)
energization through the
Department of Energy’s (DOE)
“O Ilaw” program
4,255,777.49

19th Status Report on EPIRA Implementation
86
APPLICANT PROJECT DESCRIPTION RATIONALE PROJECT COST
(MPhP)
DATE FILED/
APPROVED
Procurement of Distribution
Transformers (DTs)
Procurement of the following DTs in such number of
units and capacities, namely; 1) ten (10) units of 10
kVA DT; 2) ten (10) units of 15 kVA DT; 3) five (5)
units of 25 kVA DT; 4) four (4) units of 37.5 kVA
DT; and 5 one (1) unit of 50 kVA DT
To address load growth and
improve the distribution system
1,120,000.00
Procurement and Installation of three
(3) units of 69 kV Circuit Breakers
(CBs)
Procurement and installation of three (3) units of 69
kV CBs for installation of in all substations To provide protection and
security of substations
To promote reliability of
operations of substations
14,153,085.32
Procurement of Tools and
Equipment
Procurement of tools and equipment such as load
logger, meter seal, ampact gun, and ampact connection
of various sizes
To monitor properly evaluate
distribution of electric service
4,325,511.12
Procurement of Maintenance
Vehicles
Procurement of various types of vehicles To enhance quality of service 10,000,000.00
Projects for 2011
Procurement, Replacement, and
Installation of kWh Meters
Procurement, replacement, and installation of two
thousand four hundred (2,400) units of defective kWh
meter of various types
To promote accuracy in the
meter registration of energy sales
2,688,000.00
Procurement of Additional Poles and
Replacement of Rotten Poles
Procurement of additional poles and replacement of
one hundred eleven (111) rotten poles To address load growth and
improve power quality and
system reliability
To promote safety in the
maintenance of the distribution
system
1,637,081.60
Conversion of Lines from One (1)
Phase Line
Conversion of existing one (1) phase line to Vee (V)
phase line involving the following lines: 1) from
Barangay Dughan to Barangay Gamut; 2) from
Barangay Santa Juana to Barangay San Vicente II; and
2) from Barangay Gamut to Barangay Javier, Barobo
To address growth, reduce
technical losses, and improve
voltage quality
2,711,005.85
Expansion of Distribution Line and
Construction of One (1) Phase Line
Expansion of distribution line involving the
construction of one (1) phase line to serve unergized
Sitios within its franchise areas, namely; 1) Sitio
Tapnigidan, Osmeña, Tagbina, and 2) Sitio Makape,
Magsaysay including the vicinity of the National
Highway in Barobo
To comply with the
government’s thrust of one
hundred percent (100%)
energization through the DOE’s
“O Ilaw” program
1,639,378.05
Acquisition of a 69 kV
Substranmission Line
Acquisition of a 69 kV subtransmission line consisting
of a wooden pole structures of 69 kV subtransmission
line # 366 MCM conductors and overhead lines
To address load growth and
improve the distribution system
12,415,200.00

19th Status Report on EPIRA Implementation
87
APPLICANT PROJECT DESCRIPTION RATIONALE PROJECT COST
(MPhP)
DATE FILED/
APPROVED
Procurement of Tools and
Equipment
Procurement of ampact connection of various sizes and
meter seals To monitor and properly
evaluate distribution of electric
service
5,009,795.12
Projects for 2012
Procurement, Replacement, and
Installation of kWh Meters
Procurement, replacement, and installation of two
thousand four hundred (2,400) units of defective kWh
meter of various types
To promote accuracy in the
meter registration of energy sales
2,688,000.00
Procurement of Additional Poles and
Replacement of Rotten Poles
Procurement of additional poles and replacement of
seventy-four (74) rotten poles To address load growth and
improve power quality and
system reliability
To promote safety in the
maintenance of the distribution
system
923,845.44
Conversion of Lines from One (1)
Phase Line
Conversion of existing one (1) phase line to Vee (V)
phase line of the following lines: from Barangay
Tangonon to Quarry, Barangay Villaverde, Tagbina to
Junction, Sayon, Tagbina; and from Barangay
Tagasaka to Barangay Loyola, Hinatuan
To address load growth, reuce
technical losses and improve
voltage quality
1,139,114.43
Expansion of Distribution Line and
Construction of One (1) Phase Line
Expansion of distribution line involving the
construction of one (1) phase lien to serve unenergized
Sitios within its Franchise area namely: 1) SitioP5
Poblacion, Barobo, 2) Sitio Hollywood, Mamis,
Barobo, 3) Sitio Binooyan, San Jose , Barabo, and 4)
Sitio Kinagbangan, Tangonon
To comply with the
government’s thrust of one
hundred percent (100%)
energization through the DOE’s
“O Ilaw” program
3,109,689.54
Procurement of DTs
Procurement of the following DTs: 1) ten (10) units of
10 kVA DT; 2) ten (10) units of 15 kVA DT; 3) five
(5) units of 25 kVA DT; 4) four (4) units of 37.5 kVA
DT; and one (1) unit of 50 kVA DT
To address the load growth and
improve the distribution system
1,120,000.00
Procurement of Tools and
Equipment
Procurement of ampact connection of various sizes and
meter seals To monitor and properly
evaluate distribution of electric
service
4,069,395.12
Procurement, Replacement, and
Installation of kWh Meters
Procurement, replacement, and installation of two
thousand four hundred (2,400) units of defective kWh
meter of various types
To promote accuracy in the
meter registration of energy sales
2,688,000.00
Procurement of Additional Poles and
Replacement of Rotten Poles
Procurement of additional poles and replacement of
forty-sixty (46) rotten poles To address load growth and
improve power quality and
system reliability
To promote safety in the
562,451.68
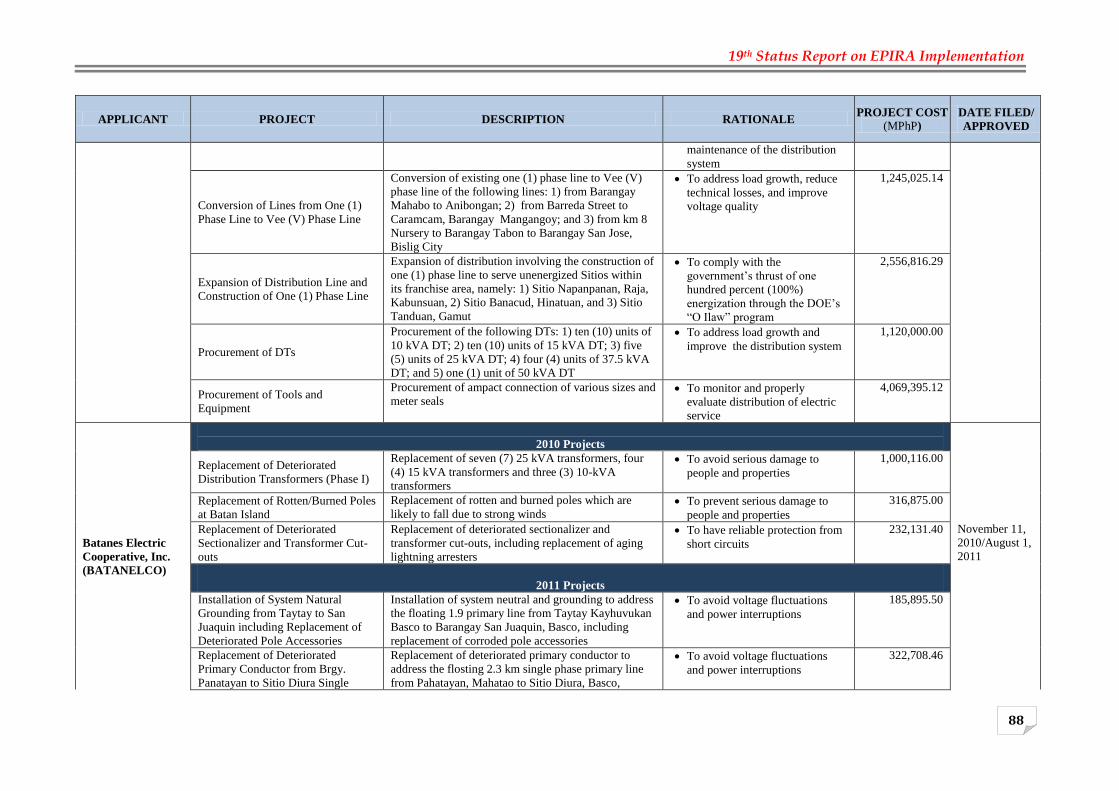
19th Status Report on EPIRA Implementation
88
APPLICANT PROJECT DESCRIPTION RATIONALE PROJECT COST
(MPhP)
DATE FILED/
APPROVED
maintenance of the distribution
system
Conversion of Lines from One (1)
Phase Line to Vee (V) Phase Line
Conversion of existing one (1) phase line to Vee (V)
phase line of the following lines: 1) from Barangay
Mahabo to Anibongan; 2) from Barreda Street to
Caramcam, Barangay Mangangoy; and 3) from km 8
Nursery to Barangay Tabon to Barangay San Jose,
Bislig City
To address load growth, reduce
technical losses, and improve
voltage quality
1,245,025.14
Expansion of Distribution Line and
Construction of One (1) Phase Line
Expansion of distribution involving the construction of
one (1) phase line to serve unenergized Sitios within
its franchise area, namely: 1) Sitio Napanpanan, Raja,
Kabunsuan, 2) Sitio Banacud, Hinatuan, and 3) Sitio
Tanduan, Gamut
To comply with the
government’s thrust of one
hundred percent (100%)
energization through the DOE’s
“O Ilaw” program
2,556,816.29
Procurement of DTs
Procurement of the following DTs: 1) ten (10) units of
10 kVA DT; 2) ten (10) units of 15 kVA DT; 3) five
(5) units of 25 kVA DT; 4) four (4) units of 37.5 kVA
DT; and 5) one (1) unit of 50 kVA DT
To address load growth and
improve the distribution system
1,120,000.00
Procurement of Tools and
Equipment
Procurement of ampact connection of various sizes and
meter seals To monitor and properly
evaluate distribution of electric
service
4,069,395.12
Batanes Electric
Cooperative, Inc.
(BATANELCO)
2010 Projects
November 11,
2010/August 1,
2011
Replacement of Deteriorated
Distribution Transformers (Phase I)
Replacement of seven (7) 25 kVA transformers, four
(4) 15 kVA transformers and three (3) 10-kVA
transformers
To avoid serious damage to
people and properties
1,000,116.00
Replacement of Rotten/Burned Poles
at Batan Island
Replacement of rotten and burned poles which are
likely to fall due to strong winds To prevent serious damage to
people and properties
316,875.00
Replacement of Deteriorated
Sectionalizer and Transformer Cut-
outs
Replacement of deteriorated sectionalizer and
transformer cut-outs, including replacement of aging
lightning arresters
To have reliable protection from
short circuits
232,131.40
2011 Projects
Installation of System Natural
Grounding from Taytay to San
Juaquin including Replacement of
Deteriorated Pole Accessories
Installation of system neutral and grounding to address
the floating 1.9 primary line from Taytay Kayhuvukan
Basco to Barangay San Juaquin, Basco, including
replacement of corroded pole accessories
To avoid voltage fluctuations
and power interruptions
185,895.50
Replacement of Deteriorated
Primary Conductor from Brgy.
Panatayan to Sitio Diura Single
Replacement of deteriorated primary conductor to
address the flosting 2.3 km single phase primary line
from Pahatayan, Mahatao to Sitio Diura, Basco,
To avoid voltage fluctuations
and power interruptions
322,708.46

19th Status Report on EPIRA Implementation
89
APPLICANT PROJECT DESCRIPTION RATIONALE PROJECT COST
(MPhP)
DATE FILED/
APPROVED
Phase Line including installation of
System Neutral and Grounding
including replacement of deteriorated pole accessories
and conductor and installation of system neutral and
grounding
Procurement of Lineman Tools and
Equipment
Procurement of the following tools:
To improve efficiency and
maintain linemen safety
464,891.53
Replacement of Old Kilowatt Hour
Meters
Replacement of old kilowatt hour meters including all
metering equipment To determine the accurate power
consumption of each customer
and provide kilowatt hour meters
for the new customers
333,033.00
Installation of System Neutral and
Grounding of 16 km Floating
Primary Line
Installation of system ground for the 16 kms. Floating
primary line in Sabtang To avoid voltage fluctuations
and address the danger posed by
the said fluctuations to customers
473,780.16
Replacement of Deteriorated Pole
Accessories of Three Phase Line
from Vatang to Ivana Welcome
Replacement of 2.3 kms section of Feeder 2 at Batan
Island from Vatang Bridge to Ivana Welcome
including replacement of all pole accessories for the
three phase primary line serving the Municipalities of
Ivana and Uyugan
To improve reliability and avoid
massive power interruptions
969,014.82
Replacement of Deteriorated Pole
Accessories and Wires from Ivana to
Uyugan including System Neutral
and Grounding
Replacement of 4kms highly corroded wires and
accessories of the Vee-Phase line from Ivana to Itbud
sectionalizer, and replacement of fallen or corroded
system neutral and grounding
To address safety deficiencies of
the line and avoid massive power
interruptions
1,788,624.64
Replacement of Old Kilowatt Hour
Meters
Replacement of old kilowatt hour meters including all
metering equipment To determine the accurate power
consumption of each customer
and provide kilowatt hour meters
for the new customers
333,033.00
2013 Projects
Replacement of Primary Conductor
and Deteriorated Pole Accessories
including System Neutral and
Grounding from Uyugan to Itbud
Replacement of five (5) kms highly corroded wires
and accessories of the single phase line from Uyugan
to Itbud including replacement of fallen or corroded
system neutral and grounding
To address safety deficiencies of
the line and avoid massive power
interruptions
576,265.00
Partial Replacement of Deteriorated Replacement of 15 kms distribution lines at Itbayat To avoid voltage fluctuations 800,000.00
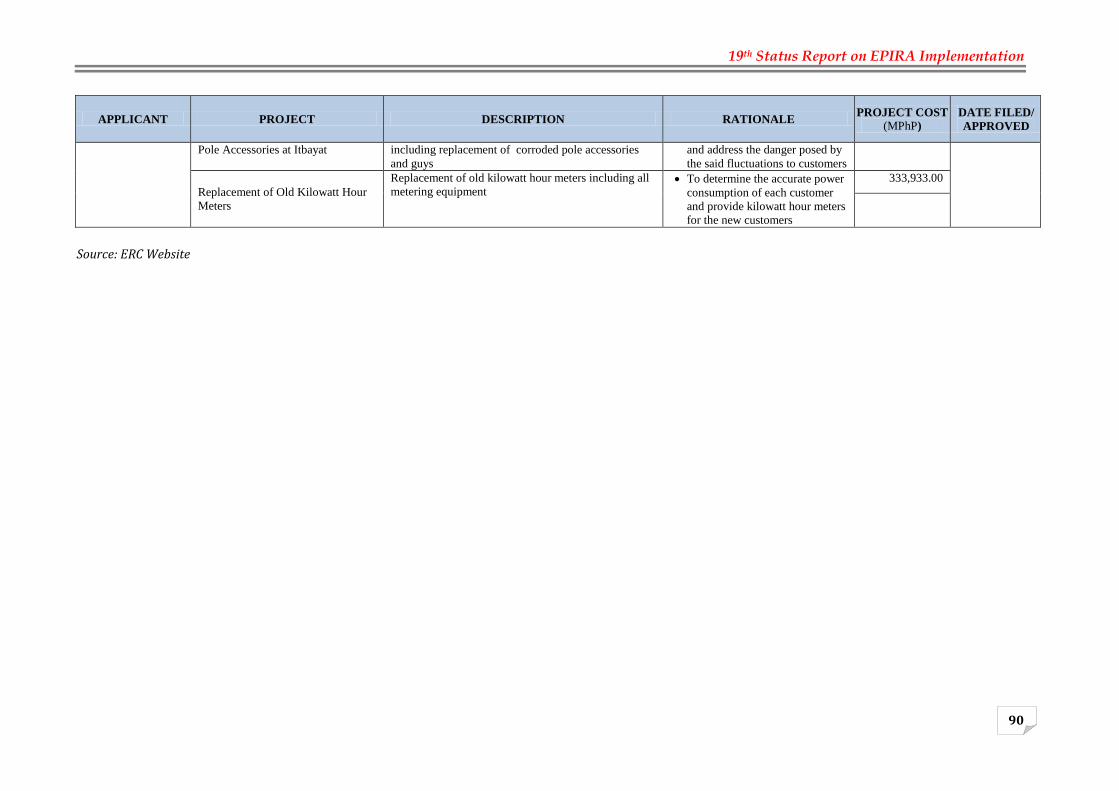
19th Status Report on EPIRA Implementation
90
APPLICANT PROJECT DESCRIPTION RATIONALE PROJECT COST
(MPhP)
DATE FILED/
APPROVED
Pole Accessories at Itbayat including replacement of corroded pole accessories
and guys
and address the danger posed by
the said fluctuations to customers
Replacement of Old Kilowatt Hour
Meters
Replacement of old kilowatt hour meters including all
metering equipment To determine the accurate power
consumption of each customer
and provide kilowatt hour meters
for the new customers
333,933.00
Source: ERC Website

19th Status Report on EPIRA Implementation
91
Annex 15. ECs Average Systems Rates as of January to October 2011
ELECTRIC COOPERATIVES
Average Systems Rates
Jan-11 Feb-11 Mar-11 Apr-11 May-11 Jun-11 Jul-11 Aug-11 Sep-11 Oct-11
REGION I (Ilocos Region)
INEC 7.8842 8.1872 8.0423 8.2422 8.6763 8.6749 8.3681 8.5562 8.0731 8.4540
ISECO 6.6223 7.2181 7.8172 7.9755 7.3976 7.3268 6.9182 6.9399 6.7409 7.0307
LUELCO 8.0679 8.9166 9.0509 9.3557 9.1245 9.9075 10.2229 9.4639 9.1773 8.6588
PANELCO I 9.4213 10.4185 11.0721 10.4261 10.5037 10.5493 11.5794 10.8797 10.6655 11.1071
CENPELCO 8.1879 8.0219 8.3078 8.3418 8.0253 9.4898 8.0865 8.1427 8.2918 8.0960
PANELCO III 7.5814 8.4165 8.5586 9.2228 8.4402 8.6429 8.4292 8.2231 8.2891 NDS
Region I Average 7.7992 8.2912 8.5112 8.7337 8.4362 8.8930 8.4908 8.3614 8.2581 8.2767
REGION II (Cagayan Valley)
BATANELCO 6.8877 5.7911 7.3118 8.6844 7.6512 7.0140 7.5738 7.7033 7.4534 8.0291
CAGELCO I 8.0078 8.3910 8.5001 8.5614 8.0031 8.1048 7.9285 7.8957 8.1087 8.1208
CAGELCO II 8.2879 8.7895 9.0851 8.9984 8.6360 8.9817 8.7601 8.5819 8.1982 8.3713
ISELCO I 8.4718 9.3360 10.0592 10.3155 9.0659 10.1157 9.2599 8.9304 8.1730 8.1218
ISELCO II 8.4194 8.5696 8.9077 8.7871 8.5761 8.9307 8.6919 8.5233 8.7874 7.4554
NUVELCO 8.5225 10.2373 10.4722 10.9334 9.9419 NDS NDS NDS NDS NDS
QUIRELCO 10.1955 10.5034 10.7615 10.7808 10.1909 10.3569 10.1024 9.8407 10.2507 10.1528
Region II Average 8.3892 9.0855 9.4849 9.6185 8.8124 9.1993 8.7659 8.5626 8.3447 8.0683
CAR (Cordillera Administrative Region)
ABRECO NDS NDS NDS NDS NDS NDS NDS NDS NDS NDS
BENECO 4.6941 4.7525 4.6473 4.7125 7.1564 7.7017 4.9756 4.6839 4.8358 4.9066
IFELCO 10.1646 9.7764 10.3382 10.6748 10.6629 10.3628 10.3755 10.6046 10.2650 9.6811
KAELCO 9.4644 10.1599 9.9448 10.4273 10.4047 10.2287 9.6209 9.2663 8.3422 9.6757
MOPRECO 8.5856 8.8148 9.3480 9.8572 9.3945 9.6045 9.3653 8.8257 8.6678 8.5185
CAR Average 5.1982 4.8230 5.2321 5.3755 7.5348 8.0094 5.5556 5.2744 5.3512 5.4124

19th Status Report on EPIRA Implementation
92
ELECTRIC COOPERATIVES
Average Systems Rates
Jan-11 Feb-11 Mar-11 Apr-11 May-11 Jun-11 Jul-11 Aug-11 Sep-11 Oct-11
REGION III (Central Luzon)
AURELCO-Central Aurora 10.1553 11.5978 10.8383 10.8768 10.7181 10.9967 11.1688 10.5139 10.4040 10.2901
NEECO I 10.0272 7.9674 8.1306 8.3220 7.7265 8.1066 9.7655 8.2916 7.8956 7.6996
NEECO II-Area 1 9.2047 10.0640 10.5377 11.1306 10.2470 10.6379 10.0929 10.0367 10.0514 9.7634
NEECO II-Area 2 10.4255 10.3173 8.8593 8.3175 7.6495 8.6771 NDS NDS NDS NDS
PELCO I 8.2302 9.5021 9.6695 9.9292 9.8306 9.5672 9.9101 9.7501 9.6317 9.8019
PELCO II 8.0576 8.0052 8.3589 8.3164 7.9544 8.4588 8.4665 8.1993 8.2111 NDS
PELCO III 7.7227 8.3217 8.5850 9.0579 8.3480 8.5233 8.3359 8.1359 8.1770 8.0230
PENELCO 8.0669 8.8218 9.3557 10.0739 9.2762 9.4251 8.6535 8.2357 8.1950 8.1598
PRESCO 8.8638 9.9337 10.0213 10.0109 9.7480 10.4457 10.8971 10.0861 9.9932 9.6555
SAJELCO 7.9131 8.8376 8.7497 8.9747 9.2322 8.8136 9.4863 9.0116 9.1958 NDS
TARELCO I 7.6721 8.5044 8.9425 9.4902 8.6149 9.1043 8.7620 8.6706 8.7050 8.7999
TARELCO II 6.6903 7.3270 7.8845 8.1140 7.3929 7.4063 7.1432 7.0467 7.0431 7.0406
ZAMECO I 9.2870 10.1227 10.8355 10.7750 10.8551 11.0910 10.7756 11.1913 10.9305 10.7244
ZAMECO II 8.2633 9.1592 9.3836 9.6528 9.0474 9.9675 10.0991 9.1972 9.1796 8.9725
Region III Average 8.3306 8.7934 9.0205 9.2798 8.7344 9.0581 9.0144 8.6626 8.6174 8.6108
REGION IV-A (Calabarzon)
BATELEC I 7.7977 7.5589 7.8551 7.8796 7.6529 8.3711 8.0779 8.0756 8.4851 8.4625
BATELEC II 7.1016 7.2900 7.6321 7.3300 7.3354 8.3606 7.7783 7.6301 7.5313 7.5313
FLECO 8.1799 8.3935 9.6278 10.4058 9.8566 9.5951 9.7137 9.4136 9.1640 9.1640
QUEZELCO I 7.8622 8.1387 8.3430 8.5203 8.5430 8.8177 8.9880 8.5367 8.8909 8.8909
QUEZELCO II 9.1239 9.3710 9.9139 9.7482 9.7796 10.1113 10.2996 9.9270 9.7299 9.7299
REGION IV-B (Mimaropa)
LUBELCO 7.9965 8.8097 9.9934 8.9742 9.0004 9.0505 10.3044 10.7773 10.8831 11.1908
OMECO 9.3238 9.2830 11.6847 10.5830 10.5478 10.5689 10.6682 10.5998 10.6421 10.6641

19th Status Report on EPIRA Implementation
93
ELECTRIC COOPERATIVES
Average Systems Rates
Jan-11 Feb-11 Mar-11 Apr-11 May-11 Jun-11 Jul-11 Aug-11 Sep-11 Oct-11
ORMECO 9.5152 10.1008 11.1060 11.0353 10.8411 10.7688 10.7510 10.6277 11.0263 10.5590
MARELCO 9.0085 11.1395 10.2591 10.5209 10.8404 10.6087 10.5204 10.3551 10.6430 10.3810
TIELCO 5.9729 6.8893 7.6675 6.8763 6.8168 6.8600 6.8604 6.9361 6.8892 6.9057
ROMELCO 7.9966 8.5920 8.9996 8.7389 8.7924 8.8054 8.6738 8.6815 8.7583 8.8261
BISELCO 6.6233 7.3409 8.2645 7.7490 7.6965 8.4611 8.0828 8.1703 8.1953 8.4727
PALECO 8.0581 8.4144 8.4237 7.8064 8.2758 8.2998 8.2828 8.4318 8.5069 8.4750
Region IV Average 9.0161 9.2620 9.8485 9.5832 9.4469 10.0822 8.5160 8.3010 8.4976 8.4342
REGION V (Bicol region)
ALECO 8.4772 7.3796 7.3645 6.8365 7.0194 9.4355 7.3673 7.7205 NDS NDS
CANORECO 8.8555 8.7306 8.9179 9.0926 8.7960 10.1344 9.4290 9.3117 9.2061 9.0905
CASURECO I 9.6716 9.4122 9.7927 9.8056 9.3882 10.6904 10.0120 9.7032 9.8658 9.5799
CASURECO II 9.0876 10.0828 10.2073 10.3324 10.2302 10.4777 8.4195 8.8985 8.7446 8.8662
CASURECO III 9.9732 9.1722 9.3537 9.6680 9.4387 11.2353 8.4467 9.4583 8.8417 NDS
CASURECO IV 11.0458 10.8897 11.5292 11.5295 11.2773 11.6489 11.0740 11.0442 11.2391 11.3235
FICELCO 9.4697 10.0310 10.0945 10.0738 10.1530 10.2596 10.1491 10.2191 9.9403 9.9846
MASELCO 7.3889 7.3854 7.3131 7.2512 7.3823 7.3745 7.3984 7.3902 7.3713 7.4279
SORECO I 8.7022 9.3595 9.7699 9.8909 9.5699 10.2046 9.3441 9.1524 8.9827 8.9165
SORECO II NDS NDS NDS NDS NDS NDS NDS NDS NDS NDS
TISELCO 6.5916 7.5480 7.9552 7.9347 7.5821 7.5408 9.0257 8.0016 8.5995 NDS
Region V Average 8.9159 8.7930 8.9203 8.8405 8.7759 10.0105 8.4536 8.7411 9.0271 9.0484
Luzon Average 8.2631 8.5688 8.9057 8.9942 8.7834 9.3293 8.4866 8.3136 8.3295 8.2594
REGION VI (Western Visayas)
AKELCO 7.6510 7.8423 7.8504 8.1312 9.6901 9.0310 9.8795 10.2398 10.1682 9.4666
ANTECO 8.2957 9.0665 9.3898 9.5669 10.5353 11.0331 10.5328 11.0836 9.7219 10.1891

19th Status Report on EPIRA Implementation
94
ELECTRIC COOPERATIVES
Average Systems Rates
Jan-11 Feb-11 Mar-11 Apr-11 May-11 Jun-11 Jul-11 Aug-11 Sep-11 Oct-11
CAPELCO 8.7907 8.2879 9.7724 9.0967 8.7946 9.2492 10.5449 12.0438 10.4357 10.1594
GUIMELCO 10.4479 10.2574 10.4196 10.6777 10.6293 10.9350 11.5452 11.6681 10.3757 10.3418
ILECO I 9.2974 9.2883 9.1492 10.1030 9.6074 9.4987 9.6448 9.5103 9.3699 9.4303
ILECO II 7.7961 8.9150 8.8563 9.0771 10.1771 9.9670 11.4634 10.2979 10.5751 10.3931
ILECO III 7.0410 8.3352 8.1390 8.3854 8.5704 8.8233 9.7705 8.9762 8.7469 8.6462
CENECO 5.5250 6.1871 5.8488 7.2312 6.6719 7.5091 7.3540 7.6870 7.6449 7.8916
NOCECO 6.3076 6.5767 7.1520 7.8208 8.0422 8.4683 8.3530 8.9839 8.3811 8.5482
VRESCO 6.9951 7.5800 7.8218 8.7883 8.5945 8.5455 8.8472 9.5397 9.3455 9.3218
Region VI Average 7.0099 7.4368 7.5285 8.2714 8.3196 8.6203 8.9002 9.2458 8.9228 8.9263
REGION VII (Central Visayas)
BANELCO 8.7730 8.7438 8.7553 8.7048 8.7083 8.7109 8.6721 8.6603 8.6648 8.6298
BOHECO I 6.0889 6.1067 5.9144 7.9831 7.6483 8.3714 NDS NDS NDS NDS
BOHECO II 7.9414 7.7200 7.8438 7.9717 7.7414 8.4007 6.7664 6.6901 5.6973 5.9270
CELCO 9.9497 11.3519 11.5936 11.4209 11.3719 11.3547 11.2765 11.3941 11.3900 11.4211
CEBECO I 7.0464 7.1000 3.7641 3.6052 3.5121 4.5115 4.4245 4.1179 4.2444 3.7862
CEBECO II 4.1073 4.0608 4.2984 4.3990 3.7546 4.6138 4.7024 5.3008 5.0521 5.0067
CEBECO III 5.3056 5.4628 5.6903 5.6851 6.3311 5.6567 7.1872 6.1682 6.3410 6.5724
NORECO I 6.3751 6.1848 4.1219 6.9254 7.7348 7.4467 8.0515 8.2717 7.8656 7.4289
NORECO II 6.7260 7.0433 NDS NDS NDS NDS NDS NDS NDS NDS
PROSIELCO 9.5215 11.0398 11.6374 11.9504 11.0348 11.0084 11.0190 10.9949 11.0936 11.1206
Region VII Average 6.5436 6.5255 6.5345 7.1299 6.9062 7.5646 7.5399 7.6232 7.3615 7.2314
Equivalent in US$ 0.1481 0.1493 0.1502 0.1649 0.1601 0.1744 0.1761 0.1797 0.1711 0.1664
REGION VIII (Eastern Visayas)
BILECO 9.5395 8.9773 9.5693 9.1443 9.2316 10.0773 8.9465 9.4101 8.2625 7.7915

19th Status Report on EPIRA Implementation
95
ELECTRIC COOPERATIVES
Average Systems Rates
Jan-11 Feb-11 Mar-11 Apr-11 May-11 Jun-11 Jul-11 Aug-11 Sep-11 Oct-11
DORELCO 7.2618 7.3545 7.8196 8.3740 8.0578 8.1113 8.0967 8.2793 7.5348 7.3202
LEYECO II 6.2892 6.3061 4.2514 4.3817 4.2020 4.2701 4.2429 4.0961 3.6950 3.5690
LEYECO III 8.3040 8.4069 8.5634 8.8217 8.3099 7.0994 6.9733 7.0939 6.9005 6.8206
LEYECO IV 7.5888 7.7401 8.1614 8.0008 7.0884 6.6992 6.7150 6.9025 6.3940 6.4027
LEYECO V 7.3627 7.7576 7.9353 8.0070 7.8155 7.5458 7.7682 7.5466 7.4817 7.2809
SOLECO 8.2056 8.4692 7.9204 9.5884 8.5190 8.5534 8.4141 8.4835 8.1838 8.0435
ESAMELCO 8.5090 9.0349 8.6888 8.8039 8.6652 8.4708 8.4240 8.5354 8.2212 8.1347
NORSAMELCO 9.2520 8.8370 8.8185 8.1162 9.5320 8.9129 7.6287 7.9942 7.9891 8.0865
SAMELCO I 6.8703 8.3656 7.2050 10.3603 8.1699 8.4194 8.1033 8.1938 7.9405 7.8209
SAMELCO II 7.3671 7.3717 7.7715 7.9151 7.8523 8.2205 8.2539 8.4056 7.0011 7.1282
Region VIII Average 7.4153 7.6348 7.6971 8.1755 7.8064 7.8008 7.6529 7.6429 7.1943 7.0600
Visayas Average 6.9524 7.2016 7.3121 7.9593 7.8552 8.1718 8.3004 8.4958 8.1594 8.0900
REGION IX (Zamboanga Peninsula)
ZANECO 5.4954 6.0231 5.5773 6.0225 6.1295 6.0926 6.1957 5.3594 5.6330 5.7536
ZAMSURECO I 5.7936 5.9231 6.0547 6.2609 6.3724 6.3653 6.3555 5.9822 5.4030 6.0131
ZAMSURECO II 6.1039 6.0108 6.4853 6.7180 6.6353 6.5664 6.2587 5.6204 6.2155 6.3236
ZAMCELCO 4.8340 5.3101 5.2303 5.3590 5.3979 5.4248 5.3362 5.1650 4.9695 5.2334
Region IX Average 5.2773 5.6196 5.5978 5.7900 5.8327 5.8187 5.7631 5.3943 5.2964 5.5892
REGION X (Northern Mindanao)
FIBECO 5.9211 6.2643 6.2826 6.3853 6.6433 6.6636 6.3230 5.8615 5.8598 6.3403
BUSECO 5.4368 6.3893 6.0090 5.8424 5.9938 5.9495 5.8520 5.6628 5.5149 5.7788
CAMELCO 8.3699 8.6739 9.1521 8.9478 9.3689 8.6630 8.8568 8.6517 8.5034 8.5905
LANECO 6.4748 7.1379 7.3573 6.6381 6.9766 8.1994 7.3212 6.9083 7.3089 6.7276
MOELCI I 6.4660 6.8431 6.4509 6.6145 6.6705 6.6698 6.7606 6.3790 6.3081 6.4677

19th Status Report on EPIRA Implementation
96
ELECTRIC COOPERATIVES
Average Systems Rates
Jan-11 Feb-11 Mar-11 Apr-11 May-11 Jun-11 Jul-11 Aug-11 Sep-11 Oct-11
MOELCI II 6.1423 6.7183 6.4826 6.6724 7.0635 6.7575 7.0189 6.6767 6.4117 6.8472
MORESCO I 5.8137 6.0936 6.9414 8.8839 8.7771 8.6484 8.8086 8.3719 8.3716 8.8729
MORESCO II 5.6084 5.9976 6.2368 6.4438 6.0273 6.0688 6.1258 5.8549 5.6220 5.8633
Region X Average 5.9560 6.4515 6.5407 6.8781 7.0050 7.0242 6.9297 6.5823 6.5156 6.7983
REGION XI (Davao Region)
DORECO 6.0166 6.3392 6.3335 6.1557 6.3439 6.5695 6.5543 6.1323 6.1895 6.2912
DANECO 5.9812 6.0543 5.8484 6.1176 6.2722 6.2368 5.9812 6.0078 5.7880 5.8573
DASURECO 5.7723 5.9096 6.3499 5.6146 6.1999 5.8407 5.7112 5.5881 6.1410 6.3045
Region XI Average 5.9226 6.0441 6.0750 5.9660 6.2586 6.1572 5.9794 5.9000 5.9484 6.0520
REGION XII
COTELCO 5.3731 5.5944 5.6154 5.8028 5.9521 6.0114 5.8964 5.7664 5.4359 5.7421
SOCOTECO I 5.4732 5.3777 5.5861 5.8317 5.7732 5.7623 5.5198 4.9359 5.5648 5.6246
SOCOTECO II 5.0563 5.2239 5.3075 5.2863 5.4083 5.5367 5.4734 4.8020 5.1673 5.4123
SUKELCO 5.3515 5.5648 5.5216 5.6644 6.0121 5.9750 5.9867 5.6853 5.5625 5.3474
Region XII Average 5.2006 5.3416 5.4233 5.4911 5.6098 5.6915 5.5990 5.0709 5.3183 5.4854
ARMM (Autonomous Region in Muslim Mindanao)
CASELCO 9.7870 9.7308 9.6554 9.7779 9.7238 9.6097 9.4989 9.6340 NDS NDS
LASURECO 5.2626 5.6481 5.6828 5.6534 5.6659 5.7050 5.6912 5.5889 5.6531 5.1773
MAGELCO 5.7302 6.0211 7.2048 5.9881 5.8973 6.2227 5.9337 5.8109 NDS NDS
SIASELCO 8.3614 9.0026 9.8952 4.9984 10.0236 10.0712 10.0255 10.0062 10.0901 10.0547
SULECO 8.1602 9.3935 10.6185 10.1667 10.9116 10.0420 10.0570 NDS NDS NDS
`BASELCO 8.1066 8.7689 NDS NDS NDS NDS NDS NDS NDS NDS
TAWELCO 8.5321 10.4272 10.3964 10.8280 10.8234 10.9112 10.8321 10.1719 10.4179 10.4121
ARMM Average 6.3988 6.9886 7.4861 7.0522 7.0954 7.1813 7.3377 6.5072 7.6819 6.4529

19th Status Report on EPIRA Implementation
97
ELECTRIC COOPERATIVES
Average Systems Rates
Jan-11 Feb-11 Mar-11 Apr-11 May-11 Jun-11 Jul-11 Aug-11 Sep-11 Oct-11
CARAGA
ANECO 5.6223 5.9683 5.7680 5.9294 6.0383 5.9568 5.8371 5.8109 5.4620 5.7145
ASELCO 5.4853 6.2014 6.1120 5.7928 6.1018 6.1022 6.3025 5.5740 5.9958 6.6277
DIELCO 7.7917 8.3278 9.7315 9.7199 10.6732 9.5521 9.6137 9.5759 9.5180 9.5796
SIARELCO 7.9711 8.5628 8.6446 8.6773 9.0993 9.0308 9.0624 8.6267 8.5933 8.5507
SURNECO 4.9533 5.6865 5.3435 5.3916 5.6987 5.7318 5.5923 5.3058 5.3785 5.7269
SURSECO I 6.3397 6.3997 6.5797 6.7522 6.7968 6.8409 6.7693 6.4718 6.0630 6.3098
SURSECO II 6.1078 6.6944 6.8778 6.7690 6.6160 6.7704 6.6604 6.1052 6.3071 6.5048
CARAGA Average 5.6245 6.1290 5.9855 6.0197 6.2013 6.1685 6.1054 5.8279 5.7530 6.0989
Mindanao Average 5.5861 5.8986 5.9391 6.0265 6.1677 6.1715 6.0824 5.7163 5.8051 5.9519
National Average 7.1298 7.4247 7.6280 7.8721 7.8046 8.1408 7.7316 7.5731 7.5047 7.4561
Source: NEA-MFSRs
NDS-No Data Submitted