Embed Size (px)
Citation preview
1964 UNITED STATES CENSUS 0~GRICULTURE
FARMS FARM CHARACTERISTICS LIVESTOCK AND PRODUCTS. CROPS FRUITS VALUES
VOLUME II CHAPTER 10
Type
of Farm
U.S. DEPARTMENT OF COMMERCE C. R. Smith, Secretary
BUREAU OF THE CENSUS A. Ross Eckler, Director

1964 UNITED STATES CENSUS
o~GRICULTURE
Volume II-Chapter 10
CONTENTS
page
Introduction............................... • • • • • • • • • • • • . • • . . • • • 961 Source of data •••••••••••••••••••••••••••••••••••••••••••••• • • • 961 Presentation of statistics......................................... 961 Farms classified by type • • • • • • • • • • • • • • • • • • • • • • • • • • • • • • • • • • • • • • • • • 961 Basis of classification by type..................................... 961 The use of value of farm products sold for classifying farms by type.......... 961 Comparability of type-of-farm classification for various censuses............ 962 Censuses of 1964, 1959, 1954, and 1950.............................. 964 1945 and 19.50 to 1964- • • • • • • • • • • • • • • • • • • • • • • • • • • • • • • • • • • • • • • • • • • • 964 1940. and 19.50 to 1964 • • • • • • • • • • • • • • • • • • • • • • • • • • • • • • • • • • • • • • • • • • • 964 1930 and 1950 to 1964 • • • • • • • • • • • • • • • • • • • • • • • • • • • • • • • • • • • • • • • • • • • 964 Type of farm and farm product spe~ialization, 1964 • • • • • • • • • • • • • • • • • • • • • • 964 Farms by type, 1964 • • • • • • • • • • • • • • • • • • • • • • • • • • • • • • • • • • • • • • • • • • • • 965 Cash-grain farms • • • • • • • • • • • • • • • • • • • • • • • • • • • • • • • • • • • • • • • • • • • • • • • 965 Tobacco farms. • • • • • • • • • • • • • • • • • • • • • • • • • • • • • • • • • • • • • • • • • • • • • • • • 967 Cotton farms •••••••••••••••••••••••• , • • • • • • • • • • • • • • • • • • • • • • • • • 968 Other field-crop farms ••••••••••• -. •••••••••••••••••••••••••••• '. • • 969 Vegetable farms •••••••••• ~...................................... 970 Fruit and nut farms ••••••••••••••••••••••••• ·•••••••••••••••••••• 971 Pou I try farms . • • • • • • • • • • • • • • • • • • • • • • • • • • • • • • • • • • • • • • • • • • • • • • • • • 972 Dairy farms. • • • • • • • • • • • • • • • • • • • • • • • • • • • • • • .. • • • • • • • • • • • • • • • • • • • 973 Livestock farms (other than poultry and dairy farms and livestock ranches)..... 974 Livestock ranches •••••••••••••••••• .'. • • • • • • • • • • • • • • • • • • • • • • • • • • 975 General farms •••• •.. • • • • • • • • • • • • • • • • • • • • • • • • • • • • • • • • • • • • • • • • • • 976 Miscellaneous farms • • • • • • • • • • • • • • • • • • • • • • • • • • • • • • • • • • • • • • • • • • • • 977
CHANGES IN THE NUMBER OF FARMS BY TYPE
Changes in number of farms by type 1950-1964 • • • • • • • • • • • • • • • • • • • • • • • • • 977 Changes in farms by type from 1959 to 1964 • • • • • • • • • • • • • • • • • • • • • • • • • • • 979
TABLES
TABLE 1. Criteria Used for Classification of Farms by Type: Censuses of 1964, 1959, 1954, 1950, 1945, 1940, and 1930 • • • • • • • • • • • • • • • • • • • • • • • • • • • • • 962
2. Farms by Type-Number of Commercial Farms by Type of Farm, by Regions and States: 1964 and 1959. • • • • • • • • • • • • • • • • • • • • • • • • • • • • • • • • • • • • • • 982
959
CONTENTS-Continued page
TABLES-Continued
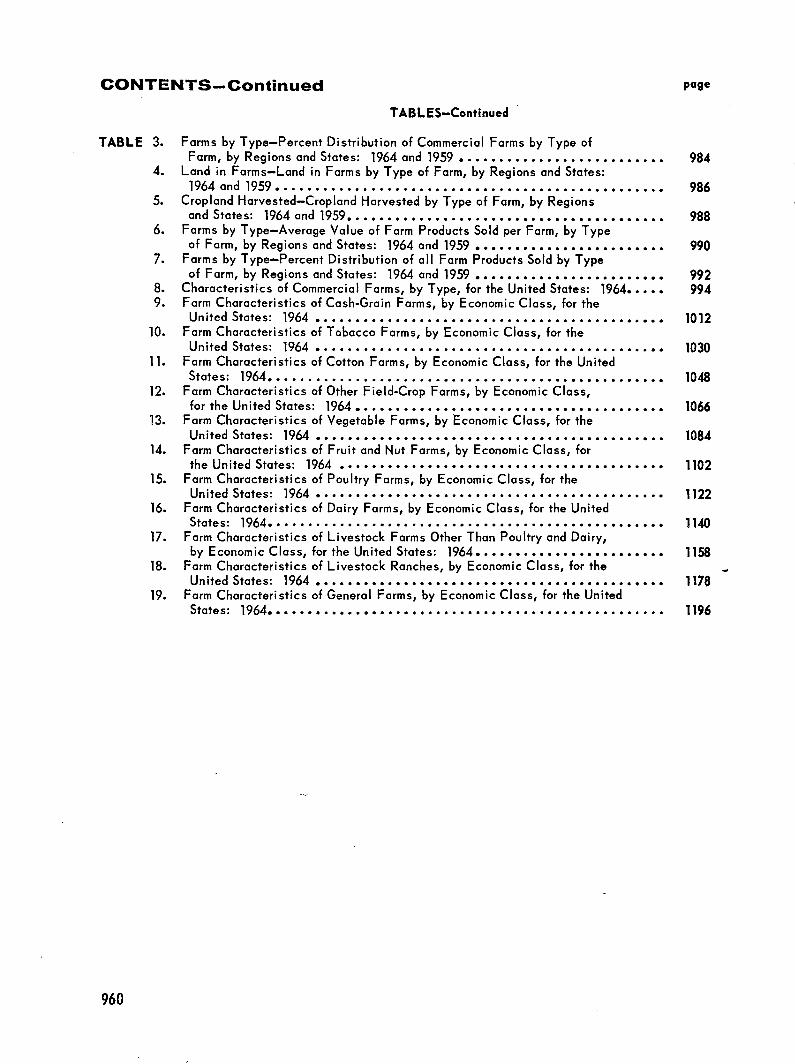
TABLE 3. Farms by Type-Percent Distribution of Commercial Farms by Type of Farm, by Regions and States: 1964 and 1959 • • • • • • • • • • • • • • • • • • • • • • • • • • 984
4. Land in Farms-Land in Farms by Type of Farm, by Regions and States: 1964 and 1959 • • • • • • • • • • • • • • • • • • • • • • • • • • • • • • • • • • • • • • • • • • • • • • • • • 986
5. Cropland Harvested-Cropland Harvested by Type of Farm, by Regions and States: 1964 and 1959. • • • • • • • • • • • • • • • • • • • • • • • • • • • • • • • • • • • • • • • 988
6. Farms by Type-Average Value of Farm Products Sold per Farm, by Type of Farm, by Regions and States: 1964 and 1959 • • • • • • • • • • • • • • • • • • • • • • • • 990
7. Farms by Type-Percent Distribution of all Farm Products Sold by Type of Farm, by Regions and States: 1964 and 1959 • • • • • • • • • • • • • • • • • • • • • • • • 992
8. Characteristics of Commercial Farms, by Type, for the United States: 1964..... 994 9. Farm Characteristics of Cash-Grain Farms, by Economic Class, for the
United States: 1964 • • • • • • • • • • • • • • • • • • • • • • • • • • • • • • • • • • • • • • • • • • • • 1012 10. Farm Characteristics of Tobacco Farms, by Economic Class, for the
United States: 1964 • • • • • • • • • • • • • • • • • • • • • • • • • • • • • • • • • • • • • • • • • • • • 1030 11. Farm Characteristics of Cotton Farms, by Economic Class, for the United
States: 1964. • • • • • • • • • • • • • • • • • • • • • • • • • • • • • • • • • • • • • • • • • • • • • • • • • 1048 12. Farm Characteristics of Other Field-Crop Farms, by Economic Class,
for the United States: 1964 • • • • • • • • • • • • • • • • • • • • • • • • • • • • • • • • • • • • • • • 1066 13. Farm Characteristics of Vegetable Farms, by Economic Class, for the
United States: 1964 • • • • • • • • • • • • • • • • • • • • • • • • • • • • • • • • • • • • • • • • • • • • 1084 14. Farm Characteristics of Fruit and Nut Farms, by Economic Class, for
the United States: 1964 • • • • • • • • • • • • • • • • • • • • • • • • • • • • • • • • • • • • • • • • • 11.02 15. Farm Characteristics of Poultry Farms, by Economic Class, for the
United States: 1964 •• • • • • • • • • • • •••• • ••• • • • • · • • • • • · • • • • • • • • • •• • • 1122 16. Farm Characteristics of Dairy Farms, by Economic Class, for the United
States: 1964.................................................. 1140 17. Farm Characteristics of Livestock Farms Other Than Poultry and Dairy,
by Economic Class, for the United States: 1964........................ 1158 18. Farm Characteristics of Livestock Ranches, by Economic Class, for the
United States: 1964 • • • • • • • • • • • • • • • • • • • • • • • • • • • • • • • • • • • • • • • • • • • • 1178 19. Farm Characteristics of General Farms, by Economic Class, for the United
States: 1964. • • • • • • • • • • • • • • • • • • • • • • • • • • • • • • • • . . • • . • • . • • • • • • . • • 1196
960
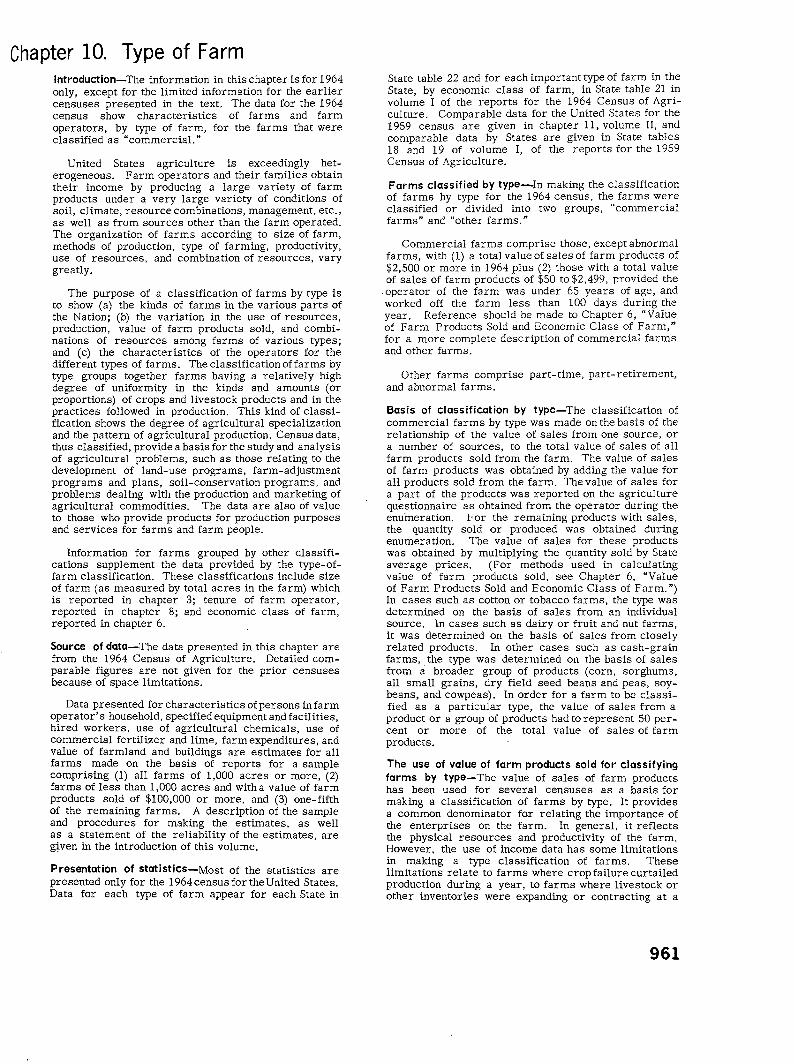
Chapter 10. Type of Farm Introduction-The information in this chapter is for 1964 only, except for the limited information for the earlier censuses presented in the text. The data for the 1964 census show characteristics of farms and farm operators, by type of farm, for the farms that were classified as "commercial. n
United States agriculture is exceedingly heterogeneous. Farm operators and their families obtain their income by producing a large variety of farm products under a very large variety of conditions of soil, climate, resource coml:Jinations, management, etc., as well as from sources other than the farm operated. The organization of farms according to size of farm, methods of production, type of farming, productivity, use of resources, and combination of resources, vary greatly.
The purpose of a classification of farms by type is to show (a) the kinds of farms in the various parts of the Nation; (b) the variation in the use of resources, production, value of farm products sold, and combinations of resources among farms of various types; and (c) the characteristics of the operators for the different types of farms. The classification of farms by type groups together farms having a relatively high degree of uniformity in the kinds and amounts (or proportions) of crops and livestock products and in the practices followed in production. This kind of classification shows the degree of agricultural specialization and the pattern of agricultural production. Census data, thus classified, provide a basis for the study and analysis of agricultural problems, such as those relating to the development of land-use programs, farm-adjustment programs and plans, soil-conservation programs, and problems dealing with the production and marketing of agricultural commodities. The data are also of value to those who provide products for production purposes and services for farms and farm people.
Information for farms grouped by other classifications supplement the data provided by the type-offarm classification. These classifications include size of farm (as measured by total acres in the farm) which is reported in chapter 3; tenure of farm operator, reported in chapter 8; and economic class of farm, reported in chapter 6.
Source of data-The data presented in this chapter are from the 1964 Census of Agriculture. Detailed comparable figures are not given for the prior censuses because of space limitations.
Data presented for characteristics of persons in farm operator's household, specified equipment and facilities, hired workers, use of agricultural chemicals, use of commercial fertilizer and lime, farm expenditures, and value of farmland and buildings are estimates for all farms made on the basis of reports for a sample comprising (1) all farms of 1,000 acres or more, (2) farms of less than 1,000 acres and with a value of farm products sold of $100,000 or more, and (3) one-fifth of the remaining farms. A description of the sample and procedures for making the estimates, as well as a statement of the reliability of the estimates, are g~ven in the introduction of this volume.
Presentation of statistics-Most of the statistics are presented only for the 1964censusfortheUnited States. Data for each type of farm appear for each State in
State table 22 and for each important type of farm in the State, by economic class of farm, in State table 21 in volume I of the reports for the 1964 Census of Agriculture. Comparable data for the United States for the 1959 census are given in chapter 11, volume II, and comparable data by States are given in State tables 18 and 19 of volume I, of the reports for the 1959 Census of Agriculture.
Farms classified by type-In making the classification of farms by type for the 1964 census, the farms were classified or divided into two groups, "commercial farms" and "other farms. n
Commercial farms comprise those, except abnormal farms, with (1) a total value of sales of farm products of $2,500 or more in 1964 plus (2) those with a total value of sales of farm products of $50 to$2.499, provided the
. operator of the farm was under 65 years of age, and worked off the farm less than 100 days during the year. Reference should be made to Chapter 6, "Value of Farm Products Sold and Economic Class of Farm," for a more complete description of commercial farms and other farms.
Other farms comprise part-time, part-retirement, and abnormal farms.
Basis of classification by type-The classification of commercial farms by type was made on the basis of the relationship of the value of sales from one source, or a number of sources, to the total value of sales of all farm products sold from the farm. The value of sales of farm products was obtained by adding the value for all products sold from the farm. The value of sales for a part of the products was reported on the agriculture questionnaire as obtained from the operator during the enumeration. For the remaining products with sales, the quantity sold or produced was obtained during enumeration. The value of sales for these products was obtained by multiplying the quantity sold by State average prices. (For methods used in calculating value of 'farm products sold, see Chapter 6, "Value of Farm Products Sold and Economic Class of Farm.") In cases such as cotton or tobacco farms, the type was determined on the basis of sales from an individual source. In cases such as dairy or fruit and nut farms, it was determined on the basis of sales from closely related products. In other cases such as cash-grain farms, the type was determined on the basis of sales from a broader group of products (corn, sorghums, all small grains, dry field seed beans and peas, soybeans, and cowpeas). In order for a farm to be classified as a particular type, the value of sales from a product or a group of products had to represent 50 percent or more of the total value of sales of farm products.
The use of value of farm products sold for classifying farms by type-The value of sales of farm products has been used for several censuses as a basis for making a classification of farms by type. It provides a common denominator for relating the importance of the enterprises on the farm. In general, it reflects the physical resources and productivity of the farm. However, the use of income data has some limitations in making a type classification of farms. These limitations relate to farms where crop failure curtailed production during a year, to farms where livestock or other inventories were expanding or contracting at a
961
rate greater than the usual annual rate for the farm, and to farms on which a considerable part of the products sold is represented by purchased items. (For example, a farm with purchased feeder cattle may be classified as a livestock farm even though the net income from crops may exceed the net income from livestock.)
product or group of products supply important sources of sales. However, for farms on which one product provides a large part or the major part of the total sales, changes in prices will have little or no influence in classifying the farm by type.
Changes in prices of several farm products at different rates or an increase or decrease in prices for products or groups of products directly related to type of farm, may cause a farm to be classified differently from one census to another. This is especially true for farms on which more than one
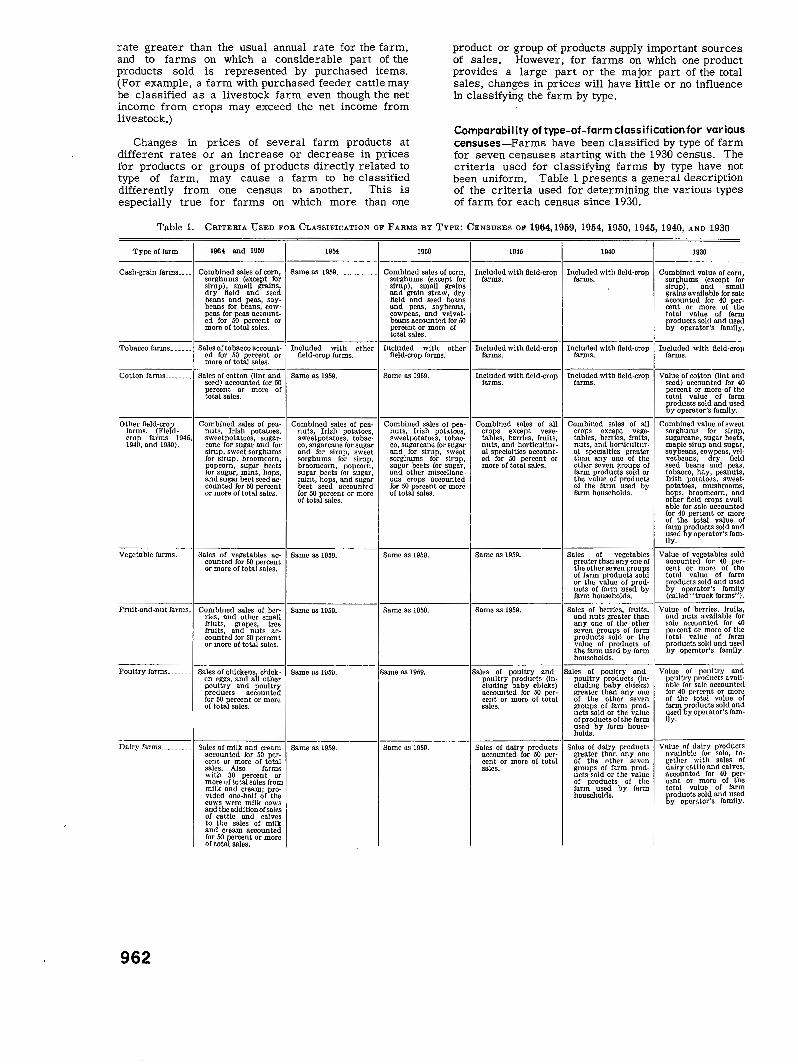
Comparabi I ity of type-of-farm classification for various censuses-Farms have been classified by type of farm for seven censuses starting with the 1930 census. The criteria used for classifying farms by type have not been uniform. Table l presents a general description of the criteria used for determining the various types of farm for each census since 1930.
Table 1. CRITERIA USED FOR CLASSIFICATION OF FARMS BY TYPE: CENSUSES OF 1964,1959, 1954, 1950, 1945, 1940, AND 1930
Type of farm
Cash-grain farms ___ _
196 4 and 1959
Combined sales o! corn, sorghums (except for
~~~P) fiel~m·~r~~~ beans and peas, soybeans for beans, cowpeas for peas accounted for 50 percent or more of total sales.
1954 1950
Same ns 1959____________ Combined sales of corn, sorghums (except for sirup), small grains and grain straw, dry field and seed bclllls and peas, soybeans, cowpeas, and velvetbeans accounted for 50 percent or more of total sales.
1945
Included wlth field-crop farms.
1940
Included wlth field-crop farms.
Tobacco farms______ Sales of tobacco account- Included with ether Included with other Included with field-crop Included with fl.eld~crop ed for 50 percent or field~crop farms. fleld~crop farms. farms. farms. more of total sales.
Cotton farms ________ Sales of cotton (lint and Same as 1959. Same as 1959. Included with field-crop Included with field-crop
Other fteld-crop farms. (Fleld-
i~48, a~if~~3o{ 945'
Vegetable farms. __ _
Fruit-and-nut farms_
Poultry farms. ___ _
Dairy farms ____ _
962
seed) accounted for 50 farms. farms. percent or more of total sales.
Combined sales of peanuts. Irish potatoes, sweetpotatoes, sugarcane for sugar and for sirup, sweet sorghums for sirup, broomcorn,
fo~Pici~;, :tri[, g~~~ and sugar beet seed ac-
~~~~~ ~i~o~~F;~:;s~t
Sales of vegetables aceoun ted for 50 pcrcen t or more of total sales.
Combined sales of berries, and other small friut!l, grapes, tree fruits, and nuts accounted for 50 percent or more of total sales.
Sales of chickens, chick~ en eggs, and all other poultry and poultry products accounted for 50 percent or more of total sales.
Sales of milk and cream accounted for 50 percon t or more of total sales. Also farms with 30 percent or more of total sales from milk and cream; provided one-half of the cows we.re milk cows and the addltlon of sales of cattle and calves to the sales of milk and cream accounted ~~rt~ar~re~.t or more
Combined sales of peanuts, Irish potatoes, sweetpotatoes, tobacco, sugarcane for sugar and for sirup, sweet sorghums for sirup, broomcorn, popcorn, sugar beets for sugar, mint, hops, and sugar beet seed accounted ~~\~~af~~~.t or more
Same as 1959.
Same as 1959.
Same as 1959.
Same as 1959.
Combined sales of peanuts, Irish potatoes, swcetpota.toes, tobacco, sugarcane for sugar and for sirup, sweet sorghums for sirup, sugar beets for sugar, and other miscellaneous crops accounted for 50 percent or more of total sales.
Same as 1950.
Same as 1950.
Same as 1959.
Same as 1959.
Combined sales of all
~~~~:s, g!~i~;, f;;i~~: nuts, and horticultural specialties accounted for 50 percent or more of total sal<"s.
Same as 1959.
Same as 1959.
SalPs of poultry and
~l~~t~~ ~~b~u~\~ic~~) accounted for 50 percent or more of total sales.
Sales of dairy products accounted for 50 percent or more of total sales.
Combined sales of all crops except vegetables, berries, fruits, nuts, and horticultural specialties greater than any one of the other seven groups of farm products sold or the value of products of the farm used by farm households.
Sales of vegetables greater than any one of
~rt~:!e~~~d~fs~~fJ or the value of products of farm used by farm households.
Sales of berries, fruits, and nuts greater than any one of th<" other seven groups of farm products sold or the value of products of the farm used by farm households.
Sales of poultry and
~l~~f~~ ~~b~u~\~ic~~) greater than any one of the other seven groups of farm products sold or the value o!productsofthe farm used by farm households.
Sales of dairy products greater than any one of the other seven groups of farm products sold or the value of products of the farm used by farm households.
1930
Combined value of corn, sorghums (except for sirup), and small grains a vallable for sale accounted for 40 per~ cent or more of the total value of farm products sold and used by operator's family.
Included wlth field-crop farms.
Value of cotton (llnt and seed) accounted for 40 percent or more of the total value of farm
b~o~g~;:t~~~~ :~~~.ed Combined value of sweet
sorghums for sirup, sugarcane, sugar beets,
~~~~eari~.uro!~~~~~~)~ vetbeans, dry field seed beans and peas, tobacco, hay, peanuts, Irish potatoes, sweet-
~~~~:~s~oo:~~~~o~~i other field crops avatlable for sale accounted for 40 percent or more of the total value of
~~~~~ g~o~~~t~~~~ !~~~ lly.
Value of vegetables sold accounted for 40 percent or more of the total value of farm products sold and used
?lnn~cf~.r:r~~~s fa:r:n~~}r. Value of bC'rrles, fruits,
and nuts available ror sale accounted for 40 percent or more of the total value of farm
g~o~~~t~ib~<}s a~~r:;~~~~
Value of poultry and poultry products a vall~ able for sale accounted for 40 p('rCC'nt or more of the tot1l.l value of
~:ed g~ood~~·~t~~~~ f:~~ lly.
Value of dairy products available for sale, to~ gethcr with sales of dairy cattle and calves, accounted for 40 percent or more of the total value of farm products sold and used by operator's family_
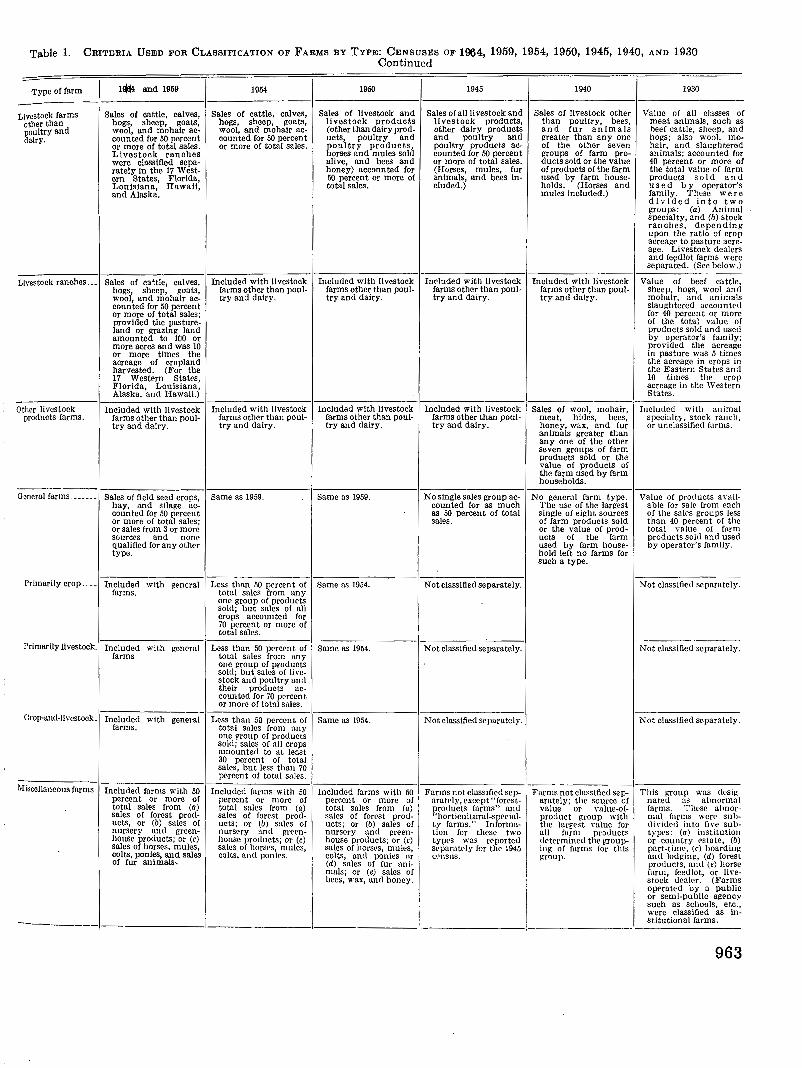
Table 1. CRITERIA USED FOR CLASSIFICATION OF FARMS BY TYPE: CENSUSES OF 1964, 1959, 1954, 1950, 1945, 1940, AND 1930 Continued
Type of farm 1~ and 1959 1954 1950 1945 1940 1930
-----------I--------------I--------------J--------------I---------------1--------------I---------------Livestock farms
other than poultry and dairy.
Livestock ranches ...
Other livestock products farms.
General farms. _____ _
Sales or cattle, calves, hogs, sheep, goats, wool, and mohair accounted for 50 percent or more of total sales. Livestock ranches were classified separately In the 17 Western States, Florida, Louisiana, Hawaii, and Alaska.
Sales of cattle, calves, hogs, sheep, goats, wool, and mohair accounted for 50 percent or more of total sales; provided the pastureland or grazing land amounted to 100 or more acres and was 10 or more times the acreage of cropland harvested. (For the 17 Western States, Florida, Louisiana, Alaska, and Hawaii.)
Included with livestock farms other than poultry and dairy.
Sales of field seed crops, hay, and slla~e accounted for 50 percent or more of total sales; or sales from 3 or more sources and none qualified for any other type.
Primarily crop ____ Included with general farms.
Primarily livestock. Included with general farms
Crop-an<l-l!Ycstock. Included with general farms.
Miscellaneous farms Included farms with 50 percent or more of total sales from (a) sales of forest products, or (b) sales of nursery and greenhouse products; or (c) sales of horses, tnules, colts, ponies, and sales of fur animals·.
Sales or cattle, calves, hogs, sheep, goats, wool, and mohair accounted for 50 percent or more of total sales.
Included with livestock fnrms other than poultry and dairy.
Included with livestock farms other than poultry and dairy.
Same as 1959.
Sales or livestock and livestock products (other than dairy products, poultry and poultry products, horses and mules sold alive, and bees and honey) accounted for 50 percent or more of total sales.
Included with livestock farms other tljan poultry and dairy.
Included with livestock farms other than poultry and dairy.
Same as 1959.
Less than 50 pcrcen t of Same as 1954. total sales from any one group of products solei; but sales of all crops accounted for 70 percent or more of total sa1es.
Less than 50 percent of Same as 1954. total sales from any one group of products sold; but sales of liYe-stock and poultry ami their products ac-counted for 70 percent or more of total sales.
Less than 50 percent of Same as 1954. total sales from any one group of products sold; sales of all crops amounted to at least 30 perccn t of total sales, but less than 70 percent of total sales.
-------1----------------Includcd farms with 50
percent or more of total sales from (a) sales of forest products; or (b) sales of nursery and g-reenhouse products; or (c) sales of horses, mules, colts, and ponies.
Included farms with 50 percent or more of total sales from (a) sales of forest products; or (b) sales of nursrry and greenhouse products; or (c) sales of horSl'S, mul<:'s, colts, and ponies or (d) sales of fur animals; or (e) sales of bees, wax, and honey.
Sales of all livestock and livestock products, other dairy products and poultry and poultry products accounted for 50 percent or more of total sales. (Horses, mules, fur animals, and bees Included.)
Included with livestock farms other than poultry and dairy.
Included with livestock farms other than poultry and dairy.
No single sales group accounted for as much as 50 percent of total sales.
Not classified separately.
Not classified separately.
Not classified separately.
Farms not classified scparat.ely, except "forestproducts farms" and ''horticultural-specialty farms." Information for these two types was reported Sl'parately for the 1945 Cl'HSUS.
Sales of livestock other than poultry, bees, and fur animals greater than any one of the other seven groups of farm products sold or the value of products of the farm used by farm households. (Horses and mules Included.)
Included with livestock farms other than poultry and dairy.
Sales of wool, mohair, meat, hides, bees, honey, wax, and fur animals greater than any one of the other seven groups of farm products sold or the value of products of the farm used by farm households.
No general farm type. The use of the largest single of eight sources of farm products sold or the value of products of the farm used by farm household left no farms for such a type.
Farms not classified separately; the source of value or Yalue-ofproduct group with the largest Yalue for all farm products determined the grouping of farms for this v:roup.
Value of all classes of meat animals, such as heef cattle, sheep, and hogs; also wool, mohair, and slaughtered animals; accounted for 40 percent or more or the total value of farm products sold and used by operator's family. These were divided into two groups: (a) Animal specialty, and (b) stock ranches, depending upon the ratio of crop acreage to pasture acreage. Livestock dealers and fe~dlot farms were separated. (See below.)
Value of beef cattle, sheep, hogs, wool and mohair, and animals slaughtered accounted for 40 percent or more of the total value of products sold and used by operator's family; provided the acreage in pasture was 5 times the acreage in crops in the Eastern States and 10 times the crop acreage in the Western States.
Included with animal specialt}, stock ranch, or unclassified farms.
Value of products aYaHable 'for sale from each of the sales groups less than 40 percent of the total value of farm products so!U and used by operator's family.
Not classified separately.
Not classified separately.
Not classified separately.
This group was designated ns abnornn1l farms. These abnornlal fnrn1s were suhdiYidetl into five subtypes: (a) institution or country estate, (b) part-time, (c) boarding and lodging, (d) forest products, anti (e) horse fnrm, feec.flot, or livestock dealer. (Farms operated by a public or seml-pu bile agency such as schools, etc., were classified as in-
------·----------J·--------------------I---------------------I--------------------'---------------------l---------------------'---s_tl_t_u_ti_o_n_a_l_fu_r_n_l_s. __ ___
963
Censuses of 1964, 1959, 1954, and 1950-The data by type of farm for 1964, 1959, 1954, and 1950 for farms with a value of farm products sold of less than $2,500 are not comparable because of differences in the classification. For 1964 and 1959, farms with sales of $50 to $2,499 were not published by type, when (a) the operator worked off the farm 100 days or more, (b) the value of income from sources other than the farm operated exceeded the value of agricultural products sold for 1959, or (c) the farm operator was 65 years old or over. For the 1954 and 1950 censuses, all farms with sales of $1,200 to $2,499 were classified by type of farm. There were approximately 763,000 and 901,000 such farms in 1954 and 1950, respectively.
Data by type of farm for farms with $2,500 or more value of products sold are comparable for the 1964, 1959, 1954, and 1950 censuses. Separate data for tobacco farms and for livestock ranches are not available for 1954 and 1950.
1945 and 1950 to 1964-The classification of farms by type for 1945 differed significantly from the classification for other years. In 1945, all farms on which the value of farm products used by farm households exceeded the value of farm products sold were not classified by type of farm. These farms (referred to as subsistence farms) totaled 1,289,206.
1940 and 1950 to 1964-The classification by type of farm used for 1940 differed significantly from the classification used for other censuses. The value of nine groups of farm products sold and the value of farm products used by the farm operator and members of his family were obtained separately and farms were classified by type on the basis of the group of farm products having the largest value. The value of the group of farm products sold which determined the type of farm could have represented as low as 12 percent of the total value of all farm products sold.
1930 and 1950 to 1964-The basis of the classification of farms by type for 1930 differed· significantly from the classification used for subsequent censuses. In 1930, the value of farm products used by the farm operator and members of his family was added to the value of all farm products sold to provide a total as a basis for determining type of farm. Farms with sales from a single specified product or group of products equal to 40 percent or more of the total value of farm products sold and used by farm operators' families were classified as type of farm indicated by the source.
The classification of farms in Hawaii and Alaska have been made on essentially the same basis as for
Field crops
All farm other than Vegetables fruits and products sold sold
Type of f3rm vegetables sold
1964 1959 1964 1959 1964 1959
Total, all commercial farms ••••••...•..••..•.• 100.0 100.0 100.0 100.0 100.0 100.0
Cash grain •..•...•.••••.•••. 16.0 15.0 36.7 35.5 2.0· 2.7 Tobacco ....••••...••.....•.. 3.3 3.0 8.2 7.6 0.4 0.4 Cotton ..•..•••••••..•••••... 7.1 8.3 18.3 22.5 2.3 3.5 Other field crops ..••••••••• 3.7 2.7 9.5 7.2. 3.1 3.4
Vegct3.ble •.....•••••••.•••.• 2.5 2.2 0.8 0. 7 74.1 71.6 Fruit and nut .•••.••••.••••. 4.7 4.5 0.3 0.3 2.4 2.4 Poultry .•••••..•.•••...•••.• 8.5 6.8 0.6 0.6 0.5 0.6 Dair-J ...•........•.•••.••... 15.6 15.7 3 ·'f 3.5 1.7 2.1.
Livestock fo.rms other than paul try, dairy, and livestock ranches •••••..••• 24.1 27.4 9.4 10.9 1.6 2.8
Livestock ranches •• , ••.•••.. 4.1 4.8 0.3 0.4 0.1 0.2 Gen0rsl ..•.•.•.••••••••.•..• 7.6 7.0 12.5 10.7 11.2 9.4 Miscellaneous .••.....••.•••• 2.8 2.5 0.1 0.1 0.5 0.6
1 Less thrm 0.05 percent.
964
Fruits
the conterminous United States. For a detailed description of the classification of farms in Hawaii and Alaska for the 1940 through the 1959 censuses, reference should be made to pages 1252 and 1253 of chapter XII of volume II of the reports for the 1959 Census of Agriculture:
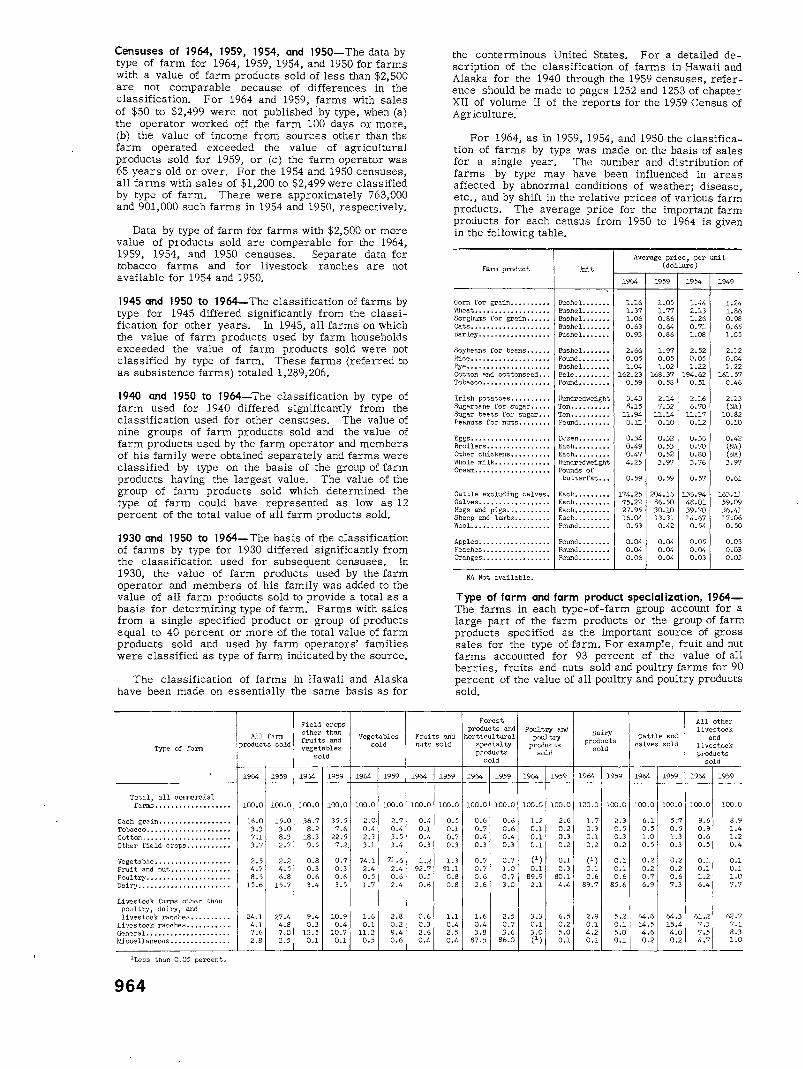
For 1964, as in 1959, 1954, and 1950 the classification of farms by type was made on the basis of sales for a single year. The number and distribution of farms by type may have been influenced in areas affected by abnormal conditions of weather; disease, etc., and by shift in the relative prices of various farm products. The average price for the important farm products for each census from 1950 to 1964 is given in the following table.
Farm product Unit
Com for grain ••... , •••• Bushel ••••••• Wheat ••• , •••.•••..•••• ,. Bushel ••.•••• Sorghwns for grain •••.•• Bushel •.••••• Oats .••••...••••.•.••.•• Bushel •..•••• Barley •••.•••••.•.•••..• Bushel •••••••
So~' beans for beans •• , ••• Bushel ••••••• Rice ••.•.••••.•••••.•••• Po\Uld ••••.••• Rye •••••••..••.....••••• Bushel ••••••• Cotton and cottonseed •• , Bale .•••••.•. Tobacco •••...•.•.•• , •••• Po\Uld ••••.•••
Irish potatoes, ••...•••• Hundredweight Sugarcane for sugar ••••• Ton •.•.•••••• Sugar beets for sugar ••• Ton ••.••••••• Peanuts Cor nuts •.•••••• Pound .•••••••
Eggs .................... D~'zen ••.••••. Broilers ••...•..•.• , ..•• Each., ••.•••• other chickens, ••..•• , •• Each ••.•••••• Whole milk ••.•.•.••••••• Hundredweight Cream ..•.••••.•••..••••• Pounds of
butterfat •.•
Cattle excluding calves. Each •.••••.•. Calves .•••.....•••••• , •• Each ••••••••• Hogs and pigs •••••••••.• Each •••..•.•• Sheep and lambs ••••••••• Each ..•.••••• Wool .•.•.•••••.••••••••• Pound ••••.•••
Apples •••••••.••.•••.••• Pound •••••••• Peaches •. ,., •.••••• , •••• Pound •••••••• Oranges .••••..•••••••••• Pound ••••••••
NA Not available.
Average price, per unit (dollars)
1964 1959 1954 1949
1.16 1.05 1.44 1.24 1.37 1.77 2.13 1.86 1.06 0.86 1.26 0.98 0.63 0.64 0.71 0.65 0.93 0,86 1.08 1.05
2.66 1.97 2.52 2.12 0.05 0.05 0.05 0.04 1.04 1.02 1.22 1.22
162.23 168.37 194.62 161.57 o. 59 o. 58 0.51 0.46
3.43 2.14 2.16 2.13 8.15 7.32 6.70 (NA)
11.94 11.14 11.17 10.82 0.11 0.10 0.12 0.10
0.34 0.32 0.36 0.42 0.49 0.53 0.70 (NA) 0.47 0.52 0.80 (NA) 4.25 3.97 3.76 3.97
0.59 0.59 0.57 0,61
174.25 204.16 136.94 163.11 75.22 86.50 48.01 59.09 27.95 30.10 39.70 36.41 16.04 13.31 14.67 17.06 0.53 0.42 0.54 0.50
0.04 0.04 0.05 0.03 0.04 0.04 0.04 0.03 0.06 0.04 0.03 0.03
Type of farm and farm product specialization, 1964-The farms in each type-of-farm group account for a large part of the farm products or the group of farm products specified as the important source of gross sales for the type of farm. For example, fruit and nut farms accounted for 93 percent of the value of all berries, fruits and nuts sold and poultry farms for 90 percent of the value of all poultry and poultry products sold.
Forest All other products and Poultry and livestock
and horticultural poultry Dalry Cattle and and products nuts sold specialty products calves sold livestock sold products sold products
sold sold
1964 1959 1964 1959 1964 1959 1964 1959 1964 1959 1964 1959
100.0 100.0 100.0 100.0 100.0 100.0 100.0 100.0 100.0 100.0 100.0 100.0
0.4 0.5 0.6 0.6 1.2 2.6 1.7 2.3 6.1 5.7 9.6 8.9 0.1 0.1 0.7 0.6 0.1 0.2 0.3 0.5 0.5 0.5 0.9 1.4 0.4 0.7 0.4 0.4 0.1 0.3 0.1 0.3 1.0 1.3 0.6 1.2 0.3 0.3 0.3 0.3 0.1 0.2 0.2 0.2 0.5 0.3 0.5 0.4
1.2 1.3 0.7 0.7 (') 0.1 (') 0.1 0.2 0.2 0.1 0.1 92.7 91.1 0.7 1.0 0.1 0.3 0.1 0.1 0.2 0.2 0.1 0.1 0.5 0.8 0.6 0.7 89.9 80.1 0.6 0.6 0.7 0.6 1.2 1.0 0.6 0.8 2.6 3.0 2.1 4.4 89.7 85.6 6.9 7.3 6.4 7.7
0.6 1.1 1.6 2.5 3.3 6.5 2.9 5.2 64.6 64.3 61.2 62.7 0.3 0.4 0.4 0.7 0.1 0.2 0.1 0.1 14.5 15.4 7.3 7.1 2.6 2.5 3.8 3.6 3.0 5.0 4.2 5.0 4.6 1 •• o 7.5 8.3 0.4 0.4 87.5 86.0 (') 0.1 0.1 0.1 0.2 0.2 4.7 1.0
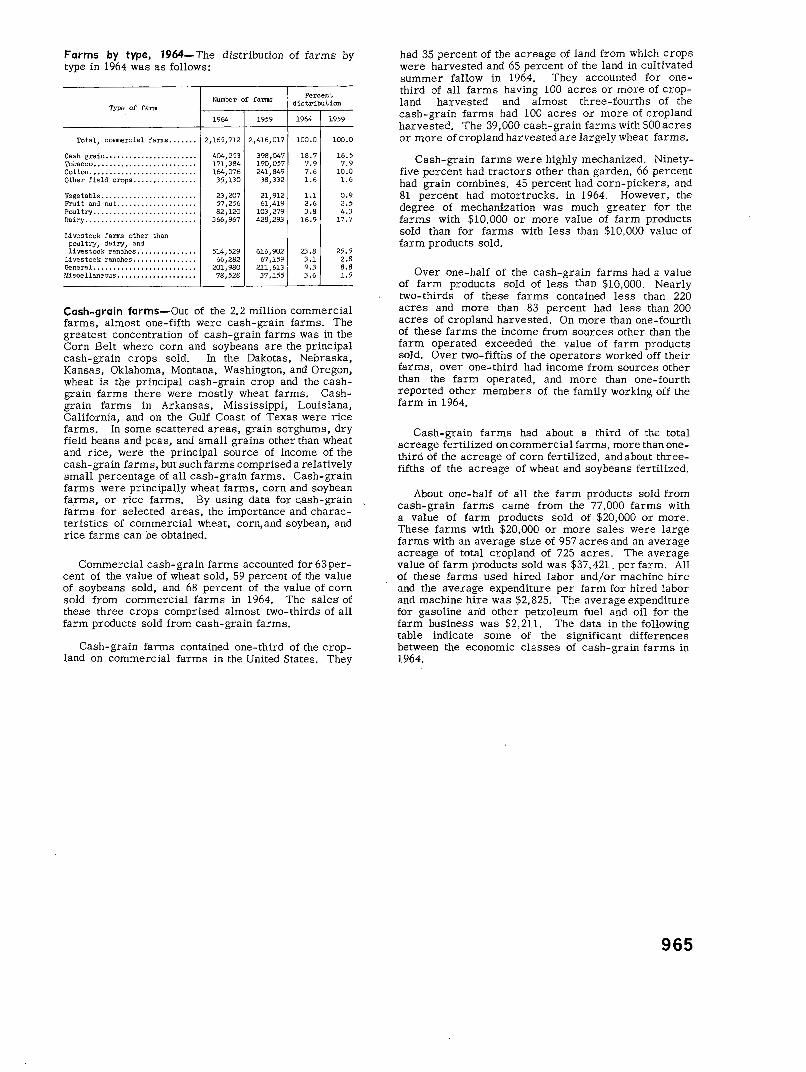
Farms by type, 1964-The distribution of farms by type in 1964 was as follows:
Number of farms Percent
Type of farm distribution
1964 1959 1964 1959
Total, commercial farms ....... 2,165,712 2,416,017 100.0 100.0
Cash grain ....................... 404,253 398,047 18.7 16.5 Tobacco •.•.•.•.•..........••.•.•• 171,384 190,057 7.9 7.9 Cotton., .................... , .... 164,076 241,849 7.6 10.0 Other field crops ................ 35,130 38,332 1.6 1.6
Vegetable ........................ 23,207 21,912 1.1 0.9 Fruit and nut .................... 57,256 61,419 2.6 2.5 Poultry .......................... 82,120 103,279 3.8 4.3 Dairy ............................ 366,967 428,293 16.9 17.7
Livestock farms other than poultry, dairy, and livestock ranches . .............. 514,529 616,902 23.8 25.5
Livestock ranches ................ 66,282 67,159 3.1 2.8 General .......................... 201,980 211,613 9.3 8.8 Miscellaneous .. .................. 78,528 37,155 3.6 1.5
Cash-grain farms-Out of the 2.2 million commercial farms, almost one-fifth were cash-grain farms. The greatest concentration of cash-grain farms was in the Corn Belt where corn and soybeans are the principal cash-grain crops sold. In the Dakotas, Nebraska, Kansas, Oklahoma, Montana, Washington, and Oregon, wheat is the principal cash-grain crop and the cashgrain farms there were mostly wheat farms. Cashgrain farms in Arkansas, Mississippi, Louisiana, California, and on the Gulf Coast of Texas were rice farms. In some scattered areas, grain sorghums, dry field beans and peas, and small grains other than wheat and rice, were the principal source of income of the cash-grain farms, but such farms comprised a relatively small percentage of all cash-grain farms. Cash-grain farms were principally wheat farms, corn and soybean farms, or rice farms. By using data for c.ash-grain farms for selected areas, the importance and characteristics of commercial wheat, corn,and soybean, and rice farms can be obtained.
Commercial cash-grain farms accounted for 63percent of the value of wheat sold, 59 percent of the value of soybeans sold, and 68 percent of the value of corn sold from commercial farms in 1964. The sales· of these three crops comprised almost two-thirds of all farm products sold from cash-grain farms.
Cash-grain farms contained one-third of the cropland on commercial farms in the United States. They
had 35 percent of the acreage of land from which crops were harvested and 65 percent of the land in cultivated summer fallow in 1964. They accounted for onethird of all farms having 100 acres or more of cropland harvested and almost three-fourths of the cash-grain farms had 100 acres or more of cropland harvested. The 39,000 cash-grain farmswithSOOacres or more of cropland harvested are largely wheat farms.
Cash-grain farms were highly mechanized. Ninetyfive percent had tractors other than garden, 66 percent had grain combines, 45 percent had corn-pickers, and 81 percent had motortrucks, in 1964. However, the degree of mechanization was much greater for the farms with $10,000 or more value of farm products sold than for farms with less than $10,000 value of farm products sold.
Over one-half of the cash-grain farms had a value of farm products sold of less than $10,000. Nearly two-thirds of these farms contained less than 220 acres and moi"e than 83 percent had less than 200 acres of cropland harvested. On more than one-fourth of these farms the income from sources other than the farm operated exceeded the value of farm products sold. Over two-fifths of the operators worked off their farms, over one-third had income from sources other than the farm operated, and more than one-fourth reported other members of the family working off the farm in 1964.
Cash-grain farms had about a third of the total acreage fertilized on commercial farms, more than onethird of the acreage of corn fertilized, and about threefifths of the acreage of wheat and soybeans fertilized.
About one-half of all the farm products sold from cash-grain farms came from the 77,000 farms with a value of farm products sold of $20,000 or more. These farms with $20,000 or more sales were large farms with an average size of 957 acres and an average acreage of total cropland of 725 acres. The average value of farm products sold was $37,421 _ per farm. All of these farms used hired labor andjor machine hire and the average expenditure per farm for hired labor and machine hire was $2,825. The average expenditure for gasoline arid other petroleum fuel and oil for the farm business was $2,211. The data in the following table indicate some of the significant differences between the economic classes of cash-grain farms in 1964.
965
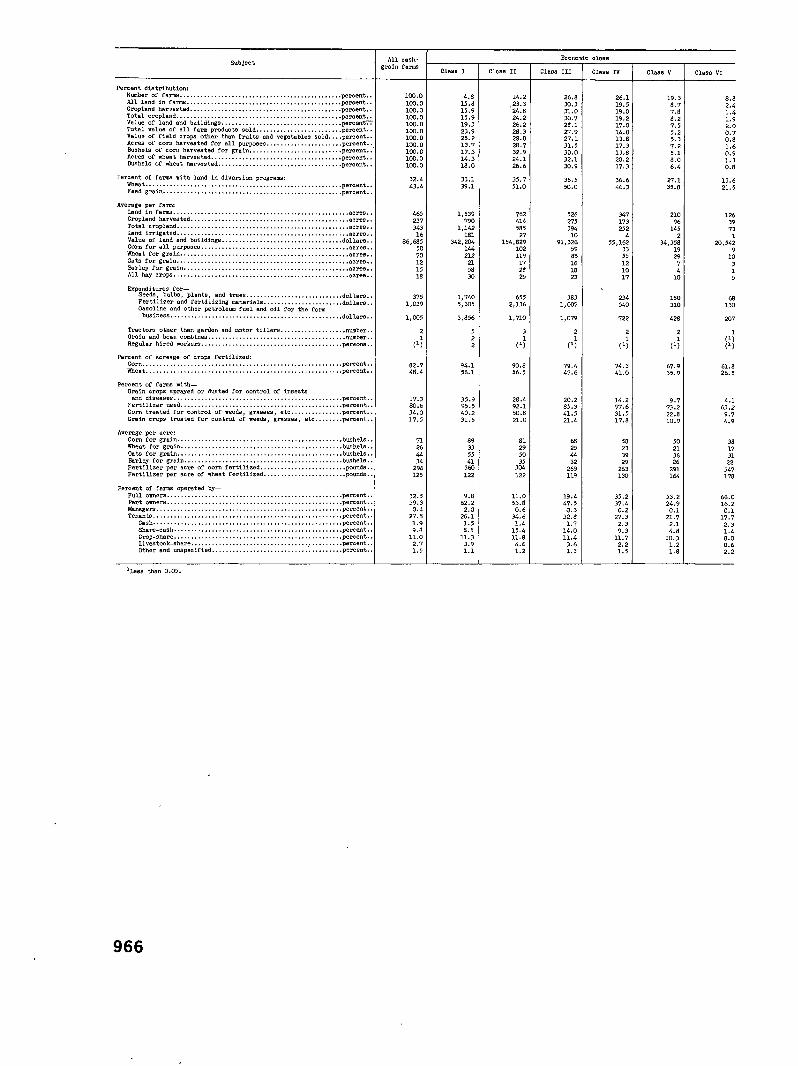
Subject
Percent distribution: Number o!' farms •................ ,,, .... , ........ ,., .... ,, •.•.. percent., All land in farms ................. ,,., .... , ...... , ......... , •• percent .. Cropland harvested •.... , .•......••......•............... ,,, ..• percent •.
~~i~! ~~r!~~d;~d · b~iidi~~: ::::::::::::::::::::::::::::::::: :~~=~~ Total value of all farm products sold ..... , ... ,,.,,,,., .... ,, .percent .. Value of field crops other than fruits and vegetables sold .... percent •. Acres of con1 harvested for ell purposes •. , .. ,,.,,, .••.. ,,, ... percent .. Bushels of corn harvested for grain •......... , ... , .. ,,,,, ....• percen-t; •. ' Acres of wheat harvested.,, ...... , .... ,.,.,,, ... ,.,., ... ,.,, •• percent .. Bushels of 1'1heat harvested ....... , ............ , .•....... , .. , .. percent •.
Percent of fa:rms with land in dlveraion p;:oogrwns: Wheat ..............................•..........•....... , •...••. percent •• Feed grain ......•..•...•........ ,., ......... , ............... , .percent.,
Average per form: Land in !'arms •...................•....• , ... , .....••.. , ....••.• , .acres .. Cropland harvested •.......••....•.•...................... , .•.•.. acres •• Total crople:1d .........•...•............•....... , . ,, .. , , ....•. , .acres •. Land irrlgeted .••...............•......... , .......•. , .•..... , ... acres .• Value of land and buildings ..•.... , ••...... , ......• , •.. ,, ... , .dollars •. Corn for ell purposes ........... ,, ... , ......... , ............ , .•• acres •. Wheat for grain .. , .••......•.......• ,,,, •.... ,, ... , .. , ......•.•. acres., Oats !'or grain ••...• , ...........•.... , .•..•.. , .......• ,,,, ..•... acres .• Barley for grain ••...•.....•.. , .•.•. , ••.• , ..•...... ,,,., .•.••••. acres •. All hey crops ..•.• , , , , .•. , .•. , • , , .•••..••••...• , . , ... , , . , .....• , acres ..
Expenditures for-Seeds, bulbs, plants, and trees .•....•..•....••••..•..•.•.. dollers •• Fertilizer and fertilizing materiels ..•... , .... , ...... , •.•. dollars •• Gasoline and other petroleum fuel end oil !'or the fo.:rm
business ....... , .. , .• , •••. , ...•.. , .. , ..•.........•. , .•.... dollars.,
Tractors other then garden and motor tillers •....•. ,.,, .. , ... , .nU!llber .. Grain and bean combines ..................•.............. , ....•• number .. Regular hired workers ....•............................••... ,, .persona •.
Percent of acreage or crops fertilized: Corn .. , ........... , ...•......... , .... , .........•.........•...• per<lent .. Wheat •.......................................................• percent •.
Percent of farms with-Grain crops sprayed or dusted for control of insects
and diseases ................................. , ............•.. percent .. Fertiliz.:!r used ...............•......••........• , ....••.. , ...• percent., Corn treated for control of weeds, grasses, etc ............ , .. percent •. Grein crops treated for control of weeds, grasses, etc .......• percent ..
Average per acre: Corn for grain ...................•.............•. , ....• , ...... bushels .• Wheat for grain ..................... , .............• , .••....... bushels., Oats for grain .•.........................•.•. , ...•..... , .••.•• bushels •• Barley for grain .................• , .•. , ...•...•••..•.. , ....... bushels .. Fertilizer per acre or corn fertilized., •... , ••...........•.•.• pounds .• Fertilizer per acre of wheat fert.Uized •......................• pounds ..
Percent of fe.l'IIIS operated by-Full owners ................•... , •..•..•.•....•....•.•.••.•.•.. percent •. Pert owners .............•••......•••••.•.•.................... percent ..
~:~~::::::::::::::::::::::::::::::::::::::::::::::::::::::~=~~~:: Cash· .•..........•........................................• percent .. Share-cash· · ............................•...•.............. percent. • Crop-share •• , ..•..•...•.............................• , ..... percent. , Livestock-share .......•..••................•..... _. ........• percent .. Other and unspecified ..•..•...... , •• , ..........• , ........•. percent ..
lr.ess thnn 0.05.
966
All cashgrain farms
100.0 100.0 100.0 100.0 100.0 100.0 100.0 1::>0.0 100.0 100.0 100.0
32.4 43.4
465 237 343 16
86,685 50 70 12 15 18
375 1,039
2 1
(')
82.7 48.4
17-3 80.6 34.0 17.5
71 26 44 34
296 125
32.5 39.3 0.4
27.8 1.9 9.8
11.0 2.7 1.5
Class I
4.8 15.8 15.9 15.9 19.3 23.9 25.2 13.? 17.3 14.3 18.0
33.1 39.1
1,539 790
1,142 181
342,204 144 212
21 58 30
1,?40 5,305
3,856
94.1 56.1
35.9 95.5 40.2 31.5
89 33 55 41
360 122
9.8 62.2 2.0
26.1 1.5 8.8
11.3 3.9 1.1
Clo.ss II
14.2 23.3 24.8 24.2 26.2 28.3 28.0 28.7 32.9 24.1 26.6
35.7 51.0
762 414 585
27 154,829
102 119
17 28 25
655 2,136
1,?10
3 1
(')
90.8 56.5
28.4 92.1 50.8 21.0
81 29 50 35
304 122
11.0 53.8 0.6
34.6 1.4
15.4 11.8 4.6 1.2
Econo:nic clsee:
Class III Close IV Close V Closs VI
26.8 26.1 19.3 8.8 30.3 19.5 8.7 2.4 31.0 19.0 7.8 1.4 30.7 19.2 8.2 1.9 28.1 1?.0 7.5 2.0 27.9 14.0 5.2 0.7 27.1 13.8 5.3 0.8 31.5 17.3 7.2 1.6 30.0 1J.8 5.1 0.9 32.1 20.2 8.0 1.3 30.9 1?.3 6.4 0.8
36.5 36.6 27.1 13.6 50.0 46.3 35.8 21.5
526 347 210 126 275 173 96 39 394 252 145 73 10 4 2 1
91,326 55,162 34,358 20,542 59 33 19 9 85 55 29 10 16 12 7 18 10 4 23 17 10
383 234 150 68 1,007 540 310 130
1,0?9 722 428 207
2 2 2 1 1 1 1 (')
(') (') (') (')
?9.4 ?4.3 6?.9 61.8 47.6 41.0 35.9 26.5
20.2 14.2 9.7 4.1 85.3 77.6 ?3.2 63.2 41.5 31.5 22.8 9.7 21.4 17.8 10.9 4.9
68 58 50 38 25 23 21 17 44 39 36 31 32 29 26 22
269 263 291 347 119 130 164 178
19.4 35.2 53.2 66.0 47.5 37.4 24.9 16.2 0.3 0.2 0.1 0.1
32.8 27.3 21.7 1?.7 1.7 2.3 2.1 2.3
14.0 9.3 4.8 1.4 11.4 11.? 10.3 8.0 3.6 2.2 1.2 0.6 1.3 1.5 1.8 2.2
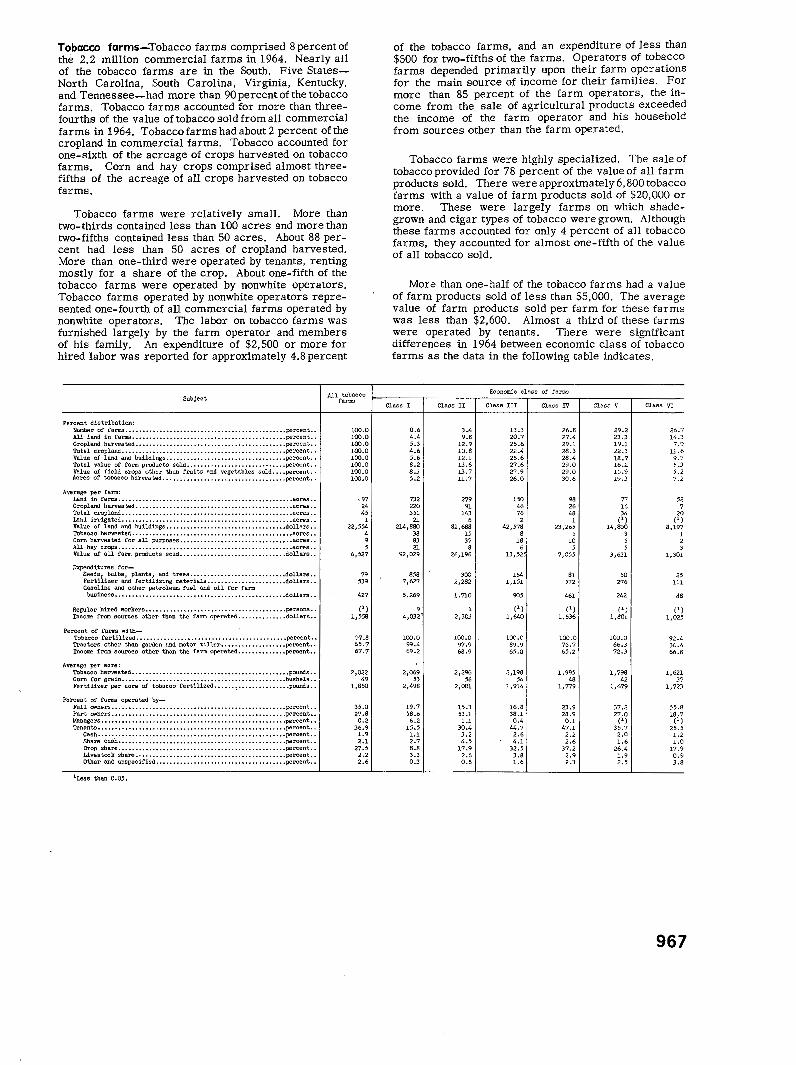
Tobacco farms-Tobacco farms comprised 8 percent of the 2.2 million commercial farms in 1964. Nearly all of the tobacco farms are in the South. Five StatesNorth Carolina, South Carolina, Virginia, Kentucky, and Tennessee-had more than 90 percent of the tobacco farms. Tobacco farms accounted for more than threefourths of the value of tobacco sold from all commercial farms in 1964. Tobacco farms had about 2 percent of the cropland in commercial farms. Tobacco accounted for one-sixth of the acreage of crops harvested on tobacco farms. Corn and hay crops comprised almost threefifths of the acreage of all crops harvested on tobacco farms.
Tobacco farms were relatively small. More than two-thirds contained less than 100 acres and more than two-fifths contained less than 50 acres. About 88 percent had less than 50 acres of cropland harvested. More than one-third were operated by tenants, renting mostly for a share of the crop. About one-fifth of the tobacco farms were operated by nonwhite operators. Tobacco farms operated by nonwhite operators represented one-fourth of all commercial farms operated by nonwhite operators. The labor on tobacco farms was furnished largely by the farm operator and members of his family. An expenditure of $2,500 or more for hired labor was reported for approximately 4.8 percent
Subject All tobacco
farms
Percent distribution: Number of farms •••••••••.••••••••••••••••••••••••••••••••••••• percent •• All land in farms ••••••.•••.•••.•••.••..••.•••.••..••..••...•. percent •. Cropland harvested, • , ••. , ••.•• , ••...•..••.•••..••.•••..•••.••. percent .. Total cropland, ..•.••••.•..••• , , , • , ••..•••.••..••.•••• , • , . , •• , percent .• Ve.lue of land and buildings, •.•••.•••••••.••.•.••..•..•••..•.• percent .. Total value of farm products sold, .•.. , •. , ••...••.•• , .•••.•. , .percent •. Value of field crops other than fruits and vegetables sold •••• percent •• Aores of t.obaoeo harvested •• , •.••.•....•..••••••..•••••••.••.• percent ..
Average per farm: Land in farms •.••..••..••.••.•••••••..•...••.••..•••..••.••••••• acres .• Cropland harvested •••••••.•••.••••••...••.•••••••....••......•.• acres •• Total cropland ••. ,,,,, ••••••.•••.•••••••• ••••••• ••••..•..••.•••• acres •• Land irrigated •.••.•..••••••• , •• ,, ••.....•••..•... ,, .•• , •• ,,, ••• acres •• Value of land and buildings.,, •• , .••..••..•..••..••..••.•••..• dollars •• Tobacco harvested. , •••.•..•••.••..••.• , , , •••.••.••...•••••...•.. acres •• Corn harvested for all purposes •. , ••.••••••••.•. , ..•..••..•.•••. acres •• All hay crops •.• , •.• , •••..•....••.•• ,., •.•••.••..••..•...•.•••. ,acres •• Value of all farm products sold •. , ••••••.•••.•..••.•.••....... dollars •.
Expenditures for-Seeds, bulbs, plants, and trees ••••..••.••...••.••..•..••.. dollars .• Fertilizer and fertilizing materials •.••..•••..•..••..••..• dollars .. Gasoline and other petroleum fuel and oil for farm business •. , ••••• , ••••••• , .••• , •••••..•••.•••.•••.••..••.•• dollars ••
Regular hired workers •••••• ,,.,., ••..•...•...••.•••..•••.•..•• persons .. !ncOJOO from sources other than the farm operated •....•.•...•.• dollars ••
Percent of farms with-Tobacco fertilized ••...•..•••.••.••••.••..••.•....••. ,., ..••.• percent •• Tractors other than garden and motor 'tiller., •••. , •••.•••••••• percent •. Income from sources other than the farm operated ••• , •••• ,, •• , .percent.,
Average per acre: Tobacco harvested ••••••• , ••.••••.•• ,, ••• , ••• , •• , ••••••••.•.•••. pounds •. Corn for grain .••••••••.••••...••••••.•••••••..•.• , •• ,, •..••.• bushels •• Fertilizer per acre of tobacco fertilized, •••.. ~., .••.••.••.••• pounds ••
Percent of farms operated by-Full owners ••••••••••••••••••• , ••••••••••••••••••••••••••••••• percent .. Part owners. , • , , ••••• , , , •••.••.••..••• , •••••• , ..••.••••••..••. percent ... Managers •••••• , ••• ,, •• , ••••••••••••••• , •••• , •• , ••••••••••••••• percent •• Tenants, ••• , , •• , •••••• , , •••.••.•••• , •• , .•...•.••••...•.•••... , percent. ,
Cash •••• , •••••••••••••• ,., •••• ,, •••••••••••••••••••••• , •••• percent •• Share cash ••••.••••••••.• ,, •• ,, ••• , •• ,, •• , ••••.••.• , ••••• , .percent •• Crop share •••••••• , ••••••••••• , •••••••••••••••••••••• ,,, ••• percent •• Livestock share •••••••••••••••••••••••••••••••••••••••••••• percent .• Other and unspecified •••••••••••••••.••••.•••• , .••..•••.••• percent .•
1Less than 0.05,
100.0 100.0 100.0 100.0 100.0 100.0 100.0 100.0
-97 24 45
1 22,554
4 9 5
6,527
79 539
427
(') 1,558
97.8 65.7 67.7
2,022 49
1,850
35.0 27.8 0.2
36.9 1.9 2.1
27.5 2.2 2.6
of the tobacco farms, and an expenditure of less than $500 for two-fifths of the farms. Operators of tobacco farms depended primarily upon their farm operations for the main source of income for their families. For more than 85 percent of the farm operators, the income from the sale of agricultural products exceeded the income of the farm operator and his household from sources other than the farm operated.
Tobacco farms were highly specialized. The sale of tobacco provided for 78 percent of the value of all farm products sold. There were approximately 6, 800 tobacco farms with a value of farm products sold of $20,000 or more. These were largely farms on which shadegrown and cigar types of tobacco were grown. Although these farms accounted for only 4 percent of all tobacco farms, they accounted for almost one-fifth of the value of all tobacco sold.
More: than one-half of the tobacco farms had a value of farm products sold of less than $5,000. The average value of farm products sold per farm for these farms was less than $2,600. Almost a third of these farms were operated by tenants. There were significant differences in 1964 between economic class of tobacco farms as the data in the following table indicates.
Class I
0.6 4.4 5.3 4.6 5.6 8.2 8.3 5.2
732 220 351
21 214,880
38 83 21
92,029
858 7,62?
5,269
4,032
100.0 99.4 69.2
2,069 53
2,498
19.7 58.6 6.2
15.5 l.l 2.7 8.8 3.3 0.3
Class II
3.4 9.8
12.9 10.8 12.1 13.6 13.7 11.?
279 91
143 6
81,688 15 37
8 26,196
300 2,282
1.710
2,30J
100.0 9?.9 68.9
2,296 56
2,001
15.3 53.1 1.1
30.4 3.2 4.5
1?.9 2.6 0.6
Economic class of farms
Class III
13.) 20.? 25.6 22.4 25.6 27.6 27.9 26.0
150 46 76
2 42,5?8
8 18
6 13,52
154 1,151
905
(l) 1,640
100.0 89.9 65.0
2,198 54
1,914
16.8 38.1 0.4
44.7 2.6 4.1
32.5 3.8 1.6
Class IV
26.8 2?.4 29.1 28.3 28.4 29.0 29.0 30.6
98 26 48
1 23,265
5 10
5 ?,055
81 572
461
(') 1,636
100.0 76.7 65.2
1,995 48
1,779
23.9 28.9 0.1
4?.1 2.2 2.6
3?.2 2.9 2.3
Class V
29.2 23.3 19.1 22.3 18.7 16.2 15.9 19.3
77 16
'" (') 14,850
3 5 5
3,631
50 276
242
(') 1,801
100.0 66.3 72.3
1,?98 42
1,679
37.2 27.0
(l) 35.7 2.0 1.6
26.4 1.9 2.5
Class VI
26.7 14.3 7.9
11.6 9.7 5.3 5.2 7.2
52 7
20 (')
8,197 1 2
1,301
25 lll
88
(') 1,025
92.L. 36.4 66.8
1,621 37
1,723
55.8 18.7 (l)
25.5 1.2 1.0
17.9 0.9 3.8
967
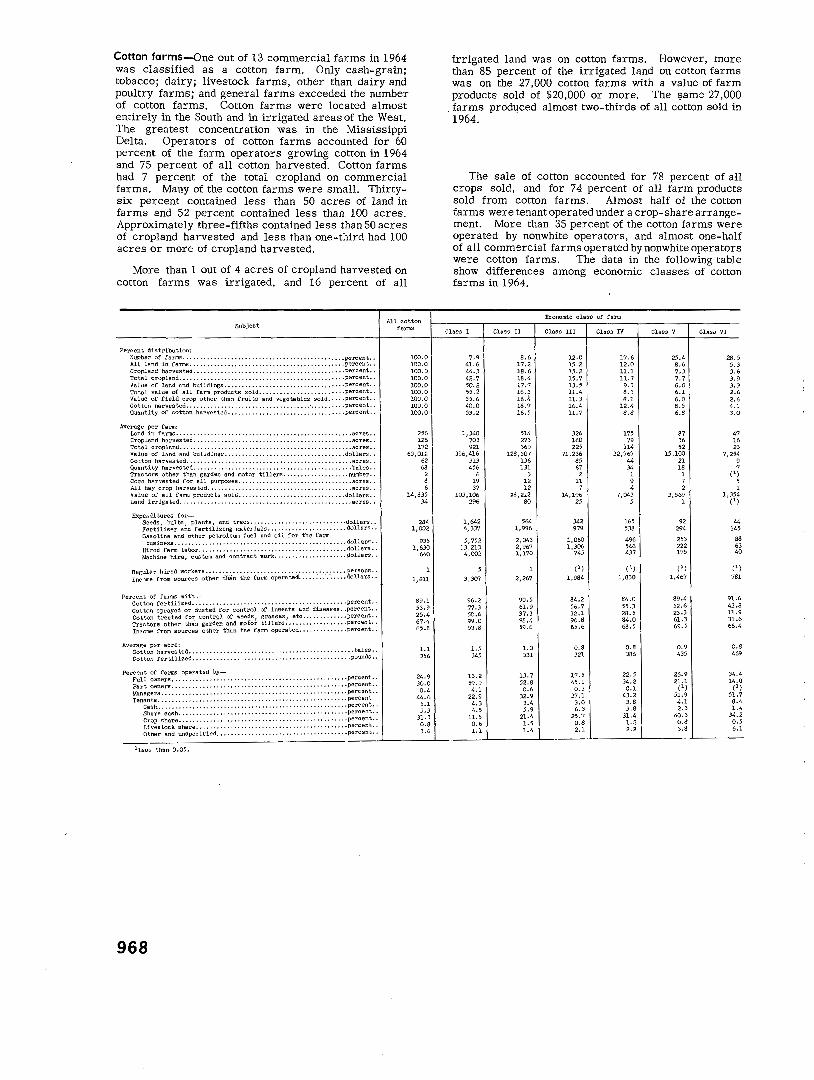
Cotton farms-One out of 13 commercial farms in 1964 was classified as a cotton farm. Only cash-grain; tobacco; dairy; livestock farms, other than dairy and poultry farms; and general farms exceeded the number of cotton farms. Cotton farms were located almost entirely in the South and in irrigated areas of the West. The greatest concentration was in the Mississippi Delta. Operators of cotton farms accounted for 60 percent of the farm operators growing cotton in 1964 and 75 percent of all cotton harvested. Cotton farms had 7 percent of the total cropland on commercial farms. Many of the cotton farms were small. Thirtysix percent contained less than 50 acres of land in farms and 52 percent contained less than 100 acres. Approximately three-fifths contained less than 50 acres of cropland harvested and less than one-third had 100 acres or more of cropland harvested.
More than 1 out of 4 acres of cropland harvested on cotton farms was irrigated, and 16 percent of all
Subject All cotton
farms
Percent distribution: Nu.'!lber of fanns .................................•............• percent .. All land in fa:rm.s .......................•..................... percent .. Cropland harvested ............ , ......... ,., .......... , ....•... percent .. Total cropland ............ , .. , ....•.. , .. , ...... , ...........•.. percent .. Value of land and buildings .............................. , .... percent .• Total value of all fen:n products sold.,,,, .. , .. , ........ ,, .... percent •. Value of field crop other tha::-~ fruits and vegetables sold ..... percent.· Cotton harvested ...................... ,., ....... , ... · ..... , .... percent... Q-.Jantity of cotton harvested ........ , ............. , ...... , .... percent .. ,
Average per farm: Land in farm.s •...•.•.•.....•.....•.•....•.•.....•••............. acres •• Cropland harvested ............. , ............................ , .. , acres .. Total cropland ....... , ..................................... , .... acres .. Value o!' land and buildings ............ , .. , ................... dollars., Cotton harvested .................................. , ............. acres .. Quantity hervested .......................................... , ... bales .. Tractors other than garden and motor tillers ................... number .. Corn her;rested for ell purposes ................................. acres .. All hay crop harvested., ...•... ,, ...•... , .•... , .•......•........ acres .. Value of all farm products sold ............................... dollars .. Land irrigated ............................ , ..................... acres ..
Expend! tures for-
~=:~~ii~:b:~/i:~~ii:~~t:~:~i~i~:::::::::::::::::::::: :~~ii~~-- ·. Gasoline and other petroleum fuel and oil for the farm
business,. , , .... , .... , .................................... dollBrs .. Hired farm labor ................•..................... ''•!'dollars .. Machine hire, custom and contract work .........•.. : ........ pollars. ·
Regu.l£1'1"' hired workers .•••.. ~ .............................. · ~ ...• _,persoflS .. Income from sources other ihiin the farm operated .. ·. • · · ......• dollars··
Percent or fanns with-Cotton fertilized ...........•..................... ·.·· ....... :percent.· Cotton sprayed or dusted for control of insects end diseases .. percent .. Cotton treated for control of .weeds! grasses, etc ............• percent .. Tractors other th8:-t- garden and motor t'illers ........ · ·· ....... percent.· Income from sources other than the farm operated .•.. ··· ....... percent. •
Average per acre: Cotton harvested .................................. · ...........•. bales .. Cot ton fertilized •.........•........................ · · · ..... · · · po'Jl1ds · ·
Percent of fBrms operated by-Full o7tllers •................................•.........•....... percent .. Part owners.,,,,, .. , .. ,.,, ...................•................ percent ..
::::~~~~:::::::::::::::::::::::::::::::::::::::::::::: ::::: :::~:~:~i·. Cash., ... ,, .. , ... , ... , ..................................... percent .. Share cash ....... , ......................................... percent ..
~~~~s~~~e;h~~~::::: :::::::::::::::::::::::::::::::::::::: :~=~=~;:: Other and unspecified., .......................... · ......•.. percent.·
lLess than 0.05.
968
100.0 100.0 100.0 100.0 100.0 100.0 100.0 100.0 100.0
256 126 172
63,012 62 68
2 8 6
14,835 34
284 1,002
935 1,630
640
1,611
89.1 53.9 25.4 6?.4 65.8
1.1 356
24.9 JO.O 0.4
1.4.6 5.1 3.3
31.3 0.8 3.6
irrigated land was on cotton farms. However, more than 85 percent of the irrigated land on cotton farms was on the 27,000 cotton farms with a value of farm products sold of $20,000 or more. The .;;arne 27,000 farms produced almost two- thirds of all cotton sold in 1964.
The sale of cotton accounted for 78 percent of all crops sold, and for 74 percent of all farm products sold from cotton farms. Almost half of the cotton farms were tenant operated under a crop-share arrangement. More than 35 percent of the cotton farms were operated by nonwhite operators, and almost one-half of all commercial farms operated by nonwhite operators were cotton farms. The data in the following table show differences among economic classes of cotton farms in 1964.
Economic class of farm
Class I Class II Class III Class IV Class V Class VI
7.9 8.6 12.0 17.6 2.5.4 28.5 41.6 17.2 15.2 12.0 8.6 5.3 44.3 18.6 1.5.2 11.1 7.3 3.6 42.7 18.4 15.7 11.7 7.7 3.9 50.2 17.7 13.5 9.3 6.0 3.3 55.2 16. J 11.4 8.3 6.1 2.6 55.6 16.4 11.3 8.1 6.0 2.6 40.0 18.7 16.4 12.4 8.5 4.1 53.2 16.5 11.7 8.8 6.8 3.0
1,340 514 326 175 87 47 703 273 160 79 36 16 921 369 225 114 52 23
396,416 128,507 71,236 32,?67 1.5,100 7,254 313 136 85 44 21 9 456 131 67 34 18 7
6 3 2 1 1 (1) 19 12 11 9 7 5 37 12 7 4 2 1
103,106 28' 212 296 80
14,196 7,043 25 5
3,569 1,354 1 (')
1,642 564 342 165 92 44 6,337 1,996 979 538 294 145
5,752 2,043 13,213 2,967
4,002 1,170
1,060 496 1,306 546
745 437
253 88 222 63 175 40
(1) (1) (1) (1)
3,3r:t7 2,267 1,984 1,830 1,467 ?81
96.2 90.5 84.2 84.0 89.4 91.6
71.3 61.9 50.6 37.3 99.0 98.4 53.8 59.6
56.7 55.3 32.1 28.5 96.8 84.0 65.6 68.5
52.6 43.8 23.3 11.9 61.3 31.6 69.5 66.4
1.5 1.0 0.8 0.8 0.9 0.8 345 331 321 386 435 469
13.2 13.7 59.9 52.8 4.1 0.6
17.5 22.5 45.1 34.2 0.3 0.1
26.9 J4.4 21.1 14.0
(1) (l)
22.9 32.9 4.3 3.4 4.5 5.9
11.5 21.4 0.6 1.5 1.1 1.4
3?.1 43.2 3.0 3.8 6.3 3.8
25.7 31.4 0.8 1.2 2.1 2.2
51.9 51.7 4.1 8.4 2.3 1.4
40.3 34.2 0.8 0.5 3.8 6.1
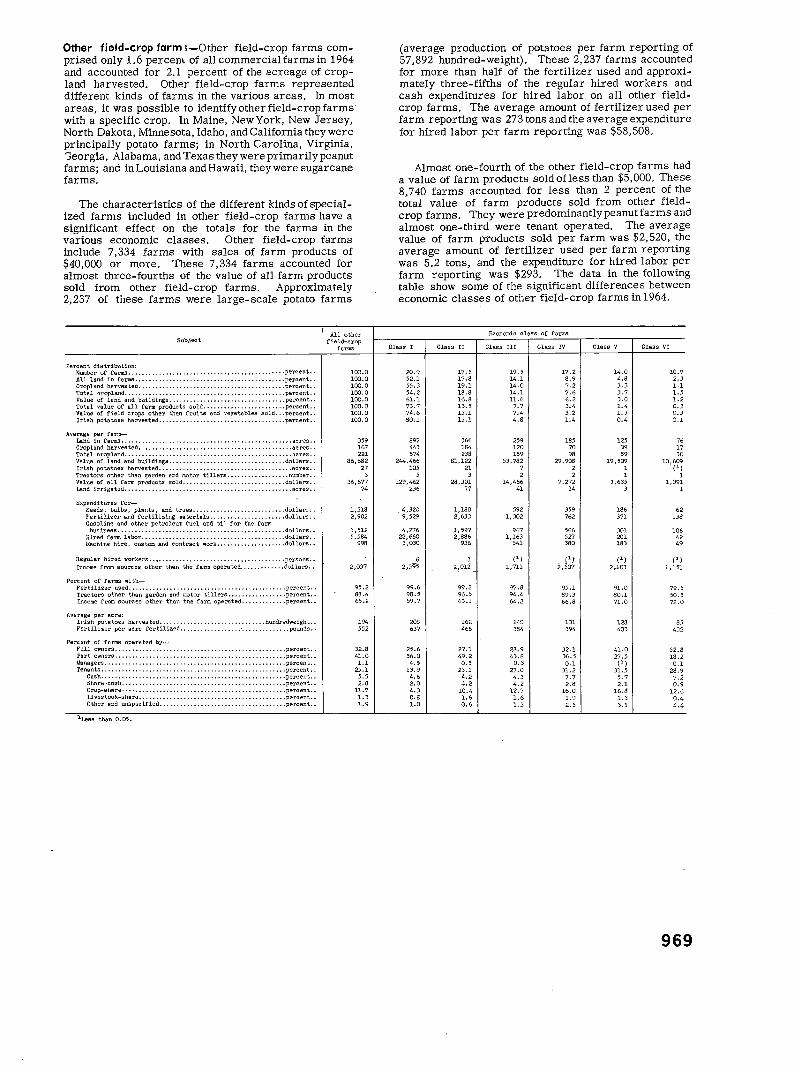
Other field-crop farm ;-Other field-crop farms comprised only 1.6 percem of all commercialfarms in 1964 and accounted for 2.1 percent of the acreage of cropland harvested. Other field-crop farms represented different kinds of farms in the various areas. In most areas, it was possible to identify other field-crop farms· with a specific crop. In Maine, NewYork, New Jersey, North Dakota, Minnesota, Idaho, and California they were principally potato farms; in North Carolina, Virginia, 'Jeorgia, Alabama, and Texas they were primarily peanut farms; and in Louisiana and Hawaii, they were sugarcane farms.
The characteristics of the different kinds of specialized farms included in other field-crop farms have a significant effect on the totals for the farms in the various economic classes. Other field-crop farms include 7,334 farms with sales of farm products of $40,000 or more. These 7,334 farms accounted for almost three-fourths of the value of all farm products sold from other field-crop farms. Approximately 2,237 of these farms were large-scale potato farms
Subject
Percent distribution: Number of farms ..................................... , ........ percent .. All land in farms ........................... , ..•............. percent .. Cropland har·,res ted ..............................•......... , .. percent .. Total cropland .... , . , ........................................ percent .. Value of land and buildings ..... , ...... , ................. ,., .percent .. Total value of all farm products sold ........................ percent .. Value of field crops other than fruits and vegetables sold .. ·'Percent .. Irish potatoes harvested ..................................... percent ..
Average per farm-Land in farms •.... , ...... , .. , .................................. acres •. Cropland harvested •.............. ,, ............................ acres .. Total cropland .................................•.........•..... acres .. Value of land and buildings .......... , ....................... dollars .. Irish potatoes harvested ........ , ..............•............... acres .. Tractors other than garden and motor tillers .................. number .. Value of all farm products sold, ............................. dollars .. Land irrigated ........•....•....•...... , •.•....•...•........... acres ..
Expenditures for-Seeds, bulbs, plants, and trees .......•..•.............•.. dollars .. Fertilizer and fertilizing materials ...•.................. dollars .. Gasoline and other petroleu.11 Cuel and oi 1 for the farm
business ........•............. , ..............•........... dollars .• Hired farm labor ...•...................................... dollars .. Machine hire, custom and contract w.:>rk .................... dollal'S ..
Regular hired workers .••..•........... , ........ ,., ...•... ,., .persons .. Income from sources other than the farm operated ............. dollars ..
Percent of farms with-Fertilizer used ... , .....•............................•....... percent .. Tractors other than garden and motor tillers ................. percent .. Income from sources other ·than the farm operated ............. percent ..
Average per acre: Irish potatoes harvested ................•.............. hundredweight .. Fertilizer per acre fertilized .................. ·. , ... , ........ pounds ..
Percent of farms operated by-Full owners .. , ...•........... , ............................... percent .. Part owners ............•..................................... percent .. Managers ..•......•.........................•................. percent .. Tenants ...................................................... percent ..
Cash ..........•.........................•................. percent .. Share-co.sh, ............................................... percent .. Crop-share ................................ , ............... percent .. Li vestook-share ........................................... percent .. Other and unspecified ..................................... peroent ..
1.Less than 0.05.
All other field-crop
fa nos
100.0 100.0 100.0 100.0 100.0 100.0 100.0 100.0
359 167 221
86,682 2?
3 36,677
74
1,318 2,902
1,512 5,584
998
2,03?
95.2 88 ,1,
65.2
194 552
32.8 41.0 1.1
25.1 5. 5 2.6
11.7 1.3 1.9
(average production of potatoes per farm reporting of 57,892 hundred-weight). These 2,237 farms accounted for more than half of the fertilizer used and approximately three-fifths of the regular hired workers and cash expenditures for hired labor on ali other fieldcrop farms. The average amount of fertilizer used per farm reporting was 273 tons and the average expenditure for hired labor per farm reporting was $58,508.
Almost one-fourth of the other field-crop farms had a value of farm products sold ofless than $5,000. These 8,740 farms accounted for less than 2 percent of the total value of farm products sold from other fieldcrop farms. They were predominantly peanut farms and almost one-third were tenant operated. The average value of farm products sold per farm was $2,520, the average amount of fertilizer used per farm reporting was 5.2 tons, and the expenditure for hired labor per farm reporting was $293. The data in the following table show some of the significant differences between economic classes of other field-crop farms in 1964.
Econo:nic class of far.ns
Class I Class II Class III Class IT Class V Class VI
20.9 17.5 19.5 17.2 14.0 10.9 52.1 1?.8 14.1 8.9 4.8 2.3 55.3 19.1 14.0 7.2 3.3 1.1 54.2 18.8 14.1 ?.6 3.7 1.5 61.1 16.8 11.6 6.2 3.0 1.2 73.7 13.5 7.7 3.4 1.4 0.3 74.6 13.1 ?.4 3.2 1.3 0.3 SO.l 13.1 4.8 1.4 0.4 0.1
897 366 259 185 125 76 443 184 120 70 39 17 574 238 159 98 59 30
244,466 81,122 53,782 29,908 19,509 10,609 105 21 7 2 1 (')
5 3 2 2 1 1 129,462 28,301 14,466 ?,'2:72 3,635 1,091
236 71 41 14 3 1
. 4,320 1,180 592 359 186 62 9,529 2,633 1,302 762 371 138
4,276 1,597 967 566 301 106 22,660 2,886 1,163 52? 201 42 3,030 936 541 380 183 49
6 (') C'! (') (') 2,395 2,012 1,711 2,507 2,103 1,151
99.6 99.2 9?.8 95.1 91.0 79.5 98.5 96.5 94.4 89.3 80.1 50.5 59.? 63.1 64.2 66.8 71.0 72.0
205 162 140 131 12$ 65 637 466 384 394 403 432
25.6 27.1 23.9 32.1 41.0 52.8 56.0 49.2 43.8 36.5 2?.5 18.2 4.5 0.5 0.3 0.1 (') 0.1
13.9 23.1 27.0 31.2 31.5 28.9 4.6 4.2 4.3 ?.? 5.7 '7.2 2.0 4.2 4.2 2.8 2.1 0.9 4.3 10.4 12.7 16.0 16.8 12.6 0.8 1.6 1.6 1.9 1.3 0.4 1.0 0.6 1.3 2.5 3.1 4.4
969
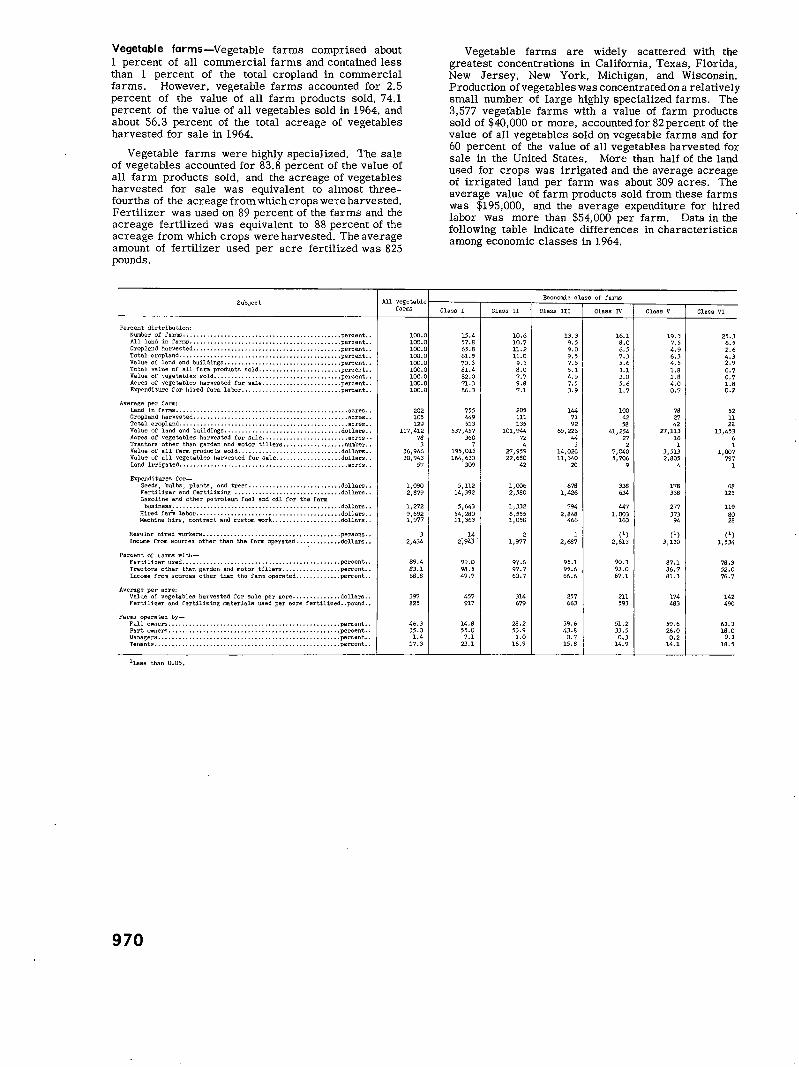
Vegetable farms-Vegetable farms comprised about 1 percent of all commercial farms and contained less than 1 percent of the total cropland in commercial farms. However, vegetable farms accounted for 2.5 percent of the value of all farm products sold, 74.1 percent of the value of all vegetables sold in 1964, and about 56.3 percent of the total acreage of vegetables harvested for sale in 1964.
Vegetable farms were highly specialized. The sale of vegetables accounted for 83.8 percent of the value of all farm products sold, and the acreage of vegetables harvested for sale was equivalent to almost threefourths of the acreage from which crops were harvested. Fertilizer was used on 89 percent of the farms and the acreage fertilized was equivalent to 88 percent of the acreage from which crops were harvested. The average amount of fertilizer used per acre fertilized was 825 pounds.
Subject All vegetable
Perce.nt distr lbution: Number of farms .•...••.•••••••••••••••• , •••.•.•• , ...•.••• , ••• percent •• All land in farms •••••.••••••• , •...••••••••••••••• , ••• ,,., ••. percQnt •• Cropla..,d :.Srvested ....................... , ................•.. percent •• Tote.l cropland .................. ,, ....• , ........ ,, .. ,, ...•... percent •. Value of la:1.d and buildings .••..•.•••...•••• , ••• ,, ••• , .•.•.•• percent •• Total value of all ('arm products sold .... , .. , .......... , ..... percent .. Value of vegetables sold ......... , ....... , ........ ,, ........• percent .. Acres o!' vegetables harveoted for sale ..•....•......... , ...•. percent .. Expenditure fo:;- hired farm labor ......... , ................... percent ..
Average per farm: Land in farms ................................•................. acres .. Cropland harvested ............................................. acres .• Total cropland ............•..........• , .......................• acres .. Value of land end buildings, ....... , ......................... dollars .. Acres of vegetables harvested for sale ......................... acres .. Tractors other than garden and motor tillers ............... , .. number .. Value of all fann products sold .............................. dollars .. Value of all vegetables harvested for sale ................... dollars .. Lend irrigated .......................................... , ... , .. acres •.
Expend! tures for-Seeds, bulbs, pla..'lts, and treeo ........................... dollars .. Fertilizer and fertilizing ............................... dollars .. Gasoline e.'"'d other petroleum fuel and oil for the farm
business .......•......•.......•........•................. dollars .. iiired farin labor ....•.....••......•..................••.•. doljars .. Machine hire, contract and custom work ......•.......•....• dollars •.
Ree\llar hired ,.-orlters •...........•.....•...•...•...........•. perso:~s .• Income from soUl'(les other than the farm operated ............. dollars. o
Percent or Lanna witli-Fertilizer used ..................•...........•.•............. percent .. Tractors o~her than garden a..'ld motor tillers ................. percent •• Income from so~rces other then the farm operated .......•....• peroent •.
Average per acre: Val1le of vegetables harvested for sale per acre ......•...•••. dollars .. Fertilizer and fertilizing materials used per acre fertiliz.ad .. pound ..
Farms operated by-Full owners ..........•................. ·o ... o. o .••........... percent •. Part 019'Ilers ................................. o •.•............. percent .. Me.. "''agers ..•...........•...................................... percent •. Tenants .................................................... , .percent ..
lr.eas than 0.05.
970
farms
100.0 100.0 100.0 100.0 100.0 100.0 100.0 100.0 100.0
202 105 129
11? ,412 78
3 36,946 30,943
57
1,090 2,8?9
l,Z72 9,692 1,9?7
3 2,434
89.4 83.1 68.8
397 825
46.3 35.0 1.4
17.3
Vegetable farms are widely scattered with the greatest concentrations in California, Texas, Florida, New Jersey, New York, Michigan, and Wisconsin. Production of vegetables was concentrated on a relatively small number of large highly specialized farms. The 3,577 vegetable farms with a value of farm products sold of $40,000 or more, accounted for 82 percent of the value of all vegetables sold on vegetable farms and for 60 percent of the value of all vegetables harvested for sale in the United States. More than half of the land used for crops was irrigated and the average acreage of irrigated land per farm was about 309 acres. The average value of farm products sold from these farms was $195,000, and the average expenditure for hired labor was more than $54,000 per farm. Data in the following table indicate differences in characteristics among economic classes in l. 964.
Economic class or t'erms
Class I Class II Class III Class IV Class V Class VI
15.4 l0o6 13.3 16.1 19.3 25.3 57.8 10.? 9.5 8.0 7.5 6.5 65.8 11.2 9.0 6.5 4.9 2.6 61.5 noo 9.5 7.3 6.3 4.3 ?0.3 9.3 7.5 1 5.6 4.5 2.9 81.4 8.0 5.1 3.1 LB 0.7 82.0 7.7 4.9 3.0 1.8 0.7 71.3 9.8 7.5 5.6 4.0 1.8 86.3 7.1 3.9 1.7 0.7 0.2
755 205 144 100 78 52 449 Ill 71 42 2:/ 11 513 135 92 58 42 22
537,457 101,944 65,226 41,25.4 27,113 13,453 360 ?2 44 2:/ 16 6
7 4 3 2 1 l 195,015 164,630
27,959 14,026 7,040 3, 513 1,007 22,680 11,340 5,706 2,805 797
309 42 20 9 4 1
5,112 1,006 6?8 3JS 178 68 14,392 2,580 1,426 634 338 125
5,643 1,332 794 447 2:/7 119 54,280 6,555 2,848 1,003 373 80 11,363 1,058 466 163 94 28
14 2~943-
1 (l) (l) (') 1,977 2,687 2,613 3,110 1,534
99.0 9'1.6 95.1 90o3 87.1 ?8.3 98.5 97.7 95.6 93.0 86o? 52o0 49.? 60o7 66o6 67.1 81.3 ?6.7
457 314 257 211 174 142 917 679 663 593 483 490
14.8 28.2 39.6 51.2 59.6 63.3 55.0 53.9 43.8 33.5 26.0 18.0 7.1 1.0 0.7 0.3 0.2 0.1
23.1 16.9 15.8 14.9 14.1 18.5
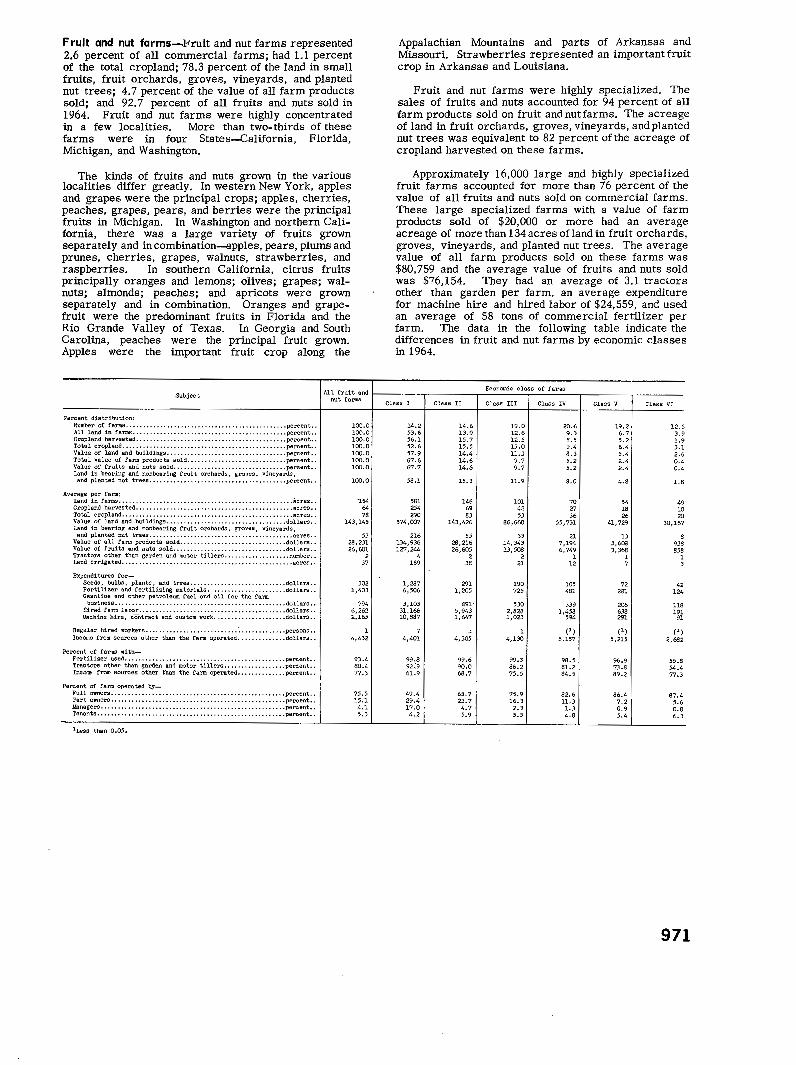
Fruit and nut farms-I:<·ruit and nut farms represented 2.6 percent of all commercial farms; had 1.1 percent of the total cropland; 78.3 percent of the land in small fruits, fruit orchards, groves, vineyards, and planted nut trees; 4. 7 percent of the value of all farm products sold; and 92.7 percent of all fruits and nuts sold in 1964. Fruit and nut farms were highly concentrated in a few localities. More than two-thirds of these farms were in four States-California, Florida, Michigan, and Washington.
The kinds of fruits and nuts grown in the various localities differ greatly. In western New York, apples and grapes were the principal crops; apples, cherries, peaches, grapes, pears, and berries were the principal fruits in Michigan. In Washington and northern California, there was a large variety of fruits grown separately and in combination-apples, pears, plums and prunes, cherries, grapes, walnuts, strawberries, and raspberries. In southern California, citrus fruits principally oranges and lemons; olives; grapes; walnuts; almonds; peaches; and apricots were grown separately and in combination. Oranges and grapefruit were the predominant fruits in Florida and the Rio Grande Valley of Texas. In Georgia and South Carolina, peaches were the principal fruit grown. Apples were the important fruit crop along the
Subject All rrui t and
Percent distribution: Number or farms . .......................... , ................... percent . . All land in fa:nrw .. , ... , ........ ... , ..... , , , , ..... , . , .. , , .... . percent .. Cropland he.rvested .......................... ................. . percent .. Total cropland .......•..........................•............. percent .. Value of land end buildings. , . , ...... , .. , ............... , , ... , percent •. Total value or fa:m. products sold ............................. percent .. Value o!: fruits end nuts sold ... , ......................... , ... percent .. Land in bearing and nonbearing fruit orche.rds, gro·1es, vineyards,
and planted nut trees ............ , .........•..... , ........... percent ..
Average per farm: Land in farms . ..... , ............ , .. , , ........... , , .... , . , , ... , , . Beres . . Cropland harvested., ..... ,,, ....... ,,, ... ,, .......... , .. ,,, ..... acres., Total cropland .............................................. , ... acres .. Value or land and buildings . ............................... , , . dollars . . Land in bearing and nonbearing fruit orchards, groves, vineyards,
and planted nut trees . .. , , . , . , .......... , .. , , .. , .......... , , , . , acres . . Value or all farm products sold ............................... dollars .. Value or fruits and nuts sold ................................. dollars .. Tractors other than garden &..'ld motor tillers ....... ,.,, .. , ..... number .. Land irrigated ............................................ , .. , .. acres ..
Expenditures for-Seeds, bulbs, plants, a!ld trees • ..••........•.•..•...••..•• dollars . . Fertilizer and fertilizing materials .... , ........ , ... , ..... dollars .. Gasoline and other petroleum ruel and oil ror the rarm
business . ................................................. dollaro . . Hired farm labor ........................................... dollars .. Machine hire, cOntract and custom 11ork ..................... dollars ..
Regular hired workers .• ,, .......... , ............ :, ............ persons .. Income from sources other than the rarm operated . ............. dollars . .
Percent ot tams with-Fertilizer used ..................................... , ....... , .percent .. Tractors other than garden and motor tillers .......•... ,, ... , .percent .. Incooe from sources other than the farm operated .............. percent .•
Percent of farm operated by-Full owners ........................................... , ....... percent .. Part owners .........•............... , .... , .................... percent .. Managers ••..•••••....•..•• , ...• , ••..•......•..••........•. , .•. percent., Tena.'lts • •••••••••••••••.••••••••••.••••••.•.•..••••.•••••••••• percent . .
1tess than 0.05.
nut farms
100.0 100.0 100.0 100.0 100.0 100.0 100.0
100.0
'154 64 78
143,145
53 28,2.31 26,601
2 37
302 1,403
?94 6,262 2,165
4,432
93.4 80.4 77.3
75.5 15.1 4.1 5.3
Appalachian Mountains and parts of Arkansas and Missouri. Strawberries represented an important fruit crop in Arkansas and Louisiana.
Fruit and nut farms were highly specialized. The sales of fruits and nuts accounted for 94 percent of all farm products sold on fruit andnutfarms. The acreage of land in fruit orchards, groves, vineyards, and planted nut trees was equivalent to 82 percent of the acreage of cropland harvested on these farms.
Approximately 16,000 large and highly specialized fruit farms accounted for more than 76 percent of the value of all fruits and nuts sold on commercial farms. These large specialized farms with a value of farm products sold of $20,000 or more had an average acreage of morethanl34acresoflandin fruit orchards, groves, vineyards, and planted nut trees. The average value of all farm products sold on these farms was $80,759 and the average value of fruits and nuts sold was $76,154. They had an average of 3.1 tractors other than garden per farm, an average expenditure for machine hire and hired labor of $24,559, and used an average of 58 tons of commercial fertilizer per farm. The data in the following table indicate the differences in fruit and nut farms by economic classes in 1964.
Economic elass or fan&lS
Class I Class II Class III Class IV Class V Class VI
14.2 14.6 19.0 20.6 19.2 12.5 53.6 13.9 12.6 9.3 6.7 3.9 56.1 15.7 12.5 8.5 5.2 1.9 52.6 15.5 13.0 9.4 6.4 3.1 57.9 14.4 11.3 8.3 5.4 2.6 67.6 14.6 9.7 5.2 2.4 0.4 67.7 14.6 9.7 5.2 2.4 0.4
58.1 15.3 11.9 8.0 4.8 1.8
581 146 101 70 54 49 2S4 69 42 "ZI 18 10 290 83 53 36 26 20
571.,007 143,426 86,668 55,731 41,729 30,167
216 55 33 21 13 8 134,936 127,244
28,216 14,343 7,194 3,608 9.38 26,605 13,508 6,749 3,368 ass
4 2 2 1 1 1 169 .38 21 12 7 3
1,287 291 190 105 72 42 6,506 1,205 725 481 281 124
3,103 891· 530 339 206 118 31.166 10,887
5,943 2,828 1,458 6.38 191 1,647 1,023 594 291 91
4,401 l <'> <'> (1)
4,305 4,130 5.157 5,215 2,682
99.8 92~9
99.6 99.3 98.5 96.9 55.8 90.0 86.2 81.2 73.8 54.4
61.9 68.7 75.5 84.5 89.2 77.3
49.4 65.7 75.9 82.6 86.4 87.4 29.4 23.7 16.3 11.3 7.2 5.6 17.0 4.7 2.3 1.3 0.9 0.8 4.2 5.9 5.5 4.8 5.4 6.3
971
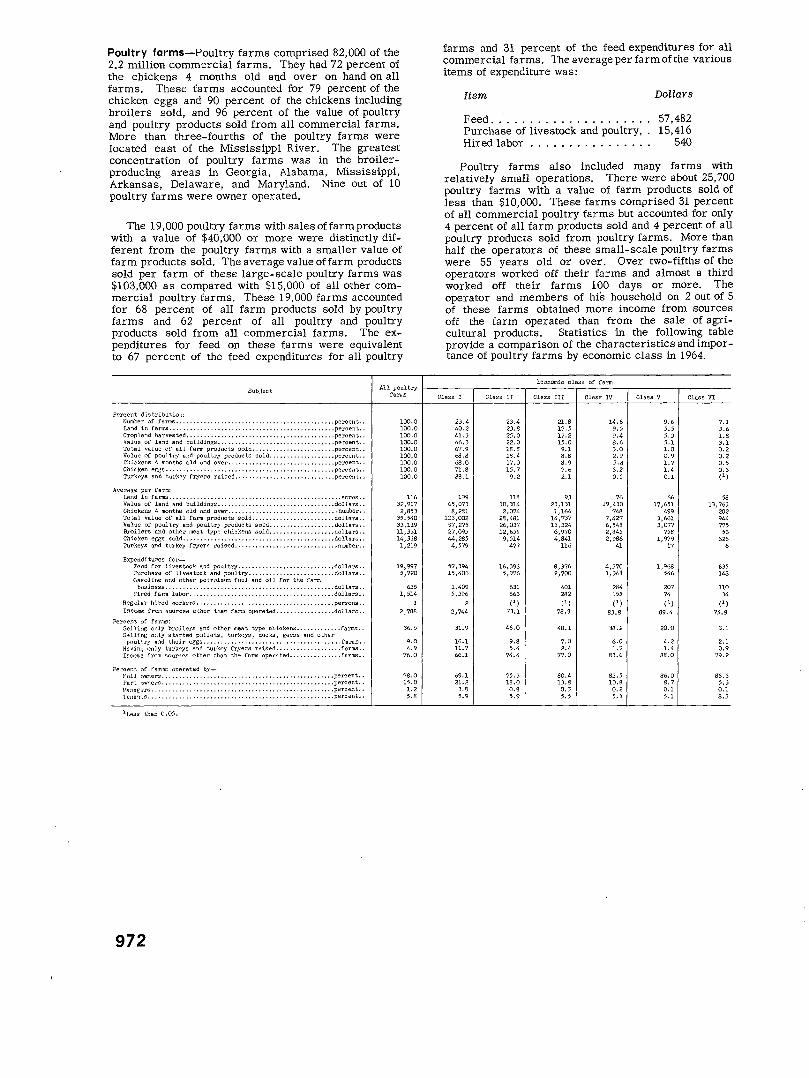
Poultry farms-Poultry farms comprised 82,000 of the 2.2 million commercial farms. They had 72 percent of the chickens 4 months old and over on hand on all farms. These farms accounted for 79 percent of the chicken eggs and 90 percent of the chickens including broilers sold, and 96 percent of the value of poultry and poultry products sold from all commercial farms. More than three-fourths of the poultry farms were located east of the Mississippi River. The greatest concentration of poultry farms was in the broilerproducing areas in Georgia, Alabama, Mississippi, Arkansas, Delaware, and Maryland. Nine out of 10 poultry farms were owner operated.
The 19,000 poultry farms withsalesoffarmproducts with a value of $40,000 or more were distinctly different from the poultry farms with a smaller value of farm products sold. The average value of farm products sold per farm of these large-scale poultry farms was $103,000 as compared with $15,000 of all other commercial poultry farms. These 19,000 farms accounted for 68 percent of all farm products sold by poultry farms and 62 percent of all poultry and poultry products sold from all commercial farms. The expenditures for feed on these farms were equivalent to 67 percent of the feed expenditures for all poultry
farms and 31 percent of the feed expenditures for all commercial farms. Theaverageperfarmofthe various items of expenditure was:
Item
Feed ................... . Purchase of livestock and poultry, Hired labor . . . ..... .
Dollars
57,482 15,416
540
Poultry farms also included many farms with relatively small operations. There were about 25,700 poultry farms with a value of farm products sold of less than $10,000. These farms comprised 31 percent of all commercial poultry farms but accounted for only 4 percent of all farm products sold and 4 percent of all poultry products sold from poultry farms. More than half the operators of these small-scale poultry farms were 55 years old or over. Over two-fifths of the operators worked off their farms and almost a third worked off their farms 100 days or more. The operator and members of his household on 2 out of 5 of these farms obtained more income from sources off the farm operated than from the sale of agricultural products. Statistics in the following table provide a comparison of the characteristics and importance of poultry farms by economic class in 1964.
Economic class of farm
Subject All poultry f------,-----,-----,-----,-----,----fa""'
Percent distribution: Number of fanns •.....•.••....•••...•••..•.... ,, .•••.. , .•..•.• percent .. L>:l:~d in farms ................................................ percent .. Cropla'ld harvested ........... , .. , ........... ,., ... , .. ,, ... , .. percent .. Value of la:~d and buildings .............................. ,., .peNent .. Total value of all fann products sold .............•........ , .percent .. Value of poultry end poultry products sold., ................. percent .. Chl~kens 4 months old end O'!er.,,.,,,,,,.,.,, ................ percent .. Chicken eggs ............................. , ..... , ... , ......... percent .. Turkeys and turkey frye!'$ raised ........ , .................... percent ..
Average per farr.~: Land ln farms ................................ , ................. acres .. Value of land and buildings ••......••••.....•••..•....•. , .•. ,dollars •• Chickens 4 months old o.nd O'ler .......................... ,,,, .. number .. To~al value of all farm products sold •. , .... , ...... , ......... dollars .. Value of poultry and poultr; products sold ............... , ... dollars, . Broilers and other meat type chi~kens sold ••....•• , .••.•.••.• dollars •• Chickqn eggs sold ..•.................................. , ..... ,dollars,. Turkeys a.'1d turkey fryers rais.:-d .............................. number ..
Expenditures for-Feed for livestock and poultry .. ,, .. , ....... , ........ ,., .. dollars., Purchase o1: livestock and poultry •...•••...•••.•.•••••.••. dollars •• Gasoline and other petroleum fuel !l!ld oil for ~he fann
business ..... , .... , .....• , ...... , .•............. , ........ dollars .. Hired farm labor •............ , ............................ dollars ..
Ree:ular hired workers ................................. , ...•.. persons .. Income from aources other than farm operated ...•• -.-.--, .... ,, ..• dollars ..
Percent of farms: Selling only broilers and other meat type chickens ............. farms .. Selling o.1ly started p'-lllets, turkeys, ducks, geese and other poultry n::1d their eggs ..............•......................... farms ..
Hoving only turk'9yS a!ld turkey frJers raised ................... farlll$,. Income fro'l'l sources other tha!l the fenn opecated ............... farms ..
Pe~ent of t'arma operated by-Full owners. , ... , .. , ......... , ...... , ......................• percent .. Part oVl'lers ... , ....... , .......... , .......... , ................ percent .. ll.!'l!1aeer:> .................................... , ................ percent .. Tena'1 ts ...............•.............•........................ percent •.
lLess tha;J 0.05.
972
lJO.O 100.0 100.0 100.0 100.0 100.0 EXJ.O 100.0 100.0
116 32,917
2,853 J5,540 33,119 11,3Jl 14,338 1,219
19,997 5,720
635 1,514
1 2,?88--
36.5
9.0 4.9
76.0
78.0 15.0 1.2 5.8
Class I Class II
23.4 23.4 40.2 2J.8 41.3 25.0 46.3 22.0 67.9 18.8 68.8 18.4 68.0 17.0 71.8 15.? 38.1 9.2
H9 118 65,073 30,314 8,281 2,074
l:)J,002 213,481 97,275 26,037 27,095 12,655 44,285 9,514 4,579 477
57,394 16,396 15,406 5,376
1,409 631 5,396 663
2 (1) 2,?t,l, 73.1
31.9 46.0
16.1 9.8 11.7 5.4 66.1 ?4.4
69.1 ?5.3 21.2 18.0
J.B 0.8 5.9 5.9
Class III Class IV Class V Class VI
21.8 14.6 9.6 7.1 1?.5 9.5 5. 5 3.6 17.2 9.4 5. 3 1.8 15.0 8.6 5.1 3.1 9.1 3.0 1.0 0.2 8.8 2.9 0.9 0.2 8.9 J.8 1.7 0.5 7.6 3.2 1.4 0.3 2.1 0.5 0.1 (')
9J 76 66 58 23,131 19,4JO 17,651 13,763 1,164 748 499 202
14,737 7,427 3,661 944 1J,324 6,548 3,07'1 775
6,970 2,845 758 56 4,841 2,986 1,9?9 625
116 41 17 6
8,J76 4,370 1,968 635 2,700 1,J4S 546 148
401 284 207 110 282 155 74 34 (1) (') (1) (1)
78.8 83.8 89.4 ?5.S
48.1 13.2 20.0 3.1
7.0 6.0 4.2 2.1 2.4 1.7 1.4 0.9
7?.0 83.6 88.0 79.2
80.4 83.5 86.0 86.3 13.8 1J.8 8.7 5.3 0.3 0.2 0.1 0.1 5. 5 5.5 5.1 8.3
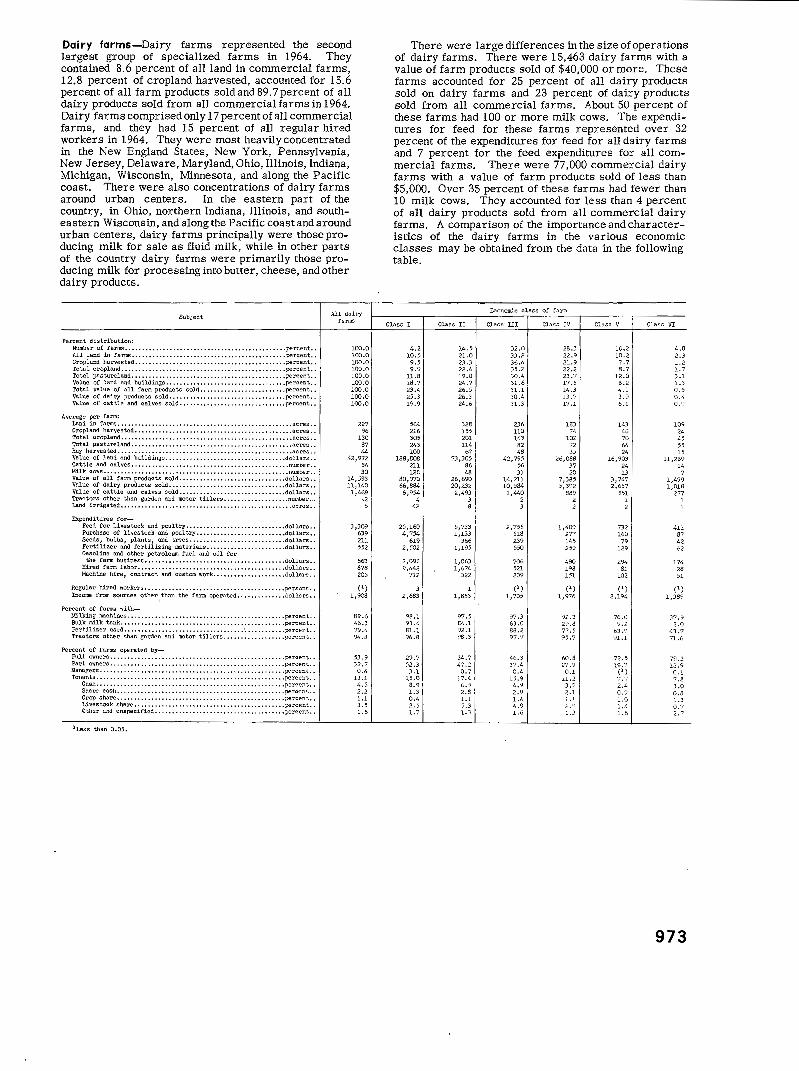
Dairy farms-Dairy farms represented the second largest group of specialized farms in 1964. They contained 8.6 percent of all land in commercial farms, 12.8 percent of cropland harvested, accounted for 15.6 percent of all farm products sold and 89.7 percent of all dairy products sold from all commercial farms in 1964. Dairy farms comprised only 17 percent of all commercial farms, and they had 15 percent of all regular hired workers in 1964. They were most heavily concentrated in the New England States, New York, Pennsylvania, New Jersey, Delaware, Maryland, Ohio, Illinois, Indiana, Michigan, Wisconsin, Minnesota, and along the Pacific coast. There were also concentrations of dairy farms around urban centers. In the eastern part of the country, in Ohio, northern Indiana, Illinois, and southeastern Wisconsin, and along the Pacific coast and around urban centers, dairy farms principally were those producing milk for sale as fluid milk, while in other parts of the country dairy farms were primarily those producing milk for processing into butter, cheese, and other dairy products.
Subject
Percent distribution: Number of fal'IIlS, ••••• ,,, , ••••••••••••••••••••••••••••• , ••••••• percent •• All land in farms ....••. , ... , .••.. , •.. , ••.•••......•.• ,., •.•.. percent .. Cropland harvested ..•.....• ,, .....•...•.. , .. , .•...••...•....•• percent .. Total cropland •...•. , ..•..... , ..•.•.•...•..... , .•... , ••.. , ••.. percent, . Total pasture land .••. , .... ,, •..•....••..•.. , •• ,, ..•..•• , ..••. ,percent •• Value of land and buildings, ....... , •.......••..•..... , ...... ,percent •. Total value of all farm products sold •. , ...•........•. , ..• , ... percent., Value of dairy products sold ...•....•........ , .•• , ..... , •....• percent .. Value of cattle and calves sold .•...••.••......•.........•... ,percent,,
Average pe'I' farm: Land in farms .. , • , ..• , , , . , ..••..••. , , ........•....•. , .•....•... ,acres .• Cropland harvested ..•....... , •....•..••. , .... ,, ..•••.... , .•..... acres .. Total cropland.,, .•. , .. ,,, ......• ,, .•......•...•....•.........•• acres .. Total pasture land .......••. ,., •...•.... ,, .••............ ,, ...... acres .. Hay harvested, ......•..•...• , ....•..•..•.. , .. , .................• acres .. Value of land and buildings., ...•...........••...•.......•.... dollars •. Cattle and calves., ••...•........•. , •...•.....•....•••. , ..... , .number .• Milk cows,., .•... , .• ,, •... , •.. ,,., ..•.••.... , ...••..•.........• number .. Value of all farm products sold .................... , .......... dollars .. Value of dairy products sold ••..• , ... , ..•. , .••..•• , ......•.... dollars .. Value of cattle and calves sold •. , .••.••...•....•..• , ...••...• dollars .. Tractors other than garden and motor tillers ••...•..•••....•..• number.,, Land irrigated, ••............•. , •••.•••..•....•.....•........... acres •.
Expenditures for-Feed for livestock and poultry ••••.•••..••.•••..•...•.•.••• dollars .. Purchase of livestock and poultry .••..••...•.....•.•••.••.• dollars •. Seeds, bulbs, plants, and trecs ..••••.••.•...••••.•••..••.. dollars .. Fertilizer and fertilizing materials •.••••.. , ••••...•...••. dollars .. Gasoline and other petroleum fuel and oil for
the farm business .•.. , ..•••.••••..•..••••..•.•. , ... ,., •.•• dollars,, Hired farm labor .•• , ...••..••.••..••..•••..•...•. , .....••.. dollars .. Machine hire, contract and custom work ...•..• ,, ..•. , .•••..• dollar~ ..
Regular hired workers,., ••...•••...•. , .• , .•••.•••..•.......•.. persons .• Income from sources other than the farm operated ....•...•...•• dollars •.
Percent of farms with-Milking machines .... , .•..•....•••...••..•.......•......••... , . percent .. Bulk milk tank ...•...••....•..•••...•............. , .•...•..... percent .. Fertilizer used •.... , .••...... , •........... , .•...• · ........•.•. percent .. Tractors other than garden and motor tillers ......••••..•..... percent ..
Percent of farms operated by-Full owners •• , ..•..••....•.............. , ..•.............. , ... percent .. Part owners ..••••••••• , •• , •••••• , ••••••••••••.••.••••.••••...• percent .. Managers ...............•.•...•.... , ...•...............••...... p<'rcent. .. Tenants ...... , ..••............•.••.•.......•.......•.......... percent ..
Cash ..•.•....•. , ...... , .........••..• , ....•...............• percent .• Share cash .•. , .•••.•.•. , .•.. , ...•.....•..•.........••...... percent .. Crop share •.........•••.••....•..•...••.•..........•.•.••.. percent, , Livestock share ..•.....••....•.•••••............•. , ........ percent .• Other and unspecified •........•...... , •.................•.. percent ..
lLess than 0.05.
All dairy r'rrns
100.0 100.0 100.0 100.0 100.0 100.0 100.0 100.0 100.0
227 96
130 87 44
1..2,972 54 30
14,593 11,140 1,469
'2 5
3,309 639 211 552
663 878 205
(') 1,908
89.6 46.3 79.4 94,8
2.2 Ll 3.5 L5
There were large differences in the size of operations of dairy farms. There were 15,463 dairy farms with a value of farm products sold of $40,000 or more. These farms accounted for 25 percent of all dairy products sold on dairy farms and 23 percent of dairy products sold from all commercial farms. About 50 percent of these farms had 100 or more milk cows. The expenditures for feed for these farms represented over 32 percent of the expenditures for feed for all dairy farms and 7 percent for the feed expenditures for all commercial farms. There were 77,000 commercial dairy farms with a value of farm products sold of less than $5,000. Over 35 percent of these farms had fewer than 10 milk cows. They accounted for less than 4 percent of all dairy products sold from all commercial dairy farms. A comparison of the importance and characteristics of the dairy farms in the various economic classes may be obtained from the data in the following table.
Class I Class II
4.2 14.5 10.5 21.0 9.5 23.3 9,9 22.4
11.8 19.0 lB.? 21..7 23.4 26.5 25.3 26.3 19.9 24.6
564 328 216 155 305 201 243 114 100 67
188,808 73,30.5 211 86 128 48
80,970 26,690 66,884 20,232
6,954 2,493 4 3
42 8
25,160 5,733 4,754 1,133
619 366 2,502 1,195
2,096 1,063 9,442 1,674
712 322
3 2,683 1,853
98 .l 97.5 93.4 84 .l 81.1 92.1 96.8 98.3
29.7 34.7 52.3' 47.2
3 .l 0.7 15.0 17.4 8.9 6.5 1.3 2.8 0.4 Ll 2.5 5.3 1.7 l.3
Economic class of fnrm
Class III Class IV
32.0 28.3 33.2 22.9 36.4 21.9 35.2 22.2 30.4 23.7 31.6 17.5 31.1 14.3 30.4 13.7 31.3 17.1
236 183 110 74 143 102
82 72 48 35
42,?9.5 .2'6,088 56 37 31 20
14,211 7,385 10,584 5,392 1,440 889
2 2 3 2
2, 755 1,409 518 277 239 145 550 259
706 490 521 198 209 151
(') (l) 1,705 1,976
97.3 92.3 63.0 29.3 88.2 77.5 97.7 95.7
46.3 60.8 37.4 27 .'J 0.4 0.1
15.9 11.2 4.9 3,7 2.9 2.1 L4 Ll 4.9 2." L6 L3
Class V
16.2 10.2 7,7 8.7
12.0 6.2 4,1 3.9 6.1
143 46 70 64 24
16,903 24 13
3, 747 2,657
551 l 2
732 160 79
129
294 81
102
(') 2,194
?6.0 9.2
63.9 91.1
72.5 19.7
~~? 2.4 0,9 LO L4 L6
Cless VI
4,8 2,3 L2 L7 3.1 L3 0.5 0,4 0.9
109 24 45 55 15
11,269 14
7 1,499 1,018
277 l
411 87 42 62
174 28 51
(') 1,389
3?.9 2.0
43.7 71.6
79.2 12.9 0.1 7,8 3.0 0,8 L3 0.7 2,"
973
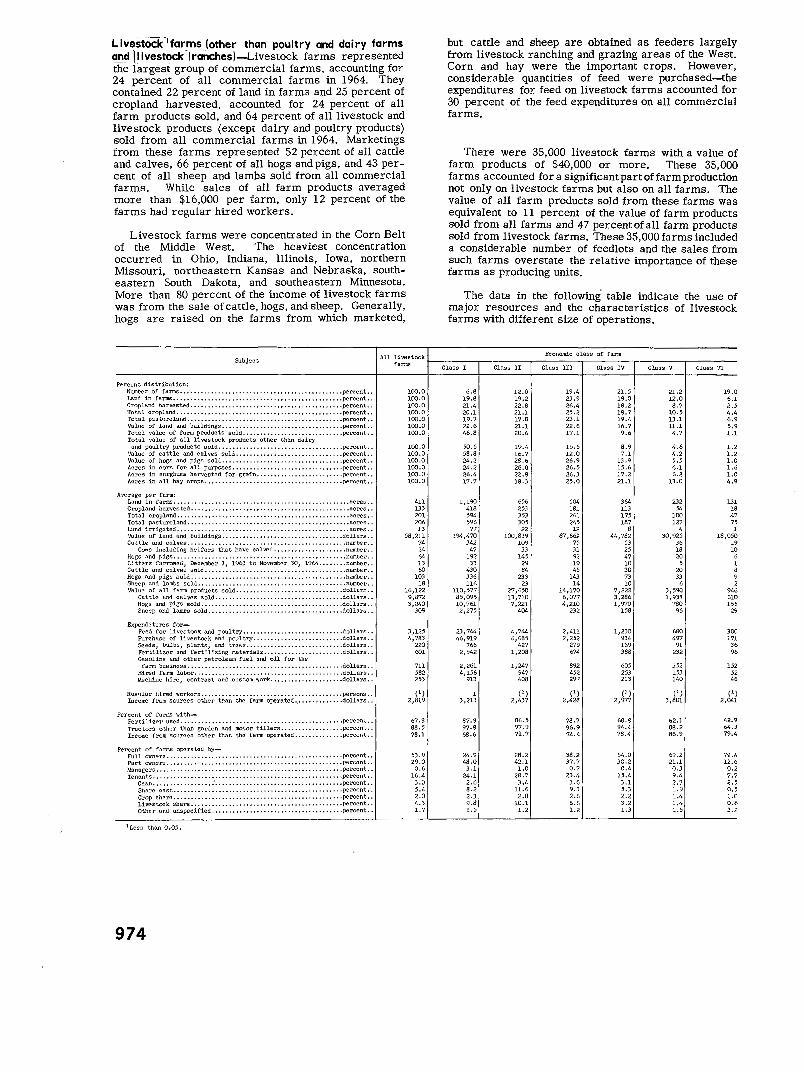
Livestod(lfar_msJother than poultry and dairy farms ~~ IJ~estock /ranches)-Livestock farms represented the largest group of commercial farms, accounting for 24 percent of all commercial farms in 1964. They contained 22 percent of land in farms and 25 percent of cropland harvested, accounted for 24 percent of all farm products sold, and 64 percent of all livestock and livestock products (except dairy and poultry products) sold from all commercial farms in 1964. Marketings from these farms represented 52 percent of all cattle and calves, 66 percent of all hogs and pigs, and 43 percent of all sheep and lambs sold from all commercial farms. While sales of all farm products averaged more than $16,000 per farm, only 12 percent of the farms had regular hired workers.
Livestock farms were concentrated in the Corn Belt of the Middle West. The heaviest concentration occurred in Ohio, Indiana, Illinois, Iowa, northern Missouri, northeastern Kansas and Nebraska, southeastern South Dakota, and southeastern Minnesota. More than 80 percent of the income of livestock farms was from the sale of cattle, hogs, and sheep. Generally, hogs are raised on the farms from which marketed,
Subject All livestock
Percent distribution: Number of farms •••.•••..••.••••••.••••••••••••...•••.••••.•••• percent •• Land in farms •.•••••.•••••••.•••••••••.••••••••.•••.•••••••••• percent •. Cropland harvested .......... , ..•............••.. , .••.... , ..... percent .. Total cropland .......... , ....... ,, ......•.....•......••.....•. percent •. Total IX~Stureland .•••....•.•.•.....•..............••.... , ..•.• percent .. Value of lund and buildings •••••• ,, .•••••.• , , •••••.•• , •••.•••. per<::ent., Total value of farm products sold ....•.....••.... , ............ percent •• Total value of all livestock products other thun dairy
and poultry prcxiucts sold ....••.....•.. , ...•..............•.. percent .. Value of cattle und calves sold ..•.••.•.•..•....•........ , ...• percent .. Value of hogs and piga sold ........•.....••.....••...••.....•. percent .. Acres in corn for all purposes .....•.....••..............•.... percent .. Acres in sorghums harvested for grain .....•...... , •....... , ..• percent., Acres in all hay crops,.,., ... , ................. , .. , .........• percent ..
Average per form: L9.nd in far!llS ..............................•.................•.. ucrec .. Cropland harvested .... , .........................•........•...... acres .. Total cropland .....•......•......• , ........•........ , ........... acres .. Total pastu:relond .............. , ............................•... acres .. Lund irrig(;lted ......•............•.....•........................ acres .. Value of land Bnd buildings .......•................... , , ...... dollars .. Cattle and calves ...... , .. , ... , .• , ..........•..........••...... nwnber ..
Cows including heifers that have calved .............. , ....... nwnber .. Hogs and pigs .........•.•...............•.....................• nwnber .. Litters farrowed, December 1, 196:3 to November JO, 1964 .• u •••• nwnber .. Cattle and calves sold ..••......•..•....................•...... number .. Hogs and pigs sold .......•.....•..........•............ , ....... number .. Sheep and lambs sold .....•...............•.........•........... number .. Value or all farm products sold ... , •..•...........•.......•... dollart:: .•
Cattle and calves sold ..............••.................•... dollars .. Hogs and pigs sold ..•....••.....•. , ...•....•....••.•..•.... dollars., Sheep and lambs sold, .•...............•.•......•....•..•... dollars ..
Expenditures for-Feed for livestock and paul try .•..•••...•..............•... dollars .. Purchase of livestock and poultry .......................... dollars .. Seeds, bulbs, plants, and trees ............................ dollars .. Fertilizer and fertilizing materials ............ , •...•...•. dollars .. Gasoline and other petroleum fuel and oil for the
farm business .•....•.•........•.....•......•....•.... , .... dollars .. Hired farm lo.bor ...•....•.....................•.......•.... dollars .. Machine hire, contract and custom work ..•.................. dollars ..
Ra~ntlar hired workers •...•.......•.........•.................. persons .. Income from sources other than the farm operated., •.....•...... dollars ..
Percent of farms with-Fertilizer used .................•.................•.......•... percent .. Trnctors other than garden Md motor tillers •.....•......•.... percent .. Incorrc from sources other them the farm operated ....•......... percent ..
Percent of farms operated by-Full owners ..•................................................ percent .• Part owners ................................................... percent .. Managers .........................................•.....•..•... percent •. Tenants ........................•...........•..........•.•..... percent •.
Ca5b .... , .......•..•. : . .•.......•...........••....•.......• percent .. Shore cash ..........••......•........... , •...•............. percent .. Crop share ...............................•....•..••.•...... percent •• Livestock share .•........•......•...........•..•.•.....•... percent .. Other ond unspecified .•.. , •••.•..•••..•.......••...•••..... percent ..
1Lesa t.han 0.05.
974
farms
100.0 100.0 100.0 100.0 100.0 100.0 100.0
100.0 100.0 100.0 100.0 100.0 100.0
411 133 201 206 13
58,211 74 24 64 13 60
103 18
16,122 9,8?2 3,040
309
3,125 4,?83
220 601
711 582 253
(') 2,819
67,g 88.5 ?8.1
53.9 29.0 0.6
16.4 3.0 5.4 2.0 4.3 1.7
but cattle and sheep are obtained as feeders largely from livestock ranching and grazing areas of the West. Corn and hay were the important crops. However, considerable quantities of feed were purchased-the expenditures for feed on livestock farms accounted for 30 percent of the feed expenditures on all commercial farms.
There were 35,000 livestock farms with a value of farm products of $40,000 or more. These 35,000 farms accounted for a significant part of farm production not only on livestock farms but also on all farms. The value of all farm products sold from these farms was equivalent to 11 percent of the value of farm products sold from all farms and 47 percentofall farm products sold from livestock farms. These 35,000 farms included a considerable number of feedlots and the sales from such farms overstate the relative importance of these farms as producing units.
The data in the following' table indicate the use of major resources and the characteristics of livestock farms with different size of operations.
Economic class of farm
Class I Class II Class III Class IV Class V Class VI
6.8 12.0 19.4 21.5 21.2 19.0 19.8 19.2 23.9 19.0 12.0 6.1 21.4 22.8 26.4 18.2 8.7 2.5 20.1 21.1 25.2 18.7 10.5 4.4 19.? 1?.8 23.1 19.4 13.1 6.9 22.6 21.1 22.6 16.? 11.1 5.9 46.8 20.6 17.1 9.6 4.7 1.1
50.5 19.4 15.5 8.9 4.6 1.2 58.8 16.? 12.0 7.1 4.2 1.2 24.2 28.6 26.9 13.9 5.5 1.0 24.2 26.0 26.5 15.6 6.1 1.6 26.4 22.8 26.3 1?.2 6.2 1.0 1?.? 18.3 25.0 21.1 13.0 4.9
1,190 656 504 364 232 131 418 253 181 113 54 18 594 353 261 175 100 47 596 305 245 187 127 75 77 22 12 8 4 1
194,470 100,839 6? ,662 44,782 30,925 18,050 342 109 75 53 36 19
47 33 31 25 18 10 192 145 92 47 20 6
33 29 19 10 5 1 430 84 45 30 20 8 336 233 143 73 33 9 116 23 14 10 6 2
110,5?7 27,650 14,170 7,222 3,590 946 85,095 13,710 6,077 3,286 1,9:38 610 10,761 7,221 4,210 1,970 780 155
2,275 404 232 158 96 29
23,744 4,?44 2,411 1,230 680 300 46,919 6,685 2,252 934 497 171
766 427 279 169 91 36 2,542 1,208 674 388 232 96
2,261 1,24? 892 605 352 152 4,156 947 452 253 153 52
913 408 29? 213 140 46
1 (') (') (') (') (') 3,213 2,43? 2,428 2,977 3,801 2,041
8?.9 86.5 ?8.? 68.9 62.1 1.2.9 97.8 9?.9 96.9 91 •. 4 88.2 64.3 68.6 71.7 ?4.4 78.4 86.9 ?9.4
24.9 28.2 38.2 54.0 69.2 79.4 48.0 42.1 37.7 30.2 21.1 1.2.6 3.1 1.0 0.7 0.4 0.3 0.2
24.1 28.7 23.4 15.4 9.4 ?.7 2.6 3.4 3.6 3.1 2.7 2.5 8.2 11.6 9.3 5.3 1.9 0.5 2.3 2.8 2.6 2.2 1.4 1.0 9.8 10.1 6.6 3.2 1.4 0,6 1.5 1.2 1.2 1.3 LS 3.2

L lvestock ranches-The classification "livestock ranches" was used only in the 17 Western States, Florida, Louisiana, Hawaii, and Alaska. Livestock operations of this type represent those farms or ranches on which the chief emphasis is placed upon the production of livestock by grazing. The classification was not used in the remaining 29 States as livestock farms consist almost entirely of farms on which livestock products are produced primarily by the feeding of crops produced on the farm or by the feeding of purchased feed.
Livestock ranches comprised only 3 percent of all commercial farms. They .contained 31 percent of the land in commercial farms, 2 percent of the cropland harvested, they had 55 percent of all land used for pasture and grazing, 15 percent of all the cattle and calves, and 45 percent of the sheep and lambs. They accounted for 4 percent of the value of all farm products sold from commercial farms, and 40 percent of the number of sheep and lambs sold in 1964. Livestock ranches are located mainly in grazing areas of the western half of the United States. Areas of concentration include the Edwards Plateau of Texas, the Flint Hills of Kansas, the Sand Hills of Nebraska, western South Dakota, western North Dakota, Montana, Wyoming, Colorado, New Mexico, Arizona, Utah, Nevada, and Florida.
Subject All livestock
Percent distribution: Number of farms •••••••••••••••••••••••••••••.••.•••••••••••••• percent •• Land in farms •••••.••••••••.•••••••••..••••.•••••••••••••.•••. percent •. Cropland harvested ...•. , .•...••...... , ......•............••... percent .. Total cropland ............... , .........••..................... percent .. Total pastureland ............•...•......................•....• percent .. Value of land and buildings •..•.•.......•......•...•.......•.• percent .. Total value of all farm products sold ......................... percent .. Value of cattle and calves sold .•..••..•...•.................• percent .. Value of sheep and la.mbs sold ...•...•................•...•...• per_cent ..
Average per farm: Land in farm., .••..••...••..•..•............•................... acres .. Cropland harvested .••..•... , •...••......•..•...... , .....•..•.... acres .• Total cropland ..•...•...•....•..•......••..•............•....... acres .. Total pasture land ..• , .•....••..•...•...........•..• , ...••.••.... acres •• Value of land and buildings .•..••......••.......••.•.........• dollars .. Cattle and calves •......•...•........•••....•......•.....•....• number ..
Cows including heifers that have calved •.........•.•...••... number .. Sheep and lnmbs .......•..•........•.•.•...••..••..••.....•...•. number •.
Ewes 1 year old and over ......•...•...........•..•....•...•. number .. Cattle and calves sold ..• , ...••...•.............•••.....••... , .number .• Sheep and lambs sold •..•••.......•...•...•...•..••.......••..•. number .. Value of all farm products sold, ....•.•...•.••...••...••..•... dollars ..
Cattle and calves sol,d ......••.......•...•......•....••.... dolla.rs .. Sheep and lambs sold •...• , •..•• , ..••......•...•....•..••... dollars ..
Expenditures for-Feed for livestock and poultry .............................. dollars .. Purchase of livestock and poultry ....•...•.•..•..•...•..... dollars .• Seeds, bulbs, plants, and trees •..•.......•...•.......•.... dollars .• Fertilizer and fertilizing materials ...•••.........• , ••..•• dollars .• Gasoline and other petroleum fuel and oil for the
farm business .• , .•..•...•••...•..••...........•..••..•••.. dollars .. Hired farm labor .•.........• , ..••...•..••...•...•...•. , .... dollars .. Machine hire, contract and custOlll work ....••...•.....••.... dollars ..
Regular hired workers ••.••...••. , .•...•.•.....•....•.......... persons .. Inoone from sources other than the farm operated ..•........... dollars ..
Percent of farms with-Fertilizer used ............................•.......••......... percent .. Tractors other than gnrden and motor tillers ......... , ...•.... percent .. Inco~re from sources other than the farm operated, .•.•...•..... percent ..
Percent of farll\5 operated by-Full owners ....•• ,, ....•.•.•..•..........•..........•. , ......• percent .. Part owners .•.••....•...•...•.....•...............•..•.•.••... pcrct:!nt .. Managers ••••.. , • , ...........••.........••.•.•.......•• , ....... percent .• Tenants .....•.....••...• , ...••.......•..........•.......••• , .. percent ..
Cash ..............••....•.•.....•....•...•...•...•...••...• percent .. Share cash ... , .•.......•.........• , •...•...•.....•...•..... percent .• Crop share ••••••••••••••••••••.••.••• , •• , .••...••••••• , , ••• percent •• Livcstook share •...•....•...•....•.••........•...•..•...... percent .. Othcl' and unspecified .....••..••...•..••............•...••• percent •.
1Less than 0.05.
ranches
100.0 100.0 100.0 100.0 100.0 100.0 100.0 100.0 100.0
4,571 7l
207 4,376
203,691 220 113 159 116 140 125
21,270 17,233
1,849
4,253 6,357
88 278
887 1,898
385
4,034
28.3 75.6 ?4.7
39.3 46.9
2.9 10.9 6.7 0.6 0.2 0.7 2.0
Other areas of concentration were in the grazing areas of Washington, Oregon, and California.
The characteristics of the livestock ranches differ in various parts of the country. About three-fourths of the livestock ranches sold only one kind of livestock. Both cattle and sheep ranches are found in the western part of the country. Goat ranches are limited almost entirely to Texas. The livestock ranches in Florida, Louisiana, and Hawaii are cattle ranches. Livestock ranches are highly specialized. The sale of livestock and livestock products (other than dairy and poultry products) accounted for 96 percent of all farm products sold from the farms. Almost 90 percent of the livestock ranches are owner or manager operated. Only 1 out of 4 had regular hired workers.
The 5, 900 large ranches, those with sales of all farm products of $40,000 or more, accounted for a large part of the production on livestock ranches. These large-scale ranches accounted for 64 percent of the sales of livestock and livestock products (other than dairy and poultry products), 54percentofthe cattle and calves, and 60 percent of the sheep and lambs sold from livestock ranches.
The figures in the following table show some of the important characteristics of ranches of various sizes of operation.
Economic class of farm
Class I Class II Class III Class IV Class V Class VI
8.9 10.2 15.8 21.0 25.3 18.8 45.8 18.6 15.9 10.4 6.5 2.8 39.1 19.5 19.2 12.9 ?.0 2.3 28.7 16.6 18.3 16.5 13.2 6.8 46.2 18.7 15.8 10.3 6.3 2.7 38.7 16.8 16.4 13.2 10.0 4.8 64.0 13.3 10.4 7.0 4.2 LO 65.5 12.4 9.8 6.9 4.3 L1 66.3 16.2 10.3 4.8 2.1 0.4
'23,438 8,316 4,618 2,269 1,167 680 309 135 86 43 20 9 664 337 240 163 108 75
22,648 8,002 4,389 2,142 1,087 629 865,484 330;916 211,326 126,256 82,088 53,150
1,082 357 215 125 ?> 42 462 198 125 ?5 45 25 998 304 137 51 20 6 708 232 104 39 1.1. 4 855 200 113 65 3? 14 846 225 98 35 13 3
152,409 27,79'7 14,063 7,0?5 3,545 1,144 126,402 20,903 10,725 5,629 2,949 989 13,71? 2,938 1,204 420 154 35
30,919 4,307 2,395 1,508 962 601 54,526 5,580 2,534 1,324 710 312
403 130 82 59 38 20 1,301 390 241 175 132 75
3,520 1,530 1,021 612 360 187 12,979 1,954
3,029 1,344 590 284 113 602 366 223 132 55
1 (') (') (') 7,383 4,067 3,72'7 4,023 4,448 2,135
36.0 30.0 27.7 28.1 28.9 23.4 85.0 82.4 80.? 7?.6 73.L. 63.5 62.8 65.0 69.6 76.8 85.3 ?3.5
16.9 23.7 28.7 38.7 47.5 57.1 64.0 61.1 5?.1 47.7 40.7 30.0 11.6 5.5 3.3 L7 0.9 0.8 7.5 9.7 11.0 11.9 10.9 12.0 5.7 6.9 7.6 ?.5 7.0 5.2 0.3 0.? 0.8 1.0 0.6 0.3 0.1 0.1 0.2 0.3 0.2 0.3 0.5 0.9 1.0 0.9 0.4 0.7 LO L1 LO 2.0 2.0 3.5
975
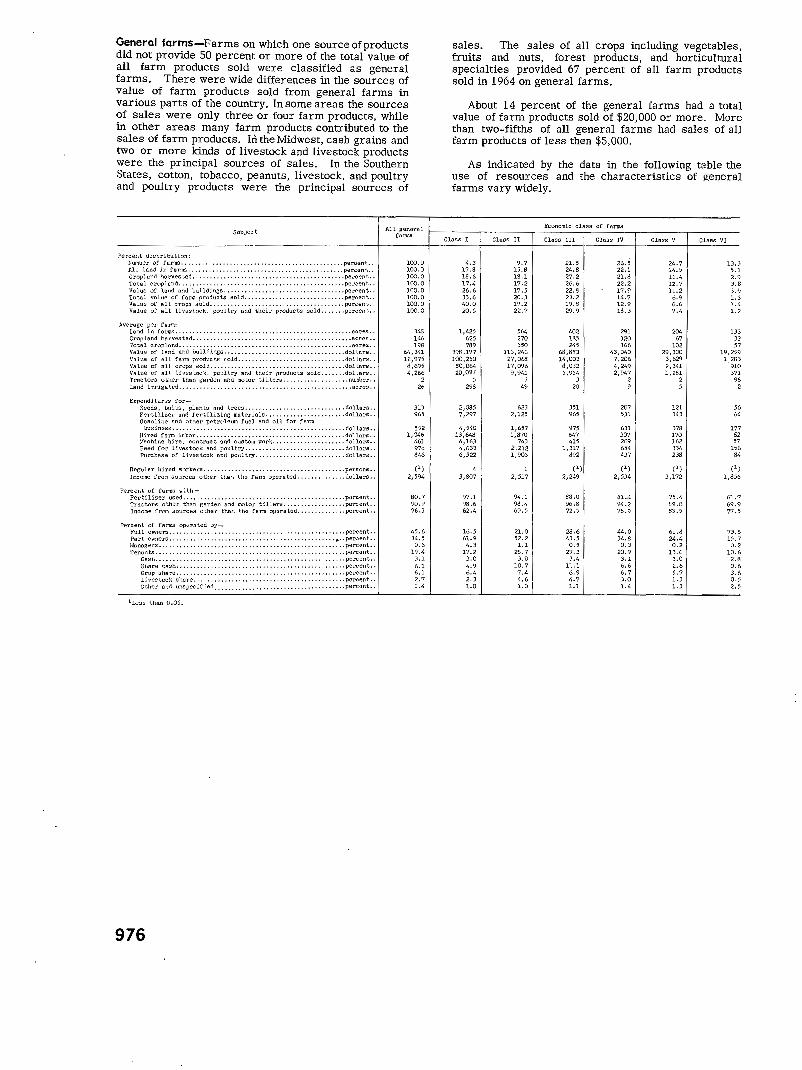
General farms-Farms on which one source of products did not provide 50 percent or more of the total value of all farm products sold were classified as general farms. There were wide differences in the sources of value of farm products sold from general farms in various parts of the country. In some areas the sources of sales were only three or four farm products, while in other areas many farm products contributed to the sales of farm products. In the Midwest, cash grains and two or more kinds of livestock and livestock products were the principal sources of sales. In the Southern States, cotton, tobacco, peanuts, livestock, and poultry and poultry products were the principal sources of
All generol SubJect fBl'lilS
Percent. distrlbutio:1: Number or forms •.......••....•......•.........•..•...•..•..... percent .. 100.0 All lend in fel'IIIS •.• , •.••.••••• , .•..•••••••••••••• , • , .•. , • , ••• percent •• 100.0 Cropla:-td horves t.ed .•• , •••••• , •• , ••••• , •••••••••••••••••••••••• percent •• 100.0 Total cropland .. , .........•• , ....... , , .......... , .... , •..••.•• pereent .• 100.0 Value or land 8!\d buildings, , •• , • , • , ••••• , .• , ••• , ••••••• , •• , •• pei'C"ent •. 100.0 Total value or rann pruducts sold ...................••• , ....•• percent •. 100.0 Value of all ::lrops sold ...••...•.•...•........••.. , •........•• perc ant •. 100.0 Value or all livestock. poultry and their p:oducts sold .•.•... percent .. 100.0
Average per fa~: La,d In fa'l'r.l5 ..................................... , ...•..•.•.•.• acres •• 31.8 Cropland harvested •.................•...•....•....••..•• ,.,, •••• acres •• 146 To'!;al cropland, ....• , , , • , .•. , .•..•.....•............•••.•. , .••.. acres .. 1'>8 Value 0~ land and buildings, , . , •••• , , . , , , , . , . , •• , , ...••.•... , • dollars •. 64,341 Value of all fann products sold ••... , .......•. , .....•.....•.•• dol lora •• 12,975 Value or all ~r.)pS aol:i .... , .... , .. , ........•....• , , ...• , , .... dollars .. 8,695 Value or ell liveatoclt, poultry and their products sold ..•... , dollarlll •• 4,266 Troetors other than garden and motor tillers ......••........... nwnber .. 2 Land i l'rigated ..............•.... , ... , ..........•.... , •.....•••. acres .. 26
Expenditures for-Seeds, bulbs, plants and trees ..•... , .•......•.••...... , ..• dollars •• 31> Fertllizer ""d fertilizing materials ..•... ,,,, •.... , •••••.. dollars •• 965 Gasoline and other petroleum fuel and oll for farm
business •.••.•.•••• , .•. , . , , •...• , •.•...•.•.... , •..... , ••.• dollars .. 652 Hired rarm labor ••••..•..•....••...•••..•.•..••.•....•••... dollars •• 1,046 ~chine hil'e, contrtlct and c>Jstom work .........•.•..•.••..• dollars .. 461 Feed ror livestock nnd paul try •. o .• , , , o ..•..... , o ...•. , o ... dollara .• 97o Purchase or lives tack and pou1 try .... o .........• , ....•.• , .. dollars, o 846
Regular hired W")rkers .•... o o ....•.. o ....•.•.....•. o o .•.•. , •.•. persons •. (1) Income from SO.!reeS other tha""l. the raxm vpera ted1 •• o ...... o •..• dollars .• 2,594
Pe.reant or f'anns wi.th-Fertilizer used .......•......• , ......•..•. o . o .••. , ..•.•.. o o •.. percent. .. 80o7 Tractors o~her than garden .. ,. motor tillers o .. , o o .•......•... percent .. 90o9 Income from sourcas other than the rann operuted .. 0. 0 ••••••••• percent. 0 76.3
?ercant or ranns operated oy-Full owners ...... , .....••.... o . , , ..........•... o .... o .•....••. percent. o 45o6 Part owners, , ...........••.. , . o •....... o , .. , ...•.. o ... , o ...••• percent. o 34.5 Mana~ers ••.•• o ........ o .••... o .. , ...•.....••....•. o! ..•..•...• peNent .• 0.6 Tenants, ...••...•..•.......•..... , •..........•• , . , .. , o., ...... percent •. 19.4
Cash ...••.• o., •• , o ..•• , ....•.... o ....... o ....•• , o, .•...•.•• percent •• 3.1 Shore cash .• o., •... o. o .•..... , o ...•.......•.. o •.. o o .•.....• percent •. 6.1 Crop share •.............. ,.,, .........•........•..... o .. o •. pereant •. 6.1 Livestock s11.areo ....... ,.,, .................... , .....•. o ... percent .. 2.7 Other and u.""!specir led ... , . 0 ••• 0 • 0 ,, • 0 , ••••••• o •. o o, .. o •...• percent •• 1.4
1Less than 0.05.
976
sales. The sales of all crops including vegetables, fruits and nuts, forest products, and horticultural specialties provided 67 percent of all farm products sold in 1964 on general farms.
About 14 percent of the general farms had a total value of farm products sold of $20,000 or more. More than two-fifths of all general farms had sales of all farm products of less then $5,000.
As indicated by the data in the following table the use of resources and the characteristics of general farms vary widely.
Economic class or ranns
Closs I Closs II Class III Class IV Closs v Class VI
4.3 9.7 21.5 26.5 24.7 lJ,J 17.8 15.8 24.8 22.1 14.5 5.1 18.6 19.1 27.2 21.8 11.4 2.9 17.4 17.2 26.6 22.2 12.? 3.8 26.6 1? . .5 22.8 17.9 11.2 3.9 .JJ.6 20.3 2J.2 14.7 6.9 1.3 40.0 19.2 H.6 12.9 6.6 1.4 20.5 22.? 29.9 18.3 7.4 1.2
1,425 561. 402 291 204 133 625 270 165 1?.0 67 32 789 350 245 166 102 57
398,1?7 113,246 68,883 43,040 29,300 19,259 100,250 Z7 ,068 14,003 7,206 3,62<) 1,283 90,064 17,096 8,032 4,249 2,J41 910 20,097 9,941 5,954 2,947 1,281 371
5 ) 3 2 2 96 298 49 20 9 5 2
2,085 623 351 207 121 56 7,2cn 2,125 965 531 143 64
4,540 1.}657 975 631 378 177 13,64a 1,870 64? 307 170 62
4,163 743 415 269 162 57 4,633 2.212 1,317 6.54 33/• 156 6,522 1,903 892 437 238 84
1 (') <'> (1) (') 3,807 2,517 2,249 2,.534 3,1?2 1,856
97.1 94ol 88.0 81.4 75o4 61.7 98.6 98.4 96.8 94.2 89.0 69.9 62o4 6').5 72.5 ?6o9 83.5 ?7 • .5
16.5 21.0 28.6 44.0 61.8 73o5 61.9 52.2 43.5 34.8 24.4 15.7 4.3 1.1 0.5 0.3 0.2 0.2
17.2 25.7 27.3 20.9 13.6 10.6 3.0 3.0 3.4 3.1 3.0 2.8 4.9 lOo? 11.1 6.6 2.6 0.6 6.4 7.4 6.9 6.7 5.7 3.6 2.3 4.6 4.7 3.0 1.3 0.5 l.O l.O 1.1 1.4 1.3 2.5
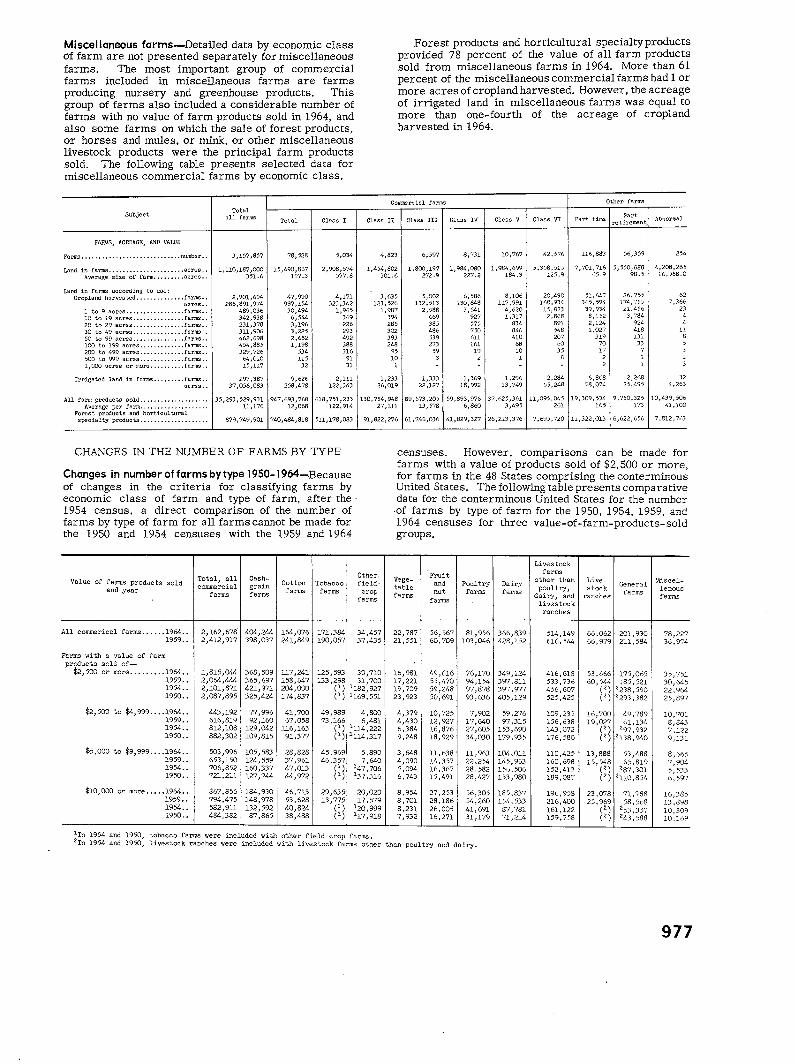
Miscellaneous farms-Detailed data by economic class of farm are not presented separately for miscellaneous farms. The most important group of commercial farms included in miscellaneous farms are farms producing nursery and greenhouse products. This group of farms also included a considerable number of farms with no value of farm products sold in 1964, and also some farms on which the sale of forest products, or horses and mules, or mink, or other miscellaneous livestock products were the principal farm products sold. The following table presents selected data for miscellaneous commercial farms by economic class.
SubJect Totttl
nll forms Total Class I
FARMS, ACRF..AGE, AND VALUE
Farms., ••• , •• , , ••••••••••.•••• , ••. number •• 3,157,85? ?8,528 5,034
Land in fnl'JTI8.,.,., ••••••.••••••• , . acres •. 1,110,187,000 15,490,867 2,908,574 Aver0.r;e size of form ••••••••• acres •• 351.6 197.3 577.8
Lund in farms accordincr to use: Cropland harvested •..••••.•.•••. farms •• 2,?01,694 47,990 4,171
acres •• 286,891,974 997,154 323,342 1 to 9 acres .•.•.••.•.•••..•• farms •• 489,036 30,494 1,965 10 to 19 acres •••••••••...•.. farms •• 342,938 6,544 369 20 to 29 acres .•.••••••••..•• farms .• 231,3?8 3,196 226 30 to 49 a.cres ............... farms .. 311,906 3,225 293 50 to 99 acres ••••.••..••...• farms •• 462,698 2,652 492 100 to 199 acres, , , , •...••..• f&I'II'.S •. 454,885 1,198 388 200 to 499 acres ............. farms .. 329,726 534 316 500 to 999 acres •........•... farms .. 64,010 115 91 1,000 acres or more •.•..•.•.. farms •. 15,117 32 31
Irrigated land in farms ••••••••• farms •• 297,387 9,626 2,111 37,056,083 258,478 122,343
All farm products sold .•.•••• , ••.• , •• ,, .•• 35,293,529,931 947,693,768 6181751 1233 Average per farm •••••••. , .•. , ....... 11,176 12,068 122,914
Forest products and horticultural specialty products, ••...• , ••.•••..•... 879,749,901 740,484,818 511,178,083
CHANGES IN THE NUMBER OF FARMS BY TYPE
Changes in number of farms by type 1950-1964~Because of changes in the criteria for classifying farms by economic class of farm and type of farm, after the -1954 census, a direct comparison of the number of farms by type of farm for all farms cannot be made for the 1950 and 1954 censuses with the 1959 and 1964
Total, all Cash-Value of fe.nns products sold commercial grain Cotton Tobacco and year farms fa11ms farms farms
All cornmerical farms ...... 1964 •• 2,162,678 404,244 164,076 171,384 1959 .. 2,412,917 398,037 241,849 190,057
Fanns with a value of farm products sold of-
Forest products and horticultural specialtyproducts provided 78 percent of the value of all farm products sold from miscellaneous farms in 1964. More than 61 percent of the miscellaneous commercial farms had 1 or more acres of cropland harvested. However, the acreage of irrigated land in miscellaneous farms was equal to more than one-fourth of the acreage of cropland harvested in 1964.
Corr.mereial farms Other farms
Part Class II Class III Class IV Class V Class n Part time retiren:ent
Abnormal
4,823 6,597 8,731 10,767 42,57(, 116,883 5-6,359 254
1,454,802 1,800,197 1,984,080 1,984,699 5 ,3:)8, ~15 7, 701 '716 5, 550,688 4,208,265 301.6 272.9 227.2 184.3 ::.25.9 65.9 98.5 16,568.0
5,002 6,586 8,106 20,490 51,647 26,755 62 3,635 123,526 132,513 130,848 117,991 168,934 365,594 174,75') 7,366
1,907 2,!:188 3,541 4,620 15,873 39,934 21.456 23 394 669 927 1,317 2,868 8,152 3, ':'84 4
285 385 575 834 891 2,124 924 4
302 486 ?50 B4G 548 1,027 418 11 393 539 611 410 207 319 131 8 248 273 161 68 GO 70 33 5
95 59 19 10 35 17 7 3 10 3 2 8 2
1 2
1,233 1,333 1,369 1,296 2,284 6,868 2,268 32 26,019 22,12? 18,992 13,749 55,248 78,074 25,495 4,263
lJO 1 7541 948 89,573,205 59,893,976 37,625,361 11,095,045 19,309,534 9, 750,325 10,439,506 27,111 13,578 6,860 3,495 261 165 173 L.l,100
91,822,2?6 61,746,036 41,829,327 26,213,376 7,695,720 11,322,013 6,622,656 7,812 '763
censuses. However, comparisons can be made for farms with a value of products sold of $2,500 or more, for farms in the 48 States comprising the conterminous United States. The following table presents comparative data for the conterminous United States for the number .of farms by type of farm for the 1950, 1954, 1959, and 1964 censuses for three value-of-farm-products-sold groups.
Livestock
Other. Fruit farms Vege- other than Liv.::;- Miscel-field-table and Poultry Dairy
poultry, General crop nut farms farms stock
farms lenous farms dairy, and ranches farms farms farms livestock
ranches
34,457 22,787 56,567 81,956 366,839 514,149 66.062 201,930 78,227 37,435 21,551 60,709 103,046 428,152 616,544 66,979 211' 584 36,974
$2,500 or more •.....•.• 1964 •• 1,815,044 368' 509 117,241 125,593 30,710 16,981 49,616 76,170 349' 124 416,618 53 ,(,66 175,065 35,751 1959 .• 2,064,444 365,697 158,647 133,298 31,700 17,221 55 ,t~?o 94 J 154 397,811 533' 736 60,544 185' 521 30,645 1954 .. 2,101,871 421,971 204,000 (1) 1182,927 19,709 59,248 97,878 397.977 456 J 607 (2) 2238' 590 22,964 1950 .. 2,087,895 325,424 174,837 (') 1169,551 231923 50,691 93' 636 405' 129 525,425 (') 2293,382 25,897
$2,500 to $4, 999 .... 1964 .. 443,192 77' 996 41,700 49,989 4,800 4,379 10,725 7,902 59 ,2?6 109,235 16,700 ~9, 789 10,701 1959 .. 616,819 92,160 67,058 73,166 6,481 4,430 12,927 17,640 97,315 !56,638 19,027 61,134 8,843 1954 .. 812,108 129,042 116,163 (') 1114,222 6,384 !6,876 27,605 153' 690 143,072 n 2 97.932 7.122 1950 .. 882,302 109,815 91,377 (1) 1114,317 9,248 18 J 929 34,030 179.935 !76,580 (2) 2138' 940 9,131
$5,000 to $9,999 .•.. 1964 •. 50:31996 105' 583 28,828 45,969 5,890 3,648 11,6:38 11,963 104.011 110,425 l3 ,888 53,488 8,665 1959 .. 653,150 124' 559 3? ,961 46,357 7,640 4,090 14,:357 22,254 145,963 1(10,698 15 J 548 65.819 7,904 1954 .. 706,852 160,337 47,013 (l) 147,706 5,094 16,367 28.582 l5t>, 50(1 152 ,L..l3 (2) 287,301 5, 533 1950 .• 721,211 127' 744 44,972 (1) 13'7 .316 6,743 15,491 28,L,27 153' 980 189,087 (2) 2uo ,854 6,59?
$10,000 or more ••••• 1964 •• 867,856 184' 930 46.713 29,635 20,020 8,954 27,253 56,305 185.837 19o,958 23.078 71.788 16,385 1959 .. 794,475 148,978 53.628 lJ, 775 17,579 8,701 28.186 54,260 154,533 216,400 25.969 58,568 lJ ,898 1954 .. 582 '911 132,592 40,824 (1) 120,999 8,231 26.005 41,691 87' 781 161,122 <') 2 53,357 10,309 1950 .. 484,382 87,865 38,488 (l) 117' 918 7,932 16,271 :31,179 7l J 214 159,758 (2) 243.588 10.16~
1In 1954 and 1950, tobacco farms were included with other field crop farms. 2In 1954 and 1950, livestock ranches were included with livestock farms other than poultry and dairy.
977
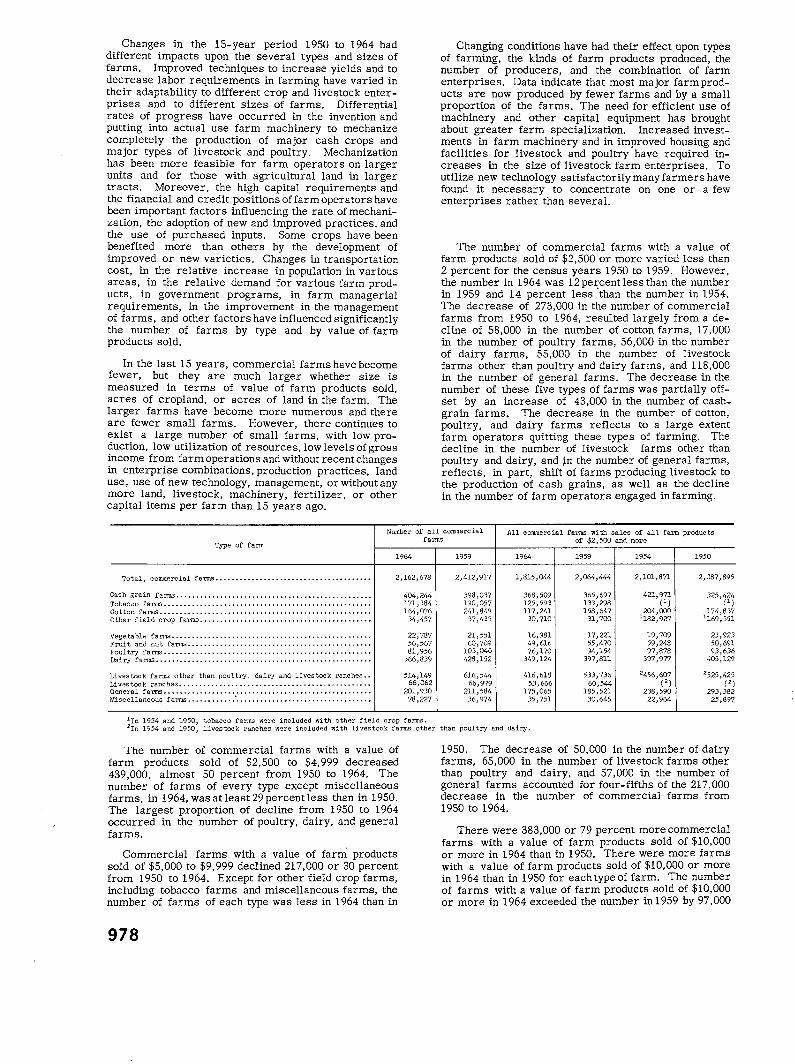
Changes in the 15-year period 1950 to 1964 had different impacts upon the several types and sizes of farms. Improved techniques to increase yields and to decrease labor requirements in farming have varied in their adaptability to different crop and livestock enterprises and to different sizes of farms. Differential rates of progress have occurred in the invention and putting into actual use farm machinery to mechanize completely the production of major cash crops and major types of livestock and poultry. Mechanization has been more feasible for farm operators on larger units and for those with agricultural land in larger tracts. Moreover, the high capital requirements and the financial and credit positions of farm operators have been important factors influencing the rate ofmechanization, the adoption of new and improved practices, and the use of purchased inputs. Some crops have been benefited more than others by the development of improved or new varieties. Changes in transportation cost, in the relative increase in population in various areas, in the relative demand for various farm products, in government programs, in farm managerial requirements, in the improvement in the management of farms, and other factors have influenced significantly the number of farms by type and by value of farm products sold.
In the last 15 years, commercial farms have become fewer, but they are much larger whether size is measured in terms of value of farm products sold, acres of cropland, or acres of land in the farm. The larger farms have become more numerous and there are fewer small farms. However, there continues to exist a large number of small farms, with low production, low utilization of resources, low levels of gross income from farm operations and without recent changes in enterprise combinations, production practices, land use, use of new technology, management, or without any more land, livestock, machinery, fertilizer, or other capital items per farm than 15 years ago.
Changing conditions have had their effect upon types of farming, the kinds of farm products produced, the number of producers, and the combination of farm enterprises. Data indicate that most major farmproducts are now produced by fewer farms and by a small proportion of the farms. The need for efficient use of machinery and other capital equipment has brought about greater farm specialization. Increased investments in farm machinery and in improved housing and facilities for livestock and poultry have required increases in the size of livestock farm enterprises. To utilize new technology satisfactorily many farmers have found it necessary to concentrate on one or a few enterprises rather than several.
The number of commercial farms with a value of farm products sold of $2,500 or more varied less than 2 percent for the census years 1950 to 1959. However, the number in 1964 was 12 percent less than the number in 1959 and 14 percent less 'than the number in 1954. The decrease of 273,000 in the number of commercial farms from 1950 to 1964, resulted largely from a decline of 58,000 in the number of cotton farms, 17,000 in the number of poultry farms, 56,000 in the number of dairy farms, 55,000 in the number of livestock farms other than poultry and dairy farms, and 118,000 in the number of general farms. The decrease in the number of these five types of farms was partially offset by an increase of 43,000 in the number of cashgrain farms. The decrease in the number of cotton, poultry, and dairy farms reflects to a large extent farm operators quitting these types of farming. The decline in the number of livestock farms other than poultry and dairy, and ~n the number of general farms, reflects, in part, shift of farms producing livestock to the production of cash grains, as well as the decline in the number of farm operators engaged in farming.
Number of all commercial All commercial farms with sales of all farm products farms of $2, 500 and more
Type of farm
Total, conunercial farms ...••.••••••.•.••.........•.•••••• ·•··•
Cash g-rain farms ••.••• , •• , ...•....•.••.•.••..•• ,,,., •.•....••• , •. Tobacco farms ...••.••...•.•.•.•••••••.•••.•••.•.....••.••..•••••• Cot ton fai'IllS ..........•.•....•.........•...•.....•.•............• Other field crop farms •..•.........•....•............•.....••••.•
Vegetable farrns ..........•.........•.................•....•.....• Fruit and .out fa1"Jll3 ••..•.••••••.•.••.••.•••.•...••.•.••.• · •• · • • •• Poultry fa TinS ••••••••••••••• o o • o •••• o •••••••••••••• o o • o •••• o •••••
Dairy farms .. o o o •••••••••••••••••••••••••••• o o o ••• o o •••••••••••••
Livestock farms other than poultry, dairy and livestock ranches •. Li v .;:s toe K ranches • o •••••••••••••••••••••••••••••••••••••••••• o o ••
General farms ....... o o •••••••••••••••• o ••••••••••••••••••••••••••
Miscellaneous fanns .....••.• o • .'. o • o o. o o ••• o •••••• o •••••••••••••••
1964
2,162,678
404,244 171,384 164,076
34,457
22,787 56,567 81,956
366,839
514,149 66,062
201,930 78,227
1959 1964
2,412,917 1,815,041 ...
398,037 368,509 1~0,057 12.5' 593 241,849 117,241
37,435 30,710
21,551 16,981 60,709 49,616
103,046 76,170 428,152 349,124
616,541t 416,618 66,979 53,666
211,584 175,065 36,974 35 '751
1959 1954 1950
2,064,444 2,101,871 2,087,895
365' 697 421,971 325,424 133' 298 (1) (') 158,647 204,000 174,837
31,700 1182,927 1 169 J 551
17,221 19,709 23' 923 55,470 59,248 50,691 94,154 97,878 93' 636
397,811 397,977 405' 129
533' 736 2456,607 2525,425 60,544 (') (')
185' 521 238,590 293,382 30,645 22,964 25,897
1In 1954 a:~.d 1950, tobacco farm.; w~re included with other field crop farms. 2In 1954 and 1950, livestock ranches were included with livestock farms other than poultry and dairy.
The number of commercial farms with a value of farm products sold of $2,500 to $4,999 decreased 439,000, almost 50 percent from 1950 to 1964. The number of farms of every type except miscellaneous farms, in 1964, was at least 29 percent less than in 1950. The largest proportion of decline from 1950 to 1964 occurred in the number of poultry, dairy, and general farms.
Commercial farms with a value of farrri products sold of $5,000 to $9,999 declined 217,000 or 30 percent from 1950 to 1964. Except for other field crop farms, including tobacco farms and miscellaneous farms, the number of farms of each type was less in 1964 than in
978
1950. The decrease of 50,000 in the number of dairy farms, 65,000 in the number of livestock farms other than poultry and dairy, and 57,000 in the number of general farms accounted for four-fifths of the 217,000 decrease in the number of commercial farms from 1950 to 1964.
There were 383,000 or 79 percent more commercial farms with a value of farm products sold of $10,000 or more in 1964 than in 1950. There were more farms with a value of farm products sold of $10,000 or more in 1964 than in 1950 for each type of farm. The number of farms with a value of farm products sold of $10,000 or more in 1964 exceeded the number in1959 by 97,000
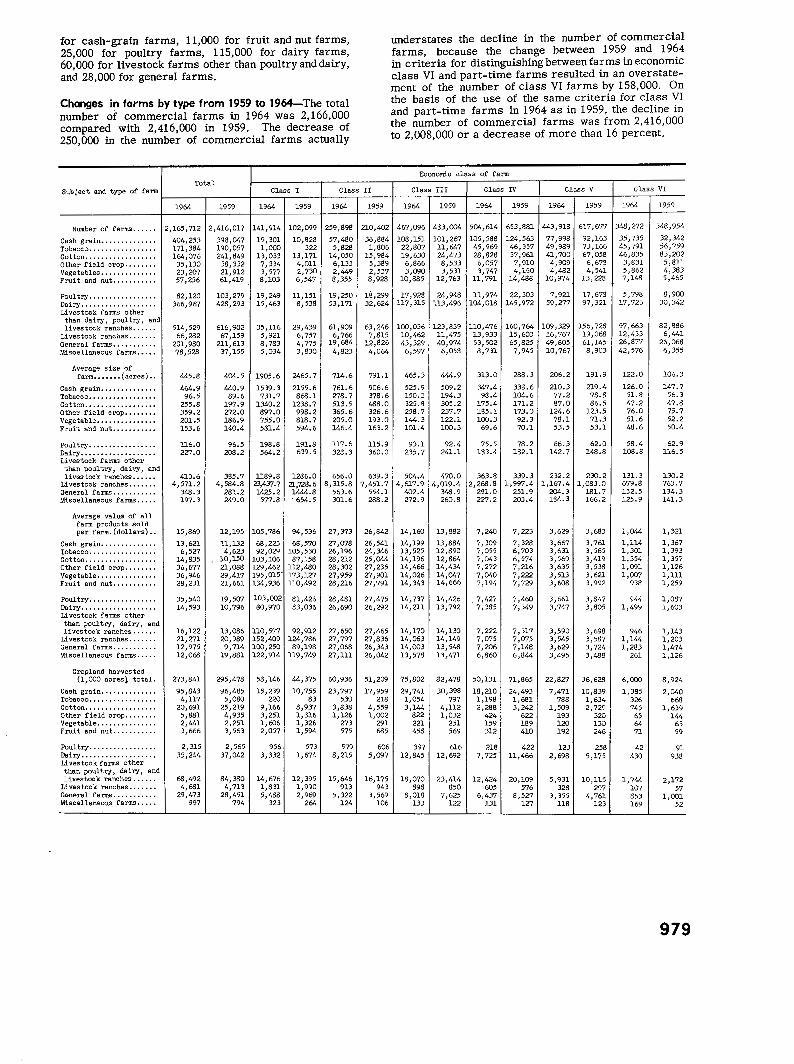
for cash-grain farms, 11,000 for fruit and nut farms, 25,000 for poultry farms, 115,000 for dairy farms, 60,000 for livestock farms other than poultry and dairy, and 28,000 for general farms.
Changes in farms by type from 1959 to 1964-The total number of commercial farms in 1964 was 2,166,000 compared with 2,416,000 in 1959. The decrease of 250,000 in the number of commercial farms actually
Total S'.lbject end type of fann Class I Class
1964 1959 1964 1959 1964
Number of farms •••••• 2,165,712 2,416,01? 141,914 102,099 259,898
Cash grain •••••.•..••••. 404,253 398,047 19,301 10,828 5?,480 Tobacco ••••••••••••••••• 171,384 190,057 1,000 322 5,828 Cotton ....••.•.•.•.••..• 164,076 241,849 11,033 13,171 14,050 Other field crop ..•...•• 35' 130 38,332 7,334 4,011 6,133 Vegetables •.•.....••••.• 23,20? 21,912 3,5?7 2,?30 2,449 Fruit and nut .•..••..•.. 5? ,256 61,419 8,103 6,54? 8,355
Poultry .............•... 82,120 103,279 19,249 11,151 19,250 Dairy ••••••••.•.•••.•.•• 366,967 428,293 15,463 8,538 53,171 Livestock farms ot.her than dairy, poultr.r, and livestock ranches •••.•• 514,529 616,902 35,116 29,439 61,909
Livestock ranches •.••... 66,282 67,159 5,921 6, 737 6,766 General farms ••.•.•.•.. , 201,980 211,613 8,783 4,775 19,684 Miscellaneous farms, •••• ?8,528 37,155 5,034 3,830 4,823
Average size of farm ••••••• (acres) •. 445.8 404.5 1905.6 2465.? 714.6
Cash grain •••••••.••.... 464.9 41.0.9 1539.3 2155.6 761.6 Tobacco •••••••••••.••••• 96.5 89.6 731.7 868.1 278.7 Cotton ••••••••.•••••..•. 255.8 197.9 1340.2 1238.7 513.5 Other field crop ••.••••• 359.2 272.0 897.0 998.2 365.6 Vegetable •••.•••...••..• 201.5 186.9 755.0 818.7 205.0 Fruit a:-ad nut •••••••.••• 153.6 140.4 581.4 594.6 146.4
Poultry ••.•.•• oo •••••••• 116.0 96.5 198.8 191.8 117.6 Dairy ••••••••••••••••••• 227.0 208.2 564.2 639.5 328.3 Livestock farms other than poultry, daicy, and livestock ranches. o •••• 413.6 385.? 1189.8 1286.0 656.0
Livestock ranches •.•••.. 4,571.2 4,584.8 23,437.7 21,?28.6 8,315.8 General farms .•......... 348.3 281.2 1425.2 1444.8 563.6 Mi.scellaneous farms ••.•. 197.3 249.0 577.8 . 654.5 301.6
Average value of all farm products sold per farm. (dollars) •• 15,869 12,19.5 105, ?86 94,536 27,373
Cash grain •.•...•...•••. 13,621 11,132 68,223 68,570 27,078 Tobacco .••.....••......• 6,.527 4,623 92,029 105,530 26,196 Cotton .... o ••••••• o ••••• 14,835 10,150 103,106 87,158 28,212 Other field crop ..••.••. 36,67'1 21,088 129,462 112,480 28,302 Vegetable ••••.. , •.•.•... 36,946 29,41? 195,015 173,127 27,959 Fruit and nut .........•• 28,231 21,661 134,936 110,492 28,216
Poultry ..•.••.•.•.•...•• 35,540 19,507 103,002 81,426 28,481 Dairy ••••••••.••.•..•••• 14,593 10,796 80,970 83,036 26,690 Livestock fanns other than poultry, dair-.r, and livestock ranches ..•.•. 16,122 13,086 110,577 92,912 27,650
Livestock ranches ....... 21,271 20,989 152,409 124,?86 2?,797 General farms ..........• 12,975 9,714 100,250 89,198 27,068 Miscellaneous farms •••.. 12,068 19,881 122,914 119,749 27,111
Cropland harvested (1,000 acres! total. 273,841 295,478 58,146 44,375 60,936
Cash grain •••.•.•••.•... 95,843 96,48.5 15,239 10,755 23,?97 Tobacco .•.•.......••... , 4,117 5,080 220 83 530 Cotton •.....•.••••.•.... 20,691 25,219 9,166 8,937 3,838 Other field crop •.••••.• 5,881 4,935 3,251 1,816 1,126 Vegetable .••...•••..•••• 2,441 2,251 1,606 1,326 273 Fruit and n'Jt ........... 3,666 3,563 2,057 1,.594 575
Poultry •.....•.••.••..•• 2,315 2,.565 956 573 579 Dairy •......•••••.••••.• 35,244 37,042 3,332 1,674 8,215 Livestock terms other tha.'1 paul tcy, dairy, and livestock ranches .•.••• 68,492 84,380 14,676 12,395 15,646
Lives tock ranches .....•• 4,681 4,713 1,831 1,990 913 General fann.s ••....•.... 29,473 28,451 5,488 2,969 5,322 Miscellaneo:J.s farms .•..• 997 ?94 323 264 124
II
1959
210,402
36,884 1,806
15,984 5,389 2,53? 8,928
18,299 32,624
63,246 7,815
12,826 4,064
791.1
906.6 378.6 488.0 326.6 193.0 163.2
115.9 360.0
639.3 ?,451.7
554.1 288.2
26,842
26,541 24,346 2.5,044 2:7,235 27,901 2:7,791
27,475 26,292
27,465 27,836 26,343 26,042
51,209
17,9.59 218
4,.5.59 1,002
291 685
606 .5,097
16,175 943
3,569 106
understates the decline in the number of commercial farms, because the change between 1959 and 1964 in criteria for distinguishing between farms in economic class VI and part-time farms resulted in an overstatement of the number of class Vl farms by 158,000. On the basis of the use of the same criteria for class VI and part-time farms in 1964 as in 1959, the decline in the number of commercial farms was from 2,416,000 to 2,008,000 or a decrease of more than 16 percent.
Economic class of fa~
Class III Class rv Class V Class VI
1964 1959 1964 1959 1964 1959 1964 1959
467,096 483,004 504,614 653,881 443,913 617,677 348,272 348,954
108,151 101,26? 105,588 124,563 ?7,998 92,163 35, ?35 32,342 22,80? 11,64? 45,969 46,35? 49,989 73,166 45,791 56, ?59 19,630 24,473 28,828 3?' 961 41,?00 67,058 46,835 83,202 6,866 8,533 6,05? '7,910 4,909 6,6?S 3,831 5,811 3,090 3,531 3,?47 4,190 4,482 4,541 5,862 4,383
10,885 12,?63 11,791 14,488 10,974 13,223 7,149 5,465
17,928 24,948 11,974 22,303 7,921 l?,67S 5, 796 8,900 117,315 113,496 104,018 145,972 59,277 97,321 17,723 30,342
100,036 123,839 110,476 160,764 109,329 156, ?28 97,663 82,886 10,462 11,475 13,933 15,603 16,767 19,068 12,433 6,441 43,329 40,974 53,502 65,825 49,805 61,145 26,877 26,068
6,597 6,05S 8,?31 7,94.5 10,767 8,903 42,576 6, 355
465.3 441 .. 9 313.0 288.3 206.2 191.9 122.0 106.3
525.9 509.2 347.4 338.6 210.3 219.4 126.0 147.? 150.3 194.3 98.4 104.6 77.2 7S.8 51.8 56.3 325.8 305.2 175.4 171.2 87.0 86.5 47.2 4?.8 258.7 237.7 135.1 173.0 124.6 123.5 76.0 75.7 144.3 122.1 100.3 92.3 78.1 71.3 51.6 52.2 101.4 100.3 69.6 ?0.1 53.5 53.1 48.6 50.4
93.1 92.4 ?5.5 78.2 66.3 62.Q 58.4 62.9 2.35.7 241.1 133.4 132.1 142.7 148.8 108.8 116.5
504.4 470.0 363.8 339.3 232.2 230.2 131.3 130.2 4,617.9 4,019.4 2,268.8 1,997.4 1,16?.4 1,083.0 679.8 763.7
402.4 348.9 291.0 251.9 204.3 181.7 132.5 134.3 272.9 260.8 227.2 203.4 184.3 166.2 125.9 141.3
14,160 13,882 7,240 7,223 3,629 3,683 1,044 1,321
14,199 13,884 7,309 7,328 3,667 3,761 1,114 1,367 13,525 12,890 7,055 6,703 3,631 3,565 1,301 1,393 14,196 12,864 7,043 6,574 3,569 3,419 1,3.54 1,3.57 14,466 14,434 7,2:72 7,216 3,635 3,538 1,091 1,126 14,026 14,047 7,040 7,222 3,.513 3,621 1,007 1,111 14,343 14,666 7,194 ?,729 3,608 3,992 938 1,259
14,737 14,426 . 7,427 7,460 3,661 3,847 944 1,087 14,211 13,?92 7 ,38.5 7,349 3,747 3,805 1,499 1,603
14,170 14,130 7,222 7,317 3,590 3,698 946 1,143 14,063 14,149 7,075 7,0?5 3,54.5 3,587 1,144 1,203 14,003 13,548 7,206 7,148 3,629 3,724 1,283 1,4?4 13,578 13,4?1 6,860 6,844 3,49.5 3,488 261 1,126
75,802 32,478 50,131 71,865 22,827 36,628 6,000 8,924
29,?41 30,398 18,210 24,493 7,471 10,839 1,385 2,040 1,054 797 1,198 1,681 788 1,634 326 668 3,144 lt,ll2 2,288 3,242 1,.509 2,729 ?45 1,639
822 1,032 424 622 193 320 65 144 221 251 159 189 120 130 64 63 458 569 312 410 192 246 71 59
39? 616 218 422 123 258 42 91 12,845 12,692 7,725 11,466 2,698 5,175 430 938
18,070 23,414 12,424 20,109 5,931 10,11.5 1,744 2,172 898 850 605 576 328 29? 107 57
8,018 7,625 6,437 8,527 3,355 4,?61 853 1,001 133 122 131 127 118 123 169 52
979
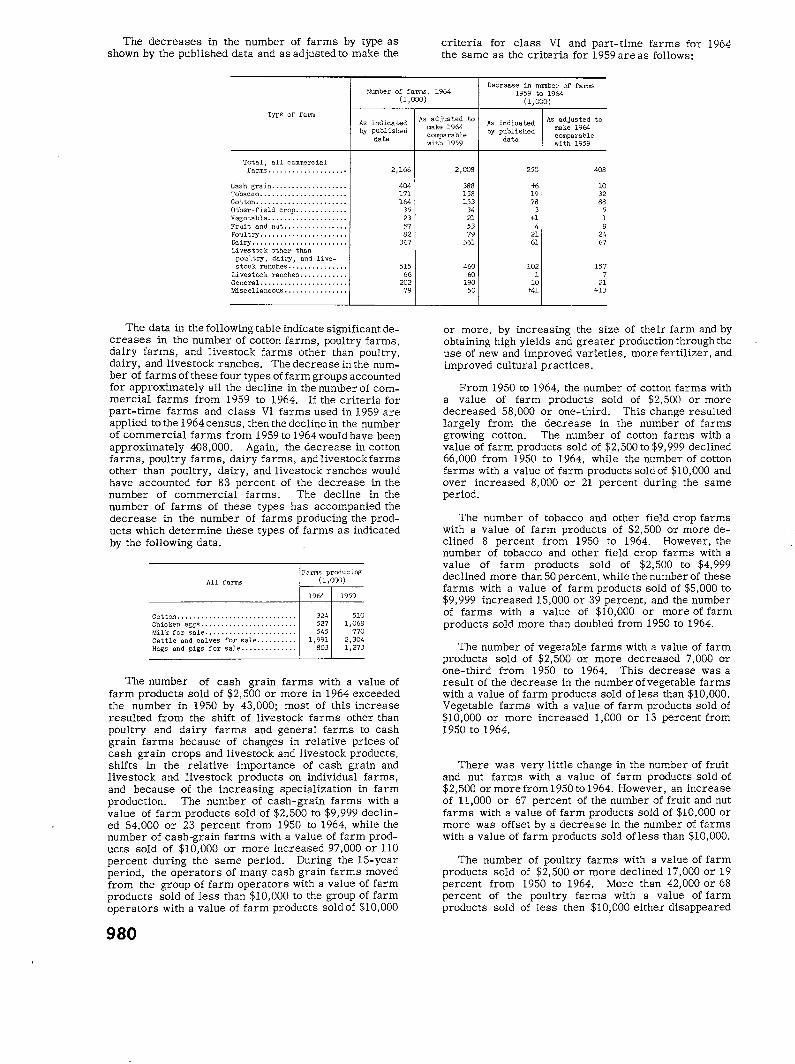
The decreases in the number of farms by type as shown by the published data and as adjusted to make the
criteria for class VI and part- time farms for 1964 the same as the criteria for 1959 are as follows:
Number of farm3, 1964 (1,000)
Decrease in number of farms 1959 to 1964
(1,000)
T:roe of farm As indicated by published
data
Total, all commercial farffi3 ......•.........•.•• 2,166
Cash grain .....•............. 404 Tobacco •. , .......•..•.......• 171 Cotton ...................•... 164 Other-field crop •............ 35 Vegetable .................... 23 Fruit and nut ••.............. 57 Po'Jltry ••.........•........•. 82 Dairy •....•...........•.•...• 367 Livestock other than
po'J.ltr-y, dairy, and live-stock ranches ............••. 515
Livestock ranches ...........• 66 General .•.•...............•.. 202 Miscellaneous ............. , , ,
The data in the following table indicate significant decreases in the number of cotton farms, poultry farms, dairy farms, and livestock farms other than poultry, dairy, and livestock ranches. The decrease in the number of farms of these four types of farm groups accounted for approximately all the decline in the number of commercial farms from 1959 to 1964. If the criteria for part-time farms and class VI farms used in 1959 are applied to the 1964 census, then the decline in the number of commercial farms from 1959 to 1964 would have been approximately 408,000. Again, the decrease in cotton farms, poultry farms, dairy farms, andlivestockfarms other than poultry, dairy, and livestock ranches would have accounted for 83 percent of the decrease in the number of commercial farms. The decline in the number of farms of these types has accompanied the decrease in the number of farms producing the products which determine these types of farms as indicated by the following data.
All farms
Fnrm.s producing (1,000)
1964 1959
Cotton.............................. 324 510 Chic ken eggs. . . . .. . .. .. .. .. . . .. .. . .. 527 1, 068 Milk for sale. . . . . . • . . . . . . . . . . . . . . . . 545 770 Cattle and calves for sale.......... 1,991 2,304 Hogs and pigs for sale.............. 803 1,273
The number of cash grain farms with a value of farm products sold of $2,500 or more in 1964 exceeded the number in 1950 by 43,000; most of this increase resulted from the shift of livestock farms other than poultry and dairy farms and general farms to cash grain farms because of changes in relative prices of cash grain crops and livestock and livestock products, shifts in the relative importance of cash grain and livestock and livestock products on individual farms, and because of the increasing specialization in farm production. The number of cash-grain farms with a value of farm products sold of $2,500 to $9,999 declined 54,000 or 23 percent from 1950 to 1964, while the number of cash-grain farms with a value of farm products sold of $10,000 or more increased 97,000 or 110 percent during the same period. During the 15-year period, the operators of many cash grain farms moved from the group of farm operators with a value of farm products sold of less than $10,000 to the group of farm operators with a value of farm products sold of $10,000
980
79
As adjusted to make 1964 comparable with 1959
2,008
388 153 153
34 21 53 79
361
460 60
190 50
As indicated by published
data
250
-If> 19 78
3 +1
'· 21 61
102 1
10 r41
As adjusted to make 1964 comparable with 1959
408
10 32 88
5 1 8
24 67
157 7
21 +13
or more, by increasing the size of their farm and by obtaining high yields and greater production through the use of new and improved varieties, more fertilizer, and improved cultural practices.
From 1950 to 1964, the number of cotton farms with a value of farm products sold of $2,500 or more decreased 58,000 or one-third. This change resulted largely from the decrease in the number of farms growing cotton. The number of cotton farms with a value of farm products sold of $2,500 to $9,999 declined 66,000 from 1950 to 1964, while the number of cotton farms with a value of farm products sold of $10,000 and over increased 8,000 or 21 percent during the same period.
The number of tobacco and other field crop farms with a value of farm products of $2,500 or more declined 8 percent from 1950 to 1964, However, the number of tobacco and other field crop farms with a value of farm products sold of $2,500 to $4,999 declined more than 50 percent, while the number of these farms with a value of farm products sold of $5,000 to $9,999 increased 15,000 or 39 percent, and the number of farms with a value of $10,000 or more of farm products sold more than doubled from 1950 to 1964.
The number of vegetable farms with a value of farm products sold of $2,500 or more decreased 7,000 or one-third from 1950 to 1964. This decrease was a result of the decrease in the number of vegetable farms with a value of farm products sold of less than $10,000. Vegetable farms with a value of farm products sold of $10,000 or more increased 1,000 or 13 percent from 1950 to 1964.
There was very little change in the number of fruit and nut farms with a value of farm products sold of $2,500 or more from 1950 to 1964. However, an increase of 11,000 or 67 percent of the number of fruit and nut farms with a value of farm products sold of $10,000 or more was offset by a decrease in the number of farms with a value of farm products sold of less than $10,000.
The number of poultry farms with a value of farm products sold of $2,500 or more declined 17,000 or 19 percent from 1950 to 1964. More than 42,000 or 68 percent of the poultry farms with a value of farm products sold of less then $10,000 either disappeared
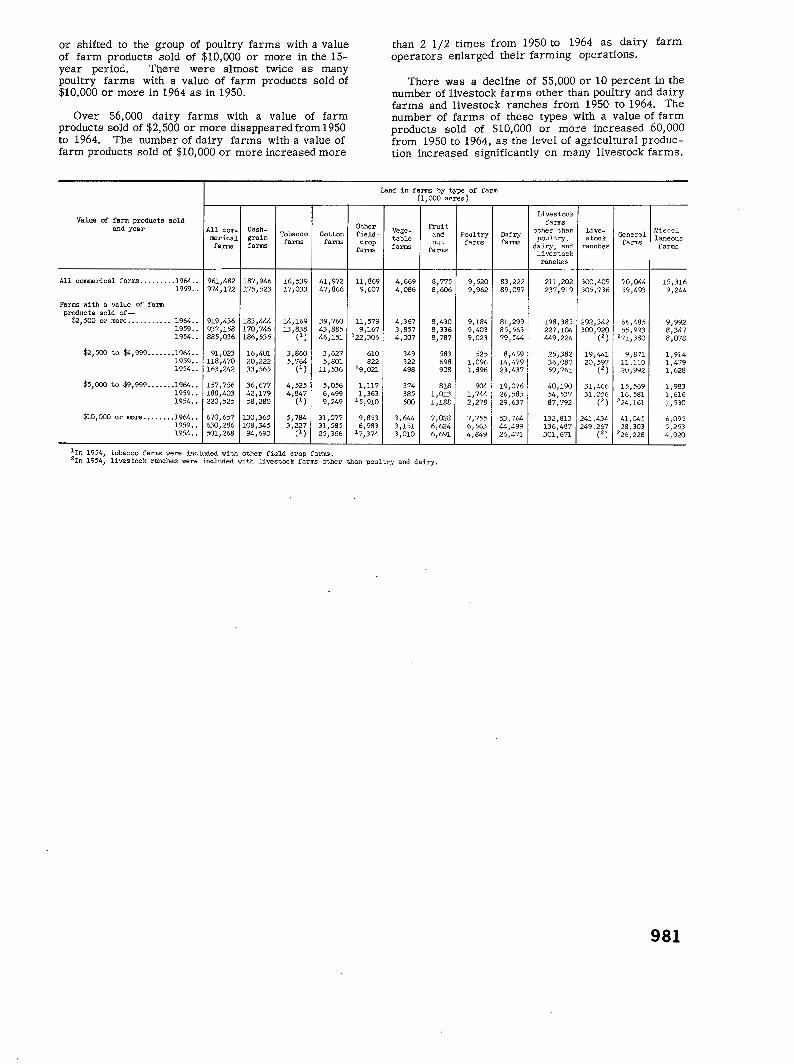
or shifted to the group of poultry farms with a value of farm products sold of $10,000 or more in the 15-year period. There were almost twice as many poultry farms with a value of farm products sold of $10,000 or more in 1964 as in 1950.
Over 56,000 dairy farms with a value of farm products sold of $2,500 or more disappeared from 1950 to 1964. The number of dairy farms with a value of farm products sold of $10,000 or more increased more
Value of farm products sold a.."ld year All com~ Cash-
Tobacco Cotton merical grain farms farms farms farms
All conunerical farms •••.....• 1964 •• 961,482 187,946 16,539 41,972 1959 •. 974,172 175,523 17,033 47,866
Farms with a value of farm products sold of-
$2,500 or more ••••••.•••. 1964 •• 919,436 183,444 14,169 39,760 1959 .. 937,158 170,746 13,838 43,885 1954 •• 885,036 186,535 (l) 46,151
$2,500 to $4,999 ....... 1964 .. 91,023 16,401 3,860 3,627 1959 .. 118,470 20,222 5,764 5,801 1954 .. 163,242 33,565 (') 11,536
$5,000 to $9,999 ....... 1964 .. 157,756 36,677 4,525 5,056 1959 .. 188,403 42,179 4,847 6,499 1954 .. 220,525 58,280 (l) 9,249
$101 000 or more .•.••..• 1964 .• 670,657 130,365 5,784 31,077 1959 .. 630,286 108,345 3,227 31,585 1954 .. 501,268 94,690 (') 25,366
Other field· crop
farms
11,869 9,607
11,579 9,167
1 22,306
610 822
19,021
1,117 1,363
15 J 910
9,853 6,983
17,374
than 2 1/2 times from 1950 to 1964 as dairy farm operators enlarged their farming operations.
There was a decline of 55,000 or 10 percent in the number of livestock farms other than poultry and dairy farms and livestock ranches from 1950 to 1964. The number of farms of these types with a value of farm products sold of $10,000 or more increased 60,000 from 1950 to 1964, as the level of agricultural production increased significantly on many livestock farms.
Land in farms by type of farm (1,000 acres)
Livestock
Fruit farms
Vege- and Poultry Dairy other than Live- General
Miscel-table poultry, stock laneous farms
nut farms farms dairy, and ranches farms farms farms livestock
ranches
4,669 8,775 9,520 83,222 211,202 300,409 70,044 15,316 4,086 8,606 9,962 89,097 237,919 305.736 59,493 9,244
4,367 8,430 9,184 81,299 198,385 292,342 66,485 9,992 3,857 8,336 9,403 85,563 227,104 300,920 551993 8,347 4,007 8,787 9,023 79,544 449,224 (2) 271,380 8,078
349 583 525 8,459 25,382 19,441 9,871 1,914 322 698 1,096 14,479 36,080 20,597 11,110 1,479 498 908 1,896 23,437 59,761 (2) 20,992 1,628
374 818 904 19,076 40,190 31,466 15,569 1,983 385 1,013 1,744 26,585 54' 537 31,056 16,581 1,616 500 1,188 2,278 29,63'7 87' 792 (') 224,161 1,530
3,644 7,028 7,755 53,764 132,813 241,434 41,045 6,095 3,151 6,624 6,563 44,499 136,487 249,267 28,303 5,253 3,010 6,691 4,849 26,471 301,671 (') 226,228 4,920
1In 1954, tobacco farms were included with other field crop farms. 2In 1954, livestock ranches were included with livestock farms other than poultry and dairy.
981