Embed Size (px)
Citation preview
1986-08 Spring 1986
SOUTHERN METHODIST UNIX Back-Grounding Operation
Ty K. Roberts
SENiOR DES RN PKQjECT
r!)P P
DEPARTMENT OF OPERATIONS RESEARCH AND ENGINEERING MANAGEMENT
SCHOOL OF ENGINEERING AND APPLIED SCIENCE
DALLAS, TEXAS 75275

SENIOR DESIGN PROJECT
MACKGROUNDING ©1PT1I©
Prepared for Richard S. Barr
May 8,1986
Prepared by Ty K. Roberts
ABSTRACT
After conducting on-site interviews and gathering data from the Lincoln County agent, I found an application for a linear programming model in my uncles cattle operation. I formulated several LP models and evaluated their outputs in order to make recommendations for improving his current feedmix rations.

MANAGEMENT SUMMARY
On my visit to the ranch, I saw that there was some room for improvement,
in the hacgrounding operation.
Although the feed mix currently in use was designed for the cattle's nutrional
needs and growth, its creators neglected to consider the costs involved with
providing that mixure.
After meeting with the general manager of the ranch and the Local county
I agent, I took all the data 1 had collected and formulated three linear programming
Imodels. The models were designed to minimize the cost of the feedmix while
providing for the cattle's needs for nutrition and growth.
I analyzed the outputs from these models and arrived at a recommendation.
I recommend that the ranch make use of feedmix U I found in Table 1 at the end of
this report. This feed mix meets the objectives of the ranch and is 2500 less than
the feedmix currently in use.
11
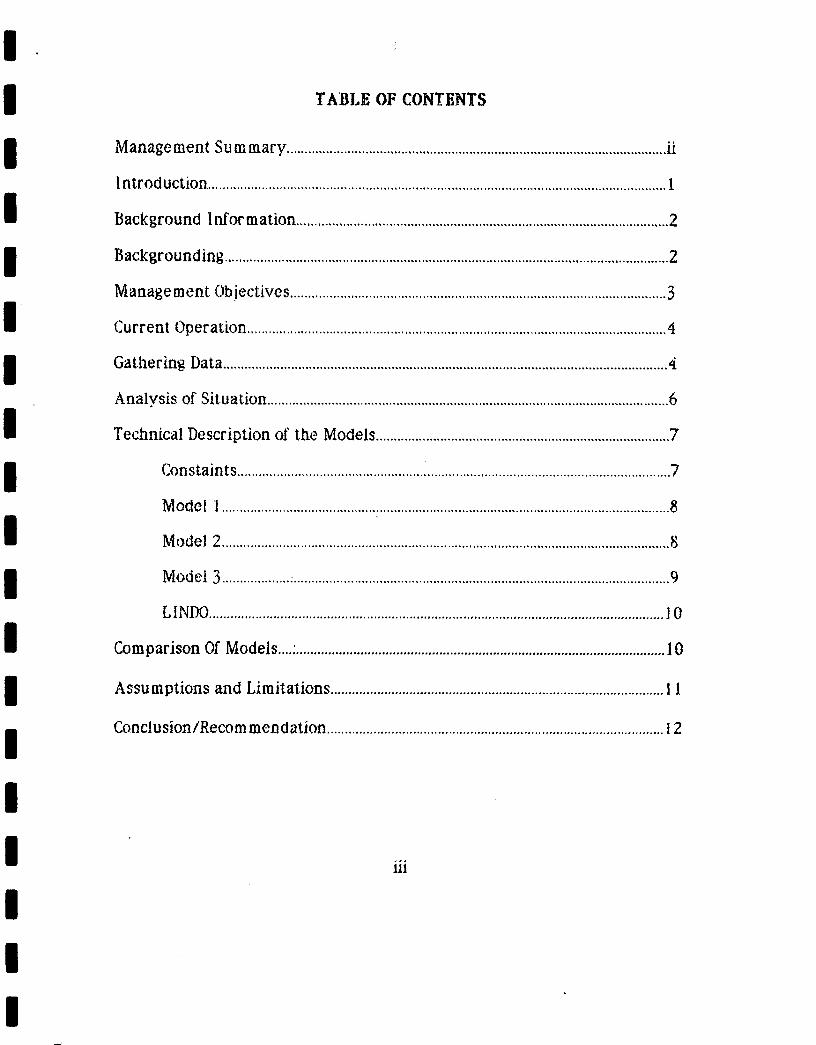
TABLE OF CONTENTS
ManagementSummary..........................................................................................................ii
Introduction.................. ..................................................................................................... ......... I
BackgroundInformation ................................... ..................................... ................................ 2
Backgrounding............................................................................................................................2
ManagementObjectives .................................................................................................. .......3
Current, Operation .................................................. .................................................... ...... ......... 4
GatheringData............................................................................................................................ 4
Analysisof Situation................................................................................................................ 6
Technical Description of the Models.................................................................................. 7
Constaints ............................................................................................................ .............7
Model l .... ....................................... ..... ..... .. .................... . ... . ...... .............. .... .. ...... ......... .... 8
Model2............................................................................................................................. 8
Model3 ................................... . ...... . ....... ... ........... .... .................... . ........................ . ......... .. 9
UNDO ............................................................................................................................... Jo
ComparisonOf Models ............................................................................................................ 10
Assumptionsand Limitations ............................................................................................. 11
Conclusion/Recommendation .............................................................................................. 1 2
111

I I Subject
IThis report is my Senior Design project. The subject of my project is the
backgrounding operation run by my uncle on a ranch owned by my grandfather in I Kansas.
Pur pose
M y goal for this project was to identify a "real world" situation where an
operatons research technique could be applied. My hope was that by applying an
OR technique, I could somehow improve the operation of that situation. This report
is the result of my efforts and the realization of my goat.
TLack
My major field of study is engineering management with an emphasis in
operations research. I have developed many OR skills from the classes I've taken.
This project required the formulation and evaluation of LP modeling, atechnique
with which I am very familiar.
Scope
I limited my study to the backgrounding operation on my uncle's ranch. My
objective was for a 600 pound steer to gain 2 pounds a day for 60 days at the
I cheapest cost.

BACKGROUND INFORMATION
My uncle runs a cash crop and beef cattle operation. Most of his crops are
sold under a government subsidy program. But, he does maintain a surplus of
milo, aiphalfa, sileage, and wheat hay to he used as feed for his cattle.
He raises cattle to be sold for slaughter. He currently has a total of 415 head
of cattle of which 160 are newborn calves that he will sell to the slaughter houses.
Up until this year, my uncle would sell these calves to a broker as soon as
they were wened off their mothers. At that time, the calves generally weighed
550 to 600 pounds. But this method hasn't proved very profitable. So my uncle
has begun shipping his cattle to feedlots and paying the lots to fatten up the cattle
in the hope they will gain enough weight to be sold at a profit.
Feedlots are costly, and fattening up cattle as an investment is risky.
Therefore, my uncle has decided to do some of the fattening up on his own ranch.
Since he has a surplus of crops for feed, and available space, he believes he can put.
some weight on the cattle cheaper than the feeddlot can.
There is a name given to this type of feedlot operation--backgrounding. I
found it to he an interesting process and decided to focus in on it for my Senior
Design project.
BACKGROUNDING
Six to nine months after birth, the calves are weed off their mothers. At
that time, the calves generally weigh between 550 to 600 pounds, but are still

Ideveloping physically. When these steers go to the slaughter houses, they will
- weigh between 1100 to 1300 pounds and be about. a year old,
In order for the steers to gain that much weight in such a short time, they
must develop a strong frame to support. it all. The development of that frame is
known as backgrounding.
The primary objective of backgrounding is to put 100 to 120 pounds of bone
and muscle on the steer and to instill good eating habits. Hopefully, the steer will
weigh around 700 pounds when it is shipped to the feedlots in eastern Kansas.
MANAGEMENT OBJECTIVES
My uncle made it quite clear to me that his main objective was to put as
much weight on the steers as possible at the cheapest cost. Of course, he pays
careful attention to their nutrional requirements because he knows a healthy steer
will ultimately gain more weight (bringing in more revenue) than a less healthy
steer.
Another objective he had was to complete the backgrounding process in a
60-day period so he can quickly get the steers out to the feedlots where they can
• start putting on the "big" weight.
ILastly, I learned that my uncle would like to use his milo and alphall'a
sparingly because he can sell them for cash if he has any left over after
I backgrounding the steer-s.
4
CURRENT OPERATION
Not only does my uncle have to feed 160 calves for backgrounding, but also
he has to feed the other 255 head with the same surplus of crops. But those 255
head are full-grown cattle and are fed only enough to maintain life until the next
calving season.
Knowing what crops he has on-hand and which he wants set aside for the
hackgrounding operation, my uncle employs the services of the county agent to
determine a feed mix for his steers. The county agent as access to all of the studies
done on cattle by the state university. He knows, or can find out, everything the
ranchers need to know about their cattle.
The county agent finds out which crops my uncle has on-hand, what breed of
cattle are in question (a cross between seminal and hereford in my uncle's case),
and how much weight gain is desired. With this information, the county agent
looks through several books of charts and statistics to find the nutritional needs of
the cattle and the nutritional wealth of the crops. He then offers a few feedmix
suggestions to my uncle.
Although the county agent doesnt give much thought to the costs involved
with each crop, he is aware that any surplus of milo or aiphalfa can be sold for
cash.
GATHERING DATA
I went to the ranch one weekend to learn more about my uncle's operation.
The night I arrived my uncle and I sat down to discuss my objectives. I explained

5
the purpose and goal of my project. and asked him to describe the different. types
of ranch operations he was responsible for. During that. first meeting, I decided I
would fOCUS my attention on his cattle operation..
The next morning 'I went with my uncle on his daily rounds. Along the way,
with note pad and pen in hand, I asked him a multitude of questions. I wanted to
learn as much as I could about all of the tangible and intangible factors involved
with the cattle business. By noon that day, I had a good understanding of his cattle
operation and had decided to focus in on the backgrounding process.
Although my uncle did a good job of explaining the backgrounding process to
me, he was unable to give me any details about. how the feed mix was derived.
Therefore, I set, up an appointment with the county agent to determine how he
arrived at. a feed mix solution.
I had already gotten the costs and quantities on--hand from my uncle. So
from the county agent I hoped to learn which nutrional requirements he tried to
meet when making a feedmix. .1 also needed to know the upper and lower limits
for those requirements.
The county agent told me that the most important factors to consider were
moisture content, dry matter, rufage, and protein. Moisture content refers to the
percentage of a crop that is moisture. If 25% of the milo is moisture, then a steer
eating four pounds of milo will only be able to digest three pounds of it, because
the other pound is moisture and will, pass directly through the steer's system. It is
important for the ranchers to know the moisture content of their crops so they can
calculate the dry matter. Dry matter is the amount of the crop left over when the
moisture is taken out. In the example mentioned, the dry matter is three pounds.
The dry matter contains all of the nutrients and fibers, the most important to

I 6
growth being protein. Protein is the catalyst needed for gaining weight and
I building strength. Rufage is synonymous with fiber. Fiber is necessary in the
formation of healthy muscles and tendons..
The county agent told me that there are other mineral and vitamin
I
requirements, but he said if I met the protein and dry matter requirements, I
would also meet these other nutritional requirements. So I had him give me the
Irecommended daily allowances for dry matter and protein which would enable a
600-pound steer to gain an average of two pounds a day. I also had him give me
the average moisture and protein content percentages per pound for milo, alphalfa,
sileage, and wheat hay.
With the nutritional requirements .1 got from the county agent and the costs
I and quantities on-hand from my uncle, I was able to formulate an LP model to
arrive at an optimal feedmix solution at a. minimal cost.
I.ANALYSIS OF SITUATION
After evaluating all of the information I had gathered, I decided to focus my
project on the backgrounding operation with the objective of maximizing weight
I
gain at a minimal cost while meeting the nutritional needs of the cattle.
The technique best suited to solve this type of problem was a Linear
.Programming (LP) model. The first few constraints would represent the upper and
I
lower limits for the recommended dry matter and protein intake per day for each
steer. The other constraints would be the upper limits for the amount of crops on-
hand.
VA
I first formulated an LP model to minimize the cost of the feed mix. My
objective variables were milo, aiphalfa, sileage, and wheat hay. But then I decided
to run some additional models to approach the problem from different angles.
These other models used the same constraints but with different objective
functions.
The second model has an objective function that maximizes revenue. Not
only did I include the cost of crops on-hand, but also I added the revenue gained
from selling the milo and aiphalfa on-hand for cash and buying back only enough
milo and aiphalfa as was needed in the feed mix.
IThe third mode.( is exactly like the second with one exception. In its
objective function, all of the costs assigned to the crops on-hand are considered
"sunk" costs. "Sunk" cost means the costs of the crops are assumed to be zero
• because the crops are leftovers from those already sold to market.
TECHNICAL DESCRIPTION OF THE MODELS
Each of the three LP models has the same constaint.s. The difference
between the models is in their objective functions. The three models are shown on
the pages following this section.
Const.aints
The primary constaints involved with this feedmix problem are the amounts
of protein and dry matter the steer digests each day. According to the county
agent, each steer should consume between 17 to 18 pounds of dry matter each day
along with 1.7 to 1.86 pounds of protein. I determined the moisture content per
8
pound for each crop and formulated an equation to calculate the amount of dry
matter. Constraint 2 is the upper limit, for the daily dry matter consumption and
const.aint 3 is the lower, I also formulated an equation to calculate the amount of
protein per pound in each crop. Const.aint.s 4 and 5 represent. the upper and lower
limit, for port.ein consumption each day. Constaint.s 6, 7, 8, and 9 represent. the
quantity of each crop available per head per day. 1 calculated this from the total
quantity on-hand for each crop.
Model I
This model's objective function minimizes the cost of the feed mix. its
variables represent the pounds of milo, aiphalfa, sileage, and wheat hay used in the
daily feedmix. Their respective coefficients represent the Cost per pound for 60
mixes (representative of the 60-day feeding period).
The optimal solution yielded a cost of $26.82. That is the cost of feeding
each steer for 60 days with the hope that the steer will gain 100 to 120 pounds.
The most critical constaint for this model .is the lower limit on the protein, as
shown by the dual price in Model 1.
Model 2
This models objective function attempts to maximize revenue from the sale
of the milo and aiphalfa on-hand. The four variables from the minimization model
are used here along with four others. The first two new variables represent the
pounds of milo and aiphalfa on-hand that are sold for cash. Their coefficients are
the revenue they would bring per pound for the 60-day period. The last two new
'variables represent the pounds of milo and afphaffa bought from the marketplace
to he used in the feedmix.
The const.aint.s are essentially the same with the exception of one or two
additional variables to be found in all the constaints except S and 9. These new
variables represent. the milo and aiphalfa that is to be sold or bought.
The optimal solution is $0.965. This means that by selling all of the milo and
aiphalfa on-hand, and buying back aiphalfa for the feedmix, my uncle can earn
almost one dollar per head, in other words, he would make money while fattening
up the cattle.
Again, the most critical constaint is the lower limit on the protein, as shown
by the dual price in Model 2.
Model 3
The objective function for this model maximizes revenue like that of model
2's. However, in this model I assumed the costs for the crops on-hand to be sunk
costs (assumed zero). The first two variables in the objective function represent
the revenue for selling the milo and aiphatfa on-hand. The last two variables
represent the costs of buying milo and alphalfa for use in the feedmi.
The optimal solution is $16.66. That means that by selling all the milo and
alphalfa on-hand, and buying back milo to use in the feedmix, my uncle will earn
$16.66 per head at the end of the 60-day feeding period. However, we must
remember this is because I assumed zero cost for the crops on-hand. But the truth
is we did incur costs in the production and storage of those crops on-hand.
Like models 1 and2, the most critical constaint for this model is the lower
limit. for the protein requirement.

FILE: FILE FT02F001 A VM/SP(CMS) R3.l612/85 PUT8502
MIN 2.46 MILO 4- 0.54 SIL 1.8 ALFA + 0.45 WH SUBJECT TO
3) 0.89 MILO + 0.35 SIL 4- 0.89 ALFA 4- 0.86 WH > 17 4) 0.15219 MILO 4 0.02555 SIL + 0.11036 ALFA 4- 0.0645 WH
> 1.7 _5).0.15219MLLO0.02555...SI1_+_0.11O36 ALFA...+ .0.0645 WH
< 1.86.
6) SIL <= 26.04099
71 WH <= 5.083 __8).__MIL0_<=_8...208_________________________
91 ALFA < 4.04 END
OBJECTIVE FUNCTION VALUE
._1 ).. ___26... 821,6400
VARIABLE VALUE REDUCED COST
MILO 3.059870 0.000000 SIL._ 18.027817 0..000000
ALFA 4.040000 0.000000
WH 5.082999 0.000000
ROW SLACK OR SURPLUS DUAL PRICES 2) ' 1.000000 0.000000 3) 0.000000 -0.633198
- _.t)__ 0.00.0000 i2..461O92' 5) 0.160000 0.000000 6) 8.013163 0.000000 7) 0.000000 0.898290
._8).. _5.148129 . 0.00000 __• ____ 9) 0.000000 0.138752
NO. ITERATIONS= 6
RANGES IN WHICH THE BASIS IS UNCHANGED
_ ___.....OBJ.....COEFFiCI.ENT..RAN.GES____ VARIABLE CURRENT ALLOWABLE ALLOWABLE
COEF INCREASE DECREASE MILO ' 2.459999 0.756541 0.266622 SIL ., _,__0.540000___.0.427.415__._0.113775
ALFA 1.799999 0.138752 INFINITY WH 0.450000 0.898290 INFINITY
.......................... IGH.THANO_S [DEA.NGES.._.._ ROW CURRENT ALLOWABLE ALLOWABLE
RHS INCREASE DECREASE 2 18.000000 INFINITY 1.000000
3 17.000000 1.000000 0.160000
.616104 8:266 82 4 1.700000
5 . 1.860000 INFINITY 0.160000 6 26.040985__INFI,NITV._.._- 8.013163
5.082999 7.489752 3.329110 8 8.207999 . INFINITY 5.148129 9 4.040000 5.879750 4.040000
fr1Ot1 11

1 FILE: FILE 'FTO3FOOUA 'VM/SP1CMS)R3.i.6f12/85PUT8502 - MAX 2.4 MS + 1.8 AS - 2.46 MM - 1.8 AM - 0.45 HM - 0.54 SM
- 2.22 MB - 1.8 AB _SUBJECT..T O ._._ ...-.--.--..--.-..---..---._---. ___----..--.
2) 0.89 MM + 0.89 AM + 0.86 HM + 0.35 SM + 0.89 MB
:I+ 0.89 AB >= 17
3) 0.89 MM + 0.89 AM + 0.86 HM + 0.35 SM + 0.89 MB + 0.89 AB < .:...18 .. .....................
- 4) 0.15219 MM + 0.11036 AM + 0.0645 HM + 0.02555 SM + 0.15219 MB + 0.11036 AB )= 1.7
5)
0.15219 MM + 0.11036. AM + 0.0645 HM + 0.02555 SM 15219 MB ..+O.11036 ....AB<=_1.86
• 6) MS + MM = 8.208 7) AS + AM 4.04 8) SM <= 26.04099
..........9)._HM<._5.083_________________________ .:END
OBJECTIVE FUNCTION VALUE
1) 0.965374529
VARIABLE VALUE REDUCED COST MS 8.207999 0.000000 AS 4.040000 0.000000
__.MM ......_.____o . 0 0 0 0 0 0 2.666622 AM 0.000000 1.799999 HM 5.082999 0.000000 SM 10.857266 0.000000
......-_...0.000000._.__._0.026623 AB 9.919750 0.000000
ROW 0R SURPLUS .. ___DUAL PRICES 2) 0.000000 -0856351 3) 1.000000 . 0.000000 4) 0.000000 -9.404198
-- - - ...... 0.160000 0.000000 6)
. .. 0.000000 2.400000
7) 0.000000 1.799999 - 8) 15. 183718 0.000000
. 9) 0.000000 ._.. .O.8.93033._____
NO. ITERATIONS= 8 . .
RANGES IN WHICH THE BASIS IS UNCHANGED
COEFFICIENTVARIABLE . ...CURRENT ±.. LOABLE ALLOWABLE - ..
COEF INCREASE DECREASE MS 2.400000 INFINITY 2.666622
1AS 1.799999 INFINITY 1.799999
MM -2.459999 2.666622 INFINITY AM
HM
-0.450000 -1.799999 . 1.799999
INFINITYINFINITY
0.893033
I s .......... ..-0.540000 _O.011361 ____ ... 0. 167865 . ...........-MB -2.219999 . 0.026623 INFINITY AB -1.799999 0.426856 0.013855
RIGHTHAND SIDE RANGES_..... ROW CURRENT ALLOWABLE ALLOWABLE
RHS INCREASE DECREASE 217.000000 1.000000 1.562920 .3 18.000000 - ._._.1NFINITY .... ._____1.000000 4 1.700000 0.160000 0.271029 5 1.860000 INFINITY 0.160000 6 8.207999 INFINITY 8.207999 7 4.040000 ..INFINITY 4.040000 8
•.26.040985 INFINITY • 15.183718
9 5.082999 4.599006 5.082999
MDtEL Z

FILE: FILE FT04FOO1 A VM/SP (CMS) R3.1 6/12185 PUT8502
MAX 2.4 MS + 1.8 AS - 2.22 MB - 1.8 AB SUBJECT TO
-----------2) _0.89 _MM + 0.89 --AM +..0.86HM3._0.35 SM. -0.89 MB +O.89A8>= 17
3) 0.89 MM + 0.89 AM 4- 0.86 HM + 0.35 SM + 0.89 P-lB + 0.89 AG <= 18
- ...............4) 0.15219 MM .0.11036..AM +..0.0645...HM...+..0.02555 SM + 0.15219 MB + 0.11036 AB >= 1.7
5) 0.15219 MM + 0.11036 AM + 0.0645 HM + 0.02555 SM f 0.15219 MB + 0.11036 AG < 1.86
6)_.JiS..i-....MM 8.208 ------.-.-
71 AS + AM = 4.04 8) SM <= 26.04099 9) HM <= 5.083
_.END..
.-----_____
OBJECT IVE..FUNCTION.._VALUE_
1) 16.6610870
_VARIABLE ....._.....VALUE . ______REDUCED...COST MS 8.207999 0.000000 AS 4.040000 0.000000 MM 0.000000 0.180001 AM _..0.000000... v.190176 HM 5.082999 0.000000 SM 26.040985 0.000000 MB 4.644192 0.000000
ROW SLACK OR SURPLUS DUAL PRICES ._2) ......0.619054. 0.000000_____
3) 0.380946 0.000000 4) 0.000000 -14.5870284--U 5) 0.160000 0.000000
. 6) ._..0.000000 . .. 2.400000._...... ... .............. 7) 0.000000 1.799999
8)
0.000000 0.372698 9) 0.000000 0.940863
NO. ITERATIONS= 8
RANGES IN .WHICH .THE BASIS IS ..UNCHANGED..___ .. .....................
OBJ COEFFICIENT RANGES VARIABLE . CURRENT ALLOWABLE ALLOWABLE
............... __COEF INCREASE ._.._._DECREASE MS 2.400000 INFINITY 0.180001 AS 1.799995 INFINITY 0.190176 MM 0.000000 0.180001 INFINITY
AM MM
0.000000 0.000000
0190176 INFINITY
INFINITY 0.940863
SM 0.000000 INFINITY 0.372698
MG
72.219999....
.._ ..,__._ .2.219999 0.180001 -.
-.AB-1.799999 0.190176 INFINITY
RIGHTHAND SIDE RANGES ROW CURRENT. _.ALLOWABLE - ......ALLOWABLE
- .. RHS . INCREASE DECREASE U 2 17.000000 0.619054 INFINITY
3 . 18.000000 INFINITY 0.380946 4 1.700000 -- -------,. 0.065142._.....- ......_..0.105858 5 1.860000 INFINITY 0.160000 6 8.207999 INFINITY 8.207999 7 4.040000 INFINITY 4.040000 8 26.040985 .............1.899179 ............... 3.086245 9
5.082999 0.789024 1.282196
MODE 3

IVARIABLES
WI FD CRP
I MS AS MM AM HM SM MB AB MTR CST REV
MODEL
i) MIN COST -- -- .li 44 5.08 n8.03-- -- 3021 # $4,291 $1,483
2) MAX REVENUE IW/O SUNK COST 8.21 4.04 -- •-- -- 2586k $4.161 $4315
I MAX REVENUE W/SUNK COST 8.21 4.04 -- -- 604 464 -- 35J6 $4,265 $4,315
CURRENT MIX -- -- -- -- 3000 # $6,854 ???
IMS: milo on-hand sold to mt-U HM: hay on-hand used in mix
I AS: aiphaifa on-hand sold to mt-U SM: sileage on-hand used in mix
1 MM: milo on-hand used in mix MB: nailo bought for use in mix
AM: aIphalfa on-band used in mix AB: aiphalfa bought for use in mix I WI MTR (wet matter): the actual poundage each animal would consume each day
FD CST (feed cost): total Cost of feed mix for 60 day period
CRP REV (crop revenue): total revenue from sate of crops on-hand not used in mix I I Table 1
Comparison of each model's output to the next including the current mix I I I I I

U10
After I formulated each mode!, I input its objective function, variables, and
constraints into a UNDO program. The outputs from each LINDO program provided
me with the results I needed in order to devise the best feedmix solution for the
ranch. The UNDO outputs for each model are shown on the preceding pages.
COMPARISON OF MODELS
I have taken the relevant outputs from each model and put them into Table
1, shown on the previous page, so you can see how each model relates to the
others. Included in this comparison is the current feedmix used by the ranch.
As shown in. the table, model 1 utilized each crop made available where as
model 2 chose not to use any milo and model 3 chose not to use any alphaifa.
When I plugged the current feedmix numbers into the constaints used in the
models, I found that the current mix violated all but three constaints--6, 7, and 9.
The steers dry matter consumption was 20.22 pounds per day and their protein
consumption was 2.54 pounds per day. With these amounts, the cattle would no
doubt gain more that two pounds a day; however, that extra gain isn't cheap. It is
costing the ranch $42.00 to feed each head for 60 days, far more expensive than
any of the other models.
Model 1 and the current mix have the same wet matter content--30 pounds.
This was recommended by the county agent. Model 2, on the other hand, offers a
feedmix weighing only 25.86 pounds and Model 3 has a feedmix weighing 35.76
pounds. With a light feedmix, the steer's hunger might not be satisfied and the

steer may eat some of the other steer's rations, depriving them of their nutritional
needs. A heavy mix isn't good either because a steer might not be able to consume
that. much wet matter in one day, thus the steer won't be getting the nutrients it
needs to gain the average two pounds a day.
Models 2 and 3 yield the same revenue from the sale of milo and aiphalfa.
But Model 2 has the cheapest feed cost. Although the feed cost. for Model I is more
expensive than Models 2 and 3, it, is, respectively, only 3% and 0.6% more
expensive. On the other hand, the mix currently in use is costing as much as 64.7%
more than the other models.
ASSUMPTIONS AND LIMITATIONS
In formulating these models 1 had to make a few assumptions and use some
theoretical data.
Assumptions:
1) I kept the feedmix constant for the entire 60-day period. In reality, the
feedmix would have to change each time the cattle gained 15 to 25 pounds
because they would need more feed to sustain the heavier weight.
2) 1 used theoretical percentages when figuring out the moisture and
protein content because the actual data wasn't available to me. In reality,
my uncle would send a sample of each crop into a lab to have those contents
tested.
3) The costs involved are taken from current market prices and
historical data from past harvests. However, the revenues used are the
12
Iaverages of the best. and worst. forecasts for the future market prices given
- to me by my uncle.
4) In the models I let the lower limit Of milo be zero because I
couldn't obtain data to justify a non-zero limit. But in reality, milo is a
necessity in a feed mix for several reasons. Milo is high in protein and is
considered candy for cattle. But the cattle can't eat much of it at first
because their system is tc1dUcate to handle it. So the cattle must get
used to eating milo gradually. The reason milo is so important is that it is
vital for fattening cattle up to the 1200 pound benchmark.
5) Weather is critical to the backgrounding process. But it is
intangible and extremely difficult to quantitate. The significance of weather
is that during cold weather, the cattle must consume more feed than usual in
order to retain warmth. During a mild winter, the cattle wont require as
much feed. Since it is very diffecult to predict the weather for the next 60
days, my uncle cannot know exactly how much feed his cattle will require.
If I were to use the percentages from the lab tests and limited myself to a
time period where the cattle gained 15 to 25 pounds, a more accurate model and
solution could be obtained.
CONCLUSION/RECOMMENDATIONS
I
Our goat is to obtain a 100 to 120 pound weight gain in the cattle at a
minimal cost while providing the steer with a healthy diet. We want a healthy diet
Ibecause we know a healthy steer will ultimately gain more wieght than an
unhealthy steer. Each of the crops on-hand have varying degrees of proteins,
I

13
fibers, minerals, and vitamins. But by using each crop on-hand in the feed mix, and
I meeting the daily recommended diet, we can be assured that the steer is getting all
the vitamins, nutrients, and minerals it needs to build a healthy frame. We may be
able to save some money by using feed mix #2 or #3 , but our main goal isn't. to
make money on the backgrounding operaton, it is to build a strong and healthy
Isteer. We will worry about revenue when we try to sell them off at 1300 pounds.
ITherefore, my recommendation is to use feedmix 1 in lieu of the current
feed mix. It utilizes all of the crops on-hand and even has some leftover milo to be
Isold. This feed mix meets all of the nutritional needs of the cattle and can save the
ranch over $2500 during the backgroundIng process.