Embed Size (px)
Citation preview

11April 15, 2011 - CLWApril 15, 2011 - CLW
National Weather Service’sNational Weather Service’sWFO - Lacrosse, WisconsinWFO - Lacrosse, Wisconsin
Leadership ConferenceLeadership Conference
Thursday, May 4, 2011 Thursday, May 4, 2011
Charly Wells, Director OEODM Charly Wells, Director OEODM NWSHDQTRS NWSHDQTRS
Silver Spring MarylandSilver Spring Maryland

April 15, 2011 - CLWApril 15, 2011 - CLW 22
Discussion Topics Discussion Topics
– Cultural DiversityCultural Diversity– Workforce Diversity Workforce Diversity – Differences between EEO/AA/DiversityDifferences between EEO/AA/Diversity– National Weather Service’s approach to National Weather Service’s approach to
Diversity ManagementDiversity Management– Statistical analysis of NWS workforceStatistical analysis of NWS workforce– What are the demographics of the NWS? How What are the demographics of the NWS? How
has it changed? Where is it going? has it changed? Where is it going? – How has diversity improved our mission over How has diversity improved our mission over
the years? Examples? Stories? the years? Examples? Stories? – How has our awareness of diversity changed How has our awareness of diversity changed
over the years?over the years? How has it improved our How has it improved our agency and mission? agency and mission?

April 15, 2011 - CLWApril 15, 2011 - CLW 33
Recruitment Efforts at NOAARecruitment Efforts at NOAA
• Corporate RecruitmentCorporate Recruitment– No Specific RecruitersNo Specific Recruiters– Difficult to identify (Recruiters) in the Line Offices Difficult to identify (Recruiters) in the Line Offices
• Distribution of Announcements and Key VacanciesDistribution of Announcements and Key Vacancies– Increase applicant pool Increase applicant pool – Targeted communitiesTargeted communities
• Results Oriented Results Oriented (Wide Dissemination)(Wide Dissemination)
• Key Minority Organizations Key Minority Organizations (Specific locations based on (Specific locations based on underrepresentation)underrepresentation)
• Line Office Participation (EEO Managers)Line Office Participation (EEO Managers)• Plan to reduce Under representationPlan to reduce Under representation

April 15, 2011 - CLWApril 15, 2011 - CLW 44
EEO/AA/DiversityEEO/AA/Diversity•Equal Employment OpportunityEqual Employment Opportunity
– EEO concerns legal compliance with EEO concerns legal compliance with applicable laws, regulations, and policies.applicable laws, regulations, and policies.
•Affirmative ActionAffirmative Action (Affirmative Employment Program)(Affirmative Employment Program)
– Affirmative Action concerns special Affirmative Action concerns special recruitment and developmental efforts to recruitment and developmental efforts to overcome under-representationovercome under-representation
•DiversityDiversity (Diversity Management)(Diversity Management)– Diversity concerns maximizing and Diversity concerns maximizing and
maintaining effective working relationships.maintaining effective working relationships.

April 15, 2011 - CLWApril 15, 2011 - CLW 55
A Definition of: A Definition of: Diversity in the WorkplaceDiversity in the Workplace
Diversity is the mixture of Diversity is the mixture of differences and similarities each differences and similarities each employee brings to the workplace employee brings to the workplace to accomplish the mission of the to accomplish the mission of the Organization. Organization.

Two Types of DiversityTwo Types of Diversity
Cultural diversityCultural diversity concerns differences concerns differences created in society and brought to the created in society and brought to the workplace through the hiring processworkplace through the hiring process
Workforce diversityWorkforce diversity is limited to the is limited to the boundaries of the organization. It boundaries of the organization. It concerns differences that are created by concerns differences that are created by the organization’s own structure and the organization’s own structure and cultureculture
April 15, 2011 - CLWApril 15, 2011 - CLW 66

April 15, 2011 - CLWApril 15, 2011 - CLW 77
2011 USA Population2011 USA Population

April 15, 2011 - CLWApril 15, 2011 - CLW 88
Change In PopulationChange In Population

April 15, 2011 - CLWApril 15, 2011 - CLW 99

April 15, 2011 - CLWApril 15, 2011 - CLW 1010
Intro- National/Regional Intro- National/Regional ChangeChange INTRODUCTIONINTRODUCTION
• The 2010 Census reported 308.7 million people in the United States, The 2010 Census reported 308.7 million people in the United States, a 9.7 percent increase from the Census 2000 population of 281.4 a 9.7 percent increase from the Census 2000 population of 281.4 million. This report discusses population change between 2000 and million. This report discusses population change between 2000 and 2010 for several geographic levels, including regions, states, 2010 for several geographic levels, including regions, states, metropolitan and micropolitan statistical areas, counties, and places. metropolitan and micropolitan statistical areas, counties, and places.
NATIONAL AND REGIONAL CHANGENATIONAL AND REGIONAL CHANGE• The increase of 9.7 percent over the last decade was lower than the 13.2 percent The increase of 9.7 percent over the last decade was lower than the 13.2 percent
increase for the 1990s and comparable to the growth during the 1980s of 9.8 percent increase for the 1990s and comparable to the growth during the 1980s of 9.8 percent (Figure 1). Since 1900, only the 1930s experienced a lower growth rate (7.3 percent) (Figure 1). Since 1900, only the 1930s experienced a lower growth rate (7.3 percent) than this past decade.1than this past decade.1
• From 2000 to 2010, regional growth was much faster for the South and West (14.3 and From 2000 to 2010, regional growth was much faster for the South and West (14.3 and 13.8 percent, respectively) than for the Midwest (3.9 percent) and Northeast (3.2 13.8 percent, respectively) than for the Midwest (3.9 percent) and Northeast (3.2 percent)percent)
(Table 1, Figure 2). The South grew by 14.3 million over the decade to (Table 1, Figure 2). The South grew by 14.3 million over the decade to 114.6 million people, while the West increased by 8.7 million to reach 71.9 114.6 million people, while the West increased by 8.7 million to reach 71.9 million people—surpassing the population of the Midwest. The Midwest million people—surpassing the population of the Midwest. The Midwest gained 2.5 million, increasing that region’s population to 66.9 million, and gained 2.5 million, increasing that region’s population to 66.9 million, and the Northeast’s gain of 1.7 million brought that region’s the Northeast’s gain of 1.7 million brought that region’s

April 15, 2011 - CLWApril 15, 2011 - CLW 1111

April 15, 2011 - CLWApril 15, 2011 - CLW 1212
Native Hawaiians and Other Pacific IslandersNative Hawaiians and Other Pacific Islanders
• New Census Bureau data show that Native Hawaiians and Other Pacific Islanders are New Census Bureau data show that Native Hawaiians and Other Pacific Islanders are continuing to become a growing part of our nation’s economy. Between 2002 and continuing to become a growing part of our nation’s economy. Between 2002 and 2007, Native Hawaiian- and Other Pacific Islander-owned businesses saw a growth of 2007, Native Hawaiian- and Other Pacific Islander-owned businesses saw a growth of 31 percent in number, while U.S. businesses overall only increased 18 percent 31 percent in number, while U.S. businesses overall only increased 18 percent between 2002 and 2007. Native Hawaiian-and Other Pacific Islander-owned between 2002 and 2007. Native Hawaiian-and Other Pacific Islander-owned businesses also saw a 52 percent increase in revenue, while total business receipts businesses also saw a 52 percent increase in revenue, while total business receipts for U.S. businesses increased only 33 percent.for U.S. businesses increased only 33 percent.
• This glimpse into the economic activity of Native Hawaiians and Other Pacific This glimpse into the economic activity of Native Hawaiians and Other Pacific Islanders comes from the Islanders comes from the Survey of Businesses Owners, which is conducted every , which is conducted every five years. This survey is the only regularly collected, comprehensive economic data five years. This survey is the only regularly collected, comprehensive economic data on Native Hawaiians and Other Pacific Islanders and provides an important look at on Native Hawaiians and Other Pacific Islanders and provides an important look at them as entrepreneurs.them as entrepreneurs.
• Collected for the business year 2007, the data tell how much these businesses Collected for the business year 2007, the data tell how much these businesses earned, how many people they employed, and the kinds of businesses they are in. earned, how many people they employed, and the kinds of businesses they are in. For example, construction and retail trade accounted for 44 percent of Native For example, construction and retail trade accounted for 44 percent of Native Hawaiian- and Other Pacific Islander-owned business receipts.Hawaiian- and Other Pacific Islander-owned business receipts.
• Data show that about 56 percent of all Native Hawaiian- and Other Pacific Islander Data show that about 56 percent of all Native Hawaiian- and Other Pacific Islander businesses were owned by people of Native Hawaiian origin in 2007. Guamanian- or businesses were owned by people of Native Hawaiian origin in 2007. Guamanian- or Chamorro-owned businesses accounted for 10 percent, Samoan-owned businesses Chamorro-owned businesses accounted for 10 percent, Samoan-owned businesses for 8.0 percent, and businesses owned by people of Other Pacific Islander descent for for 8.0 percent, and businesses owned by people of Other Pacific Islander descent for 25 percent.25 percent.
• Future data from the survey, to be released in June, will allow you to dig deeper into Future data from the survey, to be released in June, will allow you to dig deeper into the characteristics of the owners and their businesses—their age and education, the characteristics of the owners and their businesses—their age and education, sources of start up capital and more.sources of start up capital and more.
• More information on More information on Native Hawaiian- and Other Pacific Islander-owned firms for your for your geographic area is available on the Census Bureau website.geographic area is available on the Census Bureau website.

April 15, 2011 - CLWApril 15, 2011 - CLW 1313
Percent Change in Minority by Percent Change in Minority by CountyCounty

April 15, 2011 - CLWApril 15, 2011 - CLW 1414
2010 Census2010 Census• During the 2010 Census, questions on race and Hispanic origin were asked of every During the 2010 Census, questions on race and Hispanic origin were asked of every
individual living in the United States. These data provide a snapshot of race and individual living in the United States. These data provide a snapshot of race and Hispanic origin in the United States.Hispanic origin in the United States.
• According to the According to the 2010 Census, 308.7 million people resided in the United States on , 308.7 million people resided in the United States on April 1, 2010, an increase of 27.3 million people, or 9.7 percent, between 2000 and April 1, 2010, an increase of 27.3 million people, or 9.7 percent, between 2000 and 2010. The vast majority of the growth in the total population came from increases in 2010. The vast majority of the growth in the total population came from increases in those who reported their race(s) as something other than White alone and those who those who reported their race(s) as something other than White alone and those who reported their ethnicity as Hispanic or Latino.reported their ethnicity as Hispanic or Latino.
• More than half of the growth in the total population of the United States More than half of the growth in the total population of the United States between 2000 and 2010 was due to the increase in the Hispanic population.between 2000 and 2010 was due to the increase in the Hispanic population.
• Between 2000 and 2010, the Hispanic population grew by 43 percent. The Hispanic Between 2000 and 2010, the Hispanic population grew by 43 percent. The Hispanic population increased by 15.2 million between 2000 and 2010, accounting for over population increased by 15.2 million between 2000 and 2010, accounting for over half of the 27.3 million increase in the total population of the United States.half of the 27.3 million increase in the total population of the United States.
• The overwhelming majority of the total population of the United States The overwhelming majority of the total population of the United States reported only one race in 2010.reported only one race in 2010.
• In the 2010 Census, 97 percent of all respondents reported only one race. The largest In the 2010 Census, 97 percent of all respondents reported only one race. The largest group reported White alone (72 percent). The Black or African American alone group reported White alone (72 percent). The Black or African American alone population represented 13 percent of the total population. In addition, 0.9 percent of population represented 13 percent of the total population. In addition, 0.9 percent of respondents indicated American Indian and Alaska Native alone and about 5 percent respondents indicated American Indian and Alaska Native alone and about 5 percent identified their race as Asian alone. The smallest major race group was Native identified their race as Asian alone. The smallest major race group was Native Hawaiian and Other Pacific Islander alone, representing 0.2 percent of the total Hawaiian and Other Pacific Islander alone, representing 0.2 percent of the total population.population.
• The examination of racial and ethnic group distributions nationally shows that while The examination of racial and ethnic group distributions nationally shows that while the non-Hispanic White alone population is still numerically and proportionally the the non-Hispanic White alone population is still numerically and proportionally the largest major race and ethnic group in the United States, it is also growing at the largest major race and ethnic group in the United States, it is also growing at the slowest rate.slowest rate.
• Throughout the decade, the Census Bureau will release additional information on Throughout the decade, the Census Bureau will release additional information on race and Hispanic origin population groups, which will provide more insights to the race and Hispanic origin population groups, which will provide more insights to the nation’s racial and ethnic diversity.nation’s racial and ethnic diversity.

April 15, 2011 - CLWApril 15, 2011 - CLW 1515
What’s the Difference?What’s the Difference?
•EEO – StatutoryEEO – Statutory– All personnel actions free from discriminationAll personnel actions free from discrimination– Enforcement mechanismEnforcement mechanism
•Affirmative Action – StatutoryAffirmative Action – Statutory– Requires AAPs / GoalsRequires AAPs / Goals– Recruitment & OutreachRecruitment & Outreach– Special Emphasis – Minorities and WomenSpecial Emphasis – Minorities and Women
•Diversity – VoluntaryDiversity – Voluntary– Process driven/Mission FocusProcess driven/Mission Focus– Inclusive v. ExclusiveInclusive v. Exclusive– Retention / Work Environment/EmployeeRetention / Work Environment/Employee
DevelopmentDevelopment

April 15, 2011 - CLWApril 15, 2011 - CLW 1616
The Diversity ConnectionThe Diversity Connection
EEO
AA
Civil RightsAct &
SubsequentLegislation
DiversityManagement
Action Plans
Goals
Special Emphasis
Discrimination
Complaints
Protected Groups
Non Statutory
Programs/Laws Process
Work Environment
Inclusive
Effectiveness
Quantitative/Legal Compliance
Qualitative/Retention
Retention

April 15, 2011 - CLWApril 15, 2011 - CLW 1717
BBackground look at Diversity ackground look at Diversity Management @ DOC & NOAAManagement @ DOC & NOAA
• DOC Seven Diversity TenetsDOC Seven Diversity Tenets– InclusionInclusion– Opportunity Opportunity – ComprehensivenessComprehensiveness– AccessibilityAccessibility– TrainingTraining– ManagementManagement– EvaluationEvaluation
• The late Ron Brown (2/22/94) stated The late Ron Brown (2/22/94) stated that “Diversity is the key to the that “Diversity is the key to the future success of the Department of future success of the Department of Commerce. We are charged with Commerce. We are charged with effectively competing in a world-effectively competing in a world-wide arena and, if we are to wide arena and, if we are to succeed in that competition, each of succeed in that competition, each of us must embrace the value of us must embrace the value of diversity as being critical to the diversity as being critical to the achievement of our mission”achievement of our mission”
• NOAA’s Five Phase approach to NOAA’s Five Phase approach to Managing DiversityManaging Diversity (Dr. Roosevelt Thomas)(Dr. Roosevelt Thomas)
– AdvocacyAdvocacy• Getting stake holder to buy the concepts and Getting stake holder to buy the concepts and
process.process.– DiagnosticDiagnostic
• Discovering where the organization is today.Discovering where the organization is today.– PlanningPlanning
• Determining where the organization wants to Determining where the organization wants to go and what is available to help it get there.go and what is available to help it get there.
– ImplementationImplementation• Determining the mechanisms for change.Determining the mechanisms for change.
– FeedbackFeedback• Measuring and setting actions for continuous Measuring and setting actions for continuous
improvement.improvement.
• Managing the Diversity Life Cycle – The Managing the Diversity Life Cycle – The process is continuous as the organization process is continuous as the organization pursues an organizational culture change pursues an organizational culture change process of improving the work environment process of improving the work environment for all employees. The managing diversity for all employees. The managing diversity initiatives listed do not represent static initiatives listed do not represent static actions that can be checkedactions that can be checked off a list.off a list.
April 15, 2011 - CLWApril 15, 2011 - CLW 1818
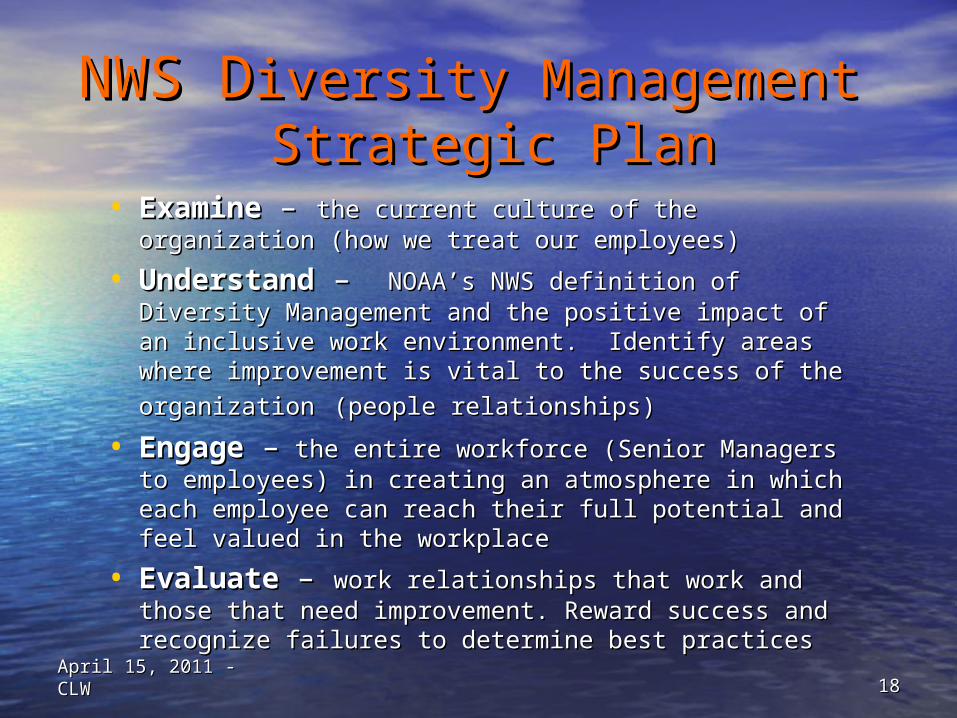
NWS DNWS Diversity Management iversity Management Strategic PlanStrategic Plan
• Examine Examine – – the current culture of the organization the current culture of the organization (how we treat our employees)(how we treat our employees)
• UnderstandUnderstand – – NOAA’s NWS definition of NOAA’s NWS definition of Diversity Management and the positive impact of an Diversity Management and the positive impact of an inclusive work environment. Identify areas where inclusive work environment. Identify areas where improvement is vital to the success of the improvement is vital to the success of the
organizationorganization (people relationships)(people relationships)
• EngageEngage –– the entire workforce (Senior Managers to the entire workforce (Senior Managers to employees) in creating an atmosphere in which each employees) in creating an atmosphere in which each employee can reach their full potential and feel employee can reach their full potential and feel valued in the workplacevalued in the workplace
• EvaluateEvaluate – – work relationships that work and those work relationships that work and those that need improvement. Reward success and that need improvement. Reward success and recognize failures to determine best practices recognize failures to determine best practices

The National Weather The National Weather ServiceService
April 15, 2011 - CLWApril 15, 2011 - CLW 1919

Why are the Top Ten Offices Why are the Top Ten Offices Doing so Well?Doing so Well?
• Better Science and Technology? No.Better Science and Technology? No.
• Easier Verification? No.Easier Verification? No.
• Easier Storms? No.Easier Storms? No.
• More Practice? No.More Practice? No.
• Better at Diversity Management???Better at Diversity Management???

HypothesisHypothesisA tornado warning is arguably the most challenging of all products issued by NWS forecasters. Sustained, highperformance in tornado warnings, requires a highly-trained,dedicated staff who can work well as a team under very stressfulconditions.
If the benefits of an inclusive, supportive, and flexible work environment, where managers foster personal development, teamwork and empowerment, among their employees, are to be seen, it would be in tornado warning verification statistics.
Offices that score high in tornado warning verification statistics will also score high in SFA results compared to offices with poor tornado verification statistics.

MethodologyMethodology
• Obtained 2000 & 2001 Tornado Warning Obtained 2000 & 2001 Tornado Warning Statistics for each NWS forecast officeStatistics for each NWS forecast office
• Ranked all forecast offices by skillRanked all forecast offices by skill
• Requested a special aggregate report of NOAA’s Requested a special aggregate report of NOAA’s all-employee survey (SFA) for the Top 10 and all-employee survey (SFA) for the Top 10 and Bottom 10 forecast offices in skillBottom 10 forecast offices in skill
• Compared the two reports for significant Compared the two reports for significant differencesdifferences

SupervisionSupervision
82
7063
0
10
20
30
40
50
60
70
80
90
100
How would your rate theoverall job done by yourimmediate supervisor?
% F
avor
able
Top TenPerformers
All NWS
Bottom TenPerformers

FairnessFairness
74
6155
0
10
20
30
40
50
60
70
80
90
100
There is trust betweenemployees and my immediate
supervisor
% F
avor
able
Top TenPerformers
All NWS
Bottom TenPerformers

7769
60
0
10
20
30
40
50
60
70
80
90
100
How would you rate the extentto which management treatsyou with respect and dignity
% F
avor
able
Top TenPerformers
All NWS
Bottom TenPerformers
FairnessFairness

FairnessFairness
69
5853
0
10
20
30
40
50
60
70
80
90
100
How would you rate theconsistency with which policies
are administered where youwork
% F
avor
able
Top TenPerformers
All NWS
Bottom TenPerformers

FairnessFairness
69
5853
0
10
20
30
40
50
60
70
80
90
100
How would you rate theconsistency with which policies
are administered where youwork
% F
avor
able
Top TenPerformers
All NWS
Bottom TenPerformers

Findings from Phone Interviews of Top Ten Findings from Phone Interviews of Top Ten Forecast OfficesForecast Offices
• Manager leadership demonstrated through action Manager leadership demonstrated through action (working shifts, severe weather) often in a subordinate (working shifts, severe weather) often in a subordinate rolerole
• Managers do not micro-manage severe weather Managers do not micro-manage severe weather operationsoperations
• Some managers had anti-role models Some managers had anti-role models
• Managers back up their forecasters’ decisions Managers back up their forecasters’ decisions
• Managers foster open dialogManagers foster open dialog
• Managers are careful in hiring people to enhance the Managers are careful in hiring people to enhance the existing team (consider both skills and personality)existing team (consider both skills and personality)
• Office commitment to improvement Office commitment to improvement

Findings from Phone Interviews of Top Ten Findings from Phone Interviews of Top Ten Forecast OfficesForecast Offices
• Managers work closely with the union representativesManagers work closely with the union representatives
• Managers support family/personal needsManagers support family/personal needs
• Offices seem to have low staff turnoverOffices seem to have low staff turnover
• Managers have strong focus on making the work Managers have strong focus on making the work satisfying and enjoyable for their employeessatisfying and enjoyable for their employees
• Managers work to make sure that all employees are Managers work to make sure that all employees are appreciated (both mets and non-mets)appreciated (both mets and non-mets)
• Managers reward quickly and oftenManagers reward quickly and often
• Management team support manager’s goalsManagement team support manager’s goals

NWS Forecast Offices and Regions NWS Forecast Offices and Regions **
* Offices west of the Rockies were excluded from our analyses, as well as those reporting fewer than five tornado events in 2001/2002 and those with fewer than five employees completing the survey.

Weather Forecast Office (WFO) Weather Forecast Office (WFO) CultureCulture
CharacteristicsCharacteristics• ““Family” unit of 20-30 Family” unit of 20-30
people, isolated from other people, isolated from other officesoffices
• Relatively homogenous in Relatively homogenous in gender, ethnicity, agegender, ethnicity, age
• Experienced (10-25 yrs)Experienced (10-25 yrs)• Unionized – can be Unionized – can be
contentiouscontentious• High value placed on High value placed on
Science and Technology Science and Technology and Dedication to Missionand Dedication to Mission

Which Storms are Which Storms are Tornadic?Tornadic?Has the radar identified a strong storm?
Are there signs of rotation in the storm?
Are there spotter reports of a funnel with the storm?
Have other storms in the area produced tornadoes?
Where is the storm heading?
Will it remain tornadic?

Key Measures on 50 WFOsKey Measures on 50 WFOs• Data for 50 Weather Forecast Offices:Data for 50 Weather Forecast Offices:
– Critical Success Index (CSI) – key measure of tornado Critical Success Index (CSI) – key measure of tornado warning performance that combines hits, misses, and false warning performance that combines hits, misses, and false alarmsalarms
• Hits: Number of positive forecasts followed by an event Hits: Number of positive forecasts followed by an event occurrenceoccurrence
• Misses: Number of occurrences that were not predictedMisses: Number of occurrences that were not predicted
• False Alarms: Number of positive forecasts that were not False Alarms: Number of positive forecasts that were not accompanied by an eventaccompanied by an event
– Sick leave hours per month per employeeSick leave hours per month per employee– Employee Satisfaction Employee Satisfaction – from a Sirota survey of 12,000 – from a Sirota survey of 12,000
National Oceanic and Atmospheric Administration (NOAA) National Oceanic and Atmospheric Administration (NOAA) employeesemployees
• Conducted as part of a diversity strategyConducted as part of a diversity strategy
• Approximately 130 multiple-choice questionsApproximately 130 multiple-choice questions
• Administered through February of 2002Administered through February of 2002

• Data on 50 Weather Forecast Offices (continued):Data on 50 Weather Forecast Offices (continued):– Controlled variablesControlled variables – several variables thought to affect – several variables thought to affect
tornado warning performance accuracy were statistically tornado warning performance accuracy were statistically controlled for:controlled for:
• Employee tenureEmployee tenure
• Education levelEducation level
• Number of employees at each siteNumber of employees at each site
• GeographyGeography
• Number of tornado eventsNumber of tornado events
• F-Scale of tornadoesF-Scale of tornadoes– Other potential influences were comparable across the officesOther potential influences were comparable across the offices::
• TechnologyTechnology
• Training opportunitiesTraining opportunities
Key Measures on 50 WFOs (continued)Key Measures on 50 WFOs (continued)

Research Question: How do we explain these CSI performance differences for tornado warnings across WFO’s?
Poor Performance Better Performance
Nu
mb
er
of
We
ath
er
Fo
rec
as
tin
g O
ffic
es
Variation in CSI Scores Across OfficesVariation in CSI Scores Across Offices
.445 - .488
.403 - .445
.360 - .403
.318 - .360
.275 - .318
.233 - .275
.190 - .233
.148 - .190
.105 - .148
.063 - .105
10
8
6
4
2
0

Sick leave hrs per month per employee (actual sick leave hours per month) -0.45**
My last performance appraisal was on schedule 0.42**
Reasonable accommodations are made for persons with disabilities (e.g., availability of sign language interpreters, ramps, Braille) 0.38**
I know the process for voicing a complaint or filing a grievance through the union 0.36**
In my Line/Staff Office, work practices and procedures that are no longer needed are eliminated 0.34**
I understand the relationships between the NOAA Line/Staff Offices 0.30*
Differences among individuals are understood and accepted (e.g., gender, race, religion, age, sexual orientation, disability) 0.28*
Diverse groups (e.g., work teams, customers) participate in the development of performance measures where I work 0.28*
The results of the 1998 SFA were used constructively by management 0.26*
I know where to find information concerning my rights as a federal employee 0.25*
I know how to contact the appropriate union official if I need to 0.24*
I understand that the union is the exclusive representative of NWS bargaining unit employees 0.24*
Highest Correlates of Tornado Warning Highest Correlates of Tornado Warning
PerformancePerformance r
Pairwise n = 50; * p < .05; ** p < .01

54%
7%
20%
12%7%
Unknown factors
Accommodations for disabled
Regression AnalysisRegression Analysis
* Results based upon stepwise regression analysis
Performance appraisal on schedule
Sick leave
Know process for voicing complaint through union
Nearly half of the differences in WFOs’ performance are accounted for by four variables:

Highest Survey Correlates of Sick Highest Survey Correlates of Sick LeaveLeave
• A clear pattern of relationships emerges:A clear pattern of relationships emerges:
– Work group cooperation and teamworkWork group cooperation and teamwork
• Within work groups (Within work groups (rr = -0.30 *) = -0.30 *)
• Between work groups (Between work groups (rr = -0.41 **) = -0.41 **)
– Supervisor behaviorSupervisor behavior
• Responsive to employee ideas (Responsive to employee ideas (rr = -0.40 **) = -0.40 **)
• Fair (Fair (rr = -0.36 *) and Supportive ( = -0.36 *) and Supportive (rr = -0.35 *) = -0.35 *)
• Relationship with union representative (Relationship with union representative (rr = -0.40 **) = -0.40 **)
– Performance and diversityPerformance and diversity
• In other words . . . In other words . . .
– WFO culture has a strong and consistent impact on sick leaveWFO culture has a strong and consistent impact on sick leave
– And, ultimately on make argertornado warningsAnd, ultimately on make argertornado warnings
* p < .05; ** p < .01

CSI(Performance)
Sick leave
Accommodations for disabled
Performance appraisal on schedule
Performance
Enablement
Employee
Relations
Conceptual ModelConceptual Model
Know process for voicing complaint through union
0.283*
0.310*
0.263*
-0.355*
* Values are Standardized Beta coefficients
HR data
Survey data
The most important factors in tornado warning performance reflect managerial effectiveness: Performance Orientation and Employee Relations

0
0.1
0.2
0.3
0.4
0.5
CS
I Sco
re
CSI Trend Line
NWS Tornado Warning NWS Tornado Warning PerformancePerformance
2007 NWS Goal
XX

0
0.1
0.2
0.3
0.4
0.5
CS
I Sco
re
2007 NWS Goal
WFOs performing best on cultural variables have reached the NWS goal four years ahead of schedule:
NWS Tornado Warning PerformanceNWS Tornado Warning Performance
Top Third of WFOs on Culture Index*
Bottom Third of WFOs on Culture Index*
*The Culture Index comprises the following items: Performance appraisal on schedule, Accomodations for disabled and Know process for voicing complaint through union
XX
.21
.34

ConclusionsConclusions Improvements in technology are extremely important to
improve tornado warning performance. They promise to raise the performance of all offices.
1. In addition, we have found that leadership in individual National Weather Service offices also has a demonstrable impact on performance.
In fact, the quantitative goal of excellence the National Weather Service has set for itself could be achieved by attending to these cultural variables alone.

Conclusions (cont.)Conclusions (cont.)• Where diversity is managed better, a better job is done carrying out Where diversity is managed better, a better job is done carrying out
the National Weather Service mission!the National Weather Service mission!
• Where diversity is managed better, the cost of carrying out the Where diversity is managed better, the cost of carrying out the National Weather Service mission is reduced!National Weather Service mission is reduced!
• SFA 2002 results show that the National Weather Service should SFA 2002 results show that the National Weather Service should focus on aligning the management practices in the all our offices focus on aligning the management practices in the all our offices with the NOAA Diversity Vision. An improvement strategy based with the NOAA Diversity Vision. An improvement strategy based only on science and technology without an aggressive diversity only on science and technology without an aggressive diversity management component is likely to fall short of the mark. management component is likely to fall short of the mark.
• This is the Business Case for Diversity Management for NOAA’s This is the Business Case for Diversity Management for NOAA’s National Weather ServiceNational Weather Service

Flexible Policies/ProceduresFlexible Policies/ProceduresTeamworkTeamworkOpen CommunicationOpen CommunicationFocus on Performance Focus on Performance Goals Set and TrackedGoals Set and TrackedStrong Customer OrientationStrong Customer OrientationEmphasis on InnovationEmphasis on InnovationTrust and RespectTrust and RespectGood Relations with UnionGood Relations with Union
Rigid Policies/ProceduresRigid Policies/ProceduresUnresolved ConflictUnresolved ConflictClimate of FearClimate of FearLack of EmpowermentLack of EmpowermentPoor Sense of GoalsPoor Sense of GoalsLack of Customer FocusLack of Customer FocusResistance to ChangeResistance to ChangeIgnorance of Diversity IssuesIgnorance of Diversity IssuesPoor Relations with UnionPoor Relations with Union

What does Diversity have to do with it?What does Diversity have to do with it?
Isn’t high performance just the result of Isn’t high performance just the result of leadership and good management?leadership and good management?

TRADITIONAL LEADERSHIP: TRADITIONAL LEADERSHIP:
The burden of accommodation falls on the The burden of accommodation falls on the employees. They must accommodate the style employees. They must accommodate the style and preferences of the manager.and preferences of the manager.
DIVERSITY-BASED LEADERSHIP: DIVERSITY-BASED LEADERSHIP:
The manager and employees work together The manager and employees work together to accommodate the styles and preferences of to accommodate the styles and preferences of everyone.everyone.

That was 2003.That was 2003.What about nowWhat about nowin 2009?in 2009?
Do the conclusionsDo the conclusionsstill hold?still hold?
Answer: Yes!Answer: Yes!

Performance vs Culture Performance vs Culture IndexIndex
00.050.10.150.20.250.30.350.4
Years
Ski
ll (
CS
I)
ChangeChangeto Storm-basedto Storm-basedTornadoTornadowarningswarnings
TOP 1/3TOP 1/3
BOTTOM 1/3BOTTOM 1/3
MID 1/3MID 1/3


Performance vs Culture Performance vs Culture IndexIndex
00.050.10.150.20.250.30.350.4
Years
Ski
ll (
CS
I)
ChangeChangeto Storm-basedto Storm-basedTornadoTornadowarningswarnings
TOP 1/3TOP 1/3
TORNADOTORNADOALLEY WFOsALLEY WFOs

Additional ConclusionsAdditional Conclusions A culture of high performance is enduring. In 2009, seven
years after it was defined following the 2002 SFA, the Cultural Index continues to be a good predictor of tornado warning performance at individual WFOs.
The culture of high performance at the Top 1/3 WFOs in the study survived a major operations concept change ( i.e. County-based to Storm-based tornado warnings). A culture of high performance is also a culture of change management.
The key elements of a culture of high performance should apply to all operational and headquarters tasks and workgroups.
The business case for Diversity Management in NOAA is still valid.

April 15, 2011 - CLWApril 15, 2011 - CLW 5252
NWS Women Profile By NWS Women Profile By WorkforceWorkforce
85%
15%
Total WF Total Women
84%
16%
Total WF Total Women
Total Total WorkforceWorkforce
Total WomenTotal Women
4,8254,825 900900
NWS Women NWS Women FY 06FY 06
NWS Women NWS Women FY 07FY 07
Total WorkforceTotal Workforce Total WomenTotal Women
4,8314,831 884884

NWS Workforce FY 2008NWS Workforce FY 2008137
170
41
236
4299
Black
Hispanic
Asian
American Indian
White

April 15, 2011 - CLWApril 15, 2011 - CLW 5454
NWS Women Profile By NWS Women Profile By WorkforceWorkforce
80%
20%
Total Men Total Women
83%
17%
Total WF Total Women
Total MenTotal Men Total Total WomenWomen
3,9693,969 981981
NWS Women NWS Women FY 2009FY 2009
NWS Women NWS Women FY 2010FY 2010
Total MenTotal Men Total WomenTotal Women
3,9553,955 962962

April 15, 2011 - CLWApril 15, 2011 - CLW 5555
CLF and NWS Women and Men CLF and NWS Women and Men Profiles By WorkforceProfiles By Workforce
53%
47%
Total Men Total Women
80%
20%
Total Men Total Women
Total MenTotal Men Total WomenTotal Women
3,9693,969 981981
CLF CLF FY 2010FY 2010
NWS NWS FY 2010FY 2010
Total MenTotal Men Total WomenTotal Women
188,000,00188,000,0000
72,000,00072,000,000

April 15, 2011 - CLWApril 15, 2011 - CLW 5656
Diversity ManagementDiversity Management
Managing diversity is a long-term change Managing diversity is a long-term change strategy enabling the organization to examine strategy enabling the organization to examine its fundamental values and culture to its fundamental values and culture to determine whether all employees are reaching determine whether all employees are reaching their full potential and making maximum their full potential and making maximum contributions to the mission. Effective contributions to the mission. Effective Diversity management promotes productivity Diversity management promotes productivity and respect in the workplace for differences and respect in the workplace for differences and similarities each person brings to the and similarities each person brings to the work place.work place.

April 15, 2011 - CLWApril 15, 2011 - CLW 5757
Benefits of a DMIBenefits of a DMI• Boosts employee moraleBoosts employee morale• Increases employee productivity by utilizing Increases employee productivity by utilizing
talentstalents• Creates a work environment that allows Creates a work environment that allows
everyone to reach their full potential everyone to reach their full potential ((inclusivenessinclusiveness))
• Provides multiple options for dealing with Provides multiple options for dealing with workplace diversity workplace diversity
• Reduces complaints and grievances Reduces complaints and grievances • Seeks multiple perspectives on problem solvingSeeks multiple perspectives on problem solving
– ADR, EEO, Union, EAP, WFL CenterADR, EEO, Union, EAP, WFL Center• Organizational Necessity Organizational Necessity ((Protecting Life and PropertyProtecting Life and Property))

April 15, 2011 - CLWApril 15, 2011 - CLW 5858
Diversity Adoption ProcessDiversity Adoption Process
2.5
13.5
34 34
16
002.5
05
10152025303540
Pe
rce
nt
Marilyn Loden & Judith Rosner Workforce America!

April 15, 2011 - CLWApril 15, 2011 - CLW 5959
Diversity Management Best Diversity Management Best PracticesPractices• Diversity Management Strategic PlanDiversity Management Strategic Plan
• Diversity Management CouncilDiversity Management Council• Creating Implementation GuidelinesCreating Implementation Guidelines (Strategic Plan)(Strategic Plan)
• Conducting Regional Diversity ConferencesConducting Regional Diversity Conferences– Southern Region Cell Concept Southern Region Cell Concept – OEODM NWS HDQTS participationOEODM NWS HDQTS participation
• Developing Diversity Management Marketing Developing Diversity Management Marketing PlanPlan– Administer Poster ContestAdminister Poster Contest– Web based Diversity Management Tool BoxWeb based Diversity Management Tool Box– E-Learning Diversity Curriculum E-Learning Diversity Curriculum – Develop NWS PPPDevelop NWS PPP
• Agency initiatives Agency initiatives (AOP, training, awards, strategic (AOP, training, awards, strategic plans, etc..)plans, etc..)

NWS Diversity NWS Diversity ManagementManagement
April 15, 2011 - CLWApril 15, 2011 - CLW 6060

April 15, 2011 - CLWApril 15, 2011 - CLW 6161
Advancement and Advancement and DevelopmentDevelopment• TrainingTraining
• Agency Career Development ProgramsAgency Career Development Programs• Administrative Staff DevelopmentAdministrative Staff Development• Mid-Career Development ProgramsMid-Career Development Programs• SES Candidate Programs SES Candidate Programs
(opm.gov/SES/candevprg.html)(opm.gov/SES/candevprg.html)• Aspiring Leader ProgramsAspiring Leader Programs• New Leader Program (GS7-11)New Leader Program (GS7-11)• Executive Leadership Program (GS11-13)Executive Leadership Program (GS11-13)• Executive Potential Program (GS13-15)Executive Potential Program (GS13-15)• Congressional Fellows Program (GS13-15)Congressional Fellows Program (GS13-15)• SES Developmental SeminarsSES Developmental Seminars• Human Resources Professionals Human Resources Professionals
Development Leadership ProgramDevelopment Leadership Program

April 15, 2011 - CLWApril 15, 2011 - CLW 6262
Federal Learning &Federal Learning &Exchange ProgramsExchange Programs
• Intergovernmental Personnel Act Mobility Program Intergovernmental Personnel Act Mobility Program (www.opm.gov/programs/ipa)(www.opm.gov/programs/ipa)
• Detail and Transfer of Federal Employees to International Organizations Detail and Transfer of Federal Employees to International Organizations (www.opm.gov/employ/internat)(www.opm.gov/employ/internat)
• Executive in Resident Program (www.leadership.opm.gov/content.cfm?Executive in Resident Program (www.leadership.opm.gov/content.cfm?CAT=EIRP)CAT=EIRP)
Individual Career Enhancing Activities Individual Career Enhancing Activities • Rotational Assignments and detailsRotational Assignments and details
• MentoringMentoring
• Professional AssociationsProfessional Associations
• Retention Incentives (www.opm.gov/oca/pay/HTML/RETALLFS.asp)Retention Incentives (www.opm.gov/oca/pay/HTML/RETALLFS.asp)
• Student Load Repayment (www.opm.gov/oca/pay/StudentLoan/index.aspStudent Load Repayment (www.opm.gov/oca/pay/StudentLoan/index.asp
• Relocation Incentives (www.opm.gov/oca/pay/HTML/RELBONFS.asp)Relocation Incentives (www.opm.gov/oca/pay/HTML/RELBONFS.asp)

April 15, 2011 - CLWApril 15, 2011 - CLW 6363
Key Partnerships in Key Partnerships in Diversity ManagementDiversity Management
• Employee Assistance Programs (EAP)Employee Assistance Programs (EAP)• Work and Family Life Center (W&FLC)Work and Family Life Center (W&FLC)• Employee UnionsEmployee Unions• Alternate Dispute Resolution (ADR) Alternate Dispute Resolution (ADR) • Human Resources Mgmt Office (WFMO)Human Resources Mgmt Office (WFMO)• Agency Training OfficeAgency Training Office• Supervisors and ManagersSupervisors and Managers• Regional Committees/EmployeesRegional Committees/Employees
All are vital players/components of a All are vital players/components of a successful Diversity Management Processsuccessful Diversity Management Process

April 15, 2011 - CLWApril 15, 2011 - CLW 6464
MeasurementMeasurement•Promotion opportunitiesPromotion opportunities•TrainingTraining
– Development opportunitiesDevelopment opportunities– Details, cross trainingDetails, cross training– Upward mobilityUpward mobility– Training Conferences, symposiumsTraining Conferences, symposiums
•Return on InvestmentReturn on Investment•RetentionRetention•Promotability outside the Promotability outside the
organizationorganization

NWS Promotions FY 2006-NWS Promotions FY 2006-20102010
FY 2010
17
13
5
474
30
Black
Hispanic
Asian
AmericanIndian
White

NWS Promotions FY 2006-NWS Promotions FY 2006-2010 2010
FY 2008
17
22
5
512
43
Black
Hispanic
Asian
AmericanIndian
White
FY 2009
3
3
0
5
111
Black
Hispanic
Asian
AmericanIndian
White

NWS Promotions FY 2006-NWS Promotions FY 2006-20102010
FY 2006
21
15
7
32
499
Black
Hispanic
Asian
AmericanIndian
White
FY 2007
2
3
1
5
105
Black
Hispanic
Asian
AmericanIndian
White

April 15, 2011 - CLWApril 15, 2011 - CLW 6868
NWS Minority Profile By NWS Minority Profile By OrganizationOrganization
6%
2%
56%
1%
35%
Am. Indian Asian Black Hispanic White
0% 1%
85%
3%
11%
Am. Indian Asian Black Hispanic White
AIAI AsianAsian BlackBlack HispaniHispanicc
WhiteWhite
0-60-6 1111 6060 0-60-6 9494
Office of the Assistant Administrator Office of Climate, Water and Weather
AIAI AsianAsian BlackBlack HispaniHispanicc
WhiteWhite
00 0-30-3 1616 0-60-6 128128

April 15, 2011 - CLWApril 15, 2011 - CLW 6969
NWS Minority Profile By NWS Minority Profile By OrganizationOrganization
7%
9%
66%
16%
2%
Am. Indian Asian Black
Hispanic White
15%
75%
8%
2%
0%
Am. Indian Asian Black Hispanic White
AIAI AsianAsian BlackBlack HispaniHispanicc
WhiteWhite
0-30-3 1515 0-60-6 0-60-6 3030
Office of Hydrologic Department Office of Science and Technology
AIAI AsianAsian BlackBlack HispaniHispanicc
WhiteWhite
00 1010 1919 0-30-3 9797

April 15, 2011 - CLWApril 15, 2011 - CLW 7070
NWS Minority Profile By NWS Minority Profile By OrganizationOrganization
80%
3%
9%
7%1%
Am. Indian Asian Black Hispanic White
AIAI AsianAsian BlackBlack HispaniHispanicc
WhiteWhite
0-30-3 19-2219-22 2727 7-107-10 246246
Office of Operational Systems

April 15, 2011 - CLWApril 15, 2011 - CLW 7171
NWS Minority Profile By NWS Minority Profile By OrganizationOrganization
95%
0%1%
3%1%
Am. Indian Asian Black Hispanic White
88%
1%1%
3%6%
1%
Am. Indian Asian Black
Hispanic White Undisclosed
AIAI AsianAsian BlackBlack HispaniHispanicc
WhiteWhite
0-30-3 4-74-7 2121 7-107-10 621621
Eastern Region Southern Region
AIAI AsianAsian BlackBlack HispaniHispanicc
WhiteWhite
7-7-1010
6-96-9 3232 5656 829829

April 15, 2011 - CLWApril 15, 2011 - CLW 7272
NWS Minority Profile By NWS Minority Profile By OrganizationOrganization
1%
2%0% 1%
96%
Am. Indian Asian Black Hispanic White
2% 1%2%
94%
1%
Am. Indian Asian Black Hispanic White
AIAI AsianAsian BlackBlack HispanicHispanic WhiteWhite
4-74-7 0-30-3 1818 8-118-11 947947
Central Region Western Region
AIAI AsianAsian BlackBlack HispanicHispanic WhiteWhite
55 1414 1010 11-1411-14 664664

April 15, 2011 - CLWApril 15, 2011 - CLW 7373
NWS Minority Profile By NWS Minority Profile By OrganizationOrganization
90%
4% 2%2%
2%
Am. Indian Asian Black Hispanic White
36%
60%
2%
2%
0%
Am. Indian Asian Black Hispanic White
AIAI AsianAsian BlackBlack HispaniHispanicc
WhiteWhite
7-107-10 4-74-7 4-74-7 0-60-6 209209
Alaska Region Pacific Region
AIAI AsianAsian BlackBlack HispaniHispanicc
WhiteWhite
00 4545 0-30-3 0-30-3 7777

April 15, 2011 - CLWApril 15, 2011 - CLW 7474
NWS Minority Profile By NWS Minority Profile By OrganizationOrganization
81%
4%
6%
9%0%
Am. Indian Asian Black Hispanic White
88%
5%
3%
3%1%0%
Am. Indian Asian Black
Hispanic White Undisclosed
AIAI AsianAsian BlackBlack HispanicHispanic WhiteWhite
0-60-6 3838 2424 1515 332332
Centers for Environmental Prediction Total NWS Workforce
AIAI AsianAsian BlackBlack HispaniHispanicc
WhiteWhite
4040 170170 237237 136136 42744274

April 15, 2011 - CLWApril 15, 2011 - CLW 7575
Roles/Responsibilities (cont’d)Roles/Responsibilities (cont’d)
• Change AgentsChange Agents (NWS Champions) (NWS Champions)– Coordinate ChangeCoordinate Change– Lead staff personsLead staff persons– Liaison to OEODMLiaison to OEODM– Participate in strategic planningParticipate in strategic planning– Conduits of informationConduits of information– Measure Success and FailuresMeasure Success and Failures– Evaluate progressEvaluate progress– Recognize/reward ChampionsRecognize/reward Champions

April 15, 2011 - CLWApril 15, 2011 - CLW 7676
Asian and Pacific IslandersAsian and Pacific Islanders
• Chinese, Japanese, Koreans, Filipinos, Chinese, Japanese, Koreans, Filipinos, South Asians (Indian, Pakistani, South Asians (Indian, Pakistani, Bangladeshis, Sri Lankans, Nepalese, Bangladeshis, Sri Lankans, Nepalese, and Burmese), Pacific Islanders, and Burmese), Pacific Islanders, Southeast Asians, (Vietnamese, Thai, Southeast Asians, (Vietnamese, Thai, Cambodians, Laotians, Hmong, Mein) Cambodians, Laotians, Hmong, Mein) as well as Indonesians and as well as Indonesians and Malaysians.Malaysians.

April 15, 2011 - CLWApril 15, 2011 - CLW 7777
AAPI Cultural Group Population AAPI Cultural Group Population Description DifficultDescription Difficult
The 2004 American Community - Asians Census The 2004 American Community - Asians Census report the population of the Asian and Pacific report the population of the Asian and Pacific Islanders in the US consists of:Islanders in the US consists of:
• 23.4% are Chinese23.4% are Chinese• 18.16% are Asian Indian18.16% are Asian Indian• 17.8% are Filipino17.8% are Filipino• 10.5% are Vietnamese10.5% are Vietnamese• 10.3% are Korean10.3% are Korean• 7.0% are Other Pacific Islander7.0% are Other Pacific Islander• 6.9% are Japanese6.9% are Japanese• 5.5% are other Asian5.5% are other Asian

April 15, 2011 - CLWApril 15, 2011 - CLW 7878
EEOC’s Naomi C. EarpEEOC’s Naomi C. Earp• Began a dialog with representative from the AAPI Federal Community in 2005 and Began a dialog with representative from the AAPI Federal Community in 2005 and
2006;2006;– Federal Asian Pacific American CouncilFederal Asian Pacific American Council– Asian American Government Executive Network Asian American Government Executive Network
• Problems not just employment but federal special emphasis programs and complaintsProblems not just employment but federal special emphasis programs and complaints
• By Fall 2007 Earp found compelling problems raised by this group:By Fall 2007 Earp found compelling problems raised by this group:– Employment;Employment;– Special Emphasis; Special Emphasis; – Complaints.Complaints.
• The AAPIWG was formed to examine the three problem areas:The AAPIWG was formed to examine the three problem areas:– Employment – 2.6 million employed, 5.9% Asian AmericansEmployment – 2.6 million employed, 5.9% Asian Americans
• At SES level less than 2% are Asian AmericansAt SES level less than 2% are Asian Americans– Special Emphasis (the forgotten Minority) Lacked supportSpecial Emphasis (the forgotten Minority) Lacked support– Complaints – 15% of all workers believed they were subjected to some sort of Discrimination or Complaints – 15% of all workers believed they were subjected to some sort of Discrimination or
unfair treatmentunfair treatment• 31% of Asians surveyed report discrimination – largest % of any ethnic group31% of Asians surveyed report discrimination – largest % of any ethnic group• African American @ 26%African American @ 26%
• Asian Population and Demographics – Dr. Paul Ong of UCLAAsian Population and Demographics – Dr. Paul Ong of UCLA– http://www.eeoc.gov/abouteeoc/meeting/7-22-08/index.hmtl..– Grown Rapidly over the past 25 yearsGrown Rapidly over the past 25 years– Over 4% of the US pop (11 mil) are of Asian and Pacific Islander decentOver 4% of the US pop (11 mil) are of Asian and Pacific Islander decent– Will increase to almost 40 mil by 2050Will increase to almost 40 mil by 2050– Education Education – Barriers “Glass Ceiling” vs “Bamboo Ceiling” Absence in Leadership position Barriers “Glass Ceiling” vs “Bamboo Ceiling” Absence in Leadership position – Perceived discriminationPerceived discrimination

April 15, 2011 - CLWApril 15, 2011 - CLW 7979
For More Information:For More Information:NWS Office of Equal Opportunity and Diversity Management NWS Office of Equal Opportunity and Diversity Management
(OEODM) (301) 713-0692(OEODM) (301) 713-0692
Charly Wells, Director, OEODM Charly Wells, Director, OEODM [email protected]@noaa.gov
The Key To Success In The Workplace Is Effective Diversity Management!The Key To Success In The Workplace Is Effective Diversity Management!


![g]kfn clw/fHosf] ;+ljwfg, @)!%g]kfn clw/fHosf] ;+ljwfg, @)!% · 1 g]kfn clw/fHosf] ;+ljwfg, @)!%g]kfn clw/fHosf] ;+ljwfg, @)!% :jl:t>L lul//fhrqmr'8fdl0f g/gf/fo0f]Toflb ljljw lj](https://img.pdfslide.net/doc/110x75/5f0297f47e708231d40509b0/gkfn-clwfhosf-ljwfg-gkfn-clwfhosf-ljwfg-1-gkfn-clwfhosf.jpg)