Embed Size (px)
Citation preview
L. Macerola1*, F. Durante1, G. Milana2, M. Nocentini3, S.Santangelo4, M.Tallini1
1D AND 2D SEISMIC SITE RESPONSE TO THE MICROZONING OF PILOT AREAS
IN L’AQUILA MUNICIPALITY
1Dipartimento di Ingegneria Civile, Edile - Architettura e Ambientale, Università degli Studi dell’Aquila; 2Istituto Nazionale di Geofisica e Vulcanologia, Roma; 3Dipartimento di Scienze Geologiche, Università degli Studi di Roma Tre; 4Stacec s.r.l., Bovolino (RC)
2. Seismic inputThe seismic input used in the numerical modeling includes four free field accelerograms at the bedrock as reported in the seismic microzoning studies of
L'Aquila Municipality (GdL MS–AQ, 2010) (Fig. 3). We used an accelerogram compatible with the Uniform Hazard Spectrum (UHS) of NTC-08 Italian
regulations and three accelerograms compatible with the spectrum obtained from deterministic attenuation relationship for specific magnitude and distance
parameters (Mw = 6.7, Repi = 10 km) (Sabetta and Pugliese, 1996) obtained from disaggregation analysis (DET_1, DET_2 and DET_3).
ABSTRACT
We report the preliminary results of the 1D and 2D numerical modeling, preparatory for Amplification Factor mapping
in Preturo and Coppito areas selected in the Western L’Aquila Plain (central Italy). The analysis was carried out on a
geological section representative of the subsoil model of those areas by using the software EERA and LSR 2D for 1D
and 2D modelling respectively.
The main preliminary results of the seismic site response concern the likely valley edge effect (double values in
pseudo-acceleration between 1D and 2D modeling in the section edges) and the lack of 2D effect in the valley center
(middle of the section).
1. IntroductionWe report the preliminary results of the 1D and 2D numerical modeling, preparatory for the 3rd level microzoning (sensu Gdl, 2008) in Coppito and Preturo
villages selected as pilot areas in L'Aquila Municipality. The analysis was performed on the Preturo-Coppito section representative of the geology of the pilot
areas (Figs. 1 and 2) (AA.VV., 2014) by using the methodologies reported in GdL MS (2008) and GdL MS–AQ (2010). The preliminary results of the seismic
response have revealed the likely valley edge effect found on the edges of the section (double values in pseudo-acceleration between 1D and 2D modeling) and
lack of 2D effect in the middle of the section.
References
AA.VV. (2014) - Progetto Pilota per la Microzonazione Sismica di Livello 1
del Comune di L'Aquila, zona Preturo-Sassa. Regione Abruzzo, L’Aquila.
Cardarelli E., Cercato M. (2010) – Relazione sulla campagna d’indagine
geofisica per lo studio della Risposta Sismica Locale della città dell’Aquila –
Prova crosshole sonsaggi S3-S4. Report DICEA-Università di Roma “La
Sapienza”.
GdL MS (2008) - Indirizzi e criteri per la microzonazione sismica. Conferenza
delle Regioni e delle Province autonome - DPC, Roma.
GdL MS–AQ (2010) - Microzonazione sismica per la ricostruzione dell’area
aquilana. Regione Abruzzo - DPC, L’Aquila.
Idriss I.M., Sun J.I. (1992) - SHAKE91 – a computer program for conducting
equivalent linear seismic response analyses of horizontally layered soils
deposits. University of California, Davis.
Lanzo G., Tallini M., Milana G., Di Capua G., Del Monaco F., Pagliaroli A.,
Peppoloni S. (2011) - The Aterno Valley strong-motion array: seismic
characterization and determination of subsoil model. BEE, 9, 1855–1875.
Rollins K.M., Evans M.D., Diehl N.B., Daily W.D. (1998) – Shear modulus
and damping relationships for gravels. JGGE, 124, 396-405.
Seed H.B., Idriss I.M. (1970) - Soil Moduli and damping factors for dynamic
response analysis. EERC-Report 70-10, Berkeley, California.
Seed H.B., Sun J.H. (1989) - Implication of site effects in the Mexico City
earthquake of September 19, 1985 for Earthquake-Resistant Design Criteria in
the San Francisco Bay Area of California. Report No. UCB/ EERC-89/03,
Earthquake Engineering Research Center, University of California, Berkeley.
P034 P127 P159 P193
CAL
all
UAP
Software LSR (Local Seismic Response 2D) can perform a 2D numerical
modeling using a finite element approach, time domain, in total stresses. It uses
also the Kelvin-Voigt subsoil model such as the more known computer code
QUAD 4M. But, LSR 2D is more friendly with respect to QUAD 4M because the
mesh calculation is easier and faster above all in case of complex geological
background such as that represented in the Preturo-Coppito section (Figs. 2 and
4). In the 2D analysis with linear equivalent and concentrated masses approach,
the subsoil model is discretized in a mesh with triangular or preferably quad shape
elements.
where: ℎ is the mesh step; 𝑉𝑠, the shear wave velocity; 𝑓𝑚𝑎𝑥, the maximum frequency considered in the analysis (usually equal to 20-25 Hz).
In this case study, the mesh generation was built with an adaptive approach, so as to preserve computational resources in favor of the control points
identified for obtaining the output results (P34, P127, P159, P193: Fig. 2). The mesh step would increase from higher values starting from bedrock (equal to
4 m) and then level off at lower values (equal to 1 m), in the proximity of the control points. The Preturo-Coppito section is bordered by outcropping
bedrock, which implies the no use of viscous dampers in the lateral section edges (AA.VV., 2014) (Fig. 4). The nonlinear soil behavior is taken into account
by performing linear equivalent analysis.
The software LSR 2D requires as input, for each soil the following parameters:
the volume weight, shear modulus, damping at low strain, Poisson's ratio;
the G/G0 vs γ and D vs γ curves (Fig. 5);
the constant α for the calculation of the characteristic value of the shear deformation starting from the maximum value of γ (𝑡) (typically equal to 0.65).
The outgoing code provides:
the maximum accelerations on all nodes;
the maximum tangential stresses and strains in each element;
the acceleration time history in the selected nodes (vertical and horizontal components).
Summarising, the main characteristics of the code LSR 2D are as follows: model: 2D; discretization: FEM; subsoil model: Kelvin-Voigt type; analysis:
equivalent linear approach in time domain; solution type: numerical derivation (u) and use of Newmark method; mesh characteristics (Δh): 4-1 m side
quad/triangle mesh.
3. The used codes (EERA and LSR 2D)The codes used in this study were for the 1D and 2D modeling, EERA (Idriss and Sun, 1992) and LSR 2D from Stacec srl (http://www.stacec.com/).
The code EERA considers a half-space that refers to a continuous model formed by horizontal soil layers of infinite extent. The linear viscoelastic model refers
to the Kelvin-Voigt rheological model (spring and viscous damper in parallel) in which it is assumed that the shear waves propagate vertically. The equivalent
linear model treats the shear modulus G and the damping ratio D as a function of the shear strain γ. In the software, G and D are calculated by iterations that
are leaded by the level of deformation of the subsoil layers induced by the earthquake shaking. In general, the results of the seismic site response are: (i) the
response spectra in pseudo-acceleration, pseudo-velocity and displacement which are basic parameters for structural design; (ii) the time history of free field
acceleration, which is necessary for the structural dynamic verification.
Summarising, the main characteristics of the code EERA are as follows: model: 1D; discretization: horizontal continuous layer; subsoil model: Kelvin-Voigt
type; analysis: equivalent linear approach in frequency domain; solution type: transfer function.
4. Subsoil model data (1D and 2D geological model - 𝐺/𝐺0 vs γ and 𝐷 vs γ curves - Vs vs depth)
We selected four sites (P34, P127, P159, P193) localised in the Preturo-Coppito section (Figs. 1, 2, 4). The P34 is placed in the NW valley edge. The used
stratigraphy is of MOPS 2024 (MOPS corresponds to the Italian acronym “Microzone Omogenee in Prospettiva Sismica” - GdL MS, 2008 - which can be
literally translated as “Homogeneous Microzones in Seismic Perspective” i.e. zones at fine scale characterised by seismic local effects: amplification and
coseismic permanent deformation, such as surface fracturing and faulting, landsliding, liquefaction, cave collapsing differential settlement). MOPS 2024 is
characterized, from the top to the bottom, by “col”, “lac” and “all” units. The latter lays upon the seismic bedrock (“CAL”: Miocene-Cretaceous stratified
limestone) (AA.VV, 2014) (Fig. 2). The P127 site is placed in the valley center and represents the condition closer to a purely 1D modeling. The stratigraphy
corresponds to that of the MOPS 2026 (Fig. 2), which is similar to that of the MOPS 2024, except to units thicknesses and Vs values (AA.VV, 2014). The point
P159 is placed in SE valley edge of the Preturo-Coppito section. The used stratigraphy is of MOPS 2013 (Fig. 2), which is characterized by “at1” unit
superimposed onto bedrock or onto “lac” and “all” units (AA.VV., 2014) (Fig. 2). P193 is selected to understand the seismic behaviour of high Vs breccia on
berock (MOPS 1022). In Fig. 6 are reported the main geophysical tests to calibrate the Vs vs depth profile used in the modeling. The 𝐺/𝐺0 vs γ and 𝐷 vs γ
curves for gravels, sands and clays are respectively from Rollins et al. (1998), Seed and Idriss (1970) and Seed and Sun (1989). The 𝐺/𝐺0 vs γ and 𝐷 vs γ
curves for bedrock are from codes EERA (Idriss and Sun, 1992) and LSR 2D (http://www.stacec.com/) (Fig. 5).
Fig. 1 – Location of the studied area. The red line refers to the Preturo-Coppito geological section
representative of the subsoil model of Western L’Aquila Plain and wich was used for the 1D and 2D
numerical modeling (see Fig. 2).
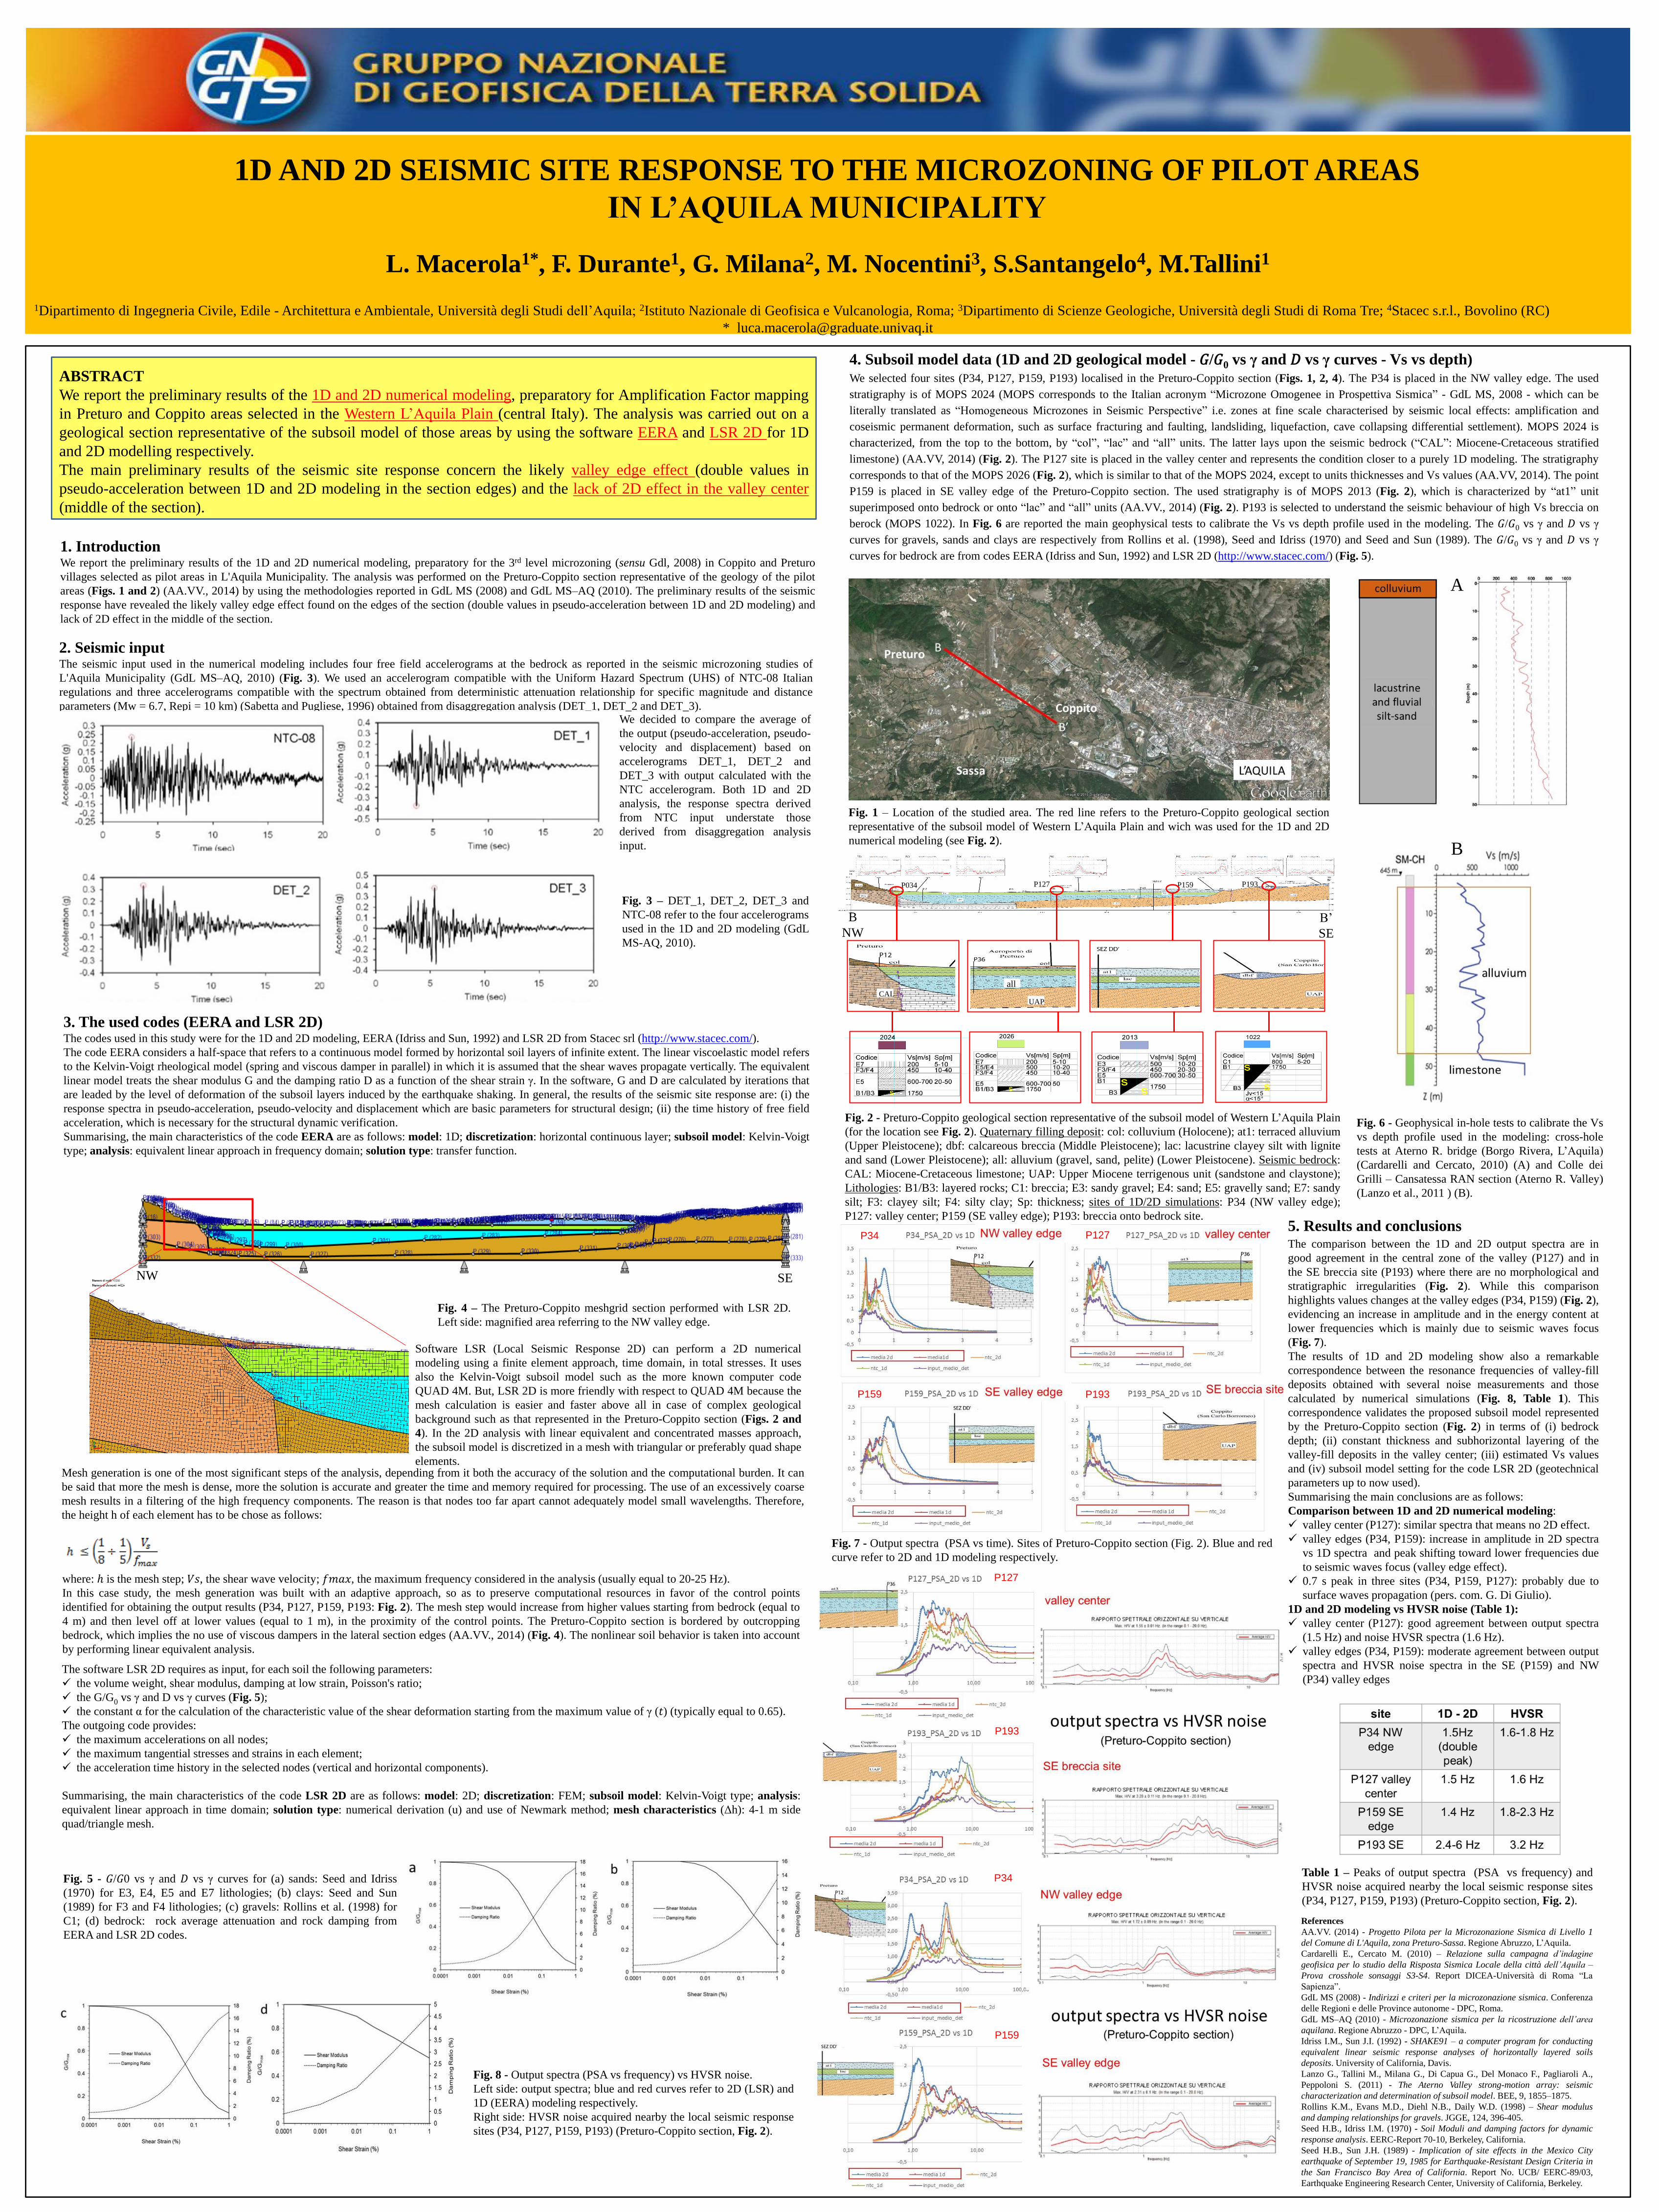
Fig. 2 - Preturo-Coppito geological section representative of the subsoil model of Western L’Aquila Plain
(for the location see Fig. 2). Quaternary filling deposit: col: colluvium (Holocene); at1: terraced alluvium
(Upper Pleistocene); dbf: calcareous breccia (Middle Pleistocene); lac: lacustrine clayey silt with lignite
and sand (Lower Pleistocene); all: alluvium (gravel, sand, pelite) (Lower Pleistocene). Seismic bedrock:
CAL: Miocene-Cretaceous limestone; UAP: Upper Miocene terrigenous unit (sandstone and claystone);
Lithologies: B1/B3: layered rocks; C1: breccia; E3: sandy gravel; E4: sand; E5: gravelly sand; E7: sandy
silt; F3: clayey silt; F4: silty clay; Sp: thickness; sites of 1D/2D simulations: P34 (NW valley edge);
P127: valley center; P159 (SE valley edge); P193: breccia onto bedrock site.
B
NW
B’
SE
A
B
Fig. 6 - Geophysical in-hole tests to calibrate the Vs
vs depth profile used in the modeling: cross-hole
tests at Aterno R. bridge (Borgo Rivera, L’Aquila)
(Cardarelli and Cercato, 2010) (A) and Colle dei
Grilli – Cansatessa RAN section (Aterno R. Valley)
(Lanzo et al., 2011 ) (B).
Fig. 3 – DET_1, DET_2, DET_3 and
NTC-08 refer to the four accelerograms
used in the 1D and 2D modeling (GdL
MS-AQ, 2010).
Fig. 4 – The Preturo-Coppito meshgrid section performed with LSR 2D.
Left side: magnified area referring to the NW valley edge.
We decided to compare the average of
the output (pseudo-acceleration, pseudo-
velocity and displacement) based on
accelerograms DET_1, DET_2 and
DET_3 with output calculated with the
NTC accelerogram. Both 1D and 2D
analysis, the response spectra derived
from NTC input understate those
derived from disaggregation analysis
input.
Mesh generation is one of the most significant steps of the analysis, depending from it both the accuracy of the solution and the computational burden. It can
be said that more the mesh is dense, more the solution is accurate and greater the time and memory required for processing. The use of an excessively coarse
mesh results in a filtering of the high frequency components. The reason is that nodes too far apart cannot adequately model small wavelengths. Therefore,
the height h of each element has to be chose as follows:
NW SE
Fig. 7 - Output spectra (PSA vs time). Sites of Preturo-Coppito section (Fig. 2). Blue and red
curve refer to 2D and 1D modeling respectively.
Table 1 – Peaks of output spectra (PSA vs frequency) and
HVSR noise acquired nearby the local seismic response sites
(P34, P127, P159, P193) (Preturo-Coppito section, Fig. 2).
5. Results and conclusionsThe comparison between the 1D and 2D output spectra are in
good agreement in the central zone of the valley (P127) and in
the SE breccia site (P193) where there are no morphological and
stratigraphic irregularities (Fig. 2). While this comparison
highlights values changes at the valley edges (P34, P159) (Fig. 2),
evidencing an increase in amplitude and in the energy content at
lower frequencies which is mainly due to seismic waves focus
(Fig. 7).
The results of 1D and 2D modeling show also a remarkable
correspondence between the resonance frequencies of valley-fill
deposits obtained with several noise measurements and those
calculated by numerical simulations (Fig. 8, Table 1). This
correspondence validates the proposed subsoil model represented
by the Preturo-Coppito section (Fig. 2) in terms of (i) bedrock
depth; (ii) constant thickness and subhorizontal layering of the
valley-fill deposits in the valley center; (iii) estimated Vs values
and (iv) subsoil model setting for the code LSR 2D (geotechnical
parameters up to now used).
Summarising the main conclusions are as follows:
Comparison between 1D and 2D numerical modeling:
valley center (P127): similar spectra that means no 2D effect.
valley edges (P34, P159): increase in amplitude in 2D spectra
vs 1D spectra and peak shifting toward lower frequencies due
to seismic waves focus (valley edge effect).
0.7 s peak in three sites (P34, P159, P127): probably due to
surface waves propagation (pers. com. G. Di Giulio).
1D and 2D modeling vs HVSR noise (Table 1):
valley center (P127): good agreement between output spectra
(1.5 Hz) and noise HVSR spectra (1.6 Hz).
valley edges (P34, P159): moderate agreement between output
spectra and HVSR noise spectra in the SE (P159) and NW
(P34) valley edges
Fig. 8 - Output spectra (PSA vs frequency) vs HVSR noise.
Left side: output spectra; blue and red curves refer to 2D (LSR) and
1D (EERA) modeling respectively.
Right side: HVSR noise acquired nearby the local seismic response
sites (P34, P127, P159, P193) (Preturo-Coppito section, Fig. 2).
Fig. 5 - 𝐺/𝐺0 vs γ and 𝐷 vs γ curves for (a) sands: Seed and Idriss
(1970) for E3, E4, E5 and E7 lithologies; (b) clays: Seed and Sun
(1989) for F3 and F4 lithologies; (c) gravels: Rollins et al. (1998) for
C1; (d) bedrock: rock average attenuation and rock damping from
EERA and LSR 2D codes.
P34 P127
P159 P193
P127
P193
P34
P159