Embed Size (px)
Citation preview
1H FY 2010-11 Results
Analyst Presentation
October 30, 2010
Analyst Presentation
Forward Looking Statements
This presentation contains forward-looking statements which may be identifiedby their use of words like “plans,” “expects,” “will,” “anticipates,” “believes,”“intends ” “projects ” “estimates” or other words of similar meaning All“intends,” “projects,” “estimates” or other words of similar meaning. Allstatements that address expectations or projections about the future,including, but not limited to, statements about the strategy for growth, productdevelopment, market position, expenditures, and financial results, are forward-de e op e t, a et pos t o , e pe d tu es, a d a c a esu ts, a e o a dlooking statements.
Forward-looking statements are based on certain assumptions andexpectations of future events. The companies referred to in this presentationcannot guarantee that these assumptions and expectations are accurate orwill be realized. The actual results, performance or achievements, could thusdiffer materially from those projected in any such forward looking statementsdiffer materially from those projected in any such forward-looking statements.These companies assume no responsibility to publicly amend, modify orrevise any forward looking statements, on the basis of any subsequentdevelopments, information or events, or otherwise.
2www.ril.com
p , ,
1H FY11 Accomplishments
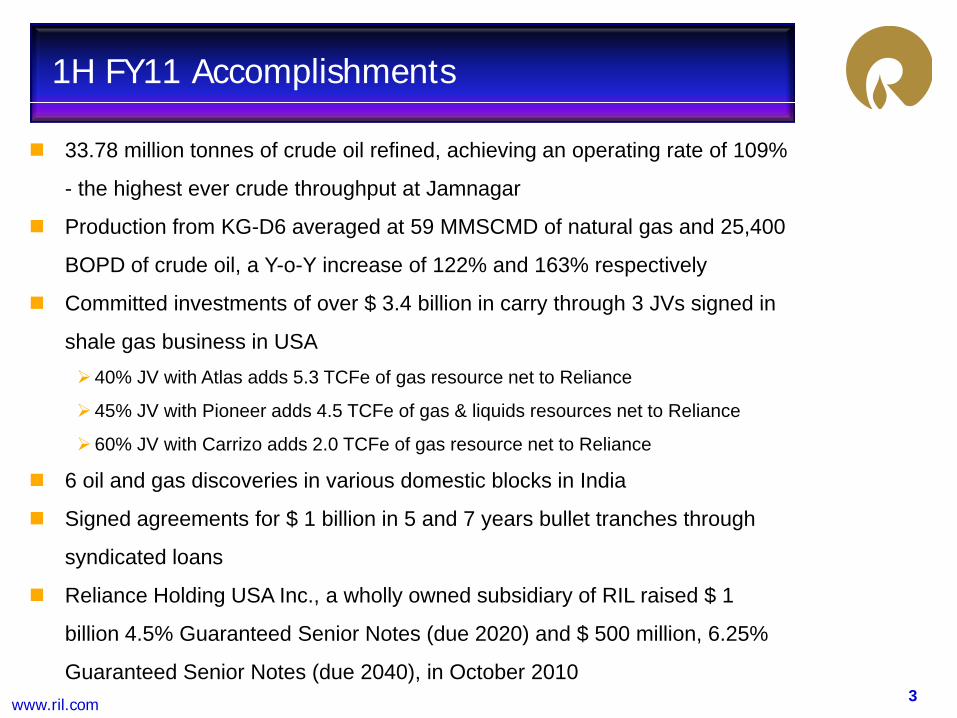
33.78 million tonnes of crude oil refined, achieving an operating rate of 109%
- the highest ever crude throughput at Jamnagar
Production from KG-D6 averaged at 59 MMSCMD of natural gas and 25,400
BOPD of crude oil, a Y-o-Y increase of 122% and 163% respectively
Committed investments of over $ 3 4 billion in carry through 3 JVs signed inCommitted investments of over $ 3.4 billion in carry through 3 JVs signed in
shale gas business in USA40% JV with Atlas adds 5.3 TCFe of gas resource net to Reliance
45% JV with Pioneer adds 4 5 TCFe of gas & liquids resources net to Reliance45% JV with Pioneer adds 4.5 TCFe of gas & liquids resources net to Reliance
60% JV with Carrizo adds 2.0 TCFe of gas resource net to Reliance
6 oil and gas discoveries in various domestic blocks in India
Si d t f $ 1 billi i 5 d 7 b ll t t h th hSigned agreements for $ 1 billion in 5 and 7 years bullet tranches through
syndicated loans
Reliance Holding USA Inc., a wholly owned subsidiary of RIL raised $ 1
3www.ril.com
billion 4.5% Guaranteed Senior Notes (due 2020) and $ 500 million, 6.25%
Guaranteed Senior Notes (due 2040), in October 2010
Financial Results
4www.ril.com
Financial Results – 1H FY11
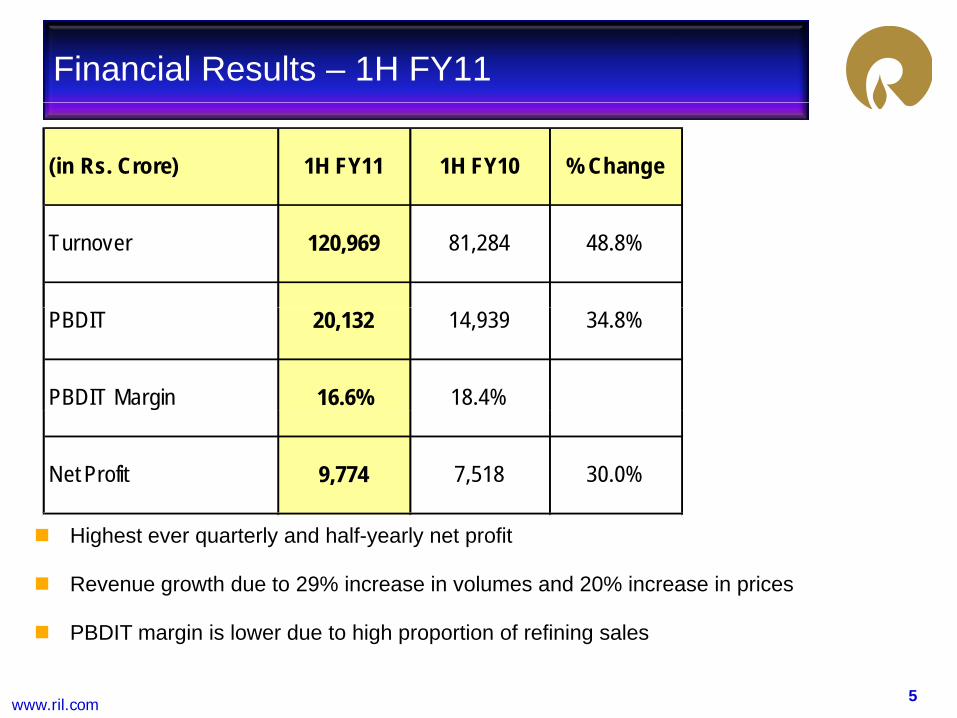
(in Rs. Crore) 1H FY11 1H FY10 % Change
Turnover 120,969 81,284 48.8%
PBDIT 20,132 14,939 34.8%
PBDIT Margin 16.6% 18.4%
Net Profit 9,774 7,518 30.0%
Highest ever quarterly and half-yearly net profit
Revenue growth due to 29% increase in volumes and 20% increase in prices
5www.ril.com
PBDIT margin is lower due to high proportion of refining sales
Financial Results – 2Q FY11
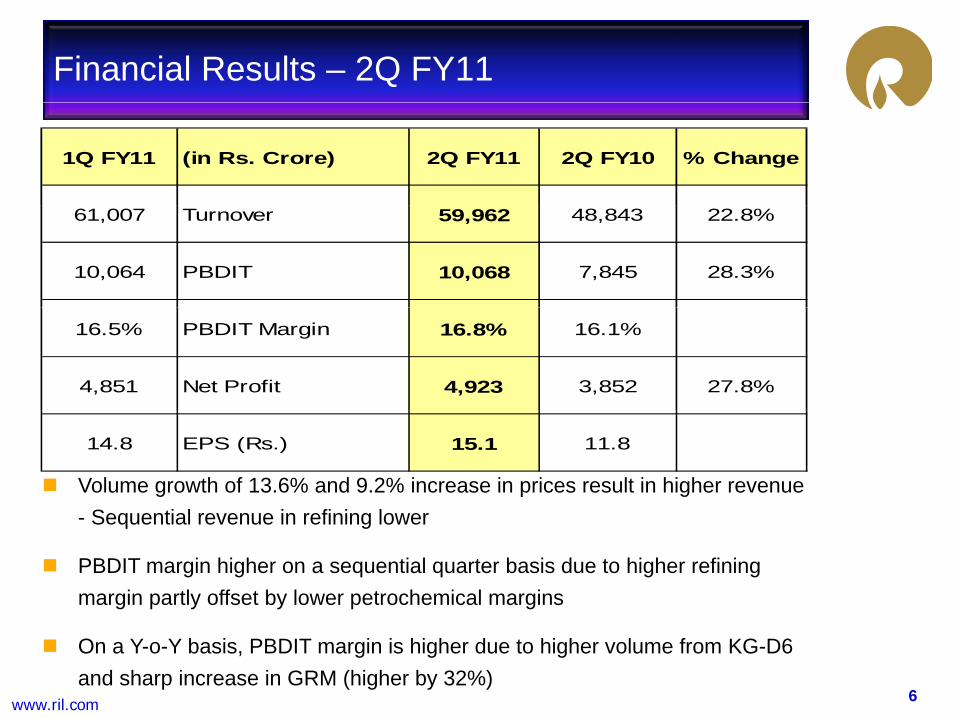
1Q FY11 (in Rs. Crore) 2Q FY11 2Q FY10 % Change
61,007 Turnover 59,962 48,843 22.8%
10,064 PBDIT 10,068 7,845 28.3%
16.5% PBDIT Margin 16.8% 16.1%
4,851 Net Profit 4,923 3,852 27.8%
14.8 EPS (Rs.) 15.1 11.8
Volume growth of 13.6% and 9.2% increase in prices result in higher revenue S ti l i fi i l- Sequential revenue in refining lower
PBDIT margin higher on a sequential quarter basis due to higher refining margin partly offset by lower petrochemical margins
6www.ril.com
On a Y-o-Y basis, PBDIT margin is higher due to higher volume from KG-D6 and sharp increase in GRM (higher by 32%)
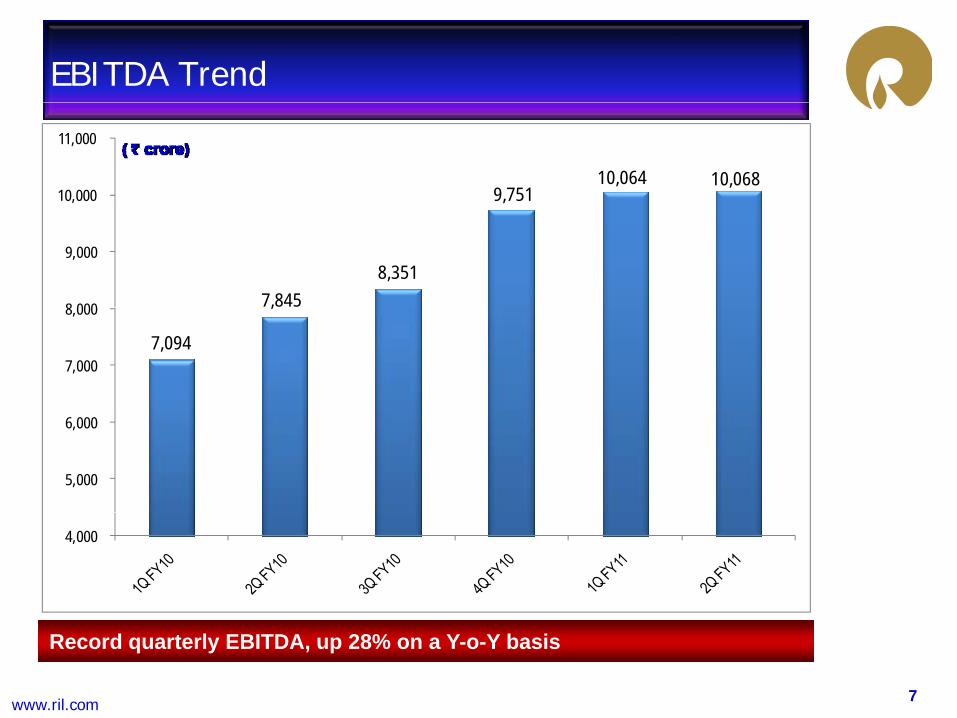
EBITDA Trend
9,751 10,064 10,068
10,000
11,000
7,845 8,351
8 000
9,000
7,094
,
7,000
8,000
5,000
6,000
4,000
7www.ril.com
Record quarterly EBITDA, up 28% on a Y-o-Y basis
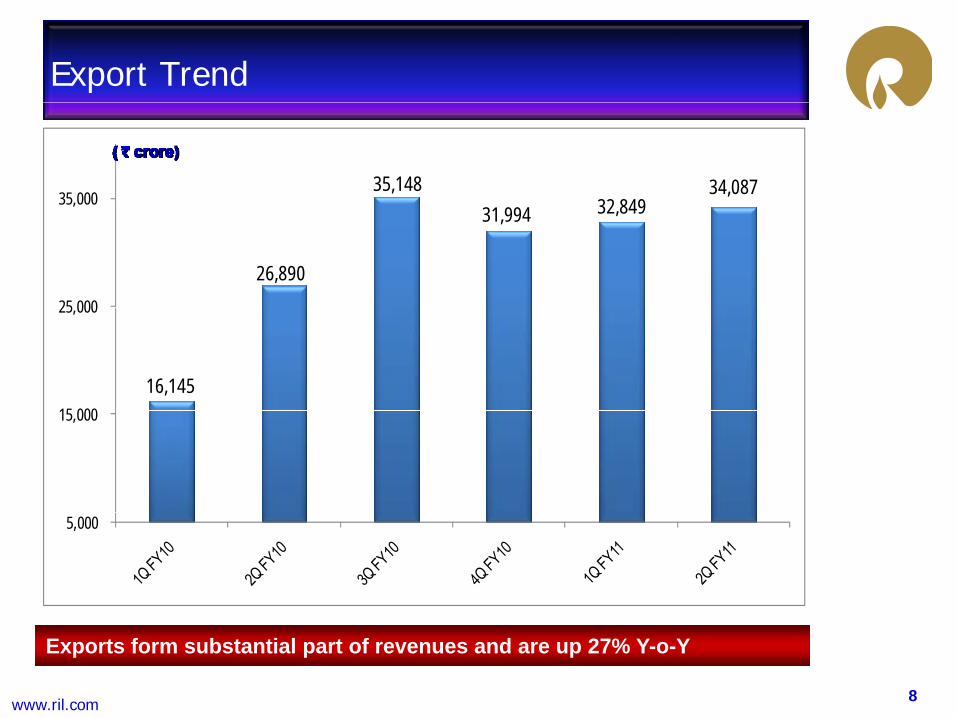
Export Trend
35,148 32 849
34,087 35,000
26,890
31,994 32,849
25 000
,
16,145 15 000
25,000
15,000
5,000
8www.ril.com
Exports form substantial part of revenues and are up 27% Y-o-Y
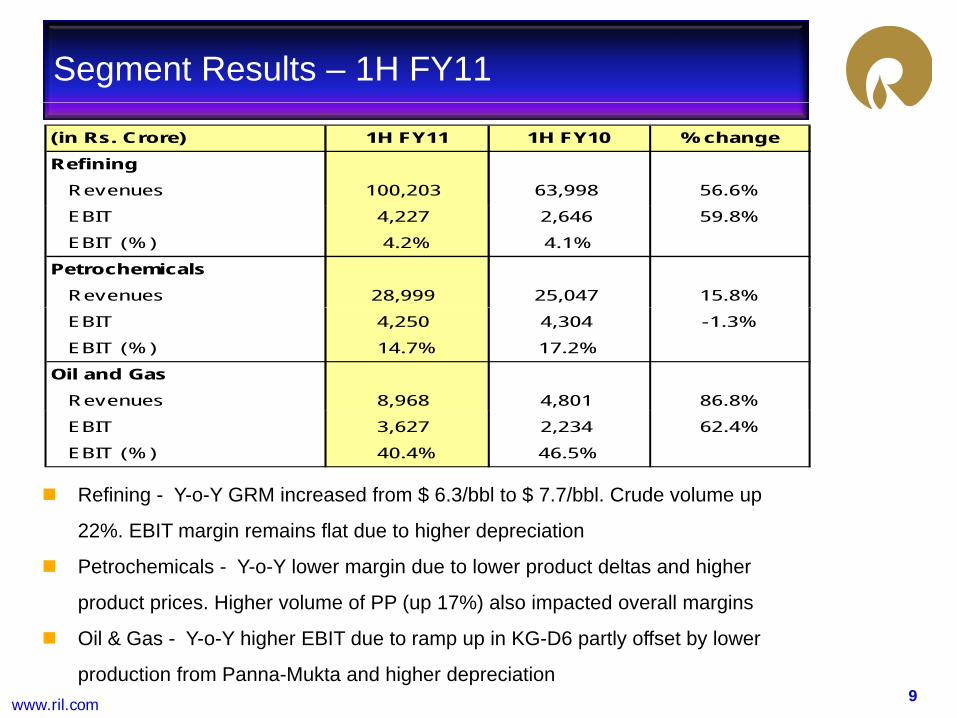
Segment Results – 1H FY11
(in Rs. Crore) 1H FY11 1H FY10 % change
Refining Revenues 100,203 63,998 56.6%
EBIT 4,227 2,646 59.8%
EBIT (% ) 4.2% 4.1%
Petrochemicals Revenues 28,999 25,047 15.8%
EBIT 4,250 4,304 -1.3%
EBIT (% ) 14.7% 17.2%
Oil and Gas Revenues 8,968 4,801 86.8%
Refining - Y-o-Y GRM increased from $ 6.3/bbl to $ 7.7/bbl. Crude volume up
EBIT 3,627 2,234 62.4%
EBIT (% ) 40.4% 46.5%
22%. EBIT margin remains flat due to higher depreciation
Petrochemicals - Y-o-Y lower margin due to lower product deltas and higher
product prices. Higher volume of PP (up 17%) also impacted overall margins
9www.ril.com
Oil & Gas - Y-o-Y higher EBIT due to ramp up in KG-D6 partly offset by lower
production from Panna-Mukta and higher depreciation
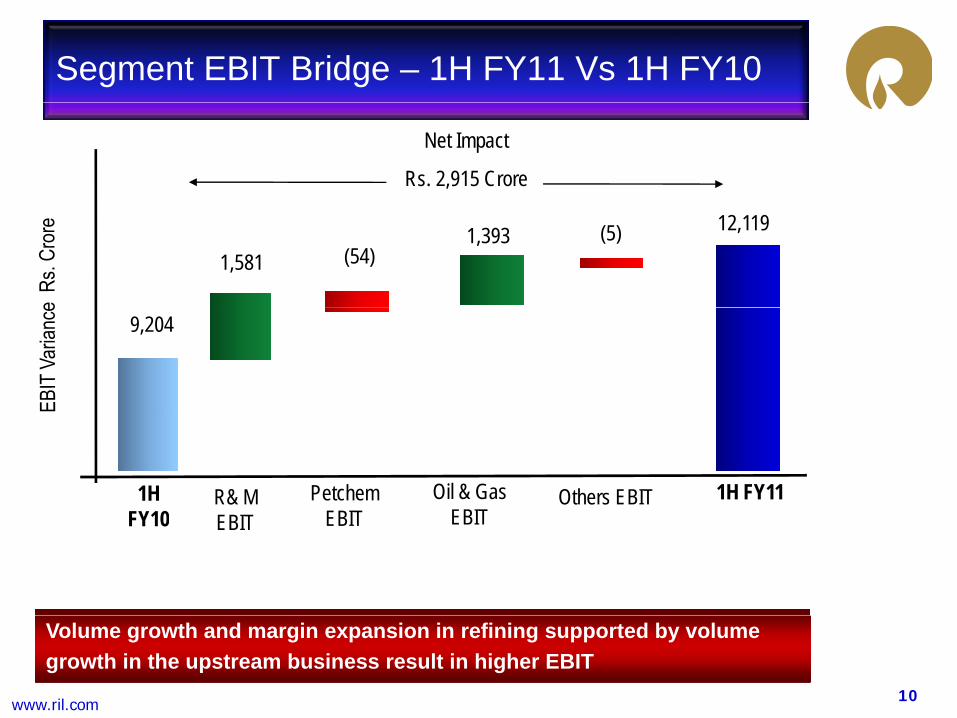
Segment EBIT Bridge – 1H FY11 Vs 1H FY10
Net Impact
Rs. 2,915 Crore
12,119
1,581 (54)(5)1,393
9,204
1H FY10
1H FY11R& M Others EBITPetchemEBIT
Oil & Gas EBITFY10 EBIT EBIT EBIT
10www.ril.com
Volume growth and margin expansion in refining supported by volume growth in the upstream business result in higher EBIT
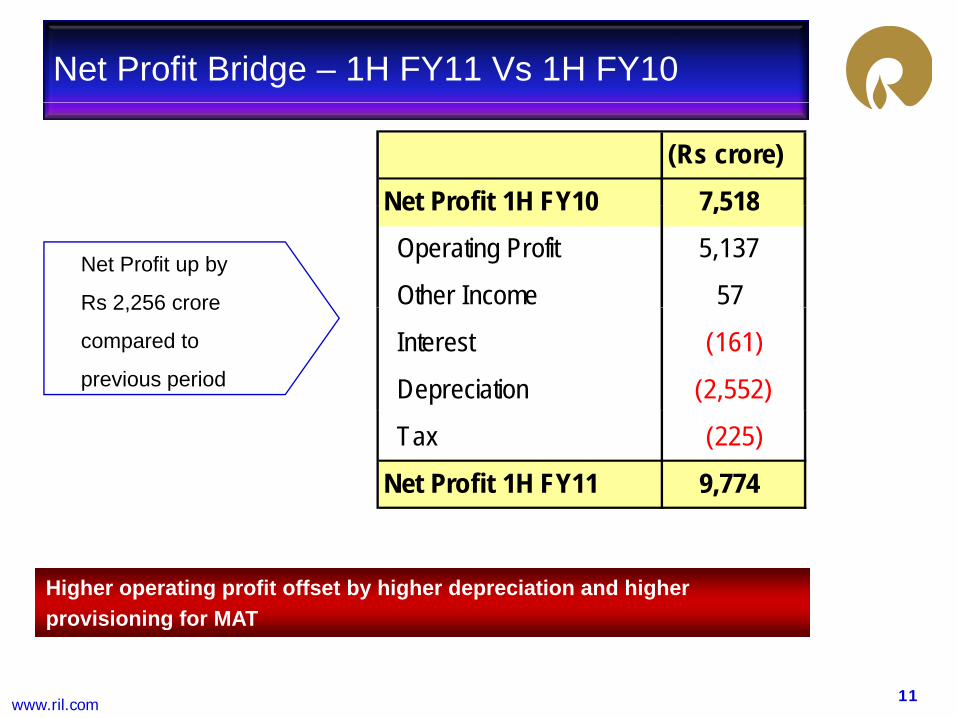
Net Profit Bridge – 1H FY11 Vs 1H FY10
(Rs crore)Net Profit 1H FY10 7 518
Net Profit up by
Rs 2,256 crore
Net Profit 1H FY10 7,518 Operating Profit 5,137
Other Income 57Rs 2,256 crore
compared to
previous period Interest (161)
Depreciation (2,552)
Tax (225)
Net Profit 1H FY11 9,774
Higher operating profit offset by higher depreciation and higher provisioning for MAT
11www.ril.com
provisioning for MAT
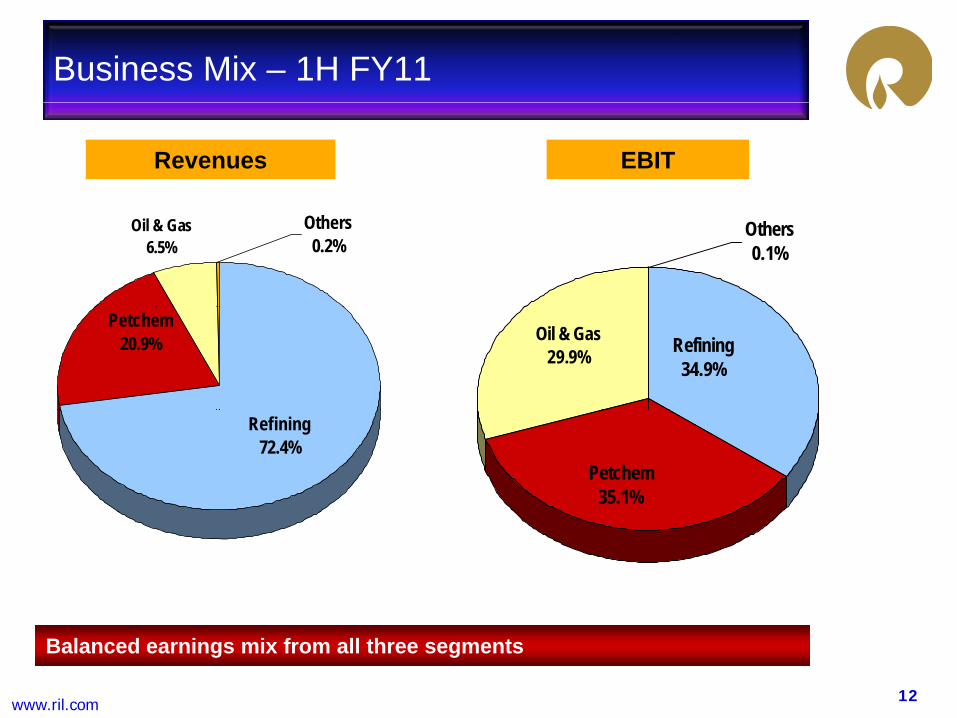
Business Mix – 1H FY11
Revenues EBIT
Oil & Gas6.5%
Others0.2%
Others0.1%
Petchem20.9% Oil & Gas
29.9% Refining34.9%
Refining72.4%
Petchem35.1%
12www.ril.com
Balanced earnings mix from all three segments
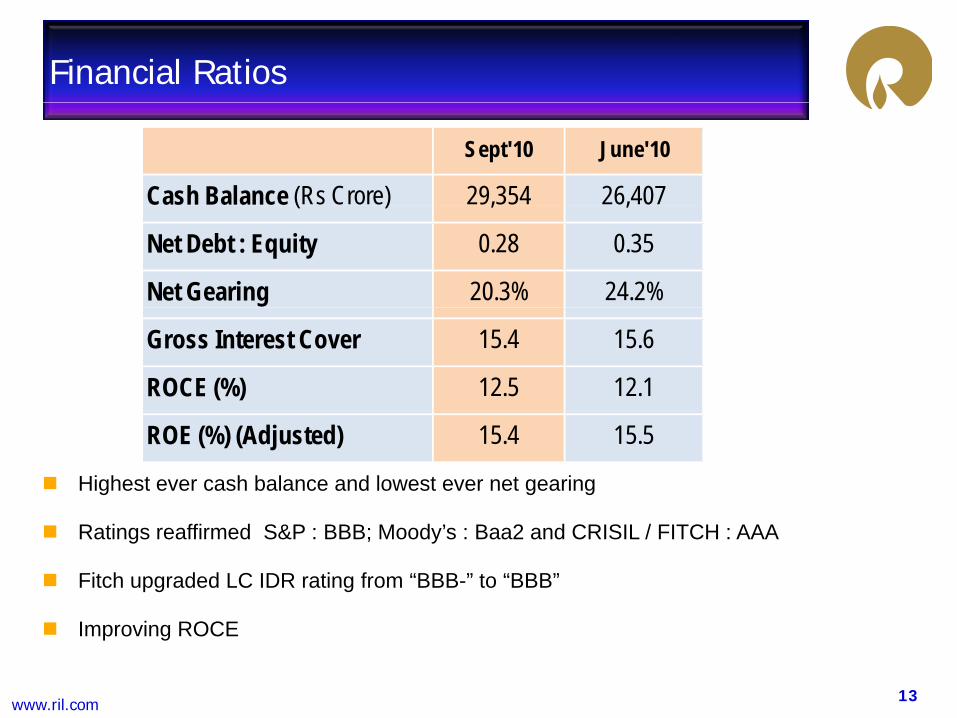
Financial Ratios
Sept'10 June'10
Cash Balance (Rs Crore) 29,354 26,407( ) , ,
Net Debt : Equity 0.28 0.35
Net Gearing 20.3% 24.2%
Gross Interest Cover 15.4 15.6
ROCE (%) 12.5 12.1
ROE (%) (Adjusted) 15.4 15.5
Highest ever cash balance and lowest ever net gearing
Ratings reaffirmed S&P : BBB; Moody’s : Baa2 and CRISIL / FITCH : AAA
Fitch upgraded LC IDR rating from “BBB-” to “BBB”
13www.ril.com
Improving ROCE
Oil and Gas – Exploration and Production
14www.ril.com
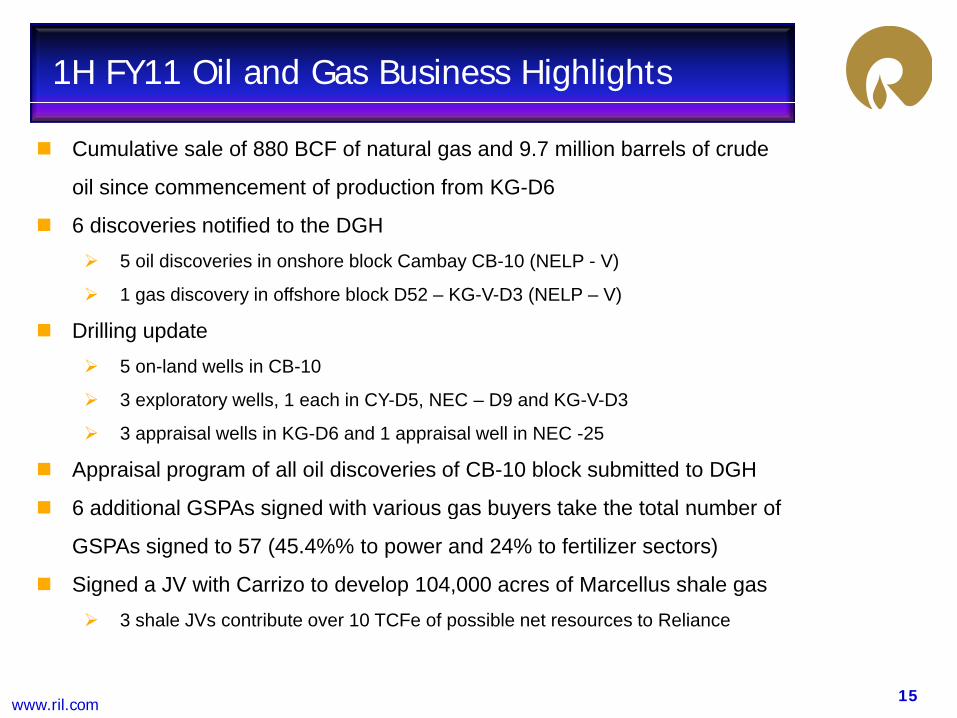
1H FY11 Oil and Gas Business Highlights
Cumulative sale of 880 BCF of natural gas and 9.7 million barrels of crude
oil since commencement of production from KG-D6
6 discoveries notified to the DGH 5 oil discoveries in onshore block Cambay CB-10 (NELP - V)
1 gas discovery in offshore block D52 – KG-V-D3 (NELP – V)
Drilling update 5 on-land wells in CB-10
3 exploratory wells, 1 each in CY-D5, NEC – D9 and KG-V-D3
3 appraisal wells in KG-D6 and 1 appraisal well in NEC -25
Appraisal program of all oil discoveries of CB-10 block submitted to DGH
6 additional GSPAs signed with various gas buyers take the total number of6 additional GSPAs signed with various gas buyers take the total number of
GSPAs signed to 57 (45.4%% to power and 24% to fertilizer sectors)
Signed a JV with Carrizo to develop 104,000 acres of Marcellus shale gas3 h l JV t ib t 10 TCF f ibl t t R li
15www.ril.com
3 shale JVs contribute over 10 TCFe of possible net resources to Reliance
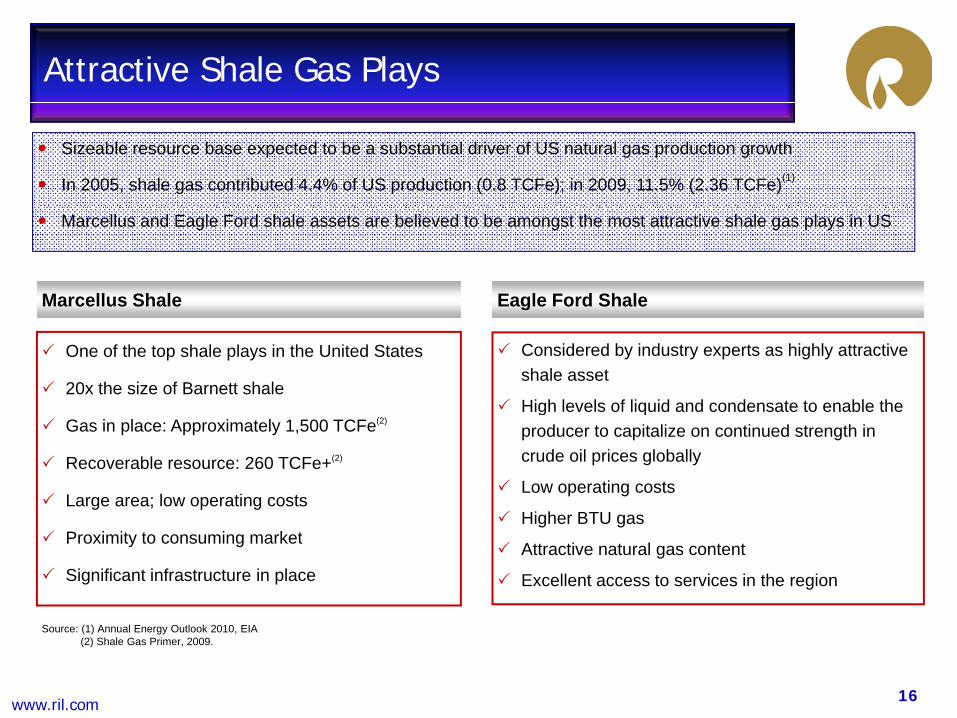
Attractive Shale Gas Plays
Sizeable resource base expected to be a substantial driver of US natural gas production growth
In 2005, shale gas contributed 4.4% of US production (0.8 TCFe); in 2009, 11.5% (2.36 TCFe)(1)
Eagle Ford ShaleMarcellus Shale
Marcellus and Eagle Ford shale assets are believed to be amongst the most attractive shale gas plays in US
One of the top shale plays in the United States
20x the size of Barnett shale
Considered by industry experts as highly attractive shale asset
High levels of liquid and condensate to enable the
g
Gas in place: Approximately 1,500 TCFe(2)
Recoverable resource: 260 TCFe+(2)
Large area; low operating costs
High levels of liquid and condensate to enable the producer to capitalize on continued strength in crude oil prices globally
Low operating costs
Hi h BTUProximity to consuming market
Significant infrastructure in place
Higher BTU gas
Attractive natural gas content
Excellent access to services in the region
16www.ril.com
Source: (1) Annual Energy Outlook 2010, EIA(2) Shale Gas Primer, 2009.
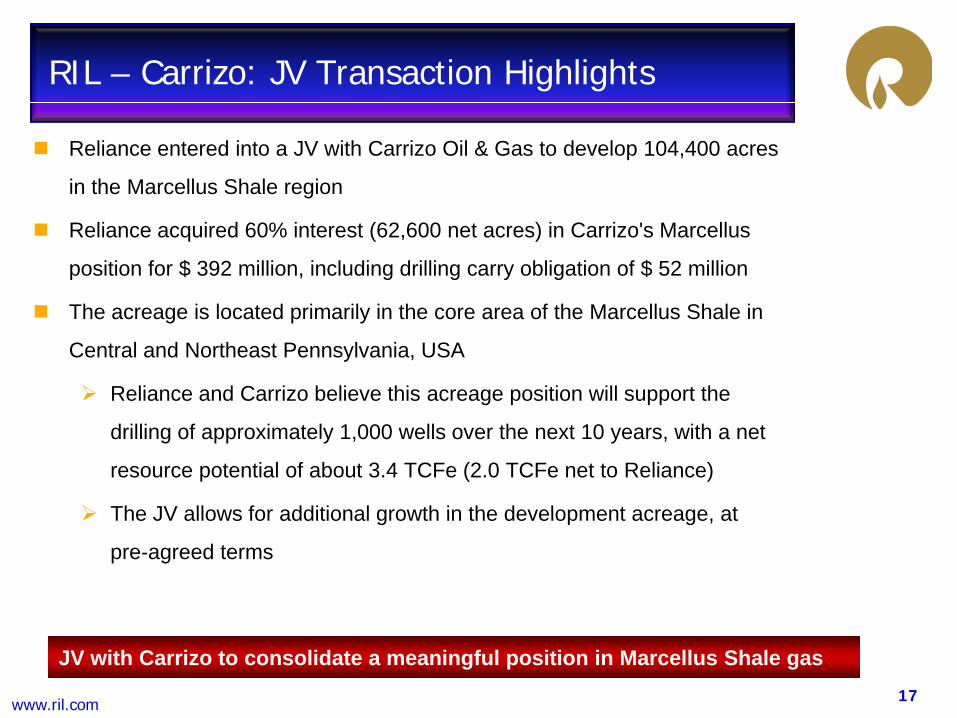
RIL – Carrizo: JV Transaction Highlights
Reliance entered into a JV with Carrizo Oil & Gas to develop 104,400 acres
in the Marcellus Shale region
Reliance acquired 60% interest (62,600 net acres) in Carrizo's Marcellus
position for $ 392 million, including drilling carry obligation of $ 52 million
Th i l t d i il i th f th M ll Sh l iThe acreage is located primarily in the core area of the Marcellus Shale in
Central and Northeast Pennsylvania, USA
Reliance and Carrizo believe this acreage position will support the
drilling of approximately 1,000 wells over the next 10 years, with a net
resource potential of about 3.4 TCFe (2.0 TCFe net to Reliance)
The JV allows for additional growth in the development acreage atThe JV allows for additional growth in the development acreage, at
pre‐agreed terms
17www.ril.com
JV with Carrizo to consolidate a meaningful position in Marcellus Shale gas
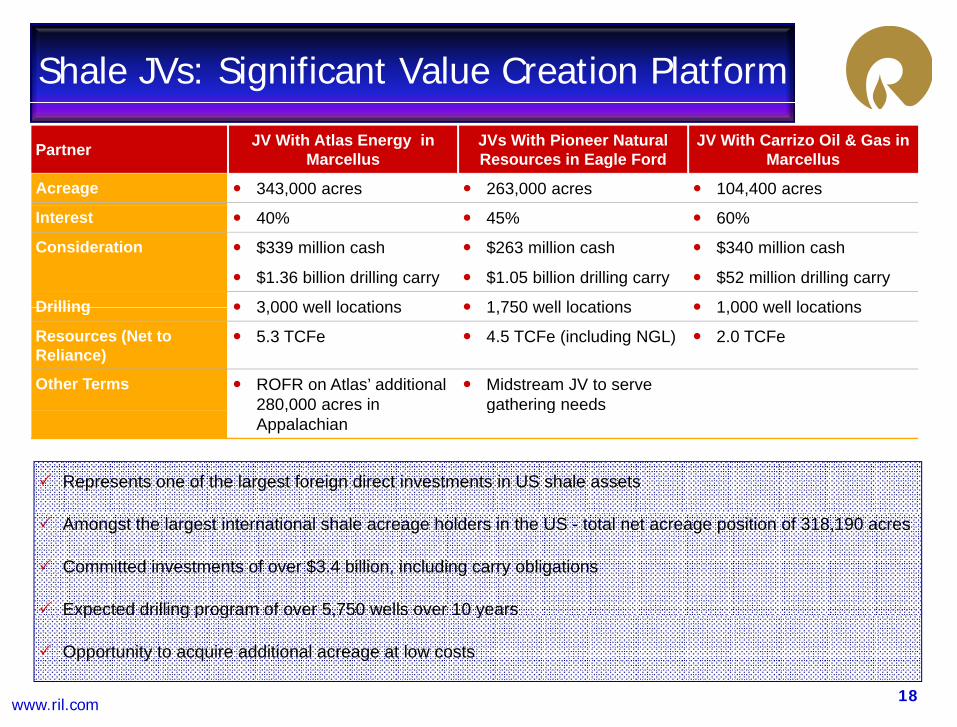
Shale JVs: Significant Value Creation Platform
Partner JV With Atlas Energy in Marcellus
JVs With Pioneer Natural Resources in Eagle Ford
JV With Carrizo Oil & Gas in Marcellus
Acreage 343,000 acres 263,000 acres 104,400 acres
Interest 40% 45% 60%
Consideration $339 million cash
$1.36 billion drilling carry
$263 million cash
$1.05 billion drilling carry
$340 million cash
$52 million drilling carry
Drilling 3 000 well locations 1 750 well locations 1 000 well locationsDrilling 3,000 well locations 1,750 well locations 1,000 well locations
Resources (Net to Reliance)
5.3 TCFe 4.5 TCFe (including NGL) 2.0 TCFe
Other Terms ROFR on Atlas’ additional 280,000 acres in
Midstream JV to serve gathering needs,
Appalachiang g
Represents one of the largest foreign direct investments in US shale assets
Amongst the largest international shale acreage holders in the US - total net acreage position of 318,190 acres
Committed investments of over $3.4 billion, including carry obligations
Expected drilling program of over 5,750 wells over 10 years
18www.ril.com1
p g p g , y
Opportunity to acquire additional acreage at low costs
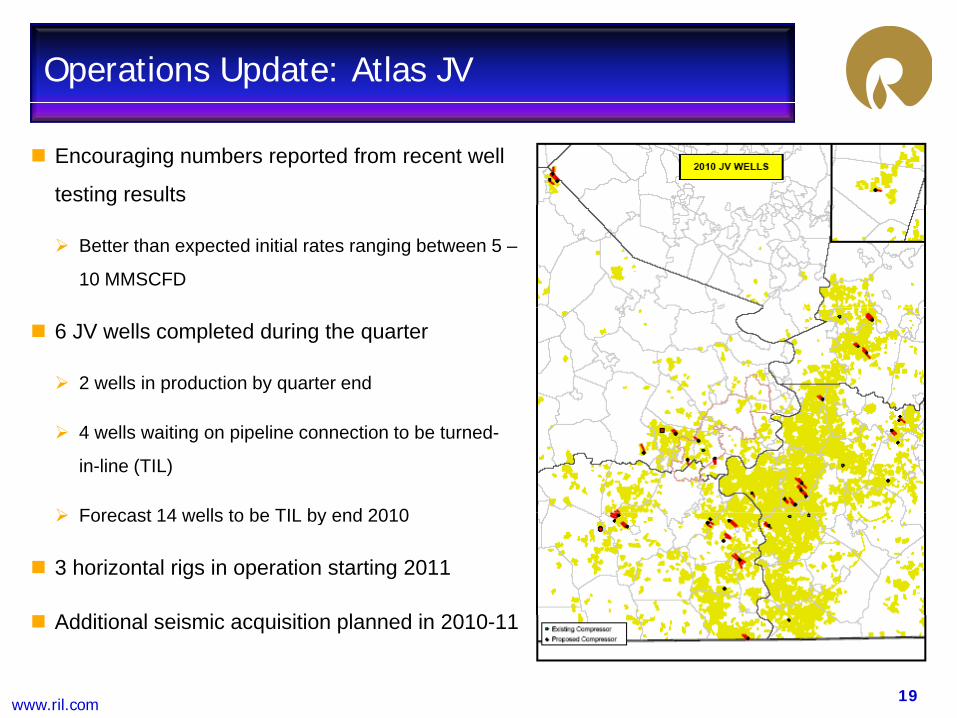
Operations Update: Atlas JV
Encouraging numbers reported from recent well
testing resultsg
Better than expected initial rates ranging between 5 –
10 MMSCFD
6 JV wells completed during the quarter
2 wells in production by quarter end
4 wells waiting on pipeline connection to be turned-
in-line (TIL)
Forecast 14 wells to be TIL by end 2010Forecast 14 wells to be TIL by end 2010
3 horizontal rigs in operation starting 2011
Additi l i i i iti l d i 2010 11
19www.ril.com
Additional seismic acquisition planned in 2010-11
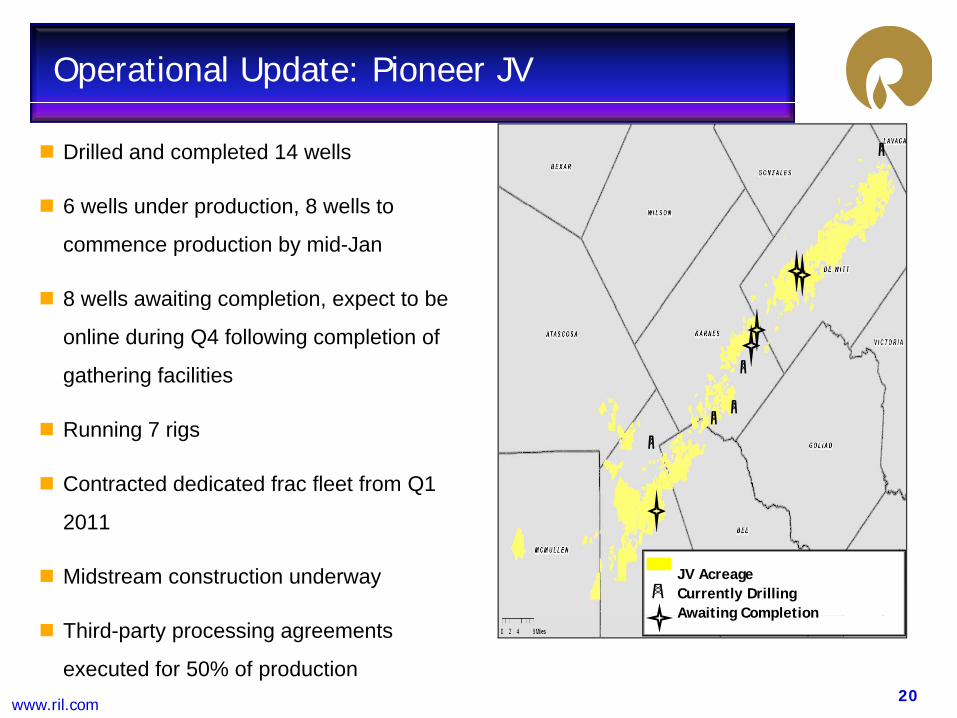
Operational Update: Pioneer JV
Drilled and completed 14 wells
6 wells under production 8 wells to6 wells under production, 8 wells to
commence production by mid-Jan
8 wells awaiting completion, expect to be g p , p
online during Q4 following completion of
gathering facilities
Running 7 rigs
Contracted dedicated frac fleet from Q1
2011
Midstream construction underway JV AcreageCurrently DrillingAwaiting Completion
20www.ril.com
Third-party processing agreements
executed for 50% of production
Awaiting Completion
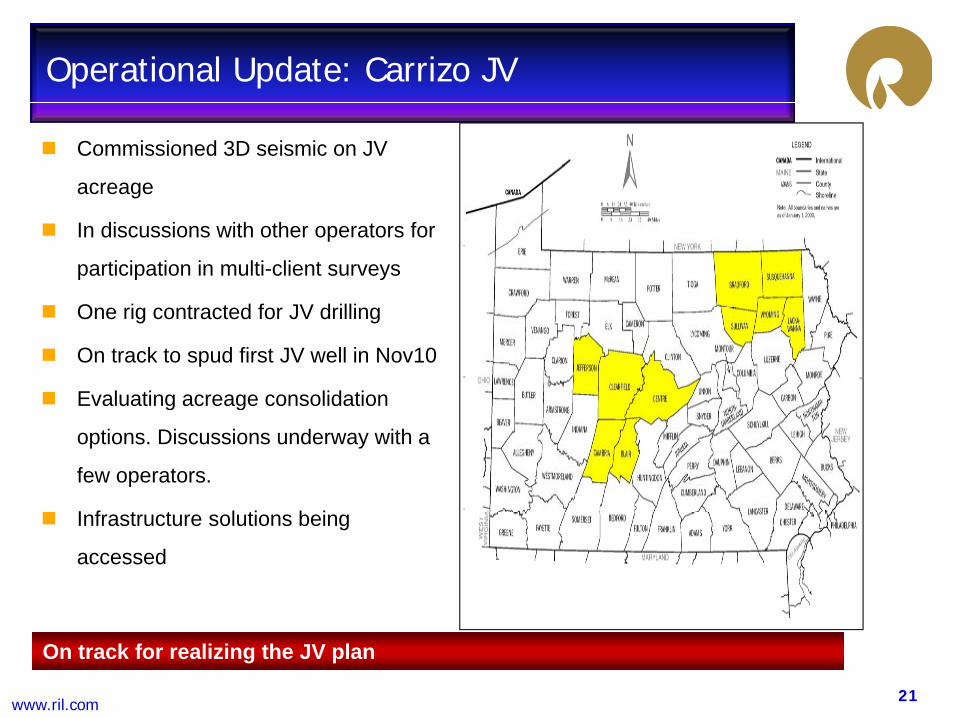
Operational Update: Carrizo JV
Commissioned 3D seismic on JV
acreage
In discussions with other operators for
participation in multi-client surveys
O i t t d f JV d illiOne rig contracted for JV drilling
On track to spud first JV well in Nov10
Evaluating acreage consolidation g g
options. Discussions underway with a
few operators.
I f t t l ti b iInfrastructure solutions being
accessed
21www.ril.com
On track for realizing the JV plan
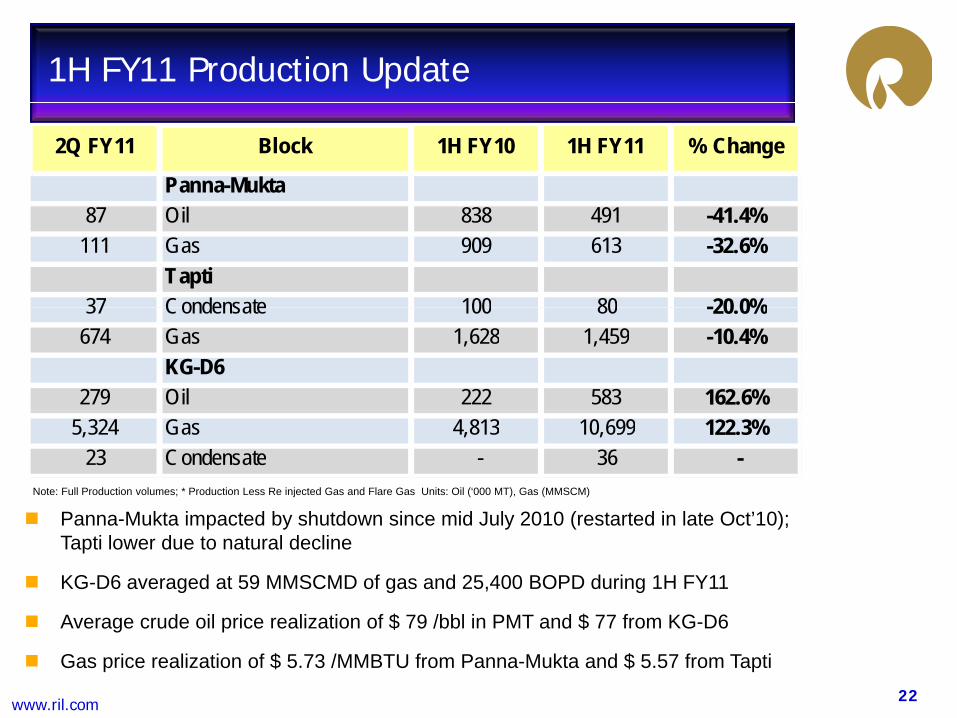
1H FY11 Production Update
2Q FY11 Block 1H FY10 1H FY11 % Change
Panna-Mukta87 Oil 838 491 -41.4%
111 Gas 909 613 -32.6%Tapti
37 Condensate 100 80 -20 0%37 Condensate 100 80 -20.0%674 Gas 1,628 1,459 -10.4%
KG-D6279 Oil 222 583 162.6%
P M kt i t d b h td i id J l 2010 ( t t d i l t O t’10)
5,324 Gas 4,813 10,699 122.3%23 Condensate - 36 -
Note: Full Production volumes; * Production Less Re injected Gas and Flare Gas Units: Oil (‘000 MT), Gas (MMSCM)
Panna-Mukta impacted by shutdown since mid July 2010 (restarted in late Oct’10); Tapti lower due to natural decline
KG-D6 averaged at 59 MMSCMD of gas and 25,400 BOPD during 1H FY11
A d il i li ti f $ 79 /bbl i PMT d $ 77 f KG D6
22www.ril.com
Average crude oil price realization of $ 79 /bbl in PMT and $ 77 from KG-D6
Gas price realization of $ 5.73 /MMBTU from Panna-Mukta and $ 5.57 from Tapti
Refining & Marketing
23www.ril.com
R & M Current Business Environment
Oil demand continues to grow supported by sustained economic recovery -
IEA estimate for 2010 at 86.8 MMBD, 2.5% growth on a Y-o-Y basis. Further
upward revision in demand outlook for 2010 by 0.5% in past 6 months
Lackluster driving season results in subdued gasoline cracks while margins
for middle distillates improved as fundamentals look upp p
L-H differentials widen as OPEC over produced their quota (current
compliance of around 50%). On a Y-o-Y basis, L-H is up by $ 1/bbl
Si ifi t i t i A i b h k i t $ 4 2 /bbl i 2QSignificant improvement in Asian benchmark margin, at $ 4.2 /bbl in 2Q
FY11, is up 13% on a trailing quarter basis
India remained one of the fastest growth markets; Y-o-Y growth in
transportation fuels of 8.2% despite strong monsoons
24www.ril.com
Consistent improvement in complex refining margin; changing placement opportunities as Asian demand outperforms OECD markets
RIL Business Highlights
GRM of $ 7.9 /bbl for the quarter, outperforming regional benchmarks
33.78 million tonnes of oil refined in 1H FY11, up 22% on a Y-o-Y basis
Record operating rate of 109%, perhaps the highest globally
Export volumes were at 19.7 million tonnes and account for revenue of
$ 13.4 billion
Domestic sales volume (including captive) was 13.1 million tonnes
Around 700 retail outlets remained operational; mainly in Western and
Southern India
25www.ril.com
Record processing of crude oil at Jamnagar
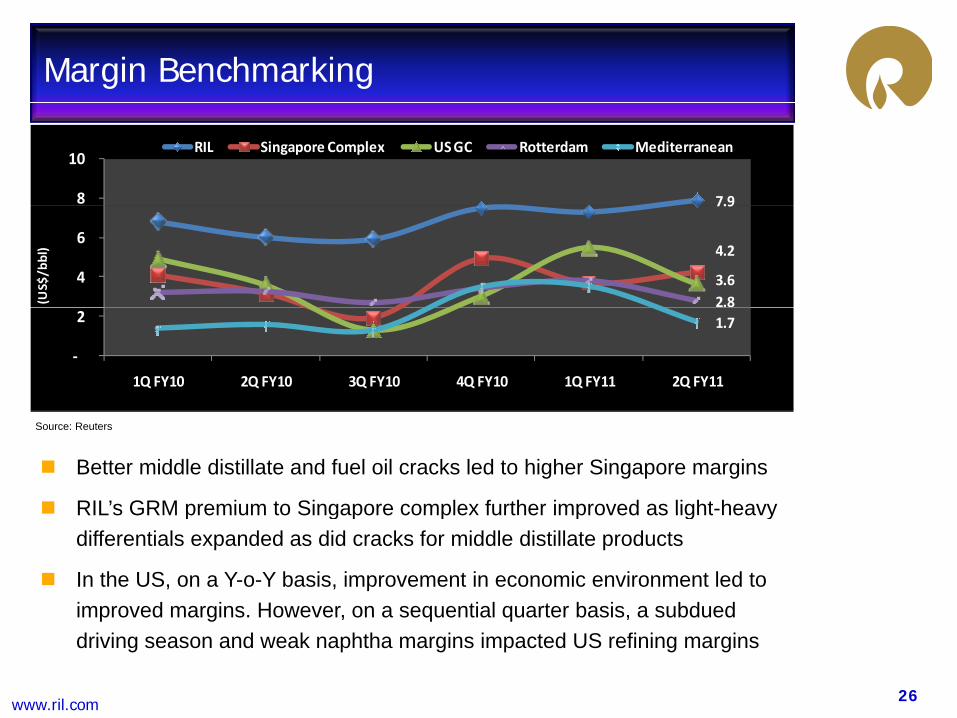
Margin Benchmarking
7.98
10 RIL Singapore Complex US GC Rotterdam Mediterranean
7.9
4.2
3.6 2.8
4
6
(US$/bbl)
1.7
‐
2
1Q FY10 2Q FY10 3Q FY10 4Q FY10 1Q FY11 2Q FY11
Better middle distillate and fuel oil cracks led to higher Singapore margins
RIL’s GRM premium to Singapore complex further improved as light-heavy
Source: Reuters
RIL s GRM premium to Singapore complex further improved as light heavy differentials expanded as did cracks for middle distillate products
In the US, on a Y-o-Y basis, improvement in economic environment led to improved margins. However, on a sequential quarter basis, a subdued
26www.ril.com
improved margins. However, on a sequential quarter basis, a subdued driving season and weak naphtha margins impacted US refining margins
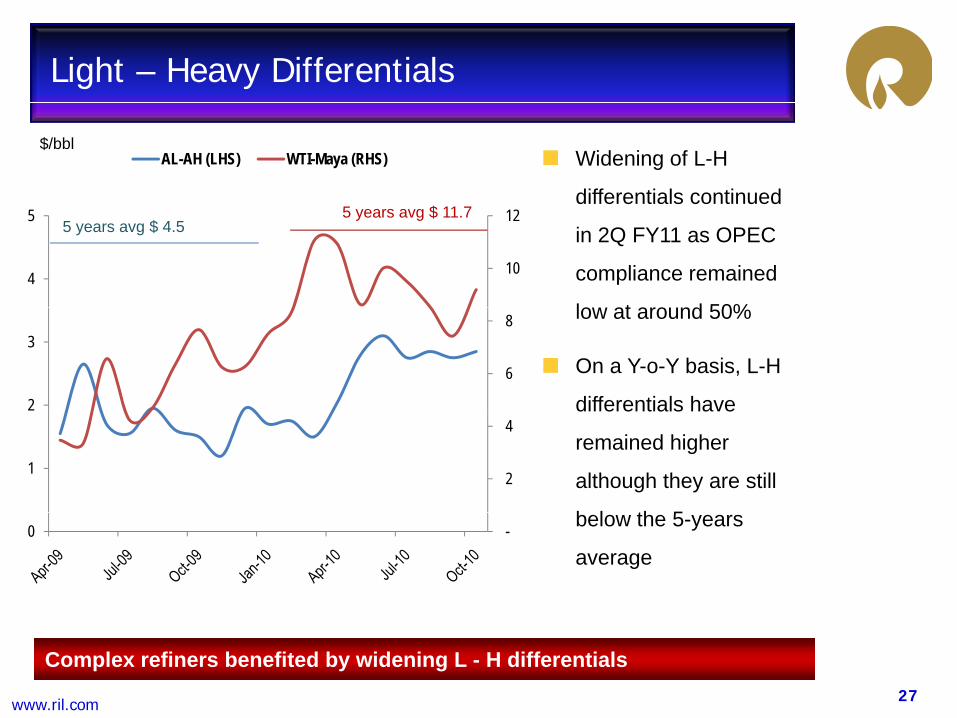
Light – Heavy Differentials
Widening of L-H
differentials continued
AL-AH (LHS) WTI-Maya (RHS)$/bbl
in 2Q FY11 as OPEC
compliance remained
lo at aro nd 50%
10
12
4
55 years avg $ 4.5
5 years avg $ 11.7
low at around 50%
On a Y-o-Y basis, L-H
differentials have6
8
2
3
differentials have
remained higher
although they are still
b l th 5
2
4
1
2
below the 5-years
average-0
27www.ril.com
Complex refiners benefited by widening L - H differentials
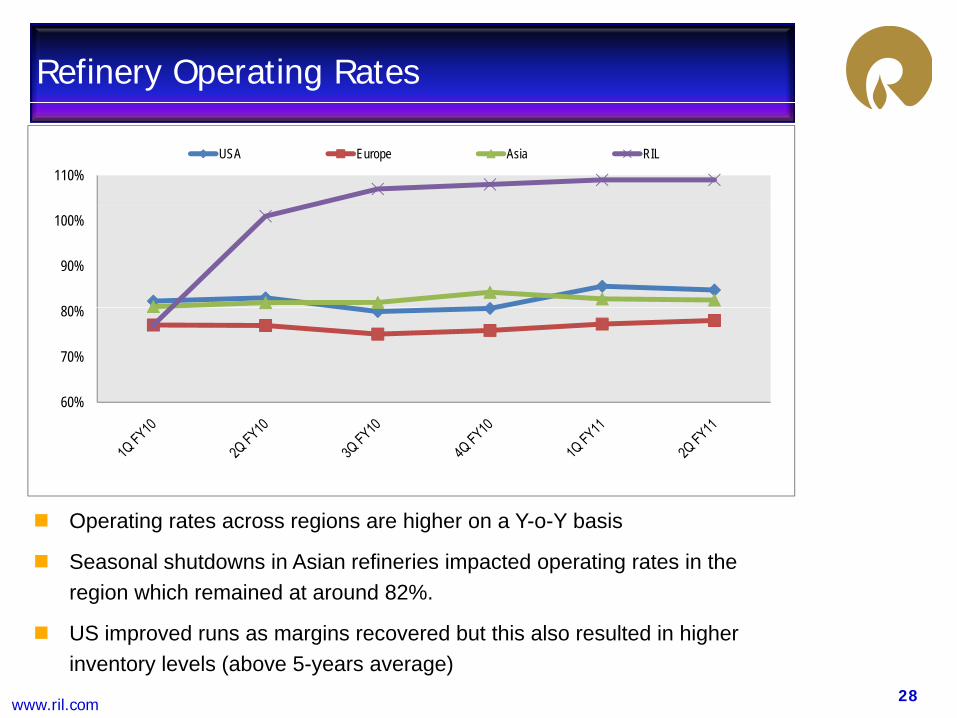
Refinery Operating Rates
110%USA Europe Asia RIL
80%
90%
100%
60%
70%
80%
OOperating rates across regions are higher on a Y-o-Y basis
Seasonal shutdowns in Asian refineries impacted operating rates in the region which remained at around 82%.
28www.ril.com
US improved runs as margins recovered but this also resulted in higher inventory levels (above 5-years average)
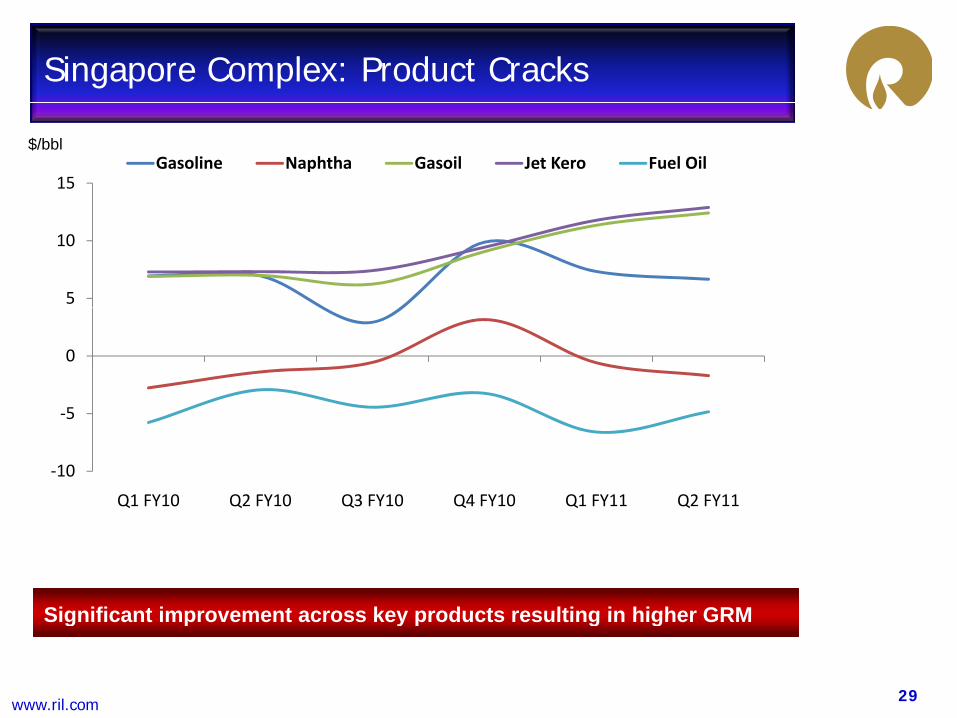
Singapore Complex: Product Cracks
15Gasoline Naphtha Gasoil Jet Kero Fuel Oil
$/bbl
5
10
5
0
‐10
‐5
Q1 FY10 Q2 FY10 Q3 FY10 Q4 FY10 Q1 FY11 Q2 FY11
Significant improvement across key products resulting in higher GRM
29www.ril.com
Significant improvement across key products resulting in higher GRM
Product Cracks
Significant improvement in Gasoil cracks on a Y-o-Y basis with
improvement in global economic activityimprovement in global economic activity
Gasoline cracks remained weak as inventory levels stay high (above the
top-end of 5-year range), efficiency norms tighten and impact of bio-fuels
Improving air-traffic on the back of economic recovery continued to
support Jet Kero
Naphtha cracks deteriorated due to limited petrochemical demand in Asia &Naphtha cracks deteriorated due to limited petrochemical demand in Asia &
Europe and availability of cheap gas in the US
30www.ril.com
Weak FO cracks help enhance light-heavy differentials
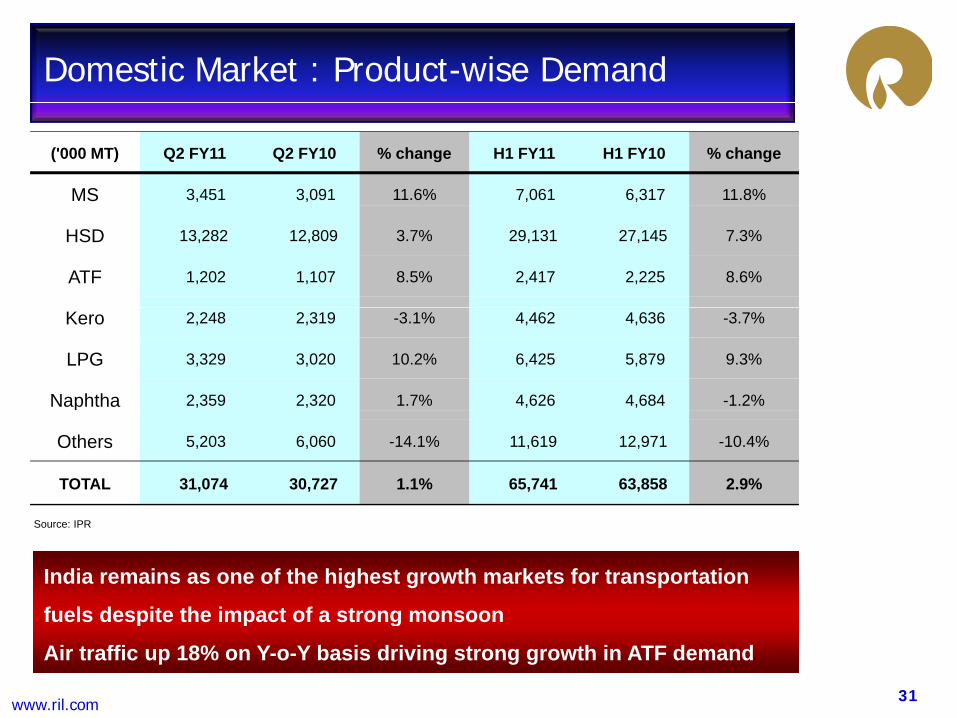
Domestic Market : Product-wise Demand
('000 MT) Q2 FY11 Q2 FY10 % change H1 FY11 H1 FY10 % change
MS 3,451 3,091 11.6% 7,061 6,317 11.8%
HSD 13,282 12,809 3.7% 29,131 27,145 7.3%
ATF 1,202 1,107 8.5% 2,417 2,225 8.6%
Kero 2,248 2,319 -3.1% 4,462 4,636 -3.7%
LPG 3,329 3,020 10.2% 6,425 5,879 9.3%
Naphtha 2,359 2,320 1.7% 4,626 4,684 -1.2%p
Others 5,203 6,060 -14.1% 11,619 12,971 -10.4%
TOTAL 31,074 30,727 1.1% 65,741 63,858 2.9%
Source: IPR
India remains as one of the highest growth markets for transportation
fuels despite the impact of a strong monsoon
31www.ril.com
fuels despite the impact of a strong monsoon
Air traffic up 18% on Y-o-Y basis driving strong growth in ATF demand
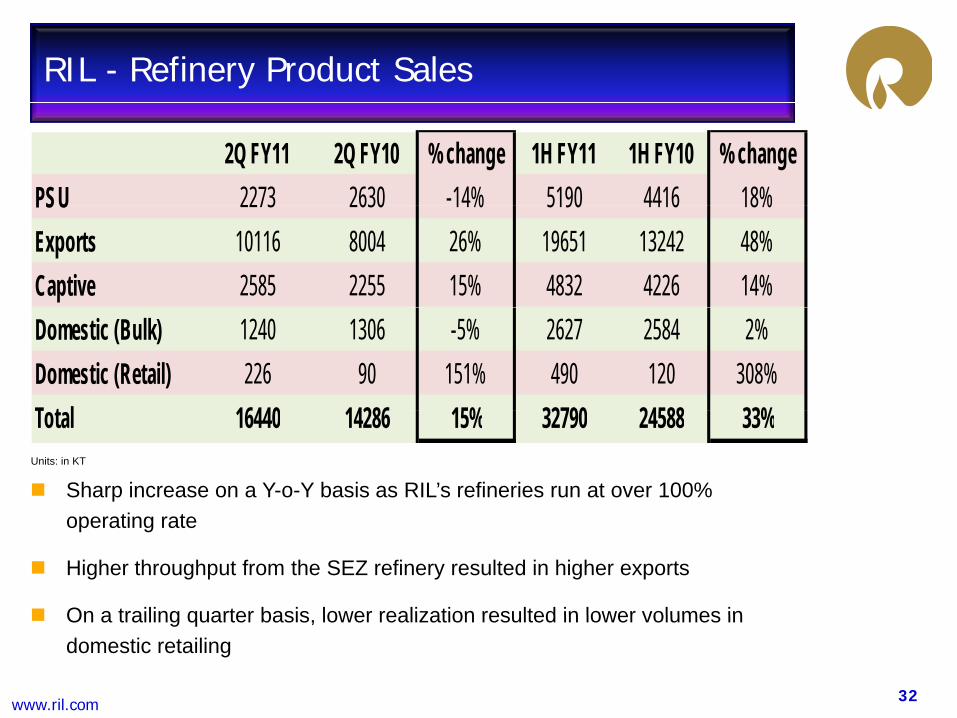
RIL - Refinery Product Sales
2Q FY11 2Q FY10 % change 1H FY11 1H FY10 % changePSU 2273 2630 -14% 5190 4416 18%PSU 2273 2630 14% 5190 4416 18%Exports 10116 8004 26% 19651 13242 48%Captive 2585 2255 15% 4832 4226 14%Domestic (Bulk) 1240 1306 -5% 2627 2584 2%Domestic (Retail) 226 90 151% 490 120 308%T t l 16440 14286 15% 32790 24588 33%
Sharp increase on a Y-o-Y basis as RIL’s refineries run at over 100% i
Units: in KT
Total 16440 14286 15% 32790 24588 33%
operating rate
Higher throughput from the SEZ refinery resulted in higher exports
On a trailing quarter basis lower realization resulted in lower volumes in
32www.ril.com
On a trailing quarter basis, lower realization resulted in lower volumes in domestic retailing
R&M Business Summary
Higher demand for transportation fuels as economic environment improves
Significant improvement in margin environment on a Y-o-Y basis even as
gasoline cracks remain an area of concern
Non-OECD demand growth led by developing Asia and LatAm provided
support to higher product crackspp g p
Light Heavy differential widens as OPEC compliance remains low and
d d f li ht d t idemand for lighter products improves
Volume growth and better margins resulted in improved performance
33www.ril.com
Volume growth and better margins resulted in improved performance
Petrochemicals
Polymers & Chemicals
34www.ril.com
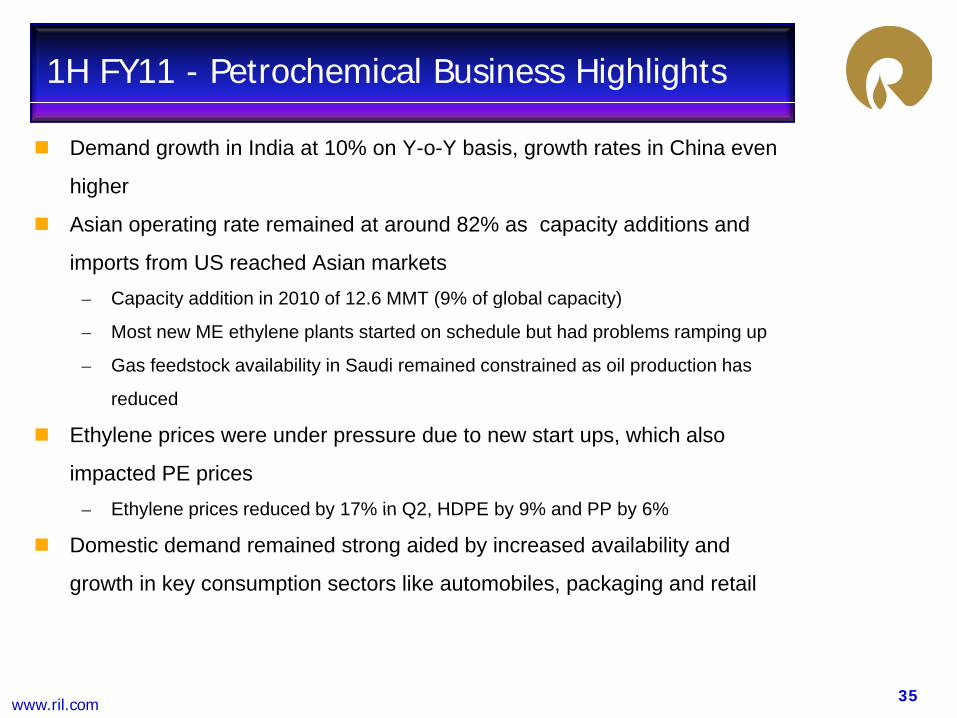
1H FY11 - Petrochemical Business Highlights
Demand growth in India at 10% on Y-o-Y basis, growth rates in China even
higher
Asian operating rate remained at around 82% as capacity additions and
imports from US reached Asian markets– Capacity addition in 2010 of 12.6 MMT (9% of global capacity)p y ( g p y)
– Most new ME ethylene plants started on schedule but had problems ramping up
– Gas feedstock availability in Saudi remained constrained as oil production has
reduced
Ethylene prices were under pressure due to new start ups, which also
impacted PE prices– Ethylene prices reduced by 17% in Q2 HDPE by 9% and PP by 6%Ethylene prices reduced by 17% in Q2, HDPE by 9% and PP by 6%
Domestic demand remained strong aided by increased availability and
growth in key consumption sectors like automobiles, packaging and retail
35www.ril.com
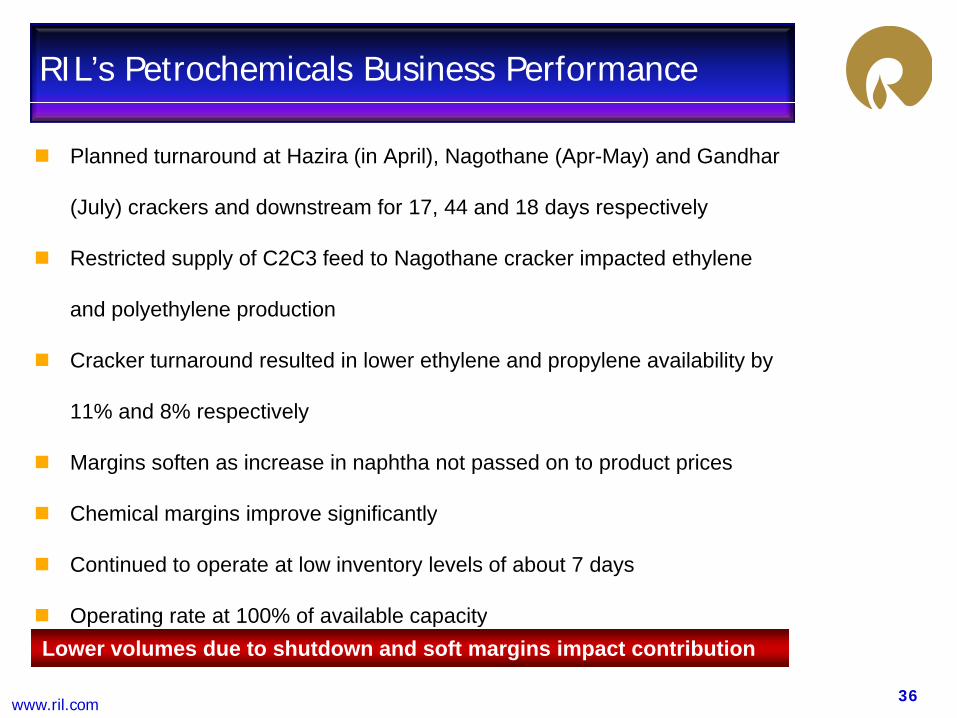
RIL’s Petrochemicals Business Performance
Planned turnaround at Hazira (in April), Nagothane (Apr-May) and Gandhar
(July) crackers and downstream for 17 44 and 18 days respectively(July) crackers and downstream for 17, 44 and 18 days respectively
Restricted supply of C2C3 feed to Nagothane cracker impacted ethylene
and polyethylene productionand polyethylene production
Cracker turnaround resulted in lower ethylene and propylene availability by
11% and 8% respectively11% and 8% respectively
Margins soften as increase in naphtha not passed on to product prices
Chemical margins improve significantlyChemical margins improve significantly
Continued to operate at low inventory levels of about 7 days
Operating rate at 100% of available capacity
36www.ril.com
Operating rate at 100% of available capacityLower volumes due to shutdown and soft margins impact contribution
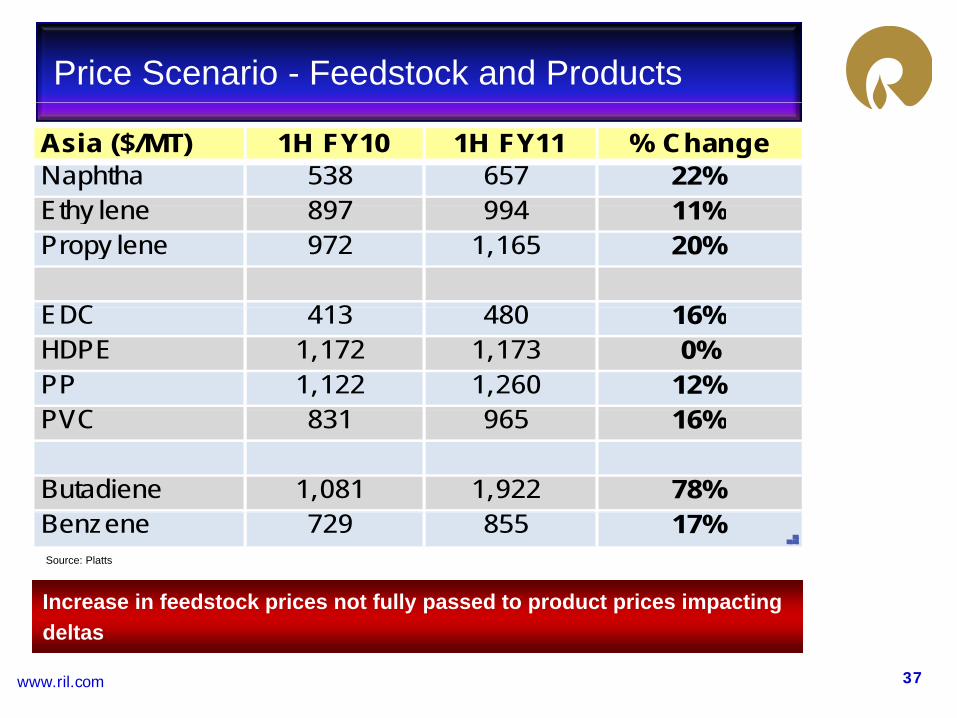
Price Scenario - Feedstock and Products
Asia ($/MT) 1H FY10 1H FY11 % ChangeNaphtha 538 657 22%Eth l 897 994 11%Ethy lene 897 994 11%Propy lene 972 1,165 20%
EDC 413 480 16%EDC 413 480 16%HDPE 1,172 1,173 0%PP 1,122 1,260 12%PVC 831 965 16%PVC 831 965 16%
Butadiene 1,081 1,922 78%Benzene 729 855 17%Source: Platts
Increase in feedstock prices not fully passed to product prices impacting
37www.ril.com
deltas
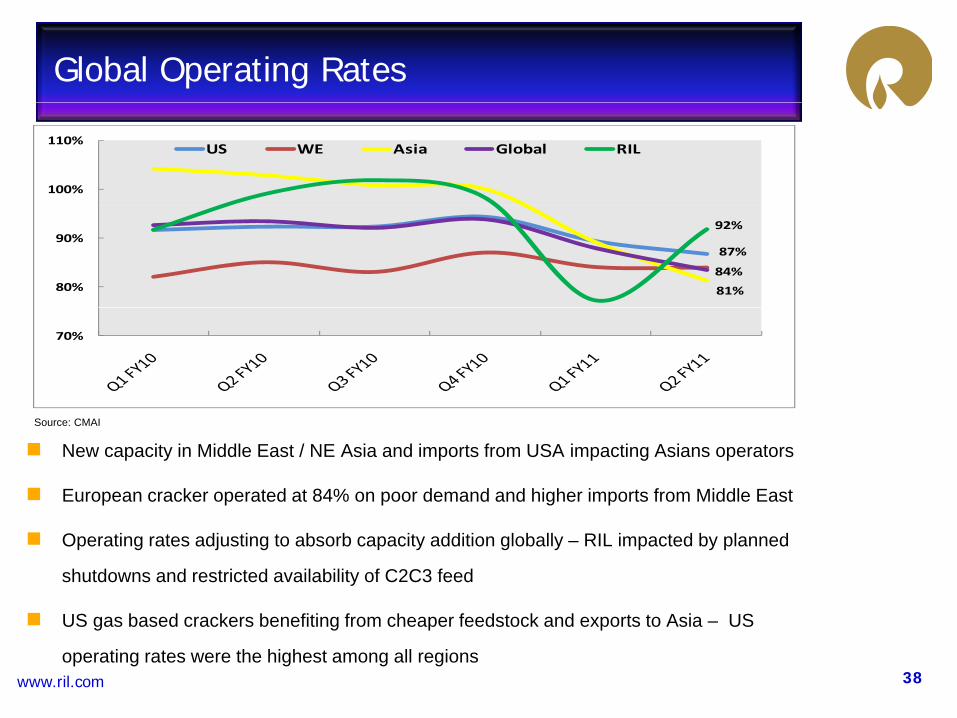
Global Operating Rates
100%
110%US WE Asia Global RIL
87%
81%
84%
92%
80%
90%
70%
Source: CMAI
New capacity in Middle East / NE Asia and imports from USA impacting Asians operators
European cracker operated at 84% on poor demand and higher imports from Middle East
Operating rates adjusting to absorb capacity addition globally – RIL impacted by planned
shutdowns and restricted availability of C2C3 feed
US b d k b fiti f h f d t k d t t A i US
38www.ril.com
US gas based crackers benefiting from cheaper feedstock and exports to Asia – US
operating rates were the highest among all regions
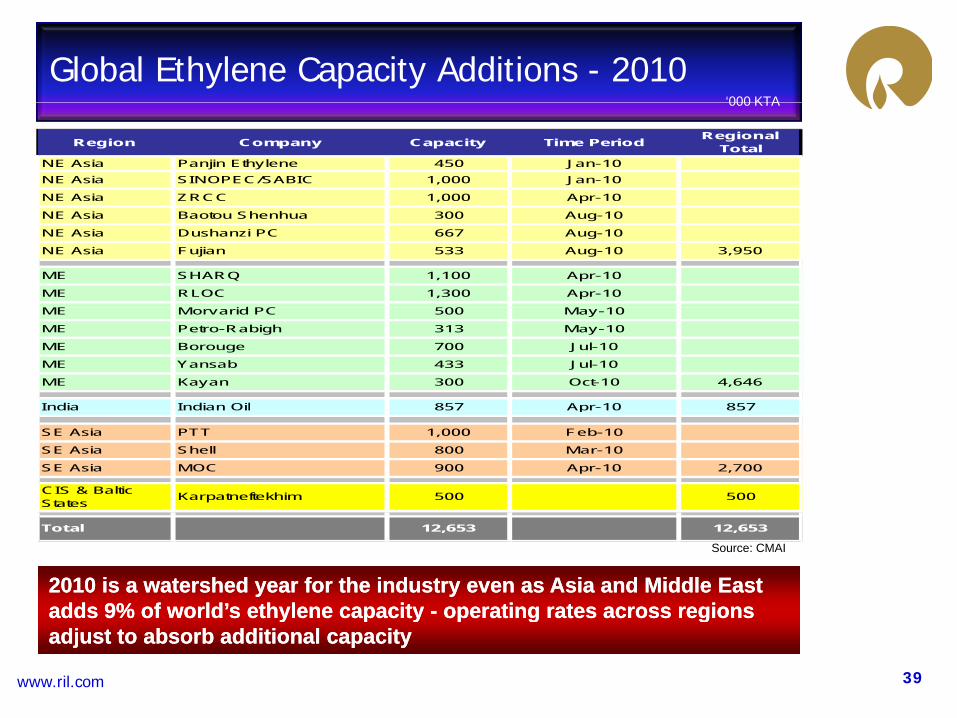
Global Ethylene Capacity Additions - 2010‘000 KTA000 KTA
Region Company Capacity Time Period Regional Total
NE Asia Panjin Ethylene 450 Jan-10NE Asia SINOPEC/SABIC 1,000 Jan-10
NE Asia ZRCC 1,000 Apr-10
NE Asia Baotou Shenhua 300 Aug-10
NE Asia Dushanzi PC 667 Aug-10
NE Asia Fujian 533 Aug-10 3,950
ME SHARQ 1,100 Apr-10
ME RLOC 1,300 Apr-10
ME M id PC 500 M 10ME Morvarid PC 500 May-10
ME Petro-Rabigh 313 May-10
ME Borouge 700 Jul-10
ME Yansab 433 Jul-10
ME Kayan 300 Oct-10 4,646
India Indian Oil 857 Apr-10 857India Indian Oil 857 Apr 10 857
SE Asia PTT 1,000 Feb-10
SE Asia Shell 800 Mar-10
SE Asia MOC 900 Apr-10 2,700
CIS & Baltic States Karpatneftekhim 500 500
2010 is a watershed year for the industry even as Asia and Middle East 2010 is a watershed year for the industry even as Asia and Middle East adds 9adds 9% of% of world’s ethylene capacityworld’s ethylene capacity -- operating rates across regionsoperating rates across regions
Total 12,653 12,653
Source: CMAI
39www.ril.com
adds 9adds 9% of % of world s ethylene capacity world s ethylene capacity operating rates across regions operating rates across regions adjust to absorb additional capacityadjust to absorb additional capacity
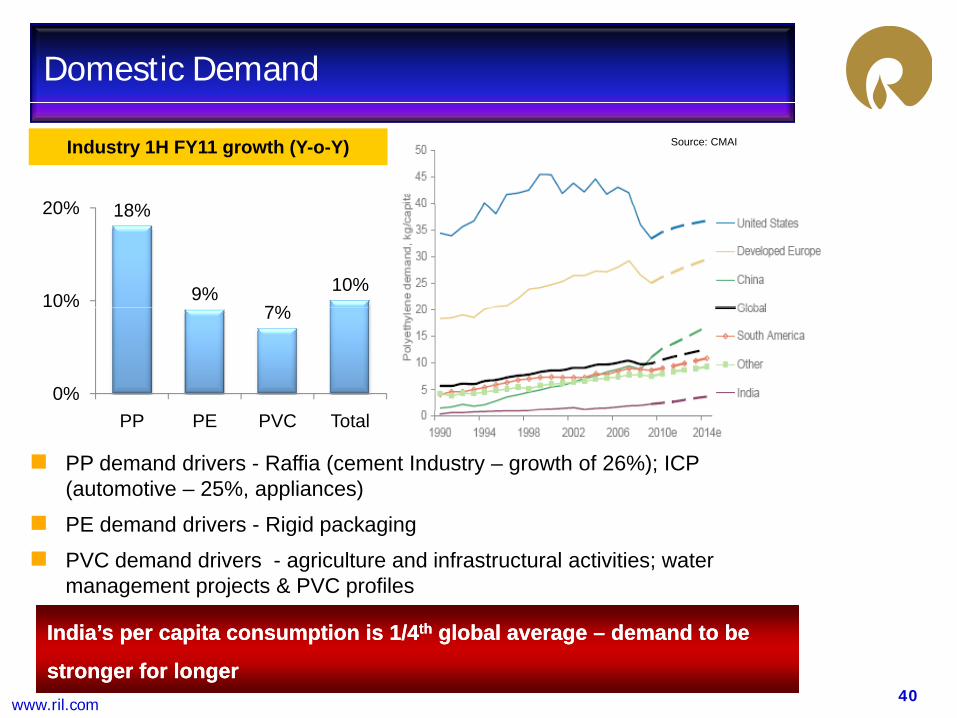
Domestic Demand
Industry 1H FY11 growth (Y-o-Y)
18%20%
Source: CMAI
18%
9%7%
10%10%
20%
7%
0%
PP demand drivers - Raffia (cement Industry – growth of 26%); ICP (automotive – 25%, appliances)
PP PE PVC Total
PE demand drivers - Rigid packaging
PVC demand drivers - agriculture and infrastructural activities; water management projects & PVC profiles
40www.ril.com
India’s per capita consumption is 1/4India’s per capita consumption is 1/4thth global average global average –– demand to be demand to be
stronger for longerstronger for longer
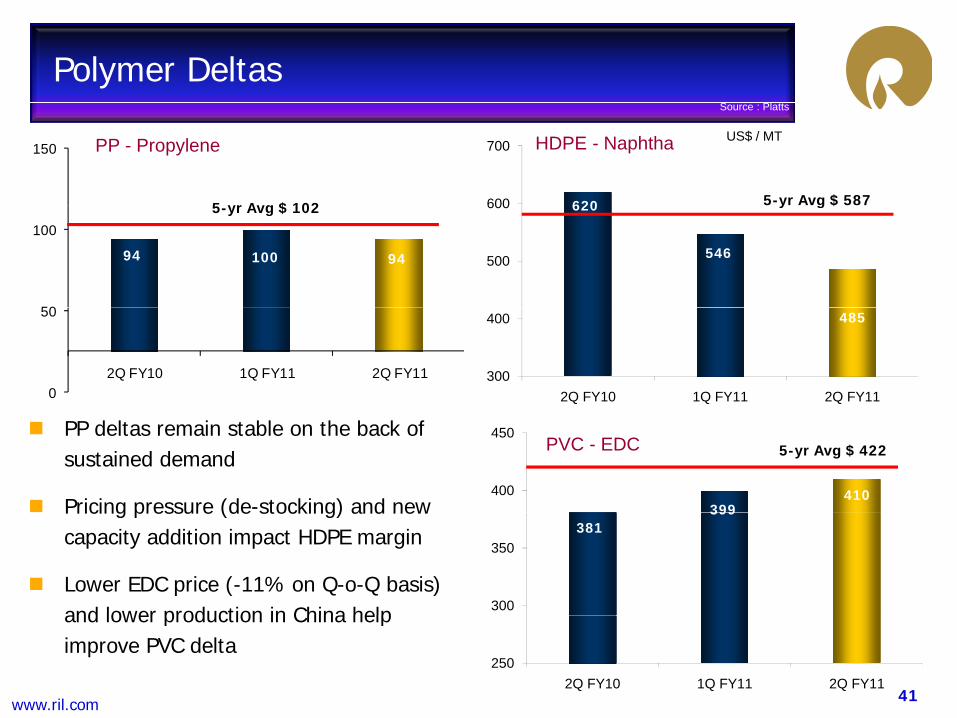
Polymer Deltas S
US$ / MT
620600
700150 HDPE - Naphtha
Source : Platts
PP - Propylene
5 yr Avg $ 102 5-yr Avg $ 587620
546500
600
94 100 94
50
1005-yr Avg $ 102 5 yr Avg $ 587
485
300
400
2Q FY10 1Q FY11 2Q FY110
50
2Q FY10 1Q FY11 2Q FY11
399410400
450PVC - EDC
PP deltas remain stable on the back of sustained demand
Pricing pressure (de-stocking) and new
5-yr Avg $ 422
381399
300
350
Pricing pressure (de stocking) and new capacity addition impact HDPE margin
Lower EDC price (-11% on Q-o-Q basis) and lower production in China help
41www.ril.com
2502Q FY10 1Q FY11 2Q FY11
and lower production in China help improve PVC delta
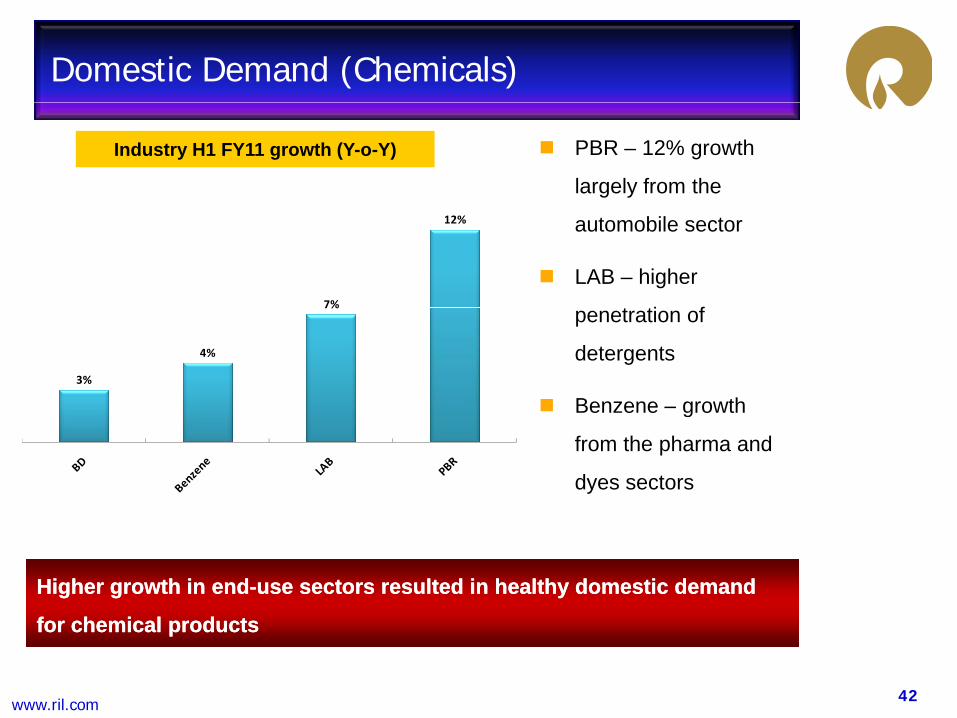
Domestic Demand (Chemicals)
PBR – 12% growth
largely from the
Industry H1 FY11 growth (Y-o-Y)
automobile sector
LAB – higher
t ti f7%
12%
penetration of
detergents
Benzene – growth3%
4%
7%
Benzene growth
from the pharma and
dyes sectors
Higher growth in endHigher growth in end--use sectors resulted in healthy domestic demand use sectors resulted in healthy domestic demand
42www.ril.com
for chemical productsfor chemical products
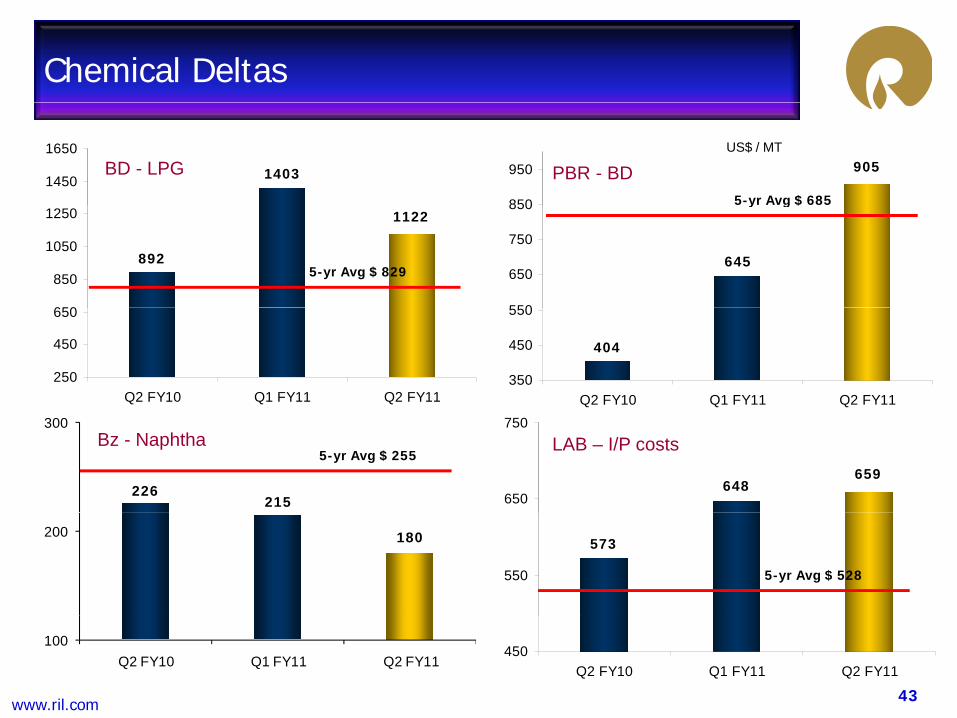
Chemical Deltas
14031450
1650905
850
950
5-yr Avg $ 685
BD - LPG PBR - BDUS$ / MT
892
1122
650
850
1050
1250
645
550
650
750
850 y g $
5-yr Avg $ 829
250
450
650
Q2 FY10 Q1 FY11 Q2 FY11
404
350
450
550
Q2 FY10 Q1 FY11 Q2 FY11
226215
300
648659
650
750
5-yr Avg $ 255Bz - Naphtha LAB – I/P costs
180200573
550 5-yr Avg $ 528
43www.ril.com
100Q2 FY10 Q1 FY11 Q2 FY11
450Q2 FY10 Q1 FY11 Q2 FY11
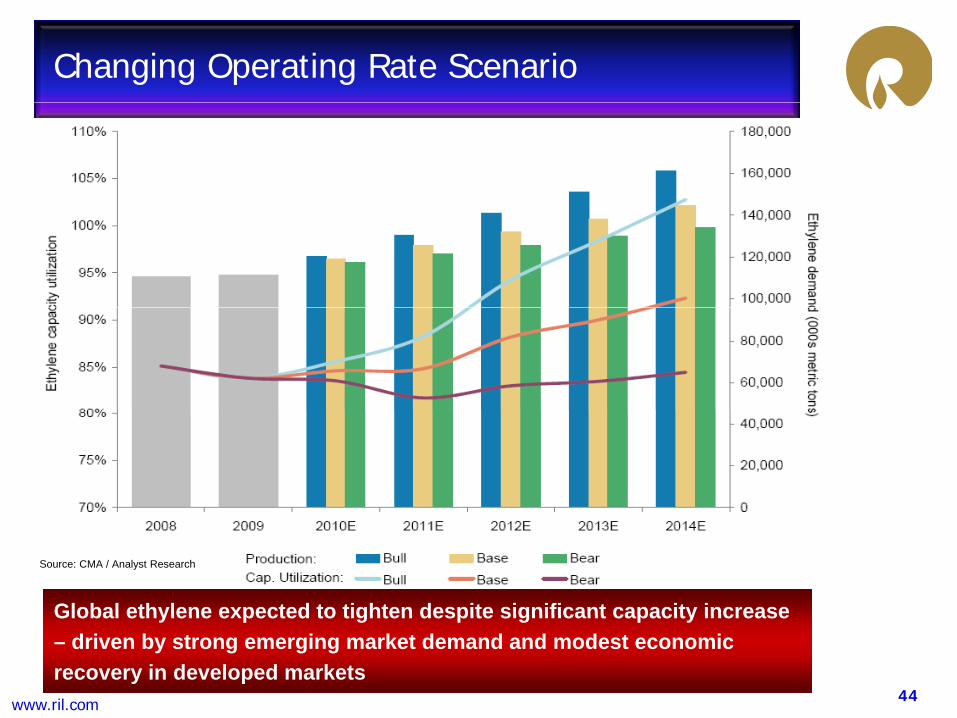
Changing Operating Rate Scenario
Global ethylene expected to tighten despite significant capacity increase
Source: CMA / Analyst Research
44www.ril.com
Global ethylene expected to tighten despite significant capacity increase – driven by strong emerging market demand and modest economic recovery in developed markets
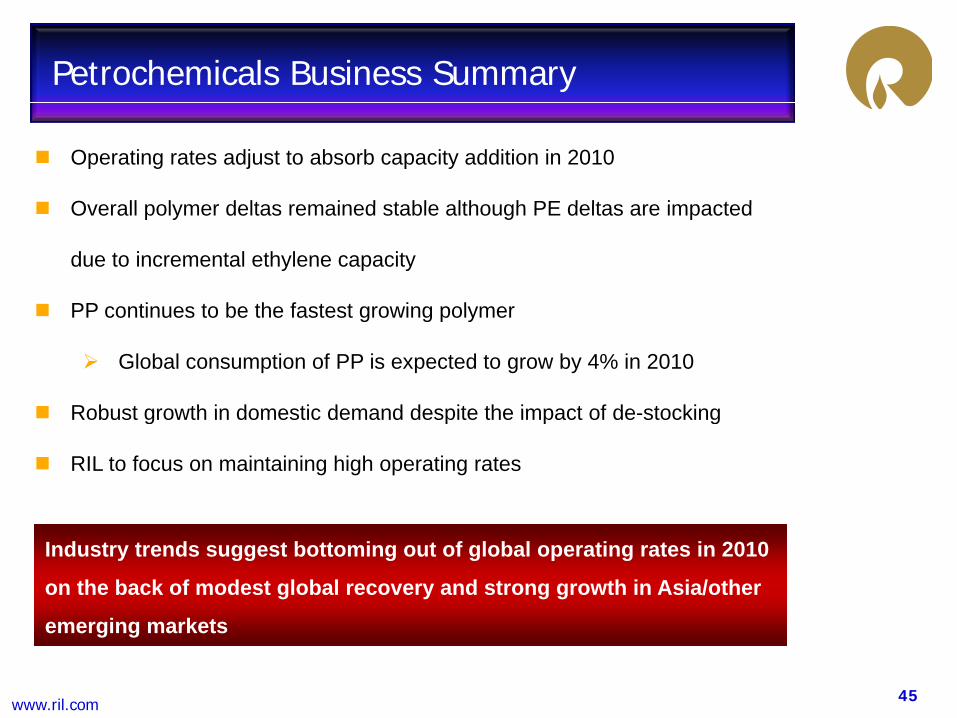
Petrochemicals Business Summary
Operating rates adjust to absorb capacity addition in 2010
Overall polymer deltas remained stable although PE deltas are impactedOverall polymer deltas remained stable although PE deltas are impacted
due to incremental ethylene capacity
PP continues to be the fastest growing polymerPP continues to be the fastest growing polymer
Global consumption of PP is expected to grow by 4% in 2010
Robust growth in domestic demand despite the impact of de stockingRobust growth in domestic demand despite the impact of de-stocking
RIL to focus on maintaining high operating rates
Industry trends suggest bottoming out of global operating rates in 2010
on the back of modest global recovery and strong growth in Asia/other
45www.ril.com
emerging markets

Petrochemicals
Polyester and Fibre Intermediates
46www.ril.com
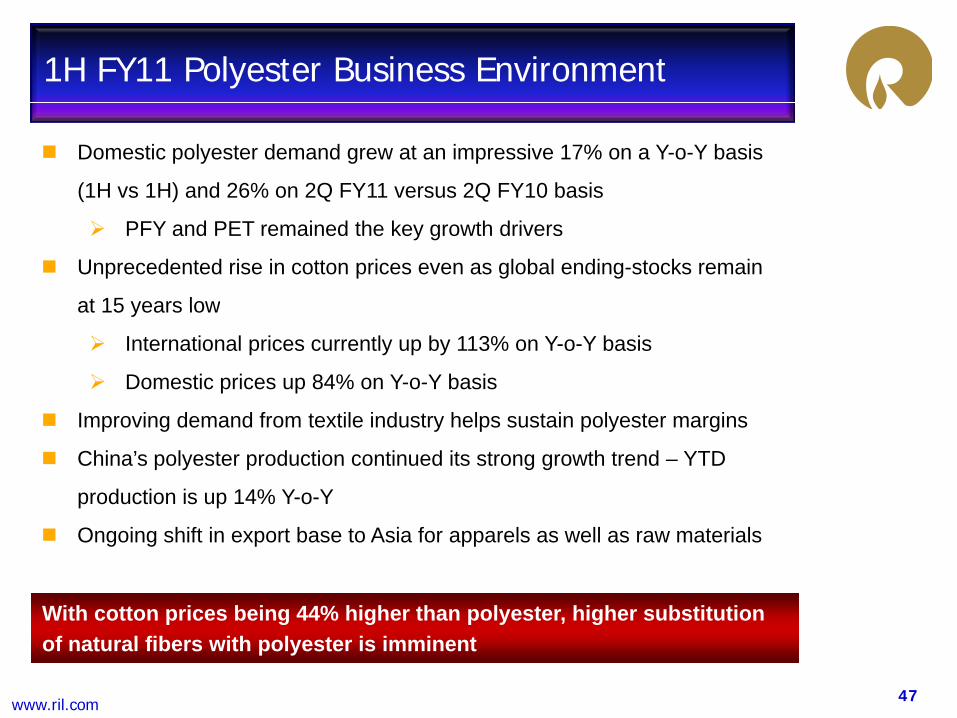
1H FY11 Polyester Business Environment
Domestic polyester demand grew at an impressive 17% on a Y-o-Y basis
(1H vs 1H) and 26% on 2Q FY11 versus 2Q FY10 basis
PFY and PET remained the key growth drivers
Unprecedented rise in cotton prices even as global ending-stocks remain
at 15 years lowat 15 years low
International prices currently up by 113% on Y-o-Y basis
Domestic prices up 84% on Y-o-Y basis
Improving demand from textile industry helps sustain polyester margins
China’s polyester production continued its strong growth trend – YTD
production is up 14% Y-o-Y
Ongoing shift in export base to Asia for apparels as well as raw materials
With cotton prices being 44% higher than polyester higher substitution
47www.ril.com
With cotton prices being 44% higher than polyester, higher substitution of natural fibers with polyester is imminent
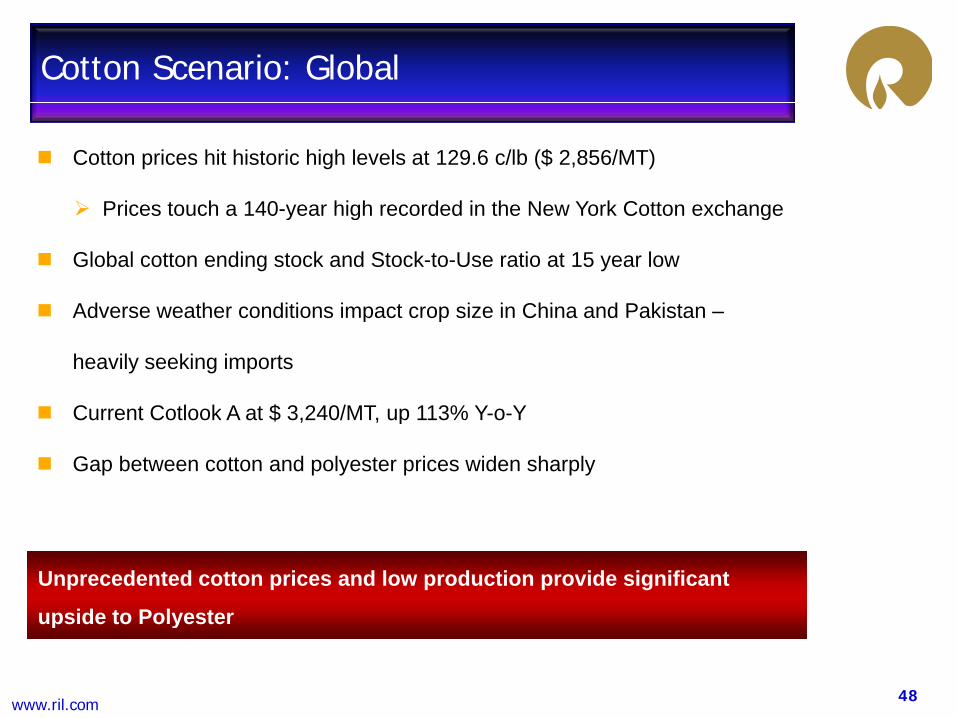
Cotton Scenario: Global
Cotton prices hit historic high levels at 129.6 c/lb ($ 2,856/MT)
Prices touch a 140 year high recorded in the New York Cotton exchangePrices touch a 140-year high recorded in the New York Cotton exchange
Global cotton ending stock and Stock-to-Use ratio at 15 year low
Adverse weather conditions impact crop size in China and PakistanAdverse weather conditions impact crop size in China and Pakistan –
heavily seeking imports
Current Cotlook A at $ 3 240/MT up 113% Y o YCurrent Cotlook A at $ 3,240/MT, up 113% Y-o-Y
Gap between cotton and polyester prices widen sharply
Unprecedented cotton prices and low production provide significant
upside to Polyester
48www.ril.com
upside to Polyester
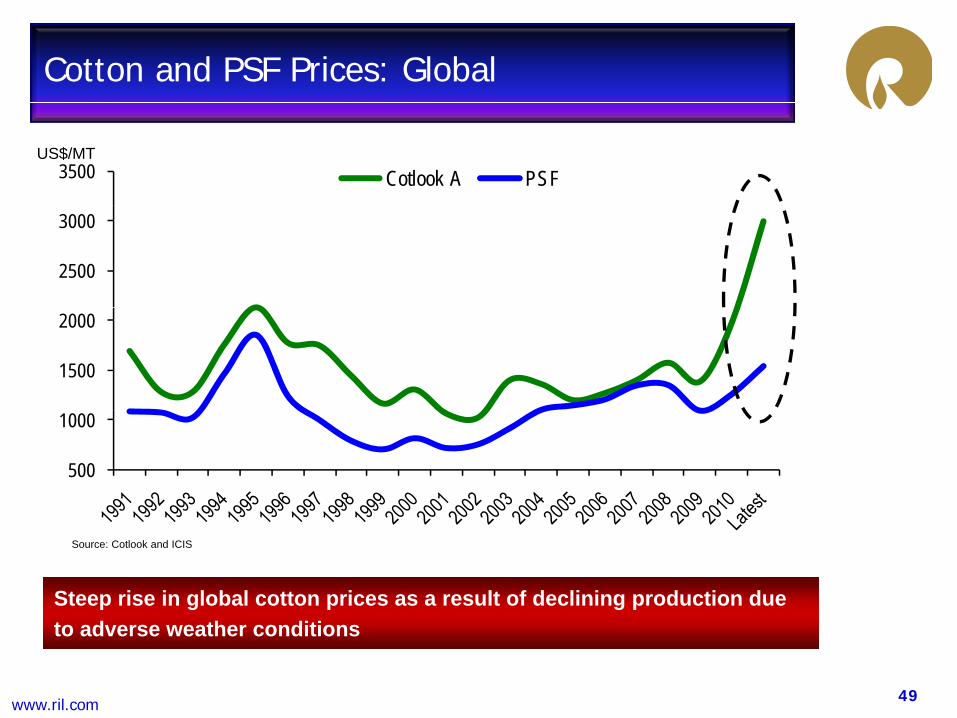
Cotton and PSF Prices: Global
3500 Cotlook A PSFUS$/MT
2500
3000
1500
2000
500
1000
Source: Cotlook and ICIS
Steep rise in global cotton prices as a result of declining production due
49www.ril.com
to adverse weather conditions
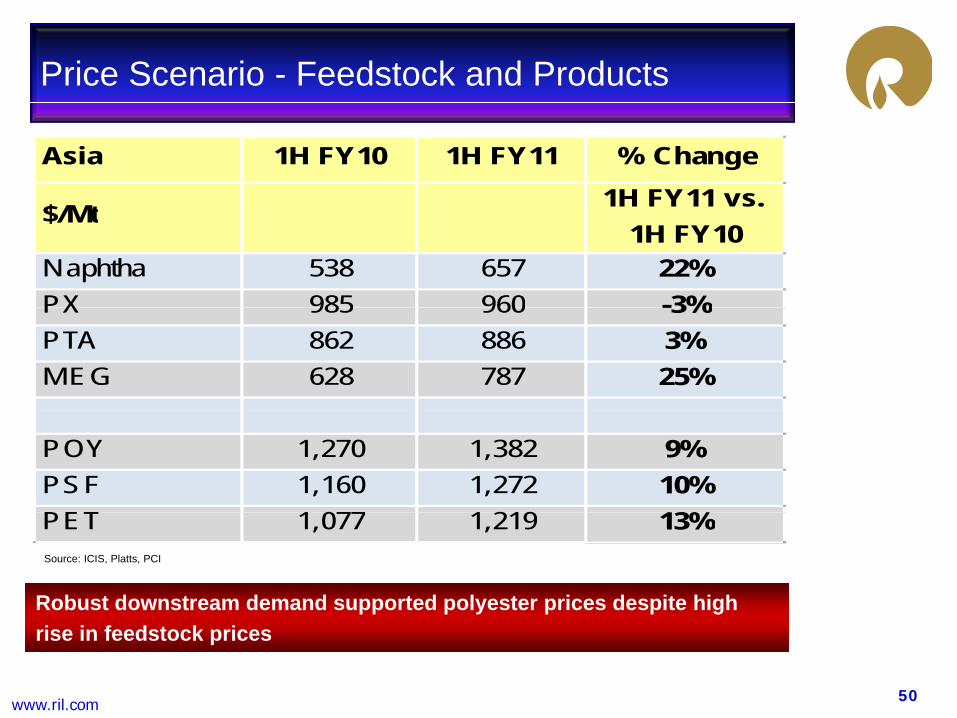
Price Scenario - Feedstock and Products
Asia 1H FY10 1H FY11 % Change
$/ 1H FY11 vs. $/Mt 1H FY11 vs. 1H FY10
Naphtha 538 657 22%PX 985 960 -3%PX 985 960 -3%PTA 862 886 3%MEG 628 787 25%
POY 1,270 1,382 9%PSF 1,160 1,272 10%PET 1 077 1 219 13%Source: ICIS, Platts, PCI
Robust downstream demand supported polyester prices despite high
PET 1,077 1,219 13%
50www.ril.com
rise in feedstock prices
Domestic Polyester Growth
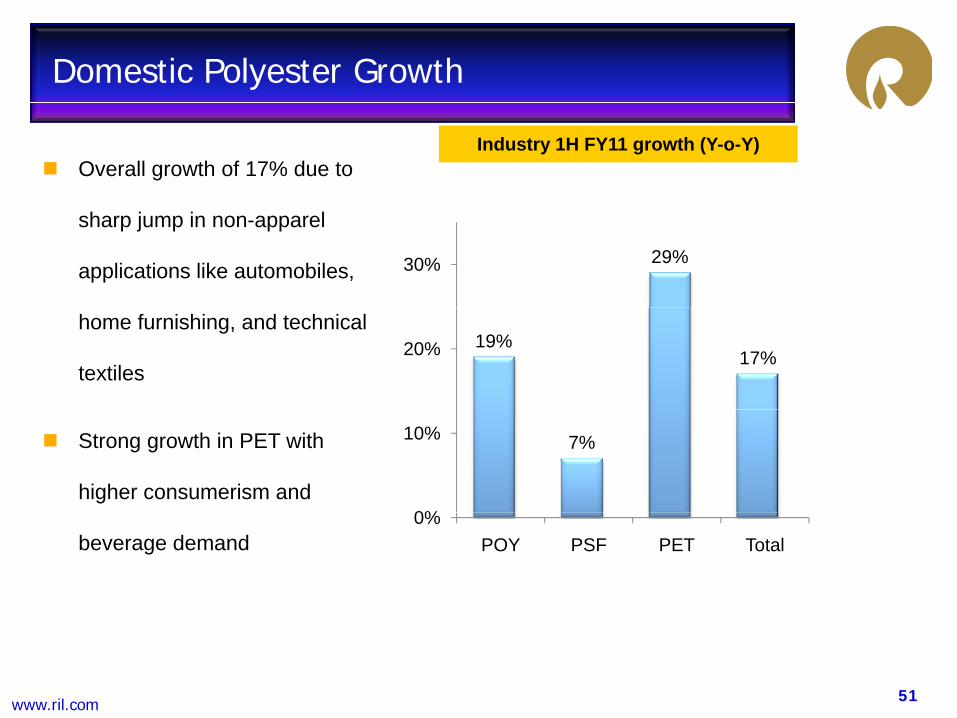
Overall growth of 17% due to Industry 1H FY11 growth (Y-o-Y)
sharp jump in non-apparel
applications like automobiles, 29%30%
home furnishing, and technical
textiles19%
17%20%
Strong growth in PET with
higher consumerism and
7%
0%
10%
beverage demand0%
POY PSF PET Total
51www.ril.com
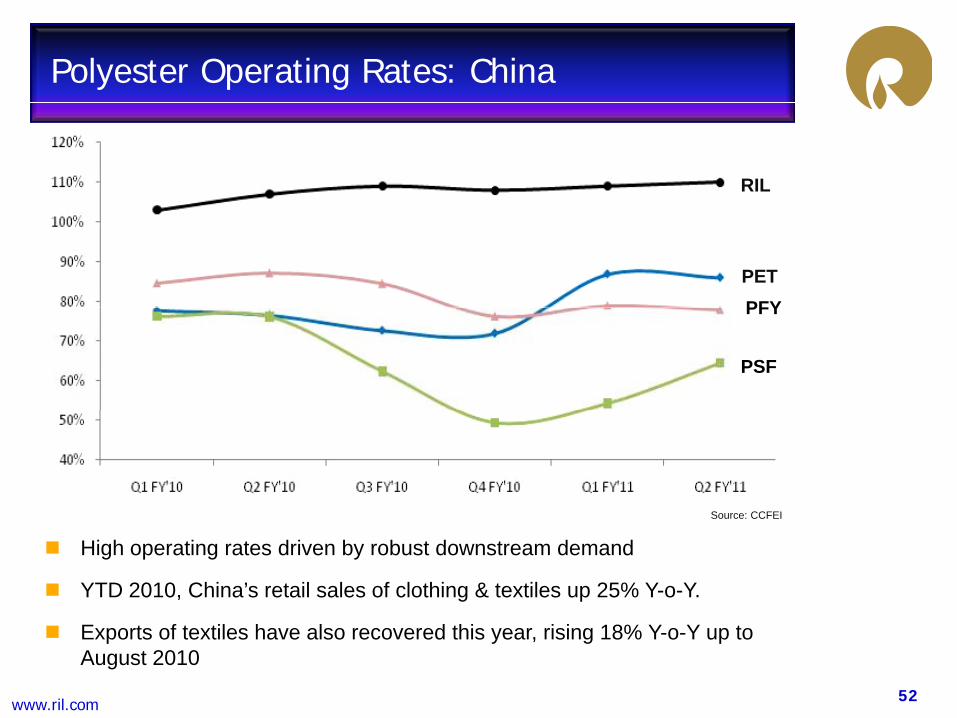
Polyester Operating Rates: China
RIL
PETPFYPFY
PSF
S CCFEISource: CCFEI
High operating rates driven by robust downstream demand
YTD 2010, China’s retail sales of clothing & textiles up 25% Y-o-Y.
52www.ril.com
Exports of textiles have also recovered this year, rising 18% Y-o-Y up to August 2010
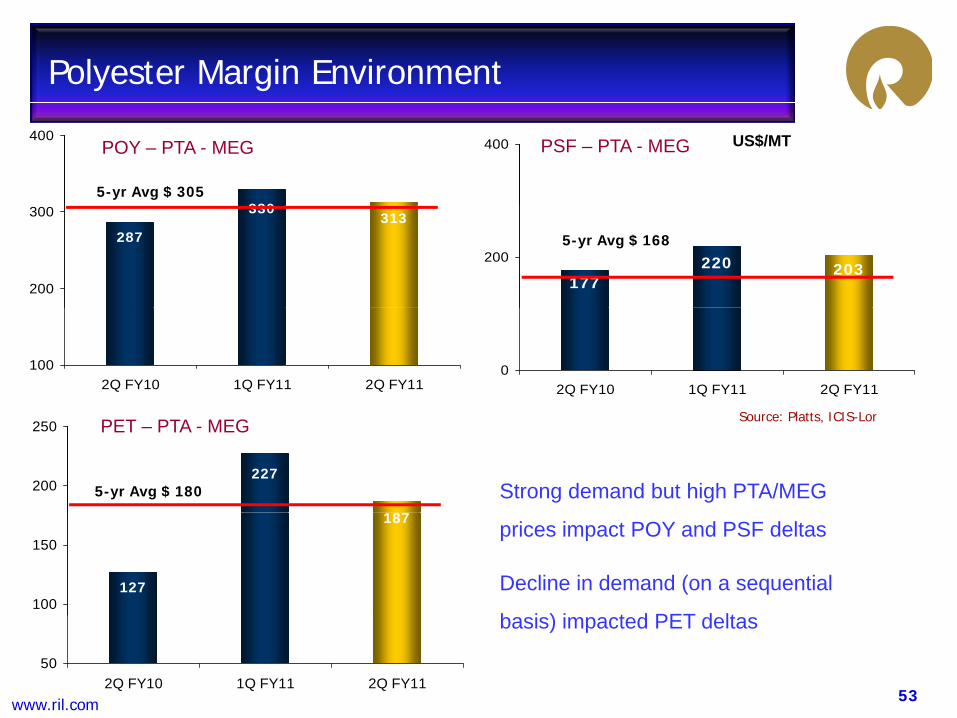
Polyester Margin Environment
400 US$/MT
330
400POY – PTA - MEG PSF – PTA - MEG
5-yr Avg $ 305
220 203177
200
330313
287
200
300
5-yr Avg $ 168
02Q FY10 1Q FY11 2Q FY11
1002Q FY10 1Q FY11 2Q FY11
Source: Platts, ICIS-Lor
Strong demand but high PTA/MEG
PET – PTA - MEG
227
187
200
250
5-yr Avg $ 180
prices impact POY and PSF deltas
Decline in demand (on a sequential
b i ) i t d PET d lt
187
127100
150
53www.ril.com
basis) impacted PET deltas
502Q FY10 1Q FY11 2Q FY11
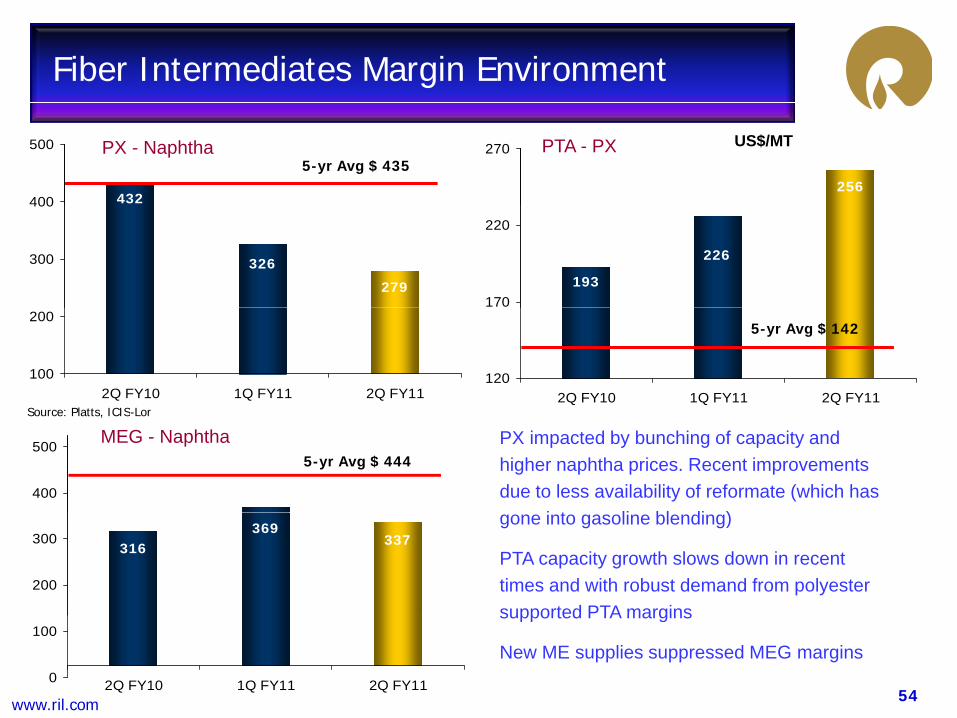
Fiber Intermediates Margin Environment
256
270
432400
500 PX - Naphtha PTA - PX5-yr Avg $ 435
US$/MT
226
193170
220
326
279
300
400
1202Q FY10 1Q FY11 2Q FY11
Source: Platts ICIS Lor
100
200
2Q FY10 1Q FY11 2Q FY11
5-yr Avg $ 142
PX impacted by bunching of capacity and higher naphtha prices. Recent improvements due to less availability of reformate (which has
i t li bl di )400
500
Source: Platts, ICIS-Lor
MEG - Naphtha5-yr Avg $ 444
gone into gasoline blending)
PTA capacity growth slows down in recent times and with robust demand from polyester supported PTA margins
369337316
200
300
54www.ril.com
supported PTA margins
New ME supplies suppressed MEG margins 0
100
2Q FY10 1Q FY11 2Q FY11
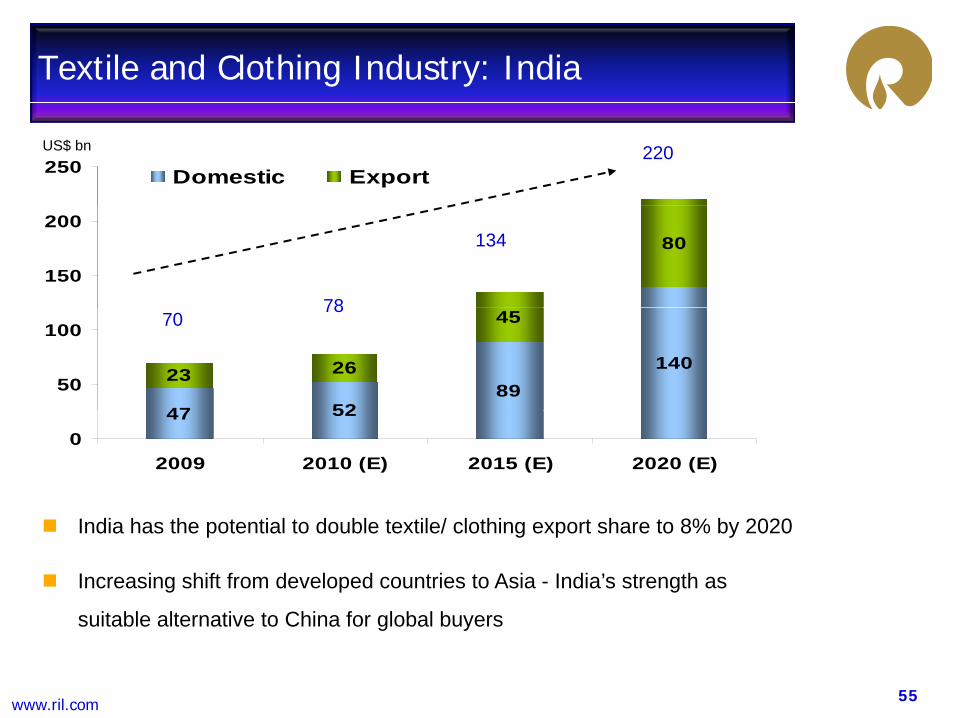
Textile and Clothing Industry: India
US$ bn250 Domestic Export
220
80
150
200
78
134
47 5289
14023 26
45
50
100 7078
Source: Technopak
47 520
2009 2010 (E) 2015 (E) 2020 (E)
India has the potential to double textile/ clothing export share to 8% by 2020
Increasing shift from developed countries to Asia - India’s strength as
s itable alternati e to China for global b ers
55www.ril.com
suitable alternative to China for global buyers
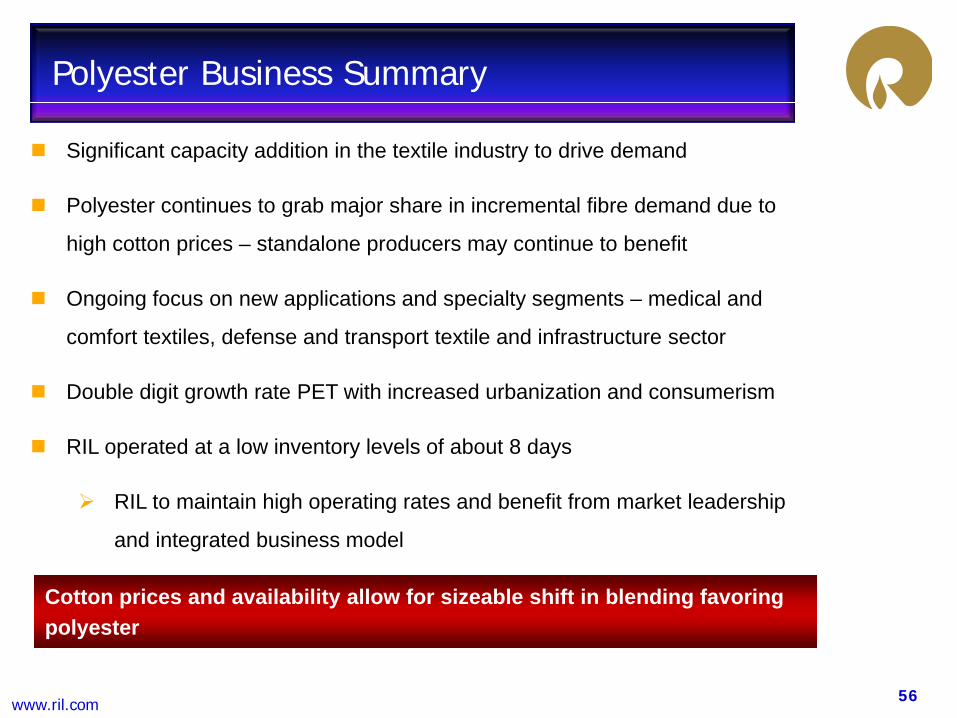
Polyester Business Summary
Significant capacity addition in the textile industry to drive demand
Polyester continues to grab major share in incremental fibre demand due toPolyester continues to grab major share in incremental fibre demand due to
high cotton prices – standalone producers may continue to benefit
Ongoing focus on new applications and specialty segments – medical and g g pp p y g
comfort textiles, defense and transport textile and infrastructure sector
Double digit growth rate PET with increased urbanization and consumerism
RIL operated at a low inventory levels of about 8 days
RIL to maintain high operating rates and benefit from market leadership
Cotton prices and availability allow for sizeable shift in blending favoring
g p g p
and integrated business model
56www.ril.com
polyester
Summary
57www.ril.com
Summary
Margin outlook improves for refining - L-H differentials expand and strong
d d f OECD k t id d t l t t itidemand from non-OECD markets provide product placement opportunities
Strong domestic demand growth in petrochemicals
All facilities working at safe and near peak performance
Investments in shale gas business in the USA to lead to volume growth in
upstream oil and business
Strong balance sheet with high liquidity to drive future growth
RIL is uniquely positioned to benefit from its leadership in quality of assets world-class scale and competitive cost position
Strong balance sheet with high liquidity to drive future growth
58www.ril.com
assets, world-class scale and competitive cost position
Th k YTh k YThank YouThank You