Embed Size (px)
Citation preview
1H2021 Results PresentationPT Bank Tabungan Negara (Persero) Tbk.
Transforming Business Process for Leading Results

IMPORTANT: The following forms part of, and should be read in conjunction with, the other material in this presentation
This presentation contains privileged information and has been prepared solely for the recipient(s). By accepting a copy (or thecontents) of this presentation, you are deemed to have acknowledged and agreed to the provisions appearing hereinafter. Theexistence of this presentation and the contents thereof should not be disclosed, reproduced, copied or otherwise disseminated toany other person or published, in whole or in part, without prior consent of PT Bank Tabungan Negara (Persero) Tbk. (“BTN” or the“Company”).
This presentation does not constitute or form part of any offer for sale or invitation, or solicitation of an offer, to subscribe for orpurchase any securities and neither this document nor anything contained herein shall form the basis of or be relied on inconnection with any contract or commitment whatsoever. Any decision to purchase or subscribe for securities should be made onlyon the basis of the information contained in a prospectus or offering circular issued by the Company in connection with any suchoffering.
Information and opinions contained in this presentation are provided for reference of the recipients only and are not to be reliedupon as authoritative or without the recipient’s own independent verification or taken in substitution for the exercise of therecipient’s own judgment. Any reference to past performance should not be taken as an indication of future performance. Infurnishing the presentation, the Company has not undertaken to provide the recipient(s) with access to any additional informationor updates. None of the Company warrant or guarantee whatsoever that this presentation will lead to the successful completion, orconsummation, of any transactions whether or not under contemplation.
Accordingly the Company disclaims any liability whatsoever in connection therewith and with any decisions that might be takenupon the basis of this presentation, directly or indirectly. In particular, the Company owe no duty to the recipient (except as requiredby applicable laws) to exercise any judgment on its behalf as to the merits or suitability of any transaction. The recipient agrees thatthe merits or suitability of any such transaction to its particular situation will be independently determined by the recipientincluding consideration of the legal, tax, accounting, regulatory, financial and other related aspects thereof.
Disclaimer
2

AGENDA
Management Notes 06
1H2021 Summary 20
1H2021 Results 31
Sharia Business 45
Appendices 48
Macro Economy & HPI 04
3

Macro Economy
• The global economy is expected to expand 5.6% in 2021, largely on strong rebounds from a few
major economies, but many developing economies continue to struggle with the COVID-19 pandemic
and its aftermath.
• The World Bank expects Indonesia to expand further in 2022 and 2023, just below India and China.
Source: World Bank, Global Economic Prospects, June 2021
-4,7%
2,9% 2,6%
1,0%
-3,5%
6,8%
4,2%
2,3%
-3,5%
5,6%
4,3%
3,1%
-6,6%
4,2% 4,4%
2,4%
-2,1%
4,4%5,0% 5,1%
2,3%
8,5%
5,4% 5,3%
-7,3%
8,3%7,5%
6,5%
2020 2021e 2022f 2023f
Japan United States World Output Euro Area Indonesia China India
Global Recovery Strong but Uneven
4

House Price IndexBTN HPI Shows Stable Growth in Overall House Price
HPI - National HPI – Type 36
HPI – Type 45 HPI – Type 70
National HPI growth was stable at 5.02% in June 2021, boosted by the significant hike on HPI growth of houses type 70 at 6.08% yoy.
HPI National HPI Type 36
HPI Type 36 HPI Type 70
5
MANAGEMENT NOTESTransforming Business Process for
Leading Results
6
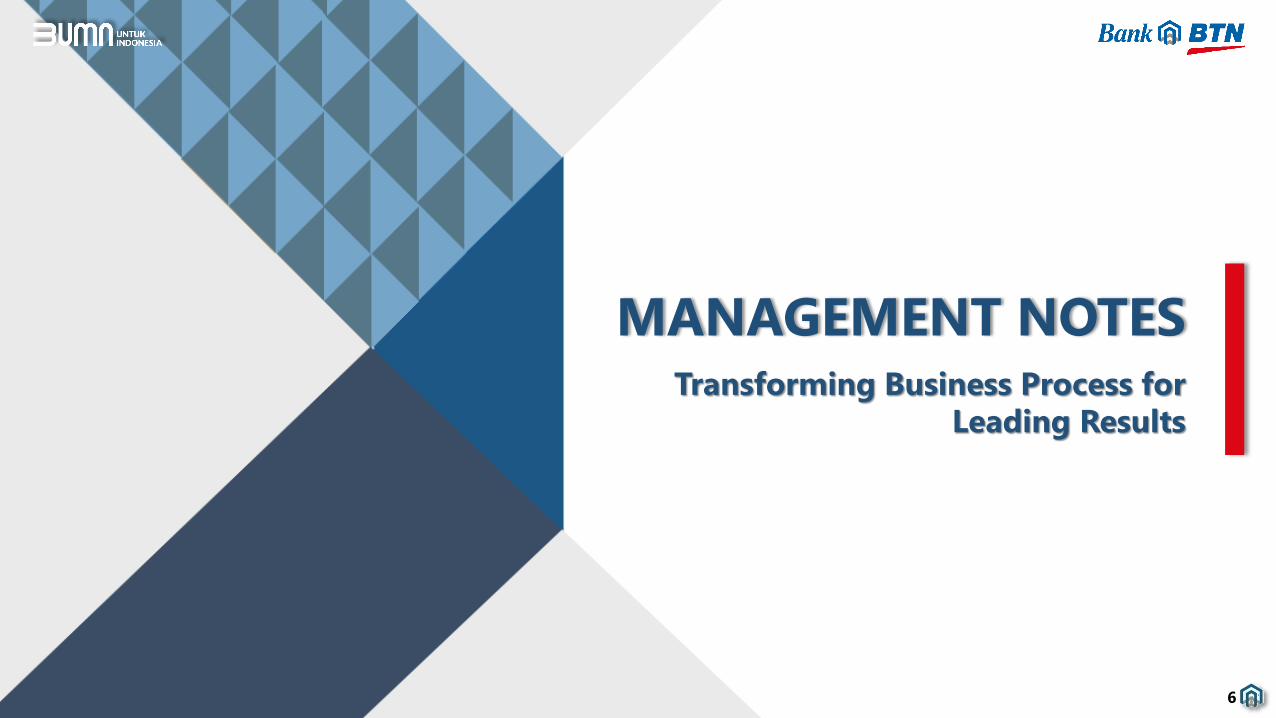
Investment PropositionHuge Market with Improved Business Model Supports High-Growth Potential
Large Housing Needs
High-Demand Consumer Segment
Focus in first-time home buyers
and the new-to-bank segment,
on top of the growing segments
of emerging affluent and
affluent in Indonesia
Largest Mortgage Provider
• Leader of mortgages in Indonesia with
41.46% market share*
• 86.00% share in Subsidized Mortgage*
Fully Collateralized Loans
90% of loan book is in housing
and are collateralized with
value of over 100%
Why
BBTN?
• Backlog of house ownership in
Indonesia reached 11.4 million in
2015** and estimated to still be
around 7.7 million in 2021***
• Low national mortgage
penetration of 2.93% of GDP
As one of the SOE Banks in Indonesia, BTN balances the role to support government programs in housing and large potential of business
growth and profitability as a business entity.
* As of March 31, 2 021
** Socioeconomics Survey, BPS, 2015
***BTN Housing Finance Center Study 7

Sustainable FinanceImplementing Sustainable Finance to Support Sustainable Development Goals
Corporate Social Responsibility
• Green Housing
• Retired Health
Services
• Internet for
Students of BTN
University Partners
• Increasing of
Subsidized
Customers Quality
of Life
• Financial and
Property Literacy
• Green Office
• Leader in
Subsidized Home
Financing
• Green Bond
Issuance
• Increase in
financing in
isolated areas
• Environmental Risk
Policy Making and
social issues
related to
Sustainable
Finance
• Procurement with
regards to
environment and
social aspects
• Whistleblowing
System
• API Certification
Why
BBTN?
• Online Training
for employees
• Socialization of
Sustainable
Financing for
employees
• Property Training
Programs (Mini
MBA, School of
Property
Developers)
In 2024 aimed to set BTN as leader in the housing sector and a trusted family financing partner that applies the principles of Sustainable Finance
to jointly achieve the goals of sustainable development in Indonesia.
8

“to be the
Best Mortgage
Bank in
Southeast
Asia”
Vision 2025
To maintain leadership in housing
financing and resolve the backlog
of house ownership, BTN will
refocus on providing mortgage
for the low-middle income
segment and developing a
housing ecosystem as a new
growth engine.
9
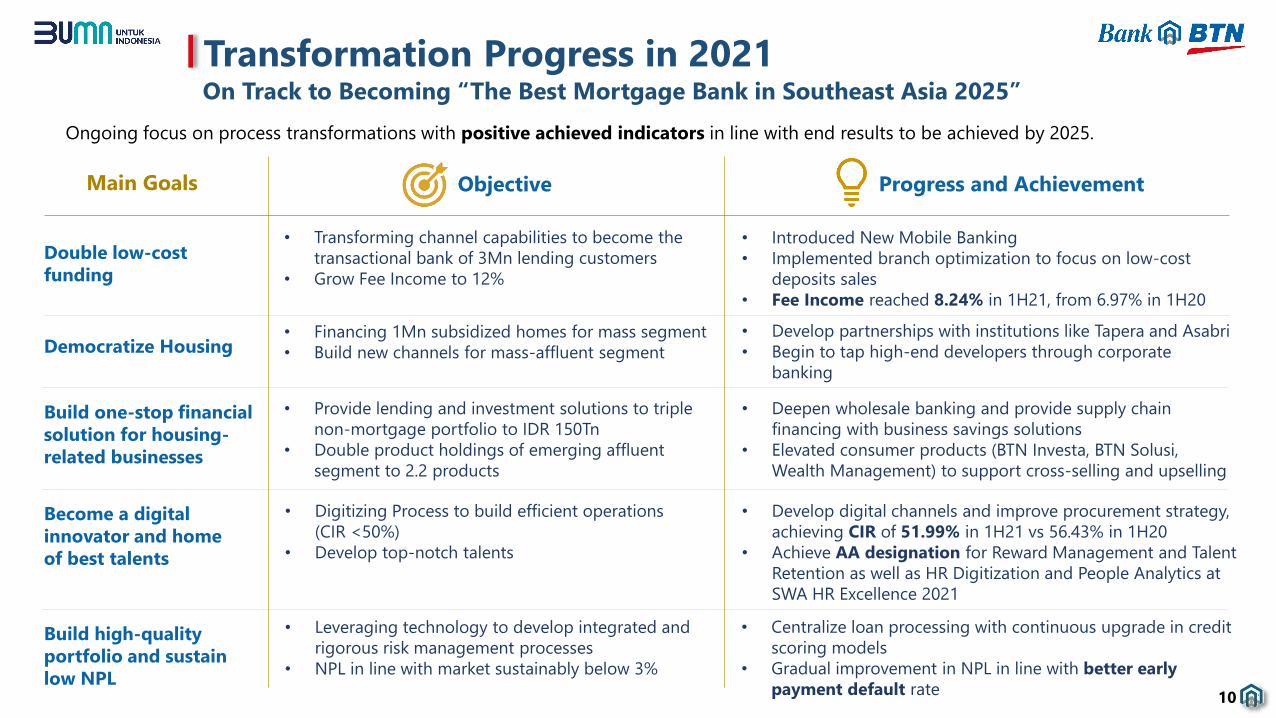
Transformation Progress in 2021On Track to Becoming “The Best Mortgage Bank in Southeast Asia 2025”
Objective Progress and Achievement
Double low-cost
funding
Democratize Housing
Build one-stop financial
solution for housing-
related businesses
Become a digital
innovator and home
of best talents
Build high-quality
portfolio and sustain
low NPL
• Transforming channel capabilities to become the
transactional bank of 3Mn lending customers
• Grow Fee Income to 12%
• Financing 1Mn subsidized homes for mass segment
• Build new channels for mass-affluent segment
• Provide lending and investment solutions to triple
non-mortgage portfolio to IDR 150Tn
• Double product holdings of emerging affluent
segment to 2.2 products
• Digitizing Process to build efficient operations
(CIR <50%)
• Develop top-notch talents
• Leveraging technology to develop integrated and
rigorous risk management processes
• NPL in line with market sustainably below 3%
• Introduced New Mobile Banking
• Implemented branch optimization to focus on low-cost
deposits sales
• Fee Income reached 8.24% in 1H21, from 6.97% in 1H20
• Develop partnerships with institutions like Tapera and Asabri
• Begin to tap high-end developers through corporate
banking
• Deepen wholesale banking and provide supply chain
financing with business savings solutions
• Elevated consumer products (BTN Investa, BTN Solusi,
Wealth Management) to support cross-selling and upselling
• Develop digital channels and improve procurement strategy,
achieving CIR of 51.99% in 1H21 vs 56.43% in 1H20
• Achieve AA designation for Reward Management and Talent
Retention as well as HR Digitization and People Analytics at
SWA HR Excellence 2021
• Centralize loan processing with continuous upgrade in credit
scoring models
• Gradual improvement in NPL in line with better early
payment default rate
Ongoing focus on process transformations with positive achieved indicators in line with end results to be achieved by 2025.
10
Main Goals

Transformation Progress in 2021
11
TWP AD
Business Support
Operation
Enabling Partnership with
housing stakeholders and
institutions to get alternative
source of funding/loans and to
reduce dependence of
government budget.
BPI of consumer
segment allows
mitigation of credit
risk by Automation
Loan Processing.
Relaunch e`Batarapos for
wider network to tap the
unbanked and support
cross-selling.
Additional Transformation in Business, Support and Operation Processes
Centralized operations
such as procurement
& HR.
Upgrading risk
management through
improved Credit
Scoring Model.

Business Process Improvement ProgressImplementation of BPI has Signaled Better Quality Loans
Regional Loan Processing CenterConsumer Segment
Commercial Banking CenterCommercial Segment
595
357
95 33 134 136
1,45%
1,21%
0,34%0,14%
0,39%0,34%
Mar 20 Jun 20 Sep 20 Dec 20 Mar 21 Jun 21
EPD (IDR Bio) EPD (%)
5.120 3.957 6.462 8.460
6.110 7.539
32.018
23.138
38.301
50.913
34.568
43.384
1Q20 2Q20 3Q20 4Q20 1Q21 2Q21
IDR Bn Units
Despite the
implementation
of BPI,
disbursement of
mortgages have
stabilized and
ready to process
higher amount of
consumer loans.
Mortgage Disbursement
Early Payment Default
Early Payment
Default Rate of
BTN loans (mainly
contributed by
mortgages) have
stabilized at 0.3%
level from around
1%, signaling less
chance of NPL in
the future.
Commercial
Banking Center
Relationship
Management,
Credit
Operations,
Commercial Risk
To follow the success in BPI implementation of the Consumer Segment, 10
Commercial Banking Centers (CBC) were planned to be established in 2021,
based on the concentration of commercial segment customers.
Processing Construction Loans,
Working Capital Loans and
Investment Loans.
Managing lending, funding and all
services to customers in Commercial
Segment
All 10 CBCs have been set up and ‘go-live’ by
July 2021
12
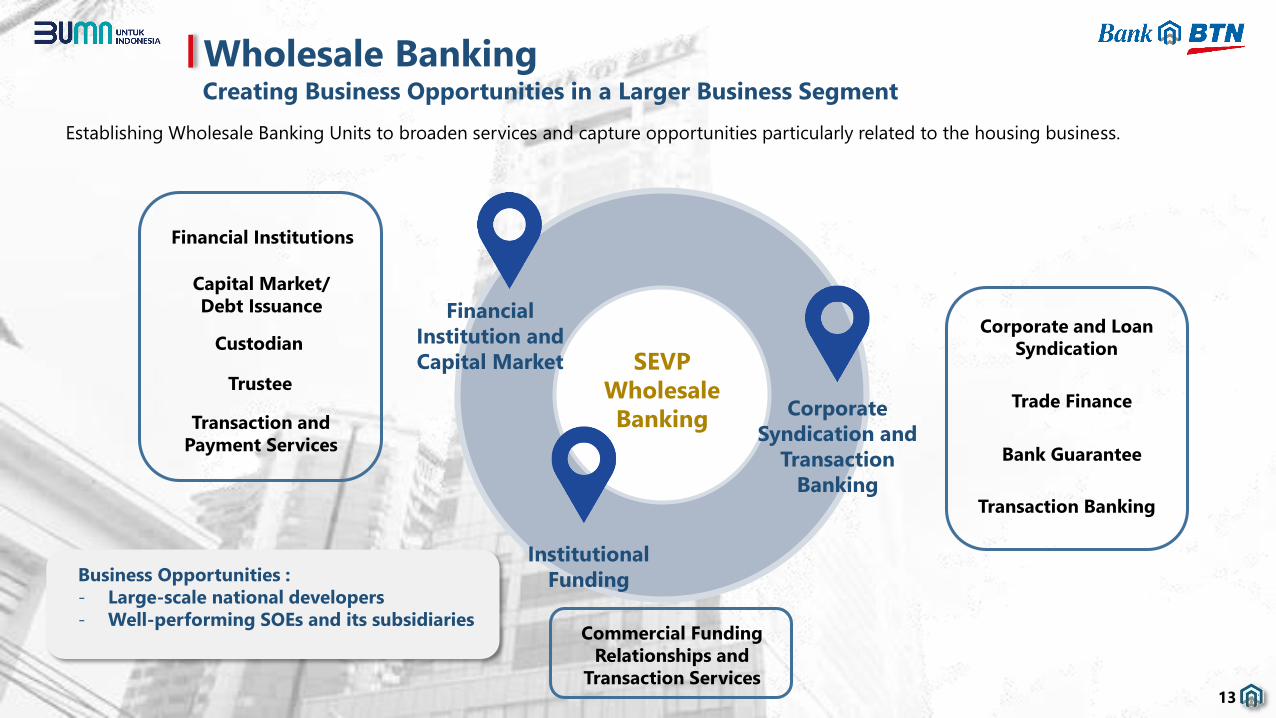
Wholesale BankingCreating Business Opportunities in a Larger Business Segment
SEVP
Wholesale
Banking
Financial
Institution and
Capital Market
Corporate
Syndication and
Transaction
Banking
Establishing Wholesale Banking Units to broaden services and capture opportunities particularly related to the housing business.
Institutional
Funding
Corporate and Loan
Syndication
Trade Finance
Transaction Banking
Financial Institutions
Capital Market/
Debt Issuance
Custodian
Transaction and
Payment Services
Commercial Funding
Relationships and
Transaction Services
Business Opportunities :
- Large-scale national developers
- Well-performing SOEs and its subsidiaries
13
Trustee
Bank Guarantee

Branch TransformationOptimization of Branch Network to Boost Low-Cost Funding
The role of branch offices needs to be redefined towards deposit-focused growth and a more sales-oriented operating model.
Operations-focused construct
Enhancement of deposit proposition and design of cross-
selling mechanism
Credit-centric mindset
Low income-focused sales
Deposit-centric mindset
Emerging-affluent focused
sales
Sales-focused construct
Rebranding of image, relocation and renovation of
branches, SOE partnerships
Sales transformation program, centralized operations,
digitalization
Branch Transformation Objectives
Reshaping BTN’s branch
operating and governance
model
Create enablers to support the shifts in the operating model
Increasing sales
productivity through tools
and models
14

Funding StrategyShifting to Retail Emerging Affluent Segment
10.110
8.614
4,68%
3,03%
BTN Prima BTN Investa
In the past, we offered BTN Prima
investment savings that were higher
in cost (6.30% as of 1H20). We will
shift this to the new
BTN Investa saving with lower cost
of fund (3.03% as of 1H21).
We target BTN Prima (balance IDR
10.1 Tn as of 1H21) will soon run off,
creating a more sustainable savings
balance with stable cost.
To acquire the captive market of our mortgage customers that fall into the emerging affluent segment and restore BTN’s image as a
savings bank, we continue to develop more beneficial savings products, like BTN Investa.
High-return BTN Investa savings product
15
1H20 1H21
11.788
6,30%
0
BTN Prima BTN Investa
Balance (IDR Bn)
Product Cost of Fund (%)
36.574
43.048
3,96%
2,46%
1H20 1H21
Total Savings
Launched on
23 February 2021
as part of BTN’s
71st anniversary

BTN Digital ChannelsMulti-Platform Digital Channels Tailored to the Needs of BTN Customers
BTN Mobile Banking
BTN Properti
Rumah Murah BTN
Ongoing Projects in 2021: Escalating services to our captive customers
Smart
ResidenceIntegration of
residential
services in an app
Virtual Branch,
Online Onboarding
and Open Banking
New Internet
Banking Business
EDC Platform
Business
Process
Improvement
for
BTN Properti
In addition to acquiring new retail customers to develop CASA, BTN digital channels are distinct to suit the needs of our captive customers,
related to the property business and designed to help find solutions.
16
Digital
Ecosysteme-Mitra
API
Platform
Management
Cash Management System,
Virtual Account and
Supply Chain Management

Increased initiatives and addition of featuresNew BTN Mobile Banking is
more user friendly and is ready
to target the emerging
affluent segment as well as to
complement the needs of our
existing mortgage customers.
• Enhancement of balance
checking
• Integration of BTN Investa
savings product
• Multipayments and e-wallet
top ups
• Electronic money reload
To come:
• Mortgage application
• Segmentation and limitation of transactions
• Debit card activations
• Integration of Wealth Management products
New Initiatives achieved and in
progress, including
Tarik Tunai
BTN Mobile BankingOngoing Improvement to Keep Boosting Transactions
17
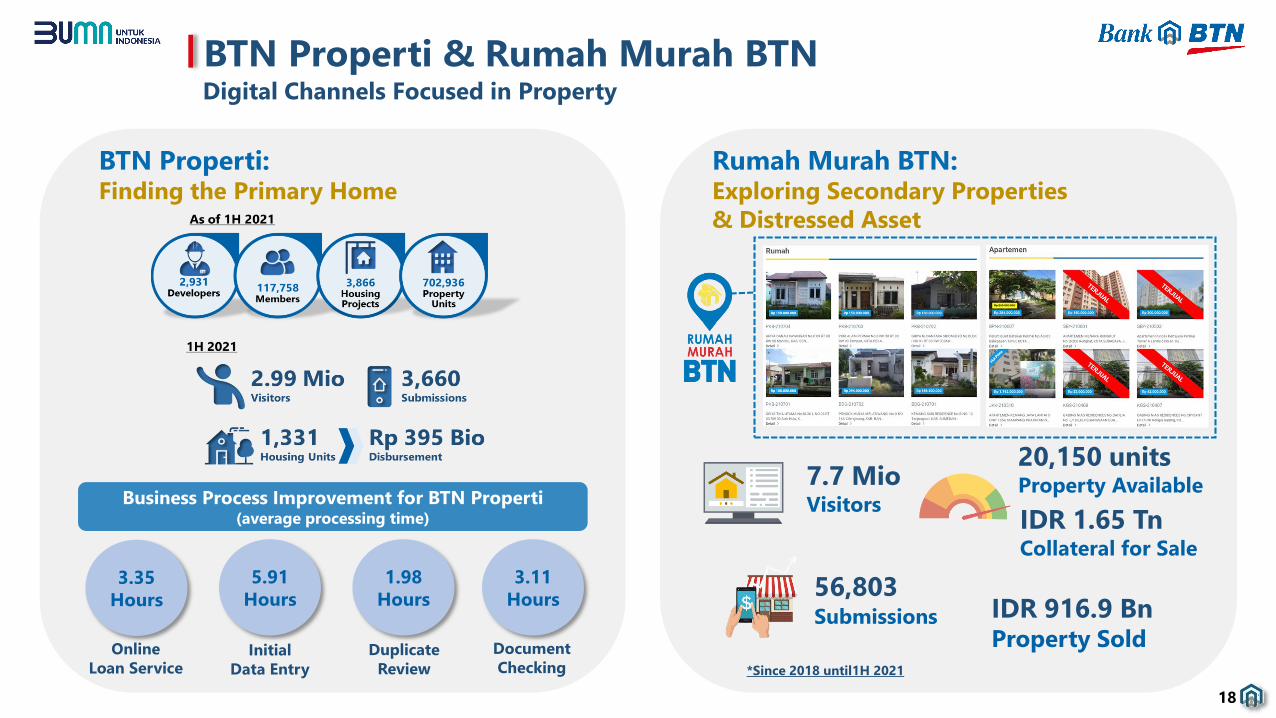
Rumah Murah BTN:Exploring Secondary Properties
& Distressed Asset
7.7 Mio Visitors
20,150 unitsProperty Available
IDR 1.65 TnCollateral for Sale
56,803Submissions IDR 916.9 Bn
Property Sold
BTN Properti:Finding the Primary Home
Business Process Improvement for BTN Properti(average processing time)
3.35
Hours
5.91
Hours
1.98
Hours
3.11
Hours
Online
Loan ServiceInitial
Data Entry
Duplicate
Review
Document
Checking
BTN Properti & Rumah Murah BTNDigital Channels Focused in Property
18
*Since 2018 until1H 2021

Focus on Action Plan to Gradually Reduce LAR
Loans at Risk Reduction Plans
ACTION
PLANLoans at Risk
Refined Business Process
- BPI (optimizing RLPC and CBC)
- Credit Scoring Model Improvement
- Collection Scoring Implementation
- Focus on landed houses
- Customer ratings for commercial
segment
Optimal Restructuring
- Online restructuring
application (Rumah Murah
BTN)
- Conduct assessment to
validate business and
cashflow of borrowers for
repayment
- Reminding to customers
schedule of when the
restructuring is due
- Loan recovery for
restructured borrowers
that have no chance to
repay
Asset Sales
- Bulk NPL asset selling
- Increase network of investors and
other third parties to speed up
recovery (state auction offices,
property agents etc.)
- Regular investor gatherings
1
3
2
19

1H2021 SUMMARY
20

Constant
Growth in
Loans
Ample
Liquidity
Sustained
progress in
Loan
Quality
Continued
strong
growth in
Net Profit
• Loan growth continues improved growth to 5.59% (yoy), driven by Subsidized
Mortgage, growing at 11.17% (yoy)
• Non-Subsidized increased growth rate to 0.90% (yoy)
• NPL Gross continues steady decline to 4.10%, and NPL Nett improving to
1.87% following stronger Coverage Ratio at 120.72%
• Improvement was seen in all consumer segments
• Net Profit grew by 19.87% (yoy) supported by a strong PPOP growth of
29.60% (yoy).
• Deposits maintained a robust growth of 31.84% (yoy) followed by a constant
drop in deposit cost of fund by 171bps (yoy)
• Liquidity ratios remained solid with LDR at 89.12%
1H2021 PerformanceSustained Strong Results in Line with Business Plan
21

Maintained Improvement in Liquidity
Liquidity Remains Ample
The focus in Deposit gathering will stabilize overall liquidity and create more healthy sustainable ratios.
111,46%
112,83%
103,25%
112,19%
114,24%
111,54%
113,50%114,22%
111,27%
93,26%93,19%
88,62%
89,12%
1H18 3Q18 FY18 1Q19 1H19 3Q19 FY19 1Q20 1H20 3Q20 FY20 1Q21 1H21
153,20%
121,65%
108,99%
144,63%
105,50%
131,12%
136,31% 140,51%
132,22%
178,40%
256,32%
232,85%
221,15%
101,69%106,66%
118,83%
109,66%105,81%
112,36%
108,29%
117,63%
113,74%
134,20%
130,71% 123,65%
130,47%
1H18 3Q18 FY18 1Q19 1H19 3Q19 FY19 1Q20 1H20 3Q20 FY20 1Q21 1H21
LCR NSFR
Loan to Deposit Ratio (LDR) Liquidity Coverage Ratio & Net Stable Funding Ratio
• Sustained ample LDR at 89.12% on 1H21, much lower than 1H20 of 111,27%.
• Stable NSFR at 130.47% on 1H21, higher than 1H20 of 113.74%.
• Much stronger LCR of 221.15% on 1H21 compared of 132.22% in 1H20.
22
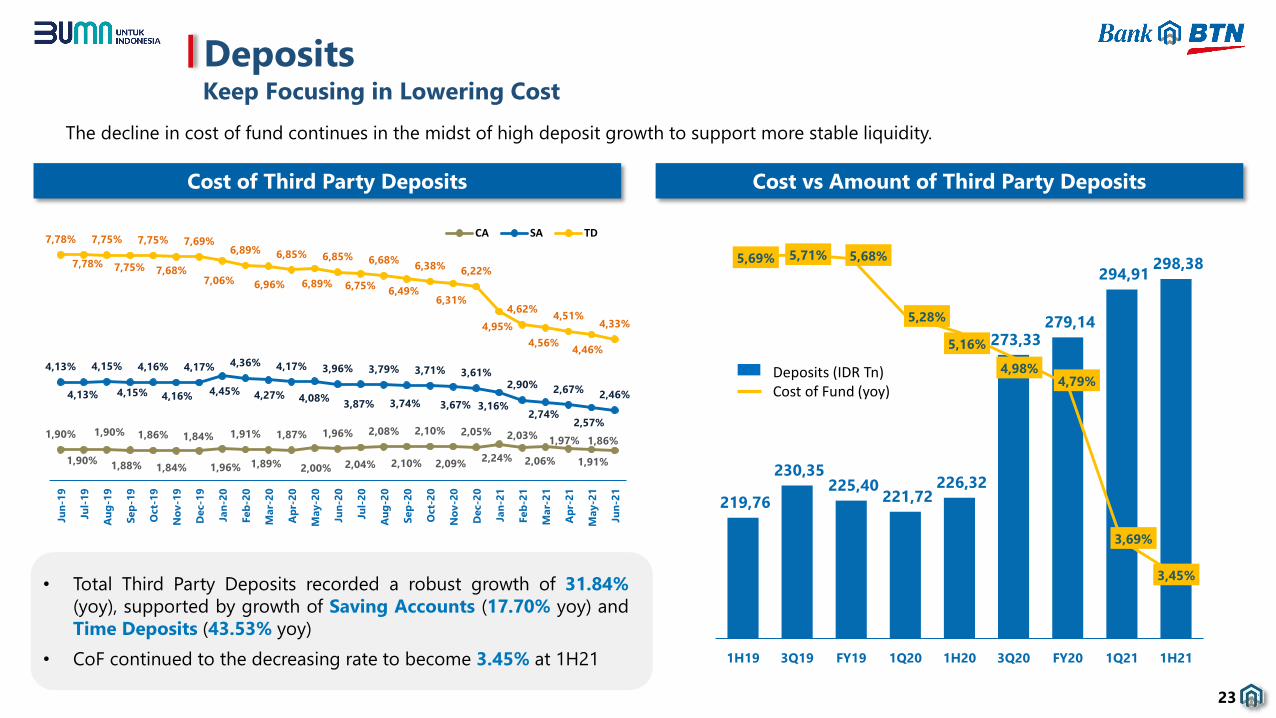
Keep Focusing in Lowering Cost
1,90%
1,90%
1,90%
1,88%
1,86%
1,84%
1,84%
1,96%
1,91%
1,89%
1,87%
2,00%
1,96%
2,04%
2,08%
2,10%
2,10%
2,09%
2,05%
2,24%
2,03%
2,06%
1,97%
1,91%
1,86%
4,13%
4,13%
4,15%
4,15%
4,16%
4,16%
4,17%
4,45%
4,36%
4,27%
4,17%
4,08%
3,96%
3,87%
3,79%
3,74%
3,71%
3,67%
3,61%
3,16%
2,90%
2,74%
2,67%
2,57%
2,46%
7,78%
7,78%
7,75%
7,75%
7,75%
7,68%
7,69%
7,06%
6,89%
6,96%
6,85%
6,89%
6,85%
6,75%
6,68%
6,49%
6,38%
6,31%
6,22%
4,95%
4,62%
4,56%
4,51%
4,46%
4,33%
Jun
-19
Jul-
19
Au
g-1
9
Sep
-19
Oct-
19
No
v-1
9
Dec-1
9
Jan
-20
Feb
-20
Mar-
20
Ap
r-2
0
May-2
0
Jun
-20
Jul-
20
Au
g-2
0
Sep
-20
Oct-
20
No
v-2
0
Dec-2
0
Jan
-21
Feb
-21
Mar-
21
Ap
r-2
1
May-2
1
Jun
-21
CA SA TD
219,76
230,35 225,40
221,72 226,32
273,33 279,14
294,91 298,38 5,69% 5,71% 5,68%
5,28%
5,16%
4,98%4,79%
3,69%
3,45%
1H19 3Q19 FY19 1Q20 1H20 3Q20 FY20 1Q21 1H21
• Total Third Party Deposits recorded a robust growth of 31.84%
(yoy), supported by growth of Saving Accounts (17.70% yoy) and
Time Deposits (43.53% yoy)
• CoF continued to the decreasing rate to become 3.45% at 1H21
Cost of Third Party Deposits Cost vs Amount of Third Party Deposits
Deposits
The decline in cost of fund continues in the midst of high deposit growth to support more stable liquidity.
Deposits (IDR Tn)Cost of Fund (yoy)
23

21.258
43.198 5.684
10.324
493
228
27.435
53.750
1H20 1H21
53.826 69.960
43.147
65.627 2.956
1.006
99.928
136.592
1H20 1H21
6.780 7.558
1.319 1.648 456
852 8.555
10.058
1H20 1H21
Number of Users (Thousands) Number of Transactions (Thousands)
17.57% YoY 36.69% YoY 95.92% YoY
Transactions Value (IDR Bio)
Internet Banking Mobile Banking ATM
Digital transactions have continued to show extensive growth, as vast developments were made in time to support services during the
Covid-19 Pandemic.
Potential acquisition of
around 2.5 million
existing customers to
Digital Channels
“Digital
Marketing for
Digital
Banking”
Collaboration with
Marketing
Communication
Unit
• Data analytics
• Digital advertising management
• Copywriting
• Email marketing
• Search engine optimization (SEO)
• Social media management
• Website development
What
Next?
Digital Channel PerformanceIn Time for the Shift to Digital Transactions in Times of Pandemic
24

Digital Channel PerformanceImproved Performance in Overall e-Banking
25
Mobile Banking Internet Banking SMS Banking Overall e-Banking
7.
.
.
.
14
6
20
6
10
5
162020 2020 2020 2020
2021 2021 2021 2021
Significant performance improvement of e-banking to Rank 5 in 2021.
Based on MRI - Bank Service Excellence Monitor 2021
.
.
.
.
.
.
.
.
.
.
.
.

BTN Brand AwarenessImprovement in 2021 Compared to 2020
Maintain 6th Place as
Overall Bank
Improved to 5th
from 6th Place in for
BTN Batara
Improving to 5th
from 6th Place for
BTN Mobile
BANKWIDE SAVINGS ACCOUNTMOBILE BANKING
Based on Nielsen Survey 2021
Brand Awareness Position in Indonesia 2021 vs 2020
26
Better positioning of brand awareness as a result of product development and rigorous marketing communication strategies.

NPL Maintains Declining Trend
Finer Asset Quality and Strong Coverage
By improving collection management, NPL continues to improve. In addition, asset sales initiatives are still ongoing to speed up recovery.
NPL and Coverage Ratio Improvement Initiatives
105,66%
107,90%
111,36%
115,02% 115,93%
120,72%4,91%4,71%
4,56%4,37% 4,25%
4,10%
2,38% 2,40%2,26%
2,06% 2,06%1,94%
1Q20 1H20 3Q20 4Q20 1Q21 1H21
Provision Coverage Gross NPL Net NPL
Lower Gross & Net NPL compared to 1H20 at 4.10% and 1.94%.
Coverage Ratio has reached 120.72% in 1H21.
Initiatives on loan quality improvement is still ongoing, through
improvement of management collection and speeding of asset
sales.
The main target is to sell 8.140 units of bad debt collateral with
amount of recovery Rp 2.1 Trillion until the end of 2021.
Ongoing efforts for recovery through
Asset Sales Festival
27
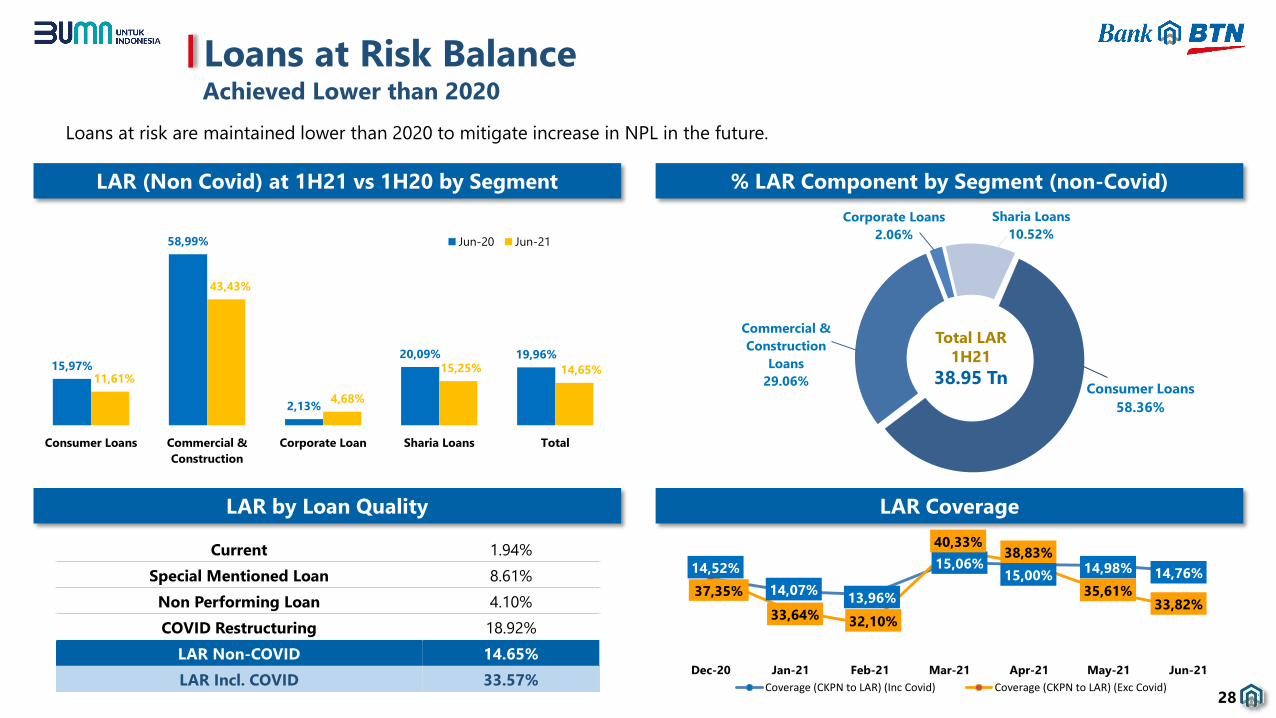
Achieved Lower than 2020
Loans at Risk Balance
Loans at risk are maintained lower than 2020 to mitigate increase in NPL in the future.
LAR (Non Covid) at 1H21 vs 1H20 by Segment % LAR Component by Segment (non-Covid)
Consumer Loans
58.36%
Commercial &
Construction
Loans
29.06%
Corporate Loans
2.06%
Sharia Loans
10.52%
Total LAR
1H21
38.95 Tn
LAR by Loan Quality LAR Coverage
Current 1.94%
Special Mentioned Loan 8.61%
Non Performing Loan 4.10%
COVID Restructuring 18.92%
LAR Non-COVID 14.65%
LAR Incl. COVID 33.57%28
15,97%
58,99%
2,13%
20,09% 19,96%
11,61%
43,43%
4,68%
15,25% 14,65%
Consumer Loans Commercial &
Construction
Corporate Loan Sharia Loans Total
Jun-20 Jun-21
14,52%
14,07%13,96%
15,06%15,00%
14,98% 14,76%
37,35%
33,64% 32,10%
40,33%38,83%
35,61%33,82%
Dec-20 Jan-21 Feb-21 Mar-21 Apr-21 May-21 Jun-21
Coverage (CKPN to LAR) (Inc Covid) Coverage (CKPN to LAR) (Exc Covid)

Declining Compared to March 2021
Covid-19 Restructuring Progress
Covid-19 Restructuring Amount (Rp Bn) % Covid-19 Restructuring By Product
29
Trend is declining, whilst remaining cautious in the midst of increasing Covid-19 cases and further lockdown (PPKM).
7,42%
21,32%
54,73%
0,78%
15,75%
Reschedulling Interest Payment
Deferral
Interest & Principal
Payment Deferral
Principal Payment
Deferral
Interest Rate Cut
Covid-19 Restructuring Schemes
Dec 20 Mar 21 Jun 21
Corporate Loans 3,896 3,684 3,885 6.86%
Commercial & Constructions 9,959 9,915 9,697 17.12%
Consumer Loans 39,877 41,538 39,160 69.12%
Sharia Loans 3,785 3,824 3,913 6.91%
Total 57,517 58,961 56,655 100.00%
Restructured Loan Covid 19 as ofSegment
% of Covid
RestructuringSubsidized
Mortgages
37%
Non-Subsidized
Mortgages
39%
Commercial &
Construction
Loans
17%
Corporate Loans
7%
Note: including sharia financing
Most of the consumer segment borrowers are
in the fixed income category and are expected
to recover and continue payment.
Borrowers’ conditions continued to be
monitored to ensure prompt actions are taken
to mitigate worsening in total asset quality.

3.5 Tn
355 Bn1.20 Tn1.94 Tn
Covid 19 Restructuring Assessment
30
Covid-19 Restructuring by Segment
Consumer Segment Commercial Segment Sharia Financing
39.16 Tn 13.58 Tn 3.91 Tn
• Subsidized Mortgage
• Non-Subsidized Mortgage
• Other Housing Loans
• Non Housing Loans
(Consumer)
• Construction Loans
• Commercial Loans
• Corporate Loans
• Sharia Consumer
• Sharia Commercial
Total Loans and Financing
Covid-19 Restructuring
56.65 Tn
• Potential default of
Consumer Segment
from SML 2 & SML 3
• Potential deafult of
Commercial Segment
from Individual
Assessment
Default Rate classification:
Risk Classification in Consumer Segment
Outs
Potential Downgrade
Classification Low Risk Med Risk High Risk Total
Back to PL 25% 0% 0% 25%
Extend Restructuring 44% 26% 0% 70%
Downgrade to NPL 0.04% 4.80% 0.03% 4.87%
Total 69% 31% 0.03% 100%

1H2021 RESULTS
31

HIGHLIGHTS 2016 2017 2018 2019 2020 1H 20 1H 21
Assets/Liabilites
Total Asset 214,168 261,365 306,436 311,777 361,208 314,603 380,514 20.95% yoy
Total Loan & Financing 164,446 198,991 238,298 255,825 260,114 251,837 265,907 5.59% yoy
Total Deposits 160,192 192,949 230,264 225,401 279,135 226,322 298,379 31.84% yoy
Capital
Equity 19,131 21,663 23,840 23,836 19,988 17,116 19,910 16.32% yoy
CAR (Tier 1) 16.54% 15.99% 15.97% 15.60% 13.64% 12.47% 12.99% 53 bps
CAR (BI) 20.34% 18.87% 18.21% 17.32% 19.34% 19.10% 17.80% (130) bps
Profitability
Net Profit 2,619 3,027 2,808 209 1,602 768 920 19.87% yoy
Earning per Share (IDR) 247 286 265 20 151 72 87 19.87% yoy
N I M 4.98% 4.76% 4.32% 3.32% 3.06% 3.16% 3.41% 24 bps
C I R 48.41% 50.19% 52.28% 58.08% 53.85% 56.43% 51.99% (444) bps
ROE 18.35% 18.11% 14.89% 1.00% 10.02% 10.06% 11.02% 96 bps
ROA 1.76% 1.71% 1.34% 0.13% 0.69% 0.63% 0.68% 5 bps
Assets Quality
NPL (Gross) 2.84% 2.66% 2.81% 4.78% 4.37% 4.71% 4.10% (61) bps
NPL (Nett) 1.85% 1.66% 1.83% 2.96% 2.06% 2.40% 1.87% (54) bps
Coverage Ratio 45.25% 44.55% 49.24% 50.01% 115.02% 107.90% 120.72% 1,282 bps
Liquidity
LDR 102.66% 103.13% 103.49% 113.50% 93.19% 111.27% 89.12% (2,216) bps
LCR 162.25% 144.95% 108.99% 136.31% 256.32% 132.22% 221.15% 8,893 bps
Changes
Financial HighlightsOngoing Improved Indicators
32

Balance SheetSolid Deposit Growth (yoy) Supported By Deposits with Lower Cost
33
Balance Sheet Summary (Rp Bn) 2016 2017 2018 2019 2020 1H20 1H21 YoY Ytd
Cash, Placement with BI & Other Banks 30,253 39,490 44,956 29,266 35,585 27,631 49,978 80.88% 40.45%
Government Bonds & Marketable Securities 11,252 13,719 15,021 18,628 59,564 29,129 55,243 89.64% -7.26%
Receivables (Acceptances & Others) 1,533 1,541 528 2,362 1,151 2,645 2,090 -20.97% 81.62%
Total Loans & Financing 164,446 198,991 238,298 255,825 260,114 251,837 265,907 5.59% 2.23%
Loans Provision (2,116) (2,356) (3,298) (6,116) (13,061) (12,798) (13,172) 2.93% 0.85%
Fixed & Other Assets 8,816 9,997 10,953 11,841 17,861 16,163 20,562 27.21% 15.12%
Total Assets 214,168 261,365 306,436 311,777 361,208 314,603 380,514 20.95% 5.34%
CASA (Current Account Saving Account) 80,672 95,602 99,927 97,754 114,764 96,326 111,798 16.06% -2.58%
Current Account 45,846 54,655 58,049 52,116 72,045 59,752 68,750 15.06% -4.57%
Savings Account 34,826 40,947 41,877 45,638 42,719 36,574 43,048 17.70% 0.77%
Time Deposits 79,519 97,347 130,337 127,647 164,371 129,996 186,581 43.53% 13.51%
Third Party Deposits 160,192 192,949 230,264 225,401 279,135 226,322 298,379 31.84% 6.89%
Wholesale funding 27,788 38,377 43,273 54,220 50,077 60,948 49,941 -18.06% -0.27%
Other Liabilities 7,058 8,376 9,059 8,320 12,008 10,217 12,284 20.23% 2.30%
Total Liabilities 195,038 239,702 282,596 287,941 341,221 297,487 360,604 21.22% 5.68%
Total Equity 19,131 21,663 23,840 23,836 19,988 17,116 19,910 16.32% -0.39%
Total Liabilities & Equity 214,168 261,365 306,436 311,777 361,208 314,603 380,514 20.95% 5.34%
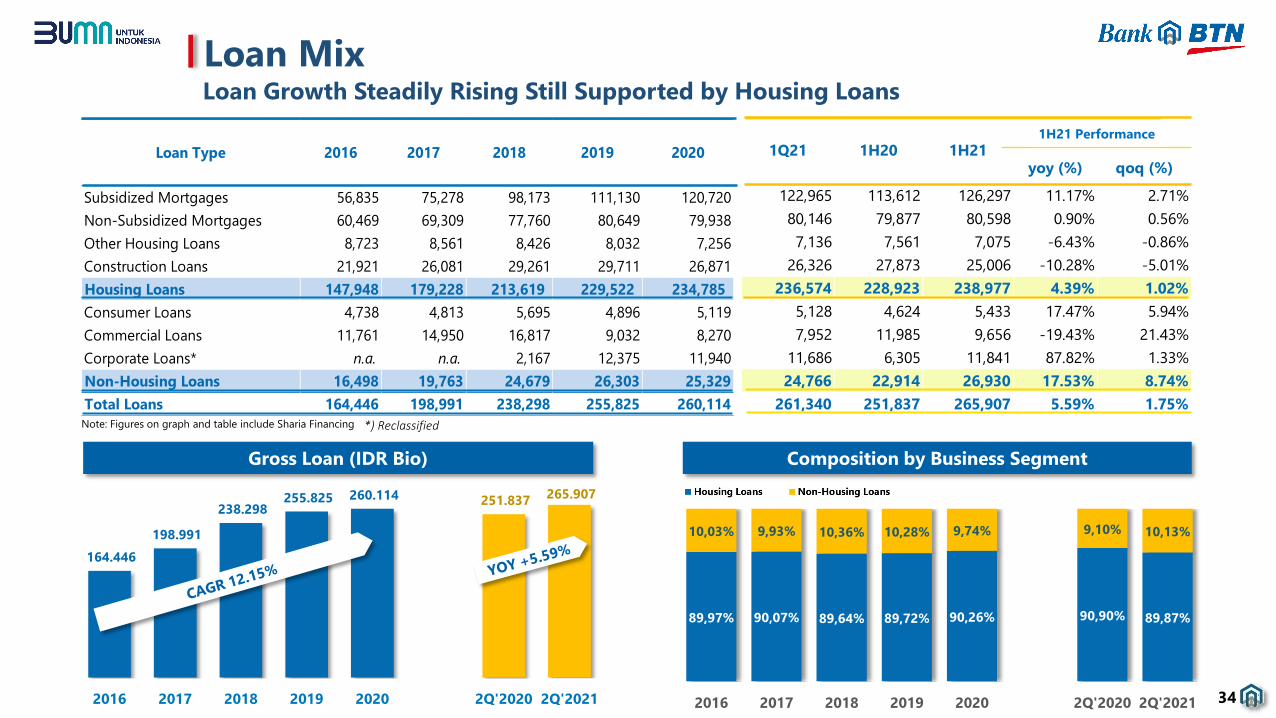
Subsidized Mortgages 56,835 75,278 98,173 111,130 120,720
Non-Subsidized Mortgages 60,469 69,309 77,760 80,649 79,938
Other Housing Loans 8,723 8,561 8,426 8,032 7,256
Construction Loans 21,921 26,081 29,261 29,711 26,871
Housing Loans 147,948 179,228 213,619 229,522 234,785
Consumer Loans 4,738 4,813 5,695 4,896 5,119
Commercial Loans 11,761 14,950 16,817 9,032 8,270
Corporate Loans* n.a. n.a. 2,167 12,375 11,940
Non-Housing Loans 16,498 19,763 24,679 26,303 25,329
Total Loans 164,446 198,991 238,298 255,825 260,114
Loan Type 20172016 2018 2019 2020
Loan MixLoan Growth Steadily Rising Still Supported by Housing Loans
Note: Figures on graph and table include Sharia Financing *) Reclassified
89,97% 90,07% 89,64% 89,72% 90,26% 90,90% 89,87%
10,03% 9,93% 10,36% 10,28% 9,74% 9,10% 10,13%
2016 2017 2018 2019 2020 2Q'2020 2Q'2021
164.446
198.991
238.298 255.825 260.114 251.837
265.907
2016 2017 2018 2019 2020 2Q'2020 2Q'2021
Gross Loan (IDR Bio) Composition by Business Segment
yoy (%) qoq (%)
122,965 113,612 126,297 11.17% 2.71%
80,146 79,877 80,598 0.90% 0.56%
7,136 7,561 7,075 -6.43% -0.86%
26,326 27,873 25,006 -10.28% -5.01%
236,574 228,923 238,977 4.39% 1.02%
5,128 4,624 5,433 17.47% 5.94%
7,952 11,985 9,656 -19.43% 21.43%
11,686 6,305 11,841 87.82% 1.33%
24,766 22,914 26,930 17.53% 8.74%
261,340 251,837 265,907 5.59% 1.75%
1Q21 1H211H201H21 Perofrmance1H21 Performance
34

Subsidized Mortgages (IDR - Tn)
Total Mortgages ( IDR - Tn) Mortgage Composition
Non- Subsidized Mortgages (IDR – Tn)
MortgagesRobust Growth on Subsidized Mortgages
35
117,30144,59
175,93191,78 200,66 193,49
206,90
2016 2017 2018 2019 2020 1H20 1H21
56,83
75,28
98,17111,13
120,72 113,61126,30
2016 2017 2018 2019 2020 1H20 1H21
60,47
69,31
77,76 80,64 79,94 79,88 80,60
2016 2017 2018 2019 2020 1H20 1H21
48
,45
%
52
,06
%
55
,80
%
57
,95
%
60
,16
%
58
,72
%
61
,04
%
51
,55
%
47
,94
%
44
,20
%
42
,05
%
39
,84
%
41
,28
%
38
,96
%
2016 2017 2018 2019 2020 1H20 1H21
Non Subsidized Mortgage Subsidized Mortgage

2020 2021
Housing Loans 47,216 57,888 65,095 44,117 29,712 11,723 16,046 36.87%
Subsidized Mortgages 17,527 23,499 28,578 19,272 17,064 6,202 9,472 52.71%
Non-Subsidized Mortgages 14,315 16,803 18,350 12,498 6,935 2,874 4,177 45.33%
Other Housing Loans 1,823 1,825 1,875 1,365 683 292 489 67.52%
Construction Loans 13,551 15,761 16,292 10,982 5,030 2,354 1,907 -18.98%
Non-Housing Loans 12,043 17,087 21,738 20,587 15,177 5,408 9,553 76.66%
Consumer Loans 4,779 6,578 6,239 4,184 4,251 1,623 2,695 66.08%
Commercial Loans 7,264 10,508 13,280 4,255 3,884 3,785 3,740 -1.19%
Corporate Loans *) n.a. n.a. 2,218 12,148 7,041 193 3,118 1515.73%
Total Loans 59,259 74,975 86,833 64,704 44,888 17,131 25,599 49.43%
FY 20206 Months of
Loan Type FY 2016 FY 2017 FY 2018 FY 2019 yoy
Loan DisbursementDisbursement Greatly Exceeding 2020, Driven by Consumer Segment
12
,15
14
,21
11
,60
21
,30
14
,33
17
,74
16
,96
25
,95
17
,28
19
,09
19
,87
30
,59
18
,12
19
,66
13
,17
13
,76
10
,03
7,1
0
11
,88
15
,87
11,33
14,27
Q1 Q2 Q3 Q4
2016 2017 2018 2019 2020 2021
Note: Figures on graph and table include Sharia Financing*) Reclassified
YoY : + 95,48%
QoQ : +25,87%
36

2016 2017 2018 2019 2020 2020 2021
2.36% 2.31% 2.49% 4.44% 4.11% 4.51% 4.05%
1.52% 1.16% 0.81% 0.98% 1.01% 1.23% 0.91%
2.65% 3.00% 2.77% 3.92% 3.58% 4.24% 3.13%
Other Housing Loans 3.59% 4.09% 3.58% 4.71% 4.44% 5.56% 3.71%
3.21% 3.14% 7.13% 18.71% 19.58% 18.44% 21.78%
7.14% 5.82% 5.52% 7.79% 6.70% 6.64% 4.49%
Consumer Loans 1.35% 1.34% 1.33% 2.81% 2.08% 1.94% 1.50%
Commercial Loans 9.44% 7.99% 8.64% 21.17% 19.25% 12.47% 14.69%
Corporate Loans n.a. n.a. 0.00% 0.00% 0.00% 0.00% 0.00%
2.84% 2.66% 2.81% 4.78% 4.37% 4.71% 4.10%Total Loans
Housing Loans
Subsidized Mortgages
Non-Subsidized Mortgages
Construction Loans
Non-Housing Loans
(Gross)
31-Dec 30-JunLoan Type
Loan QualitySteady Improvement in Line with Stronger Provisions
Note: Figures on graph and table include Sharia Financing
IDR Bn Share IDR Bn Share IDR Bn Share IDR Bn Share IDR Bn Share IDR Bn Share IDR Bn Share
Current 142,963 86.94% 176,247 88.57% 211,289 88.67% 217,344 84.96% 230,456 88.60% 207,422 82.36% 232,102 87.29%
Special Mentioned 16,807 10.22% 17,455 8.77% 20,309 8.52% 26,251 10.26% 18,303 7.04% 32,553 12.93% 22,886 8.61%
PL 159,770 97.16% 193,703 97.34% 231,598 97.19% 243,595 95.22% 248,759 95.63% 239,974 95.29% 254,988 95.90%
Substandard 260 0.16% 236 0.12% 570 0.24% 3,088 1.21% 738 0.28% 843 0.33% 361 0.14%
Doubtful 333 0.20% 349 0.18% 473 0.20% 1,396 0.55% 582 0.22% 1,118 0.44% 587 0.22%
Loss 4,083 2.48% 4,703 2.36% 5,656 2.37% 7,747 3.03% 10,036 3.86% 9,900 3.93% 9,963 3.75%
NPL 4,676 2.84% 5,288 2.66% 6,700 2.81% 12,230 4.78% 11,355 4.37% 11,861 4.71% 10,911 4.10%
PL + NPL 164,446 100.00% 198,991 100.00% 238,298 100.00% 255,825 100.00% 260,114 100.00% 251,835 100.00% 265,899 100.00%
NPL Gross 2.84% 2.66% 2.81% 4.78% 4.37% 4.71% 4.10%
NPL Netto 1.85% 1.66% 1.83% 2.96% 2.06% 2.40% 1.87%
2016Collectibility
2017 2018 1H20 1H212019 2020
Provision AmountNPL Breakdown by Segment
37
2,12 2,36
3,30
6,12
13,06 12,80 13,17
0,12% 0,03%
0,72%
1,36%
0,86%0,81%
0,94%
2016 2017 2018 2019 2020 1H20 1H21
Provision Amount
Credit Cost

LiabilitiesThird Party Deposit Portion Continues to Increase
Third Party
Deposits
85,72%
Borrowings
9,46%
Securities Issued
4,17%
Deposits from Other
Banks
0,65%
Repurchase
Agreements
0,00%
16
0,1
9
19
2,9
5
23
0,2
6
22
5,4
0
27
9,1
4
22
6,3
2
29
8,3
8
12,94
17,93
17,04 19,78
15,81
18,19
14,51
5,46
8,04
6,25 4,52
0,04
4,30
2,25
1,38
1,40
0,95 0,95
0,00
0,94
0,00
8,00
10,99
18,50 28,47
34,00
37,01
32,93
187,97
231,31
273,00 279,12
328,98
286,76
348,07
2016 2017 2018 2019 2020 1H20 1H21
Third Party Deposits
Securities Issued
Deposits from Other Banks
Repurchase Agreements
Borrowings
Total Funding
Funding Portions
Total Liabilities (IDR Tn) Funding Composition (IDR Tn)
38

DepositsStrong Growth of All Products Support Total Growth of 31.84% (yoy)
Deposit Mix (IDR Tn)
50
,36
%
49
,55
%
43
,40
%
43
,37
%
41
,11
%
42
,56
%
37
,47
%
49
,64
%
50
,45
%
56
,60
%
56
,63
%
58
,89
%
57
,44
%
62
,53
%
2016 2017 2018 2019 2020 1H20 1H21
TD CASA
CASA Composition
Third Party Funds 2016 2017 2018 2019 2020 1H 20 1H 21 yoy
Current Account 45.85 54.66 58.05 52.12 72.04 59.75 68.75 15.06%
Savings Account 34.83 40.95 41.88 45.64 42.72 36.57 43.05 17.70%
Time Deposits 79.52 97.35 130.34 127.65 164.37 130.00 186.58 43.53%
Total 160.19 192.95 230.26 225.40 279.14 226.32 298.38 31.84%
Deposits
39

Equity and capital 2016 2017 2018 2019 2020 1H 20 1H 21
Tier - 1 Capital 16,443 18,727 20,460 21,037 17,626 15,822 17,209
Tier - 2 Capital 3,776 3,368 2,868 2,313 7,369 8,414 6,362
Capital on B/S 19,131 21,663 23,840 23,836 19,988 17,116 19,910
RWA - Credit Risk 86,189 101,494 109,507 113,079 105,435 103,079 108,633
RWA - Market Risk 344 664 1,007 802 1,612 1,635 1,883
RWA - Operational Risk 12,899 14,934 17,623 20,963 22,203 22,203 21,914
RWA - Total 99,432 117,092 128,138 134,844 129,250 126,916 132,430
CAR Tier – 1/(Total RWA) 16.54% 15.99% 15.97% 15.60% 13.64% 12.47% 12.99%
CAR B/S/(Total RWA) 19.24% 18.50% 18.61% 17.68% 15.46% 13.49% 15.03%
CAR BI ((Tier 1+2)/(Total RWA)) 20.34% 18.87% 18.21% 17.32% 19.34% 19.10% 17.80%
CAR Tier – 2 3.80% 2.88% 2.24% 1.72% 5.70% 6.63% 4.81%
Capital Conservation Buffer 0.63% 1.25% 1.88% 2.50% 0.00% 0.00% 0.00%
Countercyclical Buffer 0.00% 0.00% 0.00% 0.00% 0.00% 0.00% 0.00%
Capital Surcharge (D-SIB) 0.25% 0.50% 0.75% 1.00% 1.00% 1.00% 1.00%
EquitySustained Adequate Tier I and Tier II Capital
Capital is still sufficient to support growth in 2021, and in safe range of the amount required by regulators
Capital raising initiatives are undergone to strengthen Tier I
40

PL Summary (Rp Bn) 2016 2017 2018 2019 2020 1H20 1H21 YoY
Interest Income 17,852 20,081 22,839 25,678 25,167 12,361 12,532 1.39%
Interest Expense (9,600) (10,637) (12,634) (16,600) (16,045) (7,922) (6,842) -13.63%
Net Interest Income 8,252 9,444 10,205 9,078 9,122 4,439 5,690 28.18%
Other Operating Income 1,285 1,624 2,127 2,113 2,515 1,052 1,126 7.04%
Other Operating Expense (Exclude Provision) (5,477) (6,279) (6,982) (7,269) (7,056) (3,505) (4,242) 21.03%
Pre Provision Operating Profit (PPOP) 4,060 4,789 5,350 3,922 4,580 1,986 2,574 29.60%
Provision (708) (884) (1,714) (3,487) (2,258) (1,034) (1,317) 27.34%
Profit From Operations 3,352 3,904 3,635 436 2,322 952 1,257 32.05%
Non Operating Income (Expense) (22) (43) (25) (25) (51) 10 (11) -204.38%
Profit Before Tax 3,330 3,862 3,610 411 2,271 963 1,246 29.47%
Net Profit 2,619 3,027 2,808 209 1,602 768 920 19.87%
Earning Per Share (Annualized) 247 286 265 20 151 145 174 19.87%
Profit and LossMaintaining Strong PPOP
Interest Expense continued to decline and supporting NII to grow by 28.18% (yoy)
PPOP recorded a 29.60% (yoy) growth to IDR 2.57 Tn in 1H 2021
Net Profit grew by 19.87% yoy, booked at IDR 920 Bn as of 1H 2021
41

Profit and Loss CompositionDecline in Interest Expense Supports Strong Top Line
Interest Expenses (Rp Bn) 2016 2017 2018 2019 2020 1H20 1H21 yoy
Bank Indonesia - - - - - - - 0.00%
Deposits from other Banks 285 394 459 508 195 130 27 -79.13%
Deposits from Non Banks 7,363 7,946 9,498 12,679 11,755 5,736 4,949 -13.72%
Securities Issued 1,088 1,368 1,556 1,652 1,552 866 693 -20.05%
Fund Borrowings 718 837 1,026 1,689 2,518 1,167 1,172 0.49%
Others 147 92 94 73 25 23 1 -94.23%
Total 9,600 10,637 12,634 16,600 16,045 7,922 6,842 -13.63%
Interest Income (Rp Bn) 2016 2017 2018 2019 2020 1H20 1H21 yoy
Placement with Bank Indonesia 111 154 145 199 374 113 142 24.81%
Placement with other bank 56 15 35 27 12 7 64 873.26%
Securities 971 971 853 989 1,683 532 1,345 152.90%
Loan 15,458 17,387 19,852 22,203 21,173 10,672 9,971 -6.57%
Others - - - - 3 2 8 366.07%
Income from Syariah 1,256 1,553 1,955 2,261 1,922 1,036 1,003 -3.14%
Total 17,852 20,081 22,839 25,678 25,167 12,361 12,532 1.39%
Interest Income Composition
Interest Expense Composition
Placement
with Bank
Indonesia
1,13%Placement
with other
bank
0,51%
Securities
10,73%
Loans
79,56%
Others
0,07%
Income from
Syariah
8,00%
Bank
Indonesia
0,00%
Deposits
from other
Banks
0,40%
Deposits from
Non Banks
72,33%
Securities
Issued
10,12%
Fund
Borrowings
17,13%
Others
0,02%
42
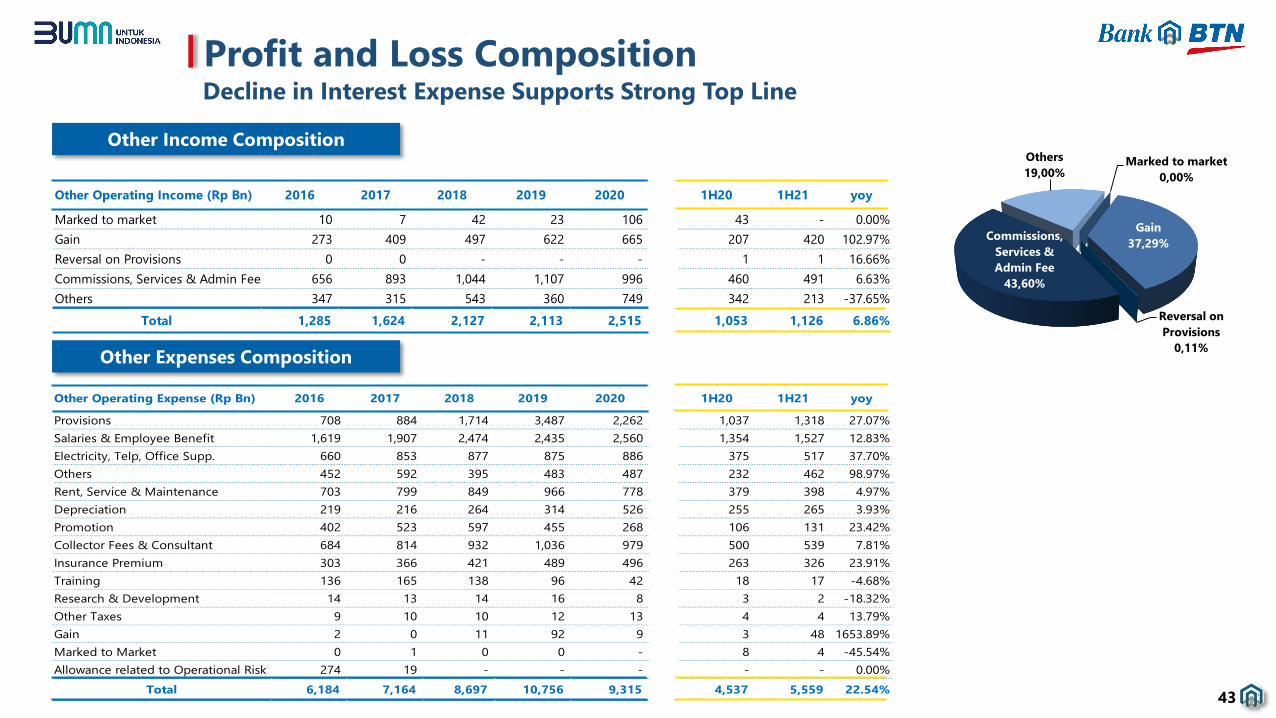
Profit and Loss CompositionDecline in Interest Expense Supports Strong Top Line
Other Income Composition
Other Operating Income (Rp Bn) 2016 2017 2018 2019 2020 1H20 1H21 yoy
Marked to market 10 7 42 23 106 43 - 0.00%
Gain 273 409 497 622 665 207 420 102.97%
Reversal on Provisions 0 0 - - - 1 1 16.66%
Commissions, Services & Admin Fee 656 893 1,044 1,107 996 460 491 6.63%
Others 347 315 543 360 749 342 213 -37.65%
Total 1,285 1,624 2,127 2,113 2,515 1,053 1,126 6.86%
Other Expenses Composition
Other Operating Expense (Rp Bn) 2016 2017 2018 2019 2020 1H20 1H21 yoy
Provisions 708 884 1,714 3,487 2,262 1,037 1,318 27.07%
Salaries & Employee Benefit 1,619 1,907 2,474 2,435 2,560 1,354 1,527 12.83%
Electricity, Telp, Office Supp. 660 853 877 875 886 375 517 37.70%
Others 452 592 395 483 487 232 462 98.97%
Rent, Service & Maintenance 703 799 849 966 778 379 398 4.97%
Depreciation 219 216 264 314 526 255 265 3.93%
Promotion 402 523 597 455 268 106 131 23.42%
Collector Fees & Consultant 684 814 932 1,036 979 500 539 7.81%
Insurance Premium 303 366 421 489 496 263 326 23.91%
Training 136 165 138 96 42 18 17 -4.68%
Research & Development 14 13 14 16 8 3 2 -18.32%
Other Taxes 9 10 10 12 13 4 4 13.79%
Gain 2 0 11 92 9 3 48 1653.89%
Marked to Market 0 1 0 0 - 8 4 -45.54%
Allowance related to Operational Risk 274 19 - - - - - 0.00%
Total 6,184 7,164 8,697 10,756 9,315 4,537 5,559 22.54%
Marked to market
0,00%
Gain
37,29%
Reversal on
Provisions
0,11%
Commissions,
Services &
Admin Fee
43,60%
Others
19,00%
43

ROE3 – Tier 1 Capital
ROA1 – Before Tax ROA2 – After Tax
ROE4 – Balance Sheet
Key Financial RatiosStable Growth and Focus in Portfolio Improvement
44
1Calculated based on income before income tax (include tax benefit and extraordinary item)/ average total asset based on Bank Indonesia regulation
2Calculated based on net profit/average total asset
3Calculated based on net profit/average Tier 1 Capital based on Bank Indonesia regulation 4Calculated based on net profit/total stakeholder’s equity
1,76% 1,71%
1,34%
0,13%
0,69% 0,63% 0,68%
2016 2017 2018 2019 2020 1H20 1H21
1,39% 1,34%
1,05%
0,07%
0,49% 0,50% 0,50%
2016 2017 2018 2019 2020 1H20 1H21
18,35% 18,11%
14,89%
1,00%
10,02% 10,06% 11,02%
2016 2017 2018 2019 2020 1H20 1H21
13,69%13,98%11,78%
0,88%
8,02% 8,97%10,69%
2016 2017 2018 2019 2020 1H20 1H21

SHARIA BUSINESS
45

15,03 18,75
22,34 21,86 23,83
20,80
26,89
2016 2017 2018 2019 2020 1H20 1H21
377,42
482,19
215,77 238,46
134,86 100,33 87,54
2016 2017 2018 2019 2020 1H20 1H21
Sharia Asset (IDR - Tn)
Sharia Net Profit (IDR – Bn) Sharia Financings (IDR-Tn)
18,13 23,40
28,40 28,39 33,03 31,09
35,46
2016 2017 2018 2019 2020 1H20 1H21
Sharia Total Deposits (IDR-Tn)
Sharia Business PerformanceStable Growth and Focus in Portfolio Improvement
46

1,1
7
0,7
5
1,1
9
1,5
4
1,2
1
2,25
Q1 Q2 Q3 Q4
2020 2021
Sharia NPF (Gross) & NPF (Net)
Sharia Coverage
Sharia Loan Quality by Segment
667
840
909
976
1.123
41,01%
53,01%55,55%
62,73%
76,03%
1H20 3Q20 FY20 1Q21 1H21
Sharia Provision (IDR Bn)
Sharia Coverage
1,01%0,95%
5,28%
7,56%
6,53%6,81%
5,50%
0,66% 0,76%
3,18%
5,44%
4,59%
4,99%
3,81%
2016 2017 2018 2019 2020 1H20 1H21
NPF (Gross)
NPF (Net)
Sharia Loan Disbursement Quarterly (Rp Tn)
Sharia Business PerformanceStrong yet Better Quality Financing
47
1H20 1H21 1H20 1H21
Housing Loan 11.01% 7.42% 5.07% 4.48%
Subsidized Mortgages 11.18% 7.34% 0.77% 0.59%
Non-Subsidized Mortgages 9.59% 7.15% 1.78% 1.68%
Other Housing Loans 10.52% 11.99% 2.47% 1.80%
Construction Loans 14.52% 9.00% 34.87% 44.09%
Non-Housing Loans 5.04% 2.34% 44.68% 22.27%
Consumer Loans 5.85% 8.47% 5.81% 4.43%
Commercial Loans 4.71% 0.80% 60.98% 26.74%
TOTAL 10.75% 7.13% 6.81% 5.50%
NPF (Gross)Special MentionedLoan Type

APPENDICES
48

Regional Offices 4
Branch Offices 47
Sub Branch Offices 213
Cash Offices 167
Sharia Outlets 60
Priority Outlets 32
Post Offices 1,602
ATM & CRM 1,471
JAWA
Regional Offices -
Branch Offices 3
Sub Branch Offices 13
Cash Offices 5
Sharia Outlets 1
Priority Outlets 2
Post Offices 141
ATM & CRM 55
BALI & NUSA TENGGARA
Regional Offices 1
Branch Offices 12
Sub Branch Offices 49
Cash Offices 23
Sharia Outlets 20
Priority Outlets 8
Post Offices 696
ATM & CRM 287
SUMATERA
Regional Offices -
Branch Offices 7
Sub Branch Offices 21
Cash Offices 10
Sharia Outlets 5
Priority Outlets 5
Post Offices 296
ATM & CRM 116
KALIMANTAN Regional Offices 1
Branch Offices 6
Sub Branch Offices 19
Cash Offices 11
Sharia Outlets 5
Priority Outlets 2
Post Offices 126
ATM & CRM 127
SULAWESI
Regional Offices -
Branch Offices 3
Sub Branch Offices 3
Cash Offices 5
Sharia Outlets -
Priority Outlets 3
Post Offices 61
ATM & CRM 30
PAPUA & MALUKU
Description 2016 2017 2018 2019 2020 1H 20 1H 21
Regional Offices 4 5 6 6 6 6 6
Branch Offices 65 75 76 78 78 78 78
Sub Branch Offices 243 275 304 326 314 330 318
Cash Outlets 477 484 468 358 247 350 221
Sharia Outlets 65 72 80 86 91 90 91
Total Outlets 854 911 934 854 736 854 714
Priority Outlets 40 41 43 43 51 51 52
Post Offices 2,951 2,951 2,951 2,948 2,948 2,948 2,086
ATMs & CRMs 1,900 1,964 2,126 2,160 2,098 2,098 2,922
Employees 9,380 10,372 11,810 11,647 11,224 11,449 11,072
BTN Network and Distribution
49
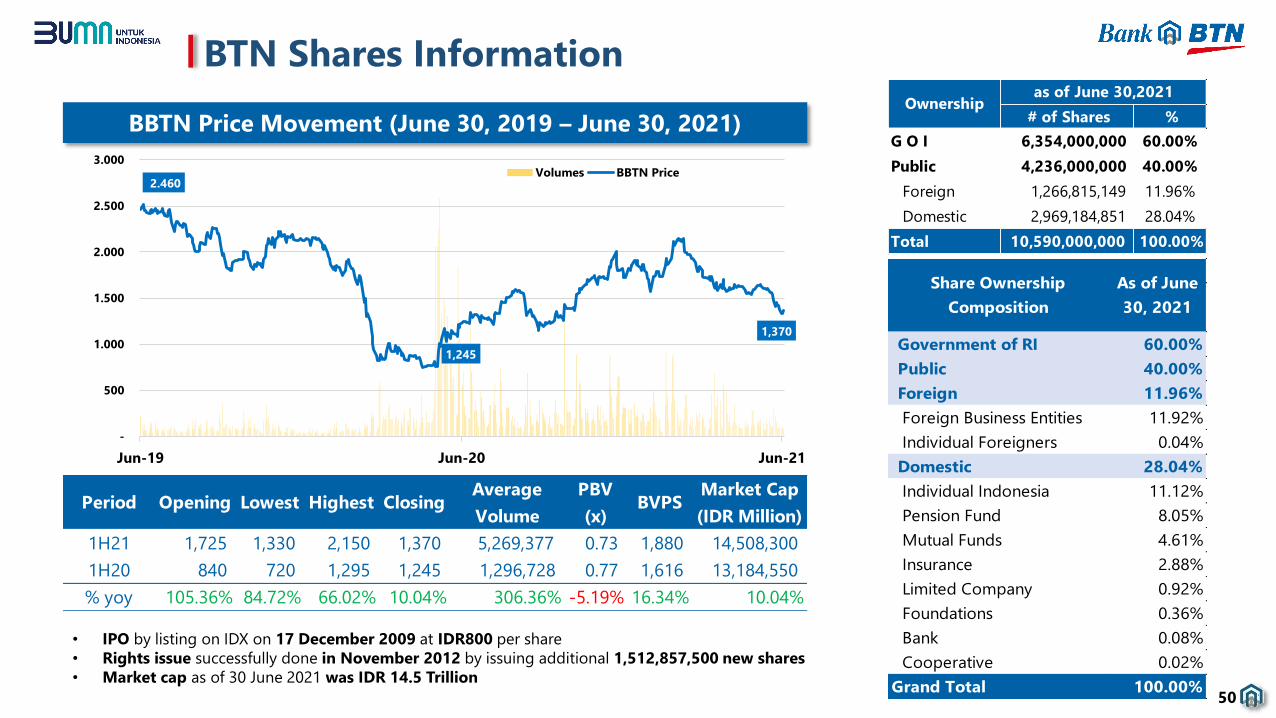
# of Shares %
G O I 6,354,000,000 60.00%
Public 4,236,000,000 40.00%
Foreign 1,266,815,149 11.96%
Domestic 2,969,184,851 28.04%
Total 10,590,000,000 100.00%
Ownershipas of June 30,2021
2.460
1,245
1,370
-
500
1.000
1.500
2.000
2.500
3.000
Jun-19 Jun-20 Jun-21
Volumes BBTN Price
BBTN Price Movement (June 30, 2019 – June 30, 2021)
BTN Shares Information
Government of RI 60.00%
Public 40.00%
Foreign 11.96%
Foreign Business Entities 11.92%
Individual Foreigners 0.04%
Domestic 28.04%
Individual Indonesia 11.12%
Pension Fund 8.05%
Mutual Funds 4.61%
Insurance 2.88%
Limited Company 0.92%
Foundations 0.36%
Bank 0.08%
Cooperative 0.02%
Grand Total 100.00%
Share Ownership
Composition
As of June
30, 2021
Period Opening Lowest Highest ClosingAverage
Volume
PBV
(x)BVPS
Market Cap
(IDR Million)
1H21 1,725 1,330 2,150 1,370 5,269,377 0.73 1,880 14,508,300
1H20 840 720 1,295 1,245 1,296,728 0.77 1,616 13,184,550
% yoy 105.36% 84.72% 66.02% 10.04% 306.36% -5.19% 16.34% 10.04%
• IPO by listing on IDX on 17 December 2009 at IDR800 per share
• Rights issue successfully done in November 2012 by issuing additional 1,512,857,500 new shares
• Market cap as of 30 June 2021 was IDR 14.5 Trillion
50
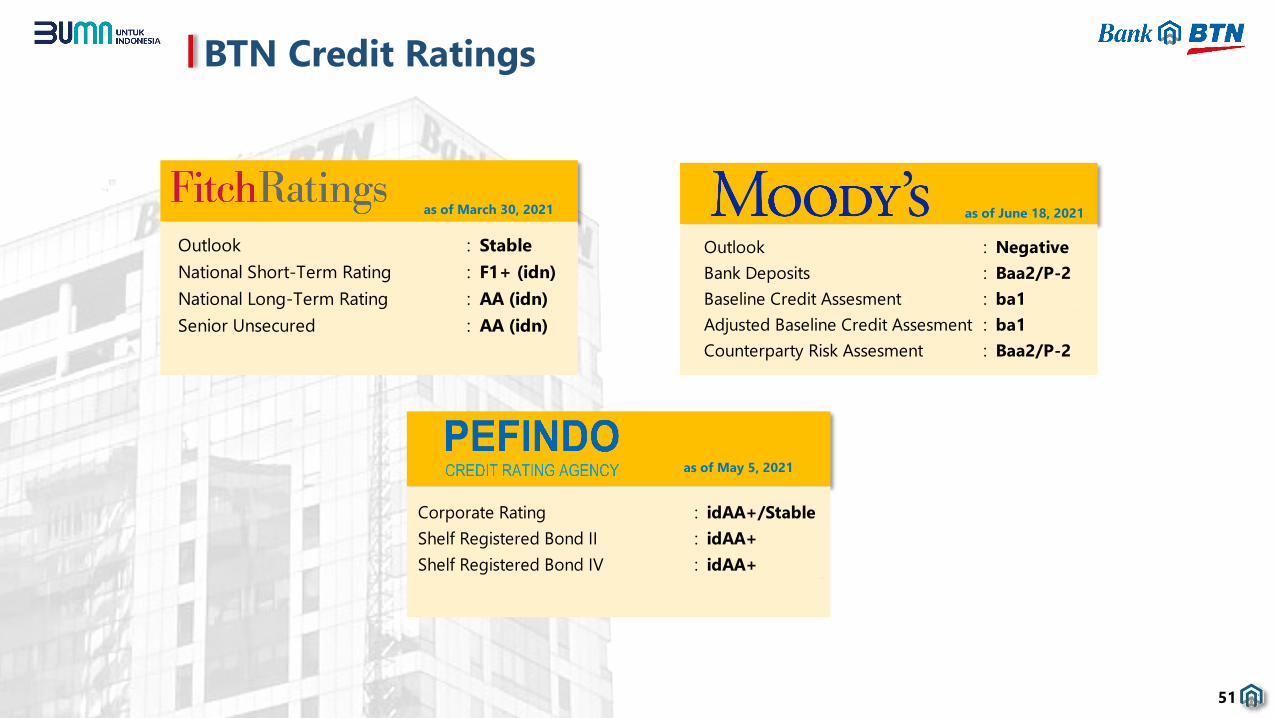
as of March 30, 2021 as of June 18, 2021
Outlook : Negative
Bank Deposits : Baa2/P-2
Baseline Credit Assesment : ba1
Adjusted Baseline Credit Assesment : ba1
Counterparty Risk Assesment : Baa2/P-2
as of May 5, 2021
Corporate Rating : idAA+/Stable
Shelf Registered Bond II : idAA+
Shelf Registered Bond IV : idAA+
Outlook : Stable
National Short-Term Rating : F1+ (idn)
National Long-Term Rating : AA (idn)
Senior Unsecured : AA (idn)
BTN Credit Ratings
51

Currently serving as Directorate General of Public Works and
Housing Infrastructure Financing, Ministry of Public Works and
Housing.
Eko D. Heripoerwanto – Commissioner
Currently serving as Directorate General of Treasury, Ministry of
Finance and Commissioner at PT Sarana Multi Infrastruktur.
Andin Hadiyanto – Commissioner
Currently serving as Head of Presidential Secretariat. Was also
Head of Financial Asset Management Body of DKI Jakarta.
Heru Budi Hartono – Commissioner
Served as President Commissioner of PT BRI Agroniaga Tbk,
Independent Commissioner of PT Bank DKI and Managing
Director at PT Bank Negara Indonesia (Persero) Tbk.
Ahdi Jumhari Luddin – Independent Commissioner
Currently a Partner at Assegaf Hamzah & Partners Law Firm.
Previously President Commissioner of PT Perusahaan Listrik
Negara (Persero) and Commissioner at Komisi Pemberantasan
Korupsi.
Chandra Hamzah
President Commissioner/ Independent
Served as Commissioner and Senior Consultant of Dunamis
Organization Services, Independen Commissioner at PT Bank
Royal Indonesia and President Director at PT Bank UOB Buana.
Armand B. Arief – Independent Commissioner
Previously served as Commissioner at PT Bank Mandiri Taspen and
Commissioner at PT Pemeringkat Efek Indonesia
Iqbal Latanro
Vice President Commissioner/ Independent
Board of Commisioners
52

Served as General Manager of Operational Information Technology, and
General Manager Solution and IT Security Division at PT Bank Negara
Indonesia (Persero) Tbk.
Andi Nirwoto
Director of Operation, IT and Digital Banking
Served as Treasury Division Head and Head of Regional Office I at PT Bank
Tabungan Negara (Persero) Tbk
Nofry Rony Poetra
Director of Finance, Planning and Treasury*
Served as President Director of PT Bank Mandiri
Taspen Pos and Head of Transition Team Bank
Joint Venture PT Bank Mandiri (Persero) Tbk.
Nixon L. P. Napitupulu
Vice President Director
Served as Director of Finance of PT Bank Rakyat
Indonesia (Persero) Tbk. and President
Commissioner of PT BRI Multifinance Indonesia
Haru Koesmahargyo
President Director
*) effective following approval of Fit & Proper Test by Otoritas Jasa Keuangan (OJK)
Served as Subsidized Mortgage Lending Division Head and Business
Development of Subsidized Mortgage Department Head at PT Bank
Tabungan Negara (Persero) Tbk.
Hirwandi Gafar
Director of Consumer and Commercial Lending
Served as Human Capital Management Division Head and Corporate
Secretary Division Head at PT Bank Tabungan Negara (Persero) Tbk.
Eko Waluyo
Director of Compliance and Legal*
Served as Asset Management Division Head and Small and Medium Lending
Division Head at PT Bank Tabungan Negara (Persero) Tbk
Elisabeth Novie Riswanti
Director of Wholesale Risk and Asset Management
Served as Consumer Credit Risk & Analytics Group Head and Credit Portofolio
Risk Group Head at PT Bank Mandiri (Persero) Tbk
Setiyo Wibowo
Director of Risk Management and Transformation
Served as SEVP of Consumer & Transaction and Regional CEO IV/JKT 2 at PT
Bank Mandiri (Persero) Tbk.
Jasmin
Director of Distribution and Retail Funding
Board of Directors
53

The 5th
Largest
Bank by
Assets
The 5th
Largest
Bank by
Loans
The 5th
Largest
Bank by
Deposits
1897
BTN was
established as
“Postspaarbank”
under the Dutch
Government
1950
Re-established as
“Bank Tabungan Pos”
by Indonesian
Government
1963
1974
Assumed its current name
Bank Tabungan Negara
Appointed by the
Government as the sole
institution to provide
housing finance
to middle/low-income
groups
1989
Started operating
as a commercial
bank and issued
the first corporate
bond
1994
Obtained permit to
operate as a
Foreign Exchange
Bank
2002
Assigned as a
commercial bank
with focus on
commercial
housing finance
2009
Listed as Public
Company at
Indonesian Stock
Exchange on
17 December 2009
2012
Rights Issue
BTN Milestones
54

Investor Relations
PT Bank Tabungan Negara (Persero) Tbk.
Menara BTN 16th Floor
Jl. Gajah Mada No. 1
Jakarta 10130
Telp: +62 21 63870107
Email: investor_ [email protected]
Website: www.btn.co.id
THANK YOU