1
Evalua&on of the IRGASON Integrated CO 2 /H 2 O Gas Analyzer and Sonic Anemometer Steven P Oncley 1 , Thomas W Horst 1 , Edward Swiatek 2 , Ivan Bogoev 2 1 NaAonal Center for Atmospheric Research/Earth Observing Laboratory 2 Campbell ScienAfic, Inc. Air Flow Distor,on Evalua,on Laboratory Evalua,on Scalar Flux Measurement Evalua,on Results IRGASON had more temperature driO than LI7500 IRGASON had large offset (This IRGASON was replaced due to a faulty component, but this lab test of the new sensor was not repeated.) Results VerAcal velocity (w) agrees quite well (variance difference <1%), especially for flow from up to +/100 degrees from the front Horizontal velocity components (u,v) have larger errors: v severely changed for wind direcAons beyond 80 degrees from front FricAon velocity (u * ) differences of +/15% observed even for “good” wind direcAons Method Apply 4 calibraAon gases from tanks to sensor at different temperatures. Method Operate IRGASON sidebyside with reference CSAT3 sonic anemometer in the field. Over 500 hours of data with wind speed >2 m/s during 2012 were used. Check variaAon of mean, variance, and turbulence staAsAcs (u * and TKE) with wind direcAon (flow orientaAon with respect to the sensor head). Conclusions IRGASON scalar (T c ,H 2 O, CO 2 ) measurements similar quality to LI7500. (T c is derived from speed of sound.) No spaAal separaAon correcAon needed Momentum flux measurement significantly compromised Background Physical separaAon between measurements of verAcal velocity and H 2 O or CO 2 systemaAcally reduces their calculated fluxes and must be corrected. The IRGASON addresses this problem by colocaAng these measurements, but could introduce errors in the velocity measurements. IRGASON data are available at up to 100 samples/s using 5W total of power. Method Operate IRGASON in the field sidebyside with CSAT3 sonic anemometer plus LI7500 openpath IRGA and krypton hygrometer. Field check calibraAon versus aspirated hygrometer for H 2 O and Picarro closedpath analyzer for CO 2 . Results Heat fluxes agree within 3% overall Both IRGAs must be cleaned! – significant driO in means seen when not done (more in LI7500) A gain difference is seen between IRGANSON and LI7500 H 2 O and CO 2 fluctuaAon measurements, which explains much of the differences in the fluxes, but is not consistent with the variaAon of means with respect to the aspirated hygrometer and Picarro references Remaining difference in fluxes is consistent with undercorrecAon of LI7500 fluxes due to spaAal separaAon AOer WPL correcAon for air density fluctuaAons, IRGASON fluxes are reasonable (CO 2 uptake during the day and respiraAon at night) ICDC9 P194 Beijing, China Example of nighnme fluxes: The correlaAon coefficient between w and CO 2 is 30% lower from the LI7500, presumably due to path separaAon. Our model of this separaAon predicts only a 4% effect, so even corrected fluxes would be underesAmated. u StaAsAcs v StaAsAcs w/T c StaAsAcs mean variance flux CO 2 density changes due to changing temperature and to changing CO 2 mixing raAo. AOer removing the air density change, fluxes are more realisAc from the IRGASON, with CO 2 uptake during the day. This implies that our LI7500 was not well calibrated. IRGASON (center), LI7500 and krypton with CSAT3 (leO), and reference CSAT3 (right). Only wind direcAons not blocked by adjacent sensors were analyzed. mean variance flux T c StaAsAcs H 2 O StaAsAcs CO 2 StaAsAcs dir CSAT3 (deg) Normalized Residuals, (%) 30 20 10 0 10 20 30 90 60 30 0 30 60 90 120 150 spd_IRGASON = 1.02 spd_CSAT3 + 0.09 +/0.054 m/s 30 20 10 0 10 20 30 dir CSAT3 (deg) dir_IRGASON dir_CSAT3 (deg) 4 2 0 2 4 6 90 60 30 0 30 60 90 120 150 dir_IRGASON dir_CSAT3 vs dir_CSAT3 4 2 0 2 4 6 dir CSAT3 (deg) Normalized Residuals, (%) 40 30 20 10 0 10 20 90 60 30 0 30 60 90 120 150 u’u’_IRGASON = 1.05 u’u’_CSAT3 +/0.069 (m/s)^2 40 30 20 10 0 10 20 dir CSAT3 (deg) Normalized Residuals, (%) 40 30 20 10 0 10 20 90 60 30 0 30 60 90 120 150 v’v’_IRGASON = 1.18 v’v’_CSAT3 +/0.117 (m/s)^2 40 30 20 10 0 10 20 dir CSAT3 (deg) Normalized Residuals, (%) 30 20 10 0 10 20 30 90 60 30 0 30 60 90 120 150 w’w’_IRGASON = 1 w’w’_CSAT3 +/0.014 (m/s)^2 30 20 10 0 10 20 30 dir CSAT3 (deg) Normalized Residuals, (%) 30 20 10 0 10 20 30 90 60 30 0 30 60 90 120 150 u*_IRGASON = 0.96 u*_CSAT3 +/0.031 m/s 30 20 10 0 10 20 30 dir CSAT3 (deg) Normalized Residuals, (%) 30 20 10 0 10 20 30 90 60 30 0 30 60 90 120 150 TKE_IRGASON = 1.1 TKE_CSAT3 +/0.049 (m/s)^2 30 20 10 0 10 20 30 dir CSAT3 (deg) Residuals, (m/s degC) 0.03 0.02 0.01 0.0 0.01 0.02 0.03 0.04 90 60 30 0 30 60 90 120 150 w’tc’_IRGASON = 0.99 w’tc’_CSAT3 +/0.009 m/s degC 0.03 0.02 0.01 0.0 0.01 0.02 0.03 0.04 dir CSAT3 (deg) Normalized Residuals, (%) 30 20 10 0 10 20 30 90 60 30 0 30 60 90 120 150 tc’tc’_IRGASON = 1.02 tc’tc’_CSAT3 +/0.042 (degC)^2 30 20 10 0 10 20 30

1Naonal&Center&for&Atmospheric&Research/Earth&Observing ... · PDF fileSteven&P&Oncley 1,&Thomas&W&Horst,&Edward&Swiatek2,&Ivan&Bogoev2&& ... Air$Flow$Distor,on$Evalua,on$ Laboratory$Evalua,on$

  • Upload
    ngokien

  • View
    215

  • Download
    2

Embed Size (px)

Citation preview

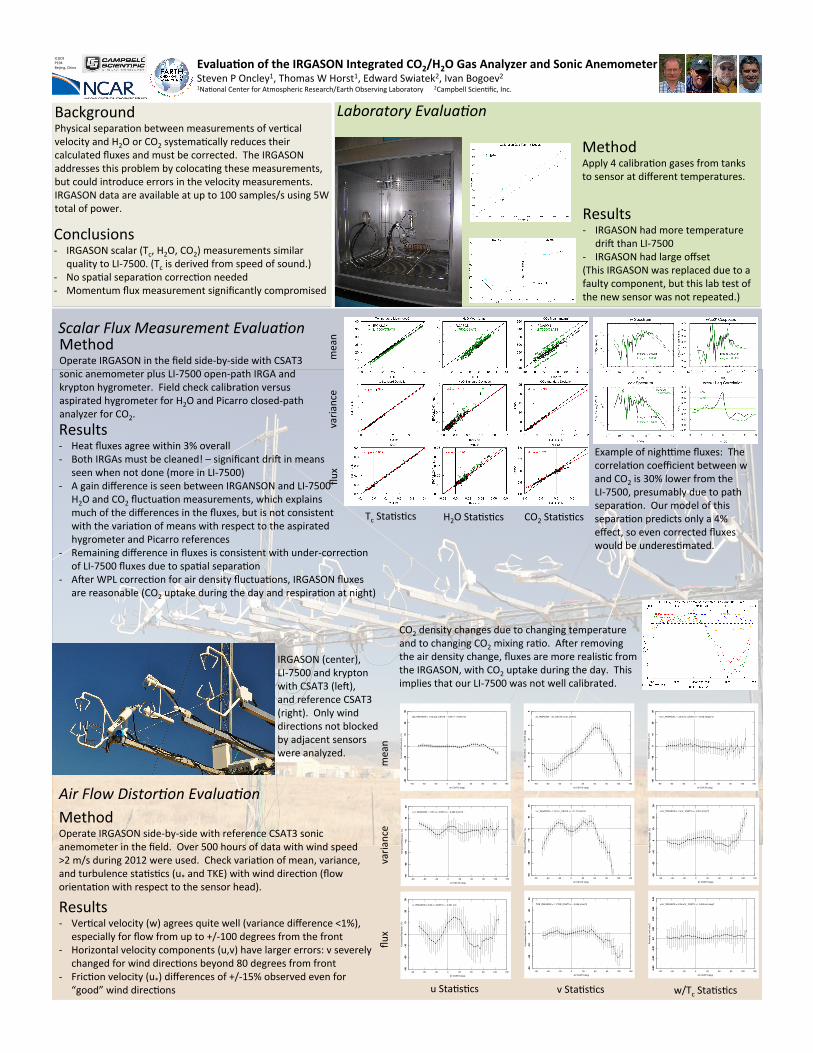
Evalua&on  of  the  IRGASON  Integrated  CO2/H2O  Gas  Analyzer  and  Sonic  Anemometer  Steven  P  Oncley1,  Thomas  W  Horst1,  Edward  Swiatek2,  Ivan  Bogoev2    1NaAonal  Center  for  Atmospheric  Research/Earth  Observing  Laboratory            2Campbell  ScienAfic,  Inc.  

Air  Flow  Distor,on  Evalua,on  

Laboratory  Evalua,on  

Scalar  Flux  Measurement  Evalua,on  

Results  -­‐  IRGASON  had  more  temperature            driO  than  LI-­‐7500  -­‐  IRGASON  had  large  offset  (This  IRGASON  was  replaced  due  to  a  faulty  component,  but  this  lab  test  of  the  new  sensor  was  not  repeated.)    

Results  -­‐  VerAcal  velocity  (w)  agrees  quite  well  (variance  difference  <1%),            especially  for  flow  from  up  to  +/-­‐100  degrees  from  the  front  -­‐  Horizontal  velocity  components  (u,v)  have  larger  errors:  v  severely  

changed  for  wind  direcAons  beyond  80  degrees  from  front  -­‐  FricAon  velocity  (u*)  differences  of  +/-­‐15%  observed  even  for  

“good”  wind  direcAons  

Method  Apply  4  calibraAon  gases  from  tanks  to  sensor  at  different  temperatures.  

Method  Operate  IRGASON  side-­‐by-­‐side  with  reference  CSAT3  sonic  anemometer  in  the  field.    Over  500  hours  of  data  with  wind  speed  >2  m/s  during  2012  were  used.    Check  variaAon  of  mean,  variance,    and  turbulence  staAsAcs  (u*  and  TKE)  with  wind  direcAon  (flow  orientaAon  with  respect  to  the  sensor  head).  

Conclusions  -­‐  IRGASON  scalar  (Tc,  H2O,  CO2)  measurements  similar  

quality  to  LI-­‐7500.  (Tc  is  derived  from  speed  of  sound.)  -­‐  No  spaAal  separaAon  correcAon  needed  -­‐  Momentum  flux  measurement  significantly  compromised  

Background  Physical  separaAon  between  measurements  of  verAcal  velocity  and  H2O  or  CO2  systemaAcally  reduces  their  calculated  fluxes  and  must  be  corrected.    The  IRGASON  addresses  this  problem  by  colocaAng  these  measurements,  but  could  introduce  errors  in  the  velocity  measurements.  IRGASON  data  are  available  at  up  to  100  samples/s  using  5W  total  of  power.      

Method  Operate  IRGASON  in  the  field  side-­‐by-­‐side  with  CSAT3  sonic  anemometer  plus  LI-­‐7500  open-­‐path  IRGA  and  krypton  hygrometer.    Field  check  calibraAon  versus  aspirated  hygrometer  for  H2O  and  Picarro  closed-­‐path  analyzer  for  CO2.  Results  -­‐  Heat  fluxes  agree  within  3%  overall  -­‐  Both  IRGAs  must  be  cleaned!  –  significant  driO  in  means            seen  when  not  done  (more  in  LI-­‐7500)  -­‐  A  gain  difference  is  seen  between  IRGANSON  and  LI-­‐7500            H2O  and  CO2  fluctuaAon  measurements,  which  explains              much  of  the  differences  in  the  fluxes,  but  is  not  consistent            with  the  variaAon  of  means  with  respect  to  the  aspirated              hygrometer  and  Picarro  references  -­‐  Remaining  difference  in  fluxes  is  consistent  with  under-­‐correcAon  

of  LI-­‐7500  fluxes  due  to  spaAal  separaAon  -­‐  AOer  WPL  correcAon  for  air  density  fluctuaAons,  IRGASON  fluxes  

are  reasonable  (CO2  uptake  during  the  day  and  respiraAon  at  night)  

ICDC9  P194  Beijing,  China  

Example  of  nighnme  fluxes:    The  correlaAon  coefficient  between  w  and  CO2  is  30%  lower  from  the  LI-­‐7500,  presumably  due  to  path  separaAon.    Our  model  of  this  separaAon  predicts  only  a  4%  effect,  so  even  corrected  fluxes  would  be  underesAmated.  

u  StaAsAcs   v  StaAsAcs   w/Tc  StaAsAcs  

mean  

varia

nce  

flux  

CO2  density  changes  due  to  changing  temperature  and  to  changing  CO2  mixing  raAo.    AOer  removing  the  air  density  change,  fluxes  are  more  realisAc  from  the  IRGASON,  with  CO2  uptake  during  the  day.    This  implies  that  our  LI-­‐7500  was  not  well  calibrated.  

IRGASON  (center),  LI-­‐7500  and  krypton  with  CSAT3  (leO),  and  reference  CSAT3  (right).    Only  wind  direcAons  not  blocked  by  adjacent  sensors  were  analyzed.  

mean  

varia

nce  

flux  

Tc  StaAsAcs   H2O  StaAsAcs   CO2  StaAsAcs  

dir CSAT3 (deg)

Norm

alize

d Re

sidua

ls, (%

)−3

0−2

0−1

00

1020

30

−90 −60 −30 0 30 60 90 120 150

spd_IRGASON = 1.02 spd_CSAT3 + 0.09 +/− 0.054 m/s

−30

−20

−10

010

2030

dir CSAT3 (deg)

dir_

IRG

ASO

N −

dir_

CSAT

3 (d

eg)

−4−2

02

46

−90 −60 −30 0 30 60 90 120 150

dir_IRGASON − dir_CSAT3 vs dir_CSAT3

−4−2

02

46

dir CSAT3 (deg)

Norm

alize

d Re

sidua

ls, (%

)−4

0−3

0−2

0−1

00

1020

−90 −60 −30 0 30 60 90 120 150

u’u’_IRGASON = 1.05 u’u’_CSAT3 +/− 0.069 (m/s)^2

−40

−30

−20

−10

010

20

dir CSAT3 (deg)

Norm

alize

d Re

sidua

ls, (%

)−4

0−3

0−2

0−1

00

1020

−90 −60 −30 0 30 60 90 120 150

v’v’_IRGASON = 1.18 v’v’_CSAT3 +/− 0.117 (m/s)^2

−40

−30

−20

−10

010

20

dir CSAT3 (deg)

Norm

alize

d Re

sidua

ls, (%

)−3

0−2

0−1

00

1020

30

−90 −60 −30 0 30 60 90 120 150

w’w’_IRGASON = 1 w’w’_CSAT3 +/− 0.014 (m/s)^2

−30

−20

−10

010

2030

dir CSAT3 (deg)

Norm

alize

d Re

sidua

ls, (%

)−3

0−2

0−1

00

1020

30

−90 −60 −30 0 30 60 90 120 150

u*_IRGASON = 0.96 u*_CSAT3 +/− 0.031 m/s

−30

−20

−10

010

2030

dir CSAT3 (deg)

Norm

alize

d Re

sidua

ls, (%

)−3

0−2

0−1

00

1020

30

−90 −60 −30 0 30 60 90 120 150

TKE_IRGASON = 1.1 TKE_CSAT3 +/− 0.049 (m/s)^2

−30

−20

−10

010

2030

dir CSAT3 (deg)

Resid

uals,

(m/s

deg

C)−0

.03

−0.0

2−0

.01

0.0

0.01

0.02

0.03

0.04

−90 −60 −30 0 30 60 90 120 150

w’tc’_IRGASON = 0.99 w’tc’_CSAT3 +/− 0.009 m/s degC

−0.0

3−0

.02

−0.0

10.

00.

010.

020.

030.

04

dir CSAT3 (deg)

Norm

alize

d Re

sidua

ls, (%

)−3

0−2

0−1

00

1020

30

−90 −60 −30 0 30 60 90 120 150

tc’tc’_IRGASON = 1.02 tc’tc’_CSAT3 +/− 0.042 (degC)^2

−30

−20

−10

010

2030