Embed Size (px)
Citation preview
156•A A2.84..6.
V-22 Simulator Evaluation for Shipboard Operations
William D. Roddy/1Naval Air Warfare Center Aircraft Divis ionTICPatuxent River,, Maryland 20670-5304 USA (ftELECTE
41ER 02 19
In June 1990, a preliminary evaluation of the Naval Air WarfareCenter Aircraft Division (NAWCAD) Patuxent River's Manned FlightSimulator (MFS) motion base was performed to assess its value forpilot training and task familiarization for Dynamic Interface (DI)testing. Since that time, MFS engineers have made significantimprovements in the areas of ship airwake and turbulencemodelling, ship visual elements, and motion cueing. In early 1993,the DI department was tasked to perform an evaluation with a duelpurpose. The first was to evaluate and document the fidelity ofthe V-22 flight simulator for the shipboard operations flighttests. The second was to identify the critical elements requiredto adequately perform various shipboard compatibility analyses andprepare project pilots for shipboard DI testing. The testconsisted of 220 shipboard landings, 8 short take off's, andcomprised a total of 16 flight hours.
Backaround
In 1985, the Manned Flight Simulator of the Naval Air Test Center,Patuxent River, Maryland was tasked by the V-22 program office todevelop an aerodynamic model to support the V-22 flight testprogram. Additional mathematical models were developed, and arealistic cockpit procured. One of the many proposed applicationsfor the simulator was to prepare V-22 pilots for shipboardcompatibility flights called Dynamic Interface (DI) testing. Oneof the many objectives of DI flight testing is to identify wind-over-deck conditions (called launch/recovery envelopes) requiredfor consistent safe helicopter operations from a particular classship. The highest priority ship class to flight test the prototypeV-22 was USS WASP (LHD-1). The initial shipboard trials wereperformed in December of 1990. Simulation engineers produced avisual model of the ship to prepare for the proposed flight test.One question was left unanswered... "What is the minimum fidelity ofa simulator required to properly prepare pilots for shipboardflight operations?"
Puroose
The main purpose of this paper is to provide some insight intoevaluating an aircraft simulation in a shipboard environment. Inaddition, procedures and analysis techniques will be outlined withspecial emphasis on experimental design.
94-28789 94 9 02 127logi,, I&a@QUALMp IIMBpZCM 8

TO WHOM IT MAY CONCERN:
Here is a copy of Professional Papers written by variouspeople here at the Naval Air Warfare Center Aircraft Division.It was requested that a copy of each of the professional papersbe sent to DTIC for retention.
If you have any questions, please contact Dorothy Reppel,3T6-1709 or (301) 826-1709.
P.S. All the enclosed papers have been cleared for public release.
£eoeuston FoP
STIS GRA&IDTIC TAB
Unannou.ncedJustification
Distribu-tion/j,Avai__labi'lity Coaesi A vail a /or
J i IJ -- w e m m mm m l t IL • ,
Introduction
"Experimental Design" seems to be the latest buzzword among humanfactors and test engineers. Budgetary constraints and highoperating costs drive the engineer to know precisely how post-testexperimental data will be handled to ensure maximum benefit. Amachine is fairly simple to evaluate (if it is operating properly)because of its consistent and predictable nature. In flighttesting, the test engineer's input variables include not only theaircraft and atmospheric conditions, but also the pilot controllingthe machine. Certain information must be considered whencollecting qualitative information from project pilots pertainingto total number of flight hours, flight hours in the specificmodel, hours in simulators, and number of shipboard landings. Thisinformation will help the test engineer choose which pilot will bemost suited for a particular task or phase of the test.
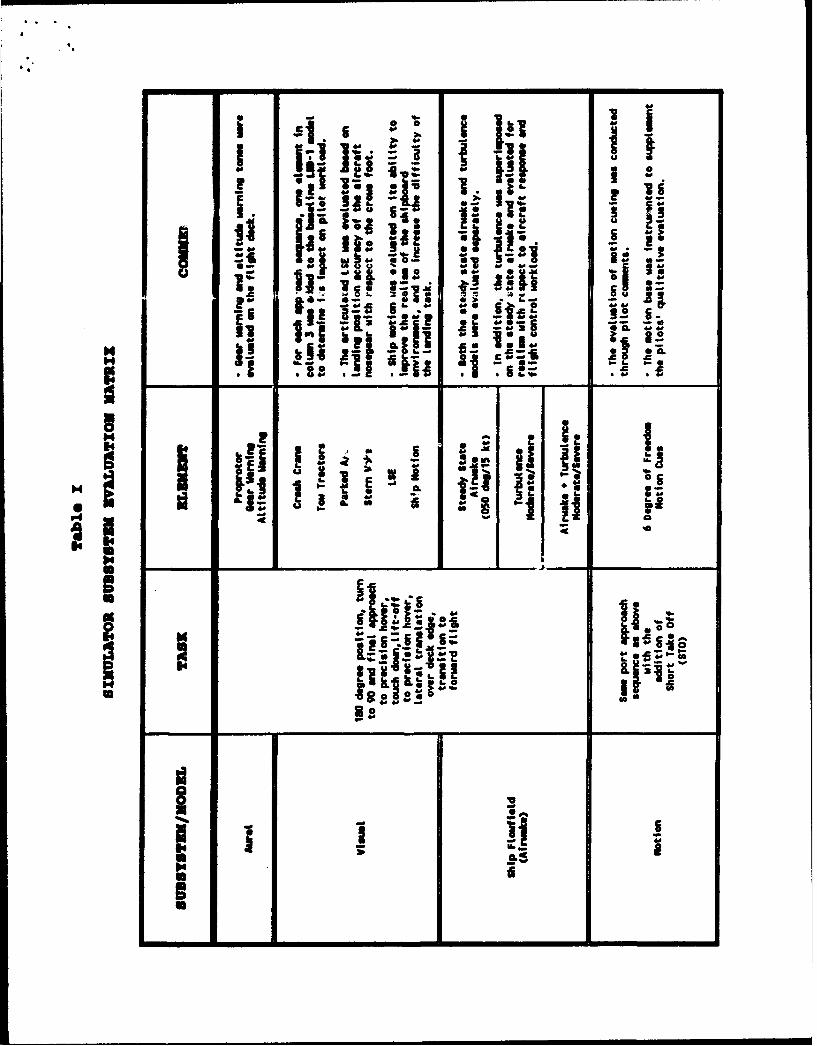
What critical elements make shipboard operational simulationunique? The main elements are lack of adequate spatial cueing onfinal approach and hover, ship motion, sea state, and shipsuperstructure turbulence. The four main elements or subsystemswhich were evaluated at the MFS were the visual system, motionsystem, aural system, and ship airwake/turbulence models. Thepurpose of the evaluation was not to validate the aircraftaerodynamic model, but rather to identify the level of fidelityrequired to adequately prepare project pilots for shipboardoperational flight testing. Each system was broken down into sub-systems or sub-elements to be evaluated, illustrated in table I.
There are many questions that arise while preparing for anevaluation of this nature. What is the minimum number of pilotsrequired to provide information that is "statistically relevant"?How can one "standardize" a port approach? How does one accountfor the "learning curve" over the span of a two hour flight?...Thelist goes on. The scope of effort was the first thing to beaddressed, with a test plan written to outline aircraftconfiguration, atmospheric conditions, procedures, data collection,etc. That information led to the number of test pilots and amountof simulator time required for the evaluation.
DescriDtion of the V-22 Flight Simulator
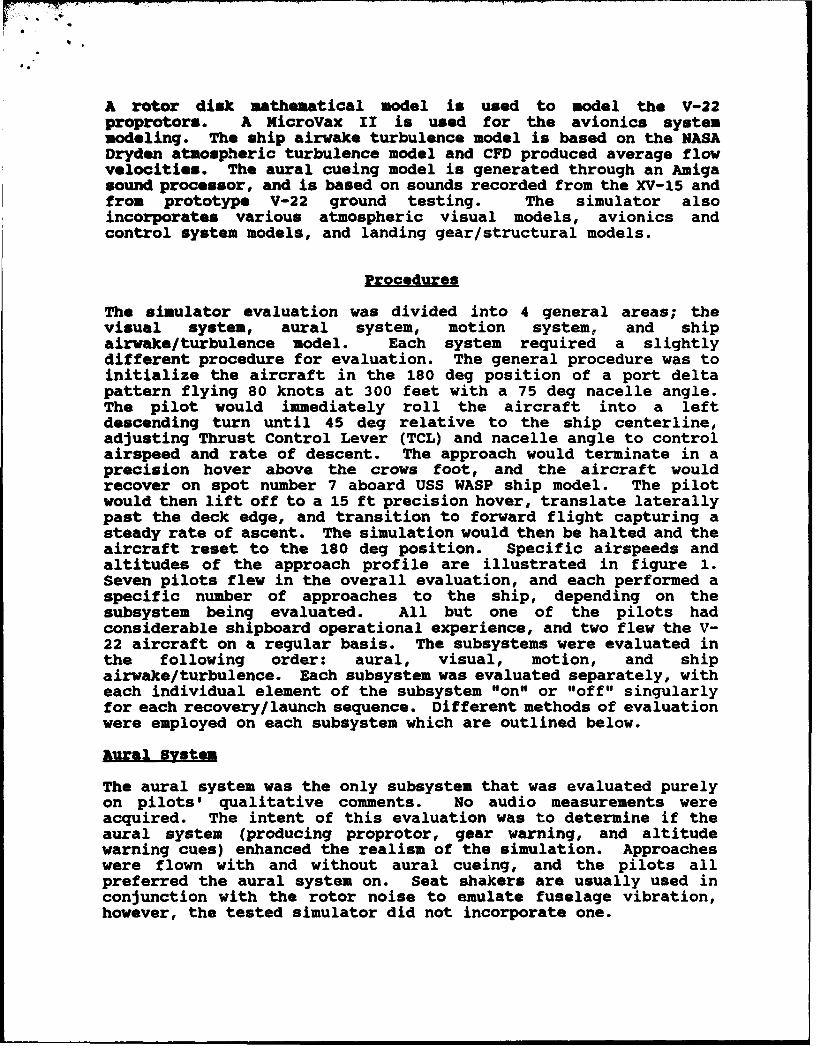
The MFS Six Degree of Freedom motion base system is designed toproduce realistic motion throughout the flight envelope,particularly during the critical takeoff, approach, and recoveryphases. The motion platform is controlled to provide roll, pitch,yaw, vertical, lateral, and longitudinal translation in anycombination with ± 1 g acceleration. The motion system is equippedwith a Wide-Angle Infinity Display Equipment II (WIDE II) visualdisplay system. The WIDE II displays the computed scene from aCOMPU-SCENE IVA visual system and consists of five projectors, aback projection screen, and a collimation mirror. The WIDE IIprovides a field of view of 160 deg in the horizontal plane and+15/-25 deg in the vertical plane.
- -
- @0
I .sJ E U i'..i -
I* I;
I.
I!! !�.' *1�
0-
Zg
I; � i�1 !ulj
a. * I.-
f�-2 I� �-**' .rji :1� -g -- -.*0. 4"-
di 1:it *;*b�z 4'- C�
6� *'-�. �i2 �Il ag -�
p S@O' '-C **4'
SE .0 *4' *4'
bIE *j�� I i*�- �
*1�'-
kj� �
41k-f.
0.
0-
I.E _______
____________________
- -
U
M i�I ag
q. -
*I @� @4'
U. 4' 4' 4'
iiii I
a.5
I.
iU
I- -
e."
A rotor disk mathematical model is used to model the V-22proprotors. A NicroVax II is used for the avionics systemmodeling. The ship airwake turbulence model is based on the NASADryden atmospheric turbulence model and CFD produced average flowvelocities. The aural cueing model is generated through an Amigasound processor, and is based on sounds recorded from the XV-15 andfrom prototype V-22 ground testing. The simulator alsoincorporates various atmospheric visual models, avionics andcontrol system models, and landing gear/structural models.
Procedures
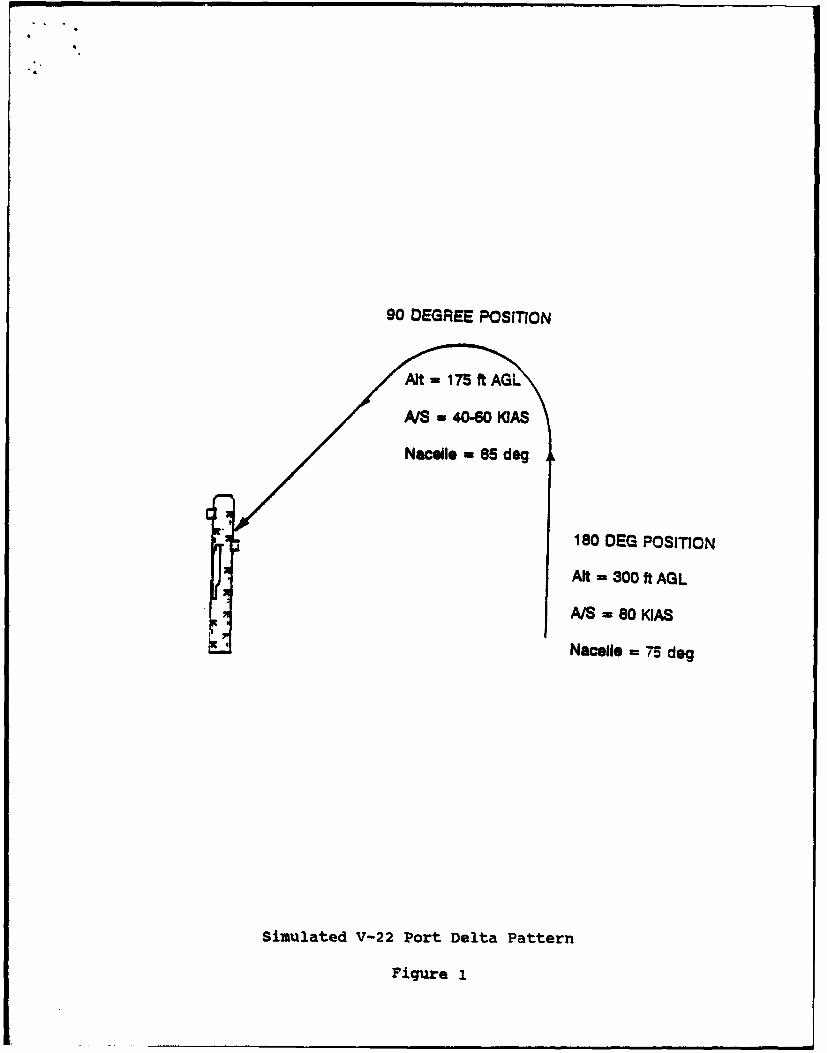
The simulator evaluation was divided into 4 general areas; thevisual system, aural system, motion system, and shipairwake/turbulence model. Each system required a slightlydifferent procedure for evaluation. The general procedure was toinitialize the aircraft in the 180 deg position of a port deltapattern flying 80 knots at 300 feet with a 75 deg nacelle angle.The pilot would immediately roll the aircraft into a leftdescending turn until 45 deg relative to the ship centerline,adjusting Thrust Control Lever (TCL) and nacelle angle to controlairspeed and rate of descent. The approach would terminate in aprecision hover above the crows foot, and the aircraft wouldrecover on spot number 7 aboard USS WASP ship model. The pilotwould then lift off to a 15 ft precision hover, translate laterallypast the deck edge, and transition to forward flight capturing asteady rate of ascent. The simulation would then be halted and theaircraft reset to the 180 deg position. Specific airspeeds andaltitudes of the approach profile are illustrated in figure 1.Seven pilots flew in the overall evaluation, and each performed aspecific number of approaches to the ship, depending on thesubsystem being evaluated. All but one of the pilots hadconsiderable shipboard operational experience, and two flew the V-22 aircraft on a regular basis. The subsystems were evaluated inthe following order: aural, visual, motion, and shipairwake/turbulence. Each subsystem was evaluated separately, witheach individual element of the subsystem "on" or "off" singularlyfor each recovery/launch sequence. Different methods of evaluationwere employed on each subsystem which are outlined below.
Aural System
The aural system was the only subsystem that was evaluated purelyon pilots' qualitative comments. No audio measurements wereacquired. The intent of this evaluation was to determine if theaural system (producing proprotor, gear warning, and altitudewarning cues) enhanced the realism of the simulation. Approacheswere flown with and without aural cueing, and the pilots allpreferred the aural system on. Seat shakers are usually used inconjunction with the rotor noise to emulate fuselage vibration,however, the tested simulator did not incorporate one.
90 DEGREE POSITION
Alt 175 f G
AIS -40-60 KJAS
Nacotle = 85 dog
180 DEG POSITION
Alt , 300 ft AGL
A/S -80 KIAS
Nacelio = 75 dog
Simulated V-22 Port Delta Pattern
Figure 1
7,777'"'T"•
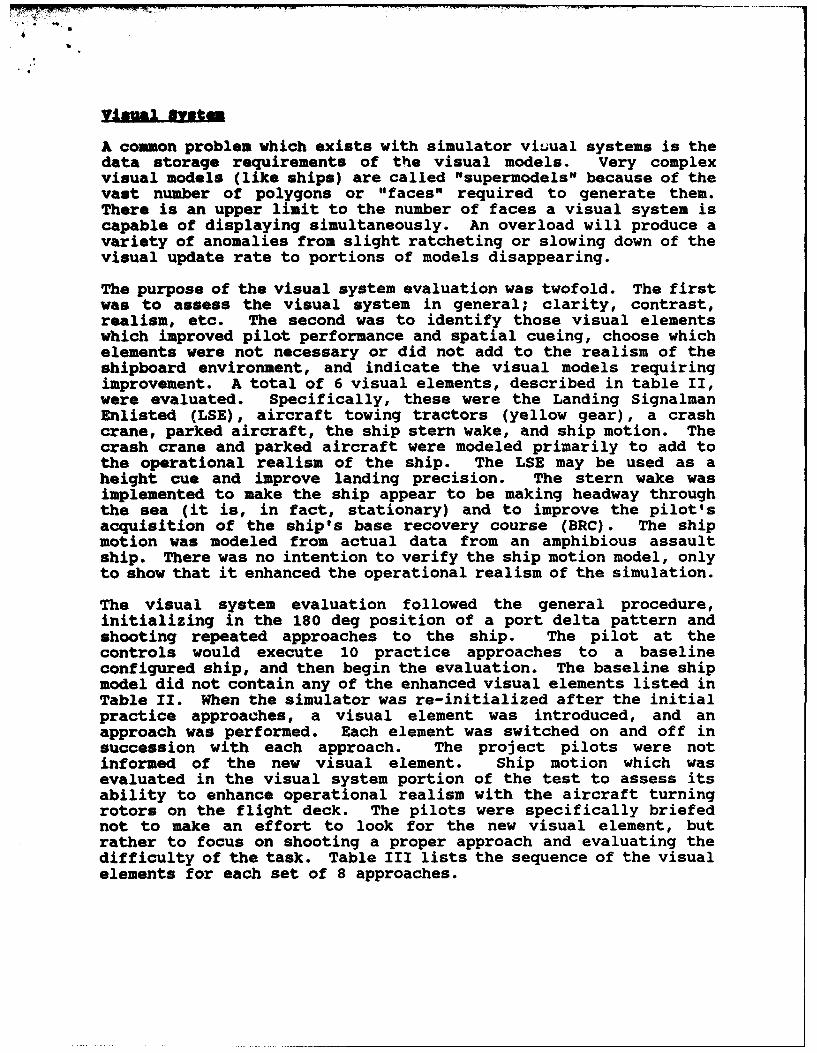
A common problem which exists with simulator viuual systems is thedata storage requirements of the visual models. Very complexvisual models (like ships) are called "supermodels" because of thevast number of polygons or "faces" required to generate them.There is an upper limit to the number of faces a visual system iscapable of displaying simultaneously. An overload will produce avariety of anomalies from slight ratcheting or slowing down of thevisual update rate to portions of models disappearing.
The purpose of the visual system evaluation was twofold. The firstwas to assess the visual system in general; clarity, contrast,realism, etc. The second was to identify those visual elementswhich improved pilot performance and spatial cueing, choose whichelements were not necessary or did not add to the realism of theshipboard environment, and indicate the visual models requiringimprovement. A total of 6 visual elements, described in table II,were evaluated. Specifically, these were the Landing SignalmanEnlisted (LSE), aircraft towing tractors (yellow gear), a crashcrane, parked aircraft, the ship stern wake, and ship motion. Thecrash crane and parked aircraft were modeled primarily to add tothe operational realism of the ship. The LSE may be used as aheight cue and improve landing precision. The stern wake wasimplemented to make the ship appear to be making headway throughthe sea (it is, in fact, stationary) and to improve the pilot'sacquisition of the ship's base recovery course (BRC). The shipmotion was modeled from actual data from an amphibious assaultship. There was no intention to verify the ship motion model, onlyto show that it enhanced the operational realism of the simulation.
The visual system evaluation followed the general procedure,initializing in the 180 deg position of a port delta pattern andshooting repeated approaches to the ship. The pilot at thecontrols would execute 10 practice approaches to a baselineconfigured ship, and then begin the evaluation. The baseline shipmodel did not contain any of the enhanced visual elements listed inTable II. When the simulator was re-initialized after the initialpractice approaches, a visual element was introduced, and anapproach was performed. Each element was switched on and off insuccession with each approach. The project pilots were notinformed of the new visual element. Ship motion which wasevaluated in the visual system portion of the test to assess itsability to enhance operational realism with the aircraft turningrotors on the flight deck. The pilots were specifically briefednot to make an effort to look for the new visual element, butrather to focus on shooting a proper approach and evaluating thedifficulty of the task. Table III lists the sequence of the visualelements for each set of 8 approaches.
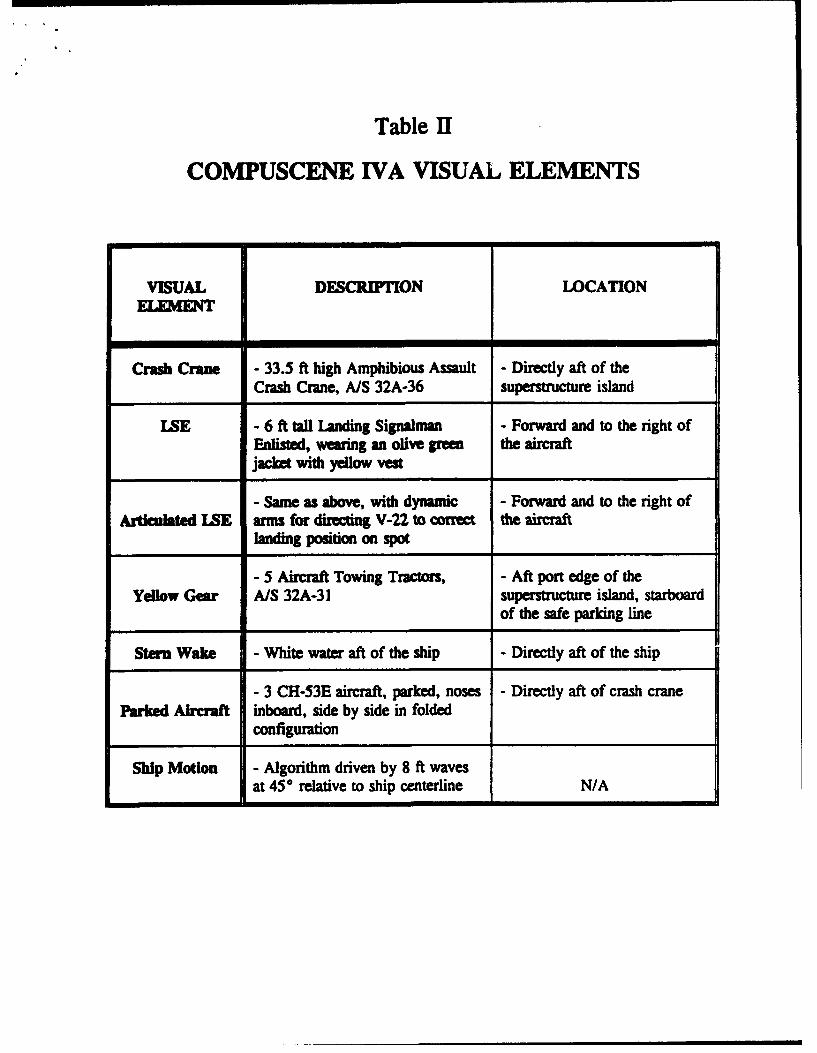
Table II
COMPUSCENE IVA VISUAL ELEMENTS
VISUAL DESCRIPTION LOCATIONELEMENT
Crash Crane - 33.5 ft high Amphibious Assault - Directly aft of theCrash Crane, A/S 32A-36 superstructure island
ISE - 6 ft tall Landing Signalman - Forward and to the right ofEnlisted, wearing an olive green the aircraftjacket with yellow vest
- Same as above, with dynamic - Forward and to the right ofArticulated LSE arms for directing V-22 to conet the aircraft
landing position on spot
- 5 Aircraft Towing Tractors, - Aft port edge of theYellow Gear A/S 32A-31 superstructure island, starboard
of the safe parking line
Stern Wake - White water aft of the ship - Directly aft of the ship
- 3 CH-53E aircraft, parked, noses - Directly aft of crash craneParked Aircraft inboard, side by side in folded
configuration
Ship Motion - Algorithm driven by 8 ft wavesat 450 relative to ship centerline N/A
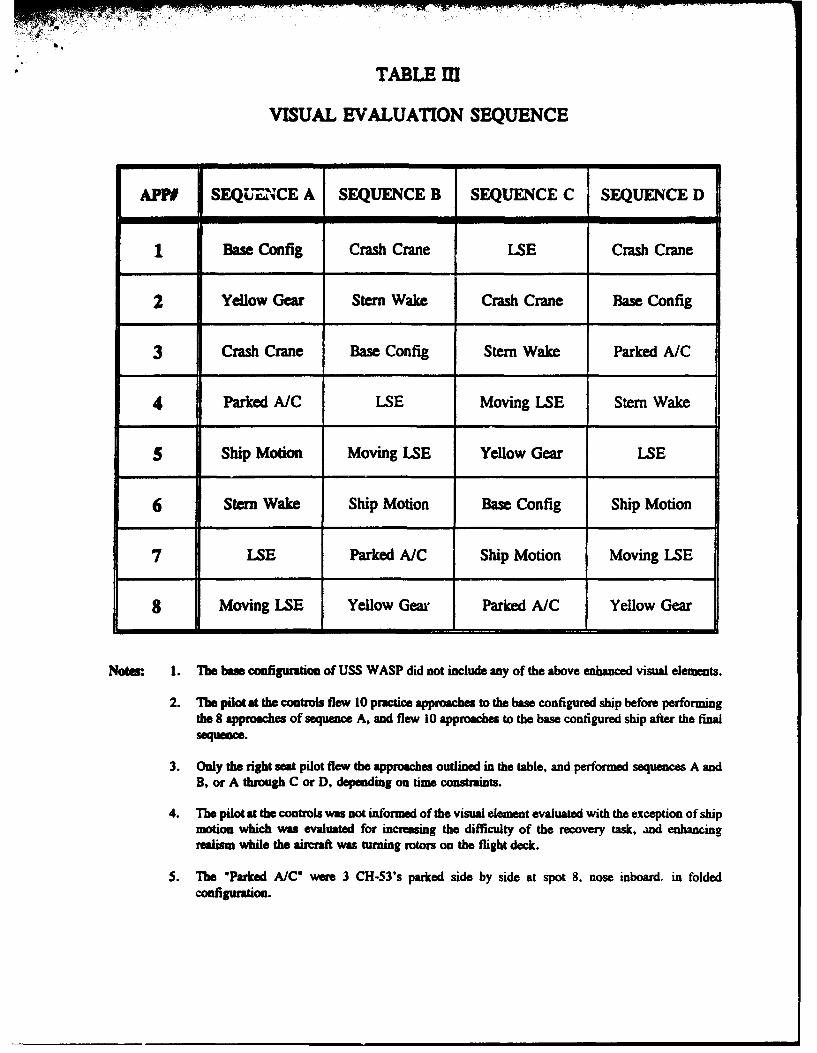
S TABLE III
VISUAL EVALUATION SEQUENCE
APPF SEQU.XCE A SEQUENCE B SEQUENCE C SEQUENCE D
1 Base Config Crash Crane LSE Crash Crane
2 Yellow Gear Stem Wake Crash Crane Base Config
3 Crash Crane Base Config Stern Wake Parked A/C
4 Parked A/C LSE Moving LSE Stem Wake
5 Ship Motion Moving LSE Yellow Gear LSE
6 Stern Wake Ship Motion Base Config Ship Motion
7 LSE Parked A/C Ship Motion Moving LSE
8 Moving LSE Yellow Gear Parked A/C Yellow Gear
Nots. 1. The base configuration of USS WASP did not include any of the above enhanced visual elements.
2. The pilot at the controls flew 10 practice approaches to the base configured ship before performingthe 8 approaches of sequence A, and flew 10 approaches to the base configured ship after the finalsequence.
3. Only the right seat pilot flew the approaches outlined in the table, and performed sequences A andB, or A through C or D, depending on time constraints.
4. The pilot at the controls was not informed of the visual element evaluated with the exception of shipmotion which was evaluated for increasing the difficulty of the recovery task, and enhancingrealism while the aircraft was turning rotors on the flight deck.
5. The Parked A/C" were 3 CH-53's parked side by side at spot 8, nose inboard, in foldedconfiguration.
Motion svstem
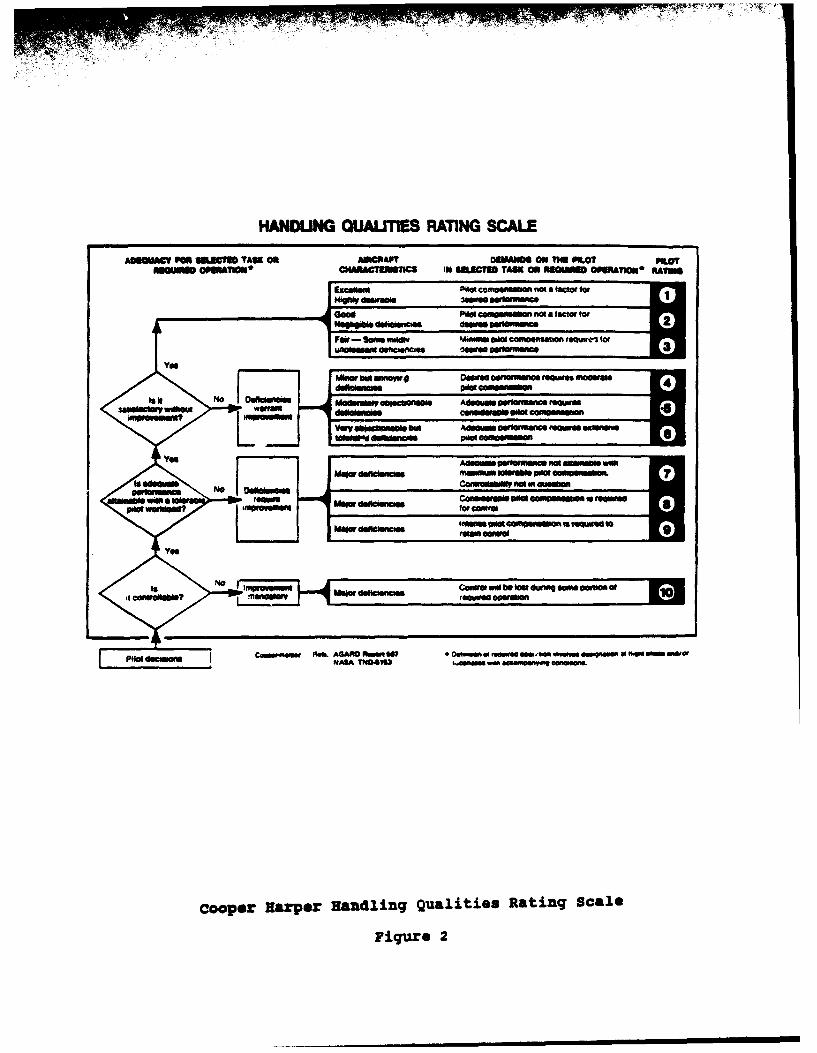
The motion system evaluation followed the general procedure,initializing in a port delta pattern and shooting repeatedapproaches to the ship. The motion base was instrumented to verifythe pilots' qualitative evaluations, where Cooper-Harper handlingqualities ratings (HQR's) were assigned to the hover task. Figure2 illustrates the HQR scale. Two things are worth mentioning here.The copilot's job is to call out airspeeds and altitudes throughoutthe evolution, not to close his eyes and comment on the movement ofthe motion platform. The second thing is to avoid suggestingcertain hypotheses during preflight briefings. These suggestionscan sometimes lead to self-fulfilling prophesies.
Sh12 AirvakeiTurbulence
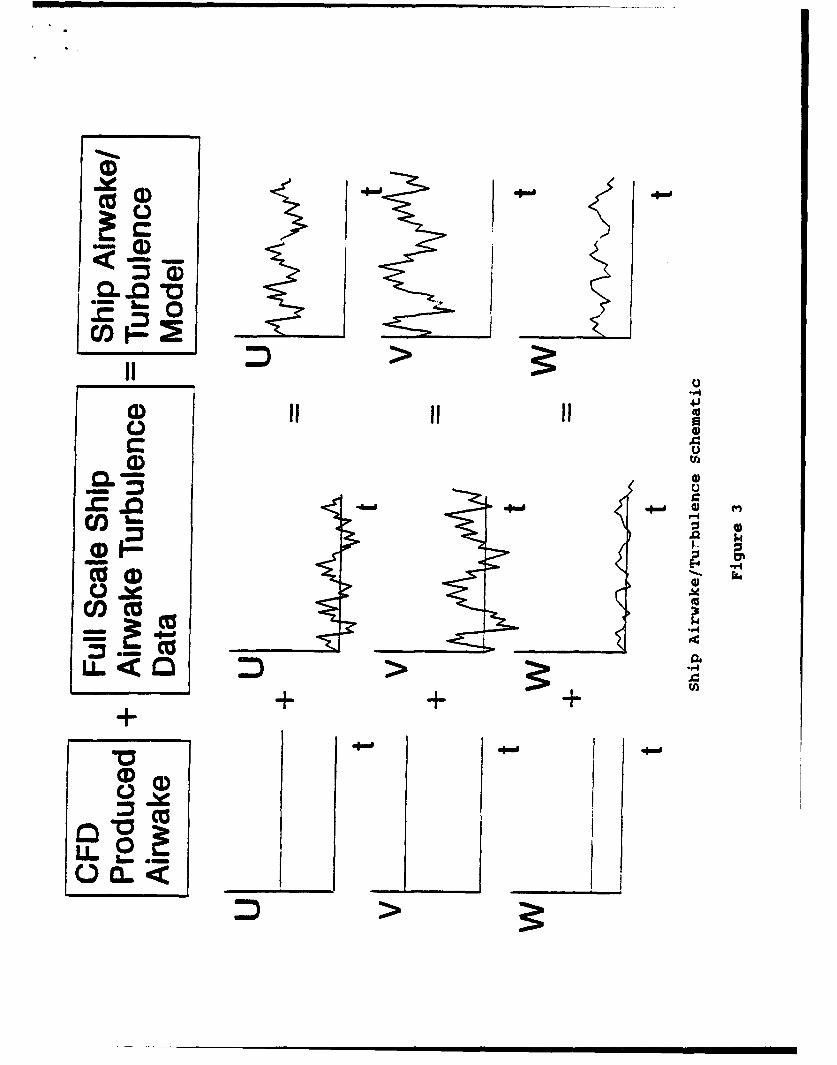
The ship airwake/turbulence model evaluation followed the generalprocedure, initializing in the 180 deg position of a port deltapattern and shooting repeated approaches to the ship. Theevaluation was divided into two phases. Phase one assessed theeffect of the steady stal airwake, and the second phase assessedthe realism of the turbulence model superimposed on the airwakemodel. The relative (CFD produced) "ship airwake" wind-over-deck(050 deg relative to the ship centerline at 15 kt) was evaluatedwhile handling qualities ratings were assigned to the task. Theship airwake model produced a steady state flow that varied withdeck location, and did not contain a turbulent component. Theturbulence model was vectorially added to the steady state airwakeflow velocities and was evaluated with atmospheric turbulenceratings in addition to HQR's at mild, moderate, and severeturbulence levels. Since the ship was not making headway throughthe sea, the true wind and wind-over-deck was constant on approach.The turbulence level did not vary spatially. A schematicrepresentation of the ship airwake/turbulence models is presentedin figure 3. The evaluation was performed with motion disabled toreduce any coupling effects.
General Evaluation
The general evaluation followed the general procedure, initializingin the 180 deg position of a port delta pattern and shootingrepeated approaches to the ship. Each pilot involved performedfour approaches to the ship with all visual elements incorporatedin addition to the motion system enabled, the shipairwake/turbulence model running, and ship motion running. Theintent of this specific evaluation was to evaluate the MFS motionbase with all systems enabled to assess the overall fidelity of thesimulation during shipboard operational tasks. Minor annoyances insome subsystems do not manifest themselves with all systemsoperating. The exact visual elements employed during this phase ofthe evaluation and their corresponding locations are presented intable II. This was the only phase of the evaluation where all ofthe visual elements were displayed simultaneously.
HANDLING QUALITES RATING SCALE
AOBGUACY -M 9ujmau TAU oil ANIMCRAP Dmaum$ ON me PILOT PILOT11010n OeMAuau CHAsCUmNSCS IN SasCis TASK on nmour o §ATWU* RATM
Exce~om aft cofmnmbo~n~ not a factor for
Fewr- Scam IMiii, 'A~mmatO Cif a o~fl5fmao rtaxwrel for
Mino &Ag minw* Domwe o.erfomane nea'- modeatem0Isle NO OO"Ctwnmm do~uMp 0sa W01
sammemiumW mistm~ dsmm IiAdsom~em, w a i n~mb i
Yal AOaUeNSO -m 1-9 10 auea"
Ccaamm omvo*MW nos m usmmn' eise
P" welfiow? fr 0014ast
lwf~cmiwicaiai9qwe
conframsmts -0rl
Cooper Harper Handling Qualities Rating scale
Figure 2
.0
af) ccI J
U. < >
+)000
LJ 0)
.Q <.
Whan trying to solve a multivariable problem, a mathematician willvary one parameter while holding the others constant. This was theapproach applied to the simulator evaluation. The only systemsthat were running throughout all phases of the evaluation were theaural system and the visual system. False or inaccurate motioncues would color the pilots evaluation of the turbulence model forexample. Preflight briefings emphasized pilot focus on aparticular facet of the simulation in an attempt to reduce theinfluence of other variables. It is impossible to completelyseparate the various systems influences on the pilot, so theprocedures attempted to isolate the system to be evaluated.Additional items influenced the pilots, from field of viewdifferences from the actual aircraft to task saturation.
Visual System
Each individual visual element may or may not contribute to thepilot's spatial cueing environment. The particular element may notbe consciously noticed by the pilot, but still used for peripheralcues. The only way to establish the connection between theparticular element (LSE for instance) and improved spatial cueingis to conduct many runs with and without the element randomly andevaluate certain parameters from a statistical standpoint. Eachvisual element analysis method will be addressed with the exceptionof the crash crane and parked aircraft, which were both beyond thepilot's field of regard in hover and did not improve their cueingenvironment. The overall visual system assessment was evaluatedthrough a detailed post-flight questionnaire. Issues that wereaddressed were contrast, clarity, realism, field of view, andenhancing characteristics in addition to specific questions aboutthe quality of the enhanced visual elements.
LON
The purpose of the LSE is to direct the pilot to the desired deckspot using visual signals. His signals ate advisory in nature,with the exception of waveoff and hold, which are mandatory. Doesthis six foot "object" on the flight deck improve the pilot'sheight cues? In order to find out, ten approaches were flown tothe flight deck with the LSE static (no arm waving) and without theLSE. Standard deviation of the hover altitude was compared withand without the static LSE, and the data indicated littledifference between the two. The pilots comments suggested that thevisual model of the LSE appeared two-dimensional and providedlittle height cues.
Ten approaches were flown to the ship with and without thearticulated LSE present. The pilots were briefed to hold a 15 ftprecision hover over the spot using the articulated LSE forassistance in aircraft position. Landing accuracy should have beenimproved with the articulated LSE present. XY coordinate data wasgathered indicating landing position of the nosewheel relative to
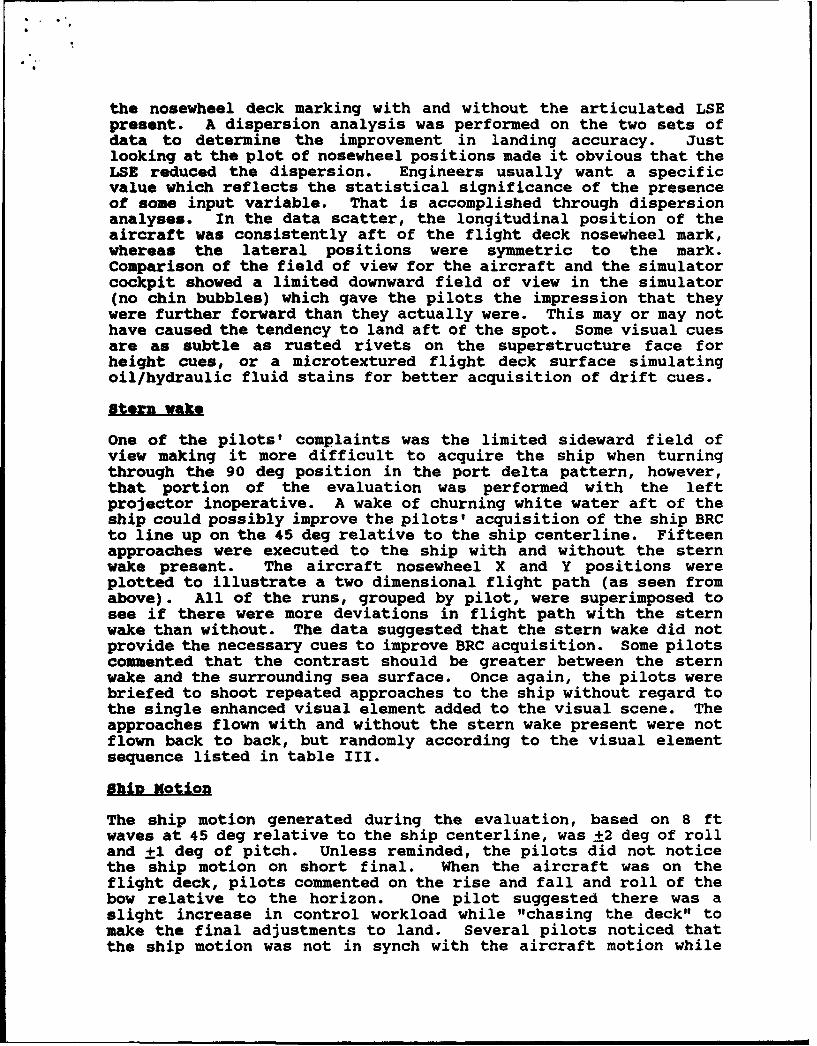
the nosewheel deck marking with and without the articulated LSEpresent. A dispersion analysis was performed on the two sets ofdata to determine the improvement in landing accuracy. Justlooking at the plot of nosewheel positions made it obvious that theLSE reduced the dispersion. Engineers usually want a specificvalue which reflects the statistical significance of the presenceof some input variable. That is accomplished through dispersionanalyses. In the data scatter, the longitudinal position of theaircraft was consistently aft of the flight deck nosewheel mark,whereas the lateral positions were symmetric to the mark.Comparison of the field of view for the aircraft and the simulatorcockpit showed a limited downward field of view in the simulator(no chin bubbles) which gave the pilots the impression that theywere further forward than they actually were. This may or may nothave caused the tendency to land aft of the spot. Some visual cuesare as subtle as rusted rivets on the superstructure face forheight cues, or a microtextured flight deck surface simulatingoil/hydraulic fluid stains for better acquisition of drift cues.
One of the pilots' complaints was the limited sideward field ofview making it more difficult to acquire the ship when turningthrough the 90 deg position in the port delta pattern, however,that portion of the evaluation was performed with the leftprojector inoperative. A wake of churning white water aft of theship could possibly improve the pilots' acquisition of the ship BRCto line up on the 45 deg relative to the ship centerline. Fifteenapproaches were executed to the ship with and without the sternwake present. The aircraft nosewheel X and Y positions wereplotted to illustrate a two dimensional flight path (as seen fromabove). All of the runs, grouped by pilot, were superimposed tosee if there were more deviations in flight path with the sternwake than without. The data suggested that the stern wake did notprovide the necessary cues to improve BRC acquisition. Some pilotscommented that the contrast should be greater between the sternwake and the surrounding sea surface. Once again, the pilots werebriefed to shoot repeated approaches to the ship without regard tothe single enhanced visual element added to the visual scene. Theapproaches flown with and without the stern wake present were notflown back to back, but randomly according to the visual elementsequence listed in table III.
ship Motion
The ship motion generated during the evaluation, based on 8 ftwaves at 45 deg relative to the ship centerline, was +2 deg of rolland +1 deg of pitch. Unless reminded, the pilots did not noticethe ship motion on short final. When the aircraft was on theflight deck, pilots commented on the rise and fall and roll of thebow relative to the horizon. One pilot suggested there was aslight increase in control workload while "chasing the deck" tomake the final adjustments to land. Several pilots noticed thatthe ship motion was not in synch with the aircraft motion while
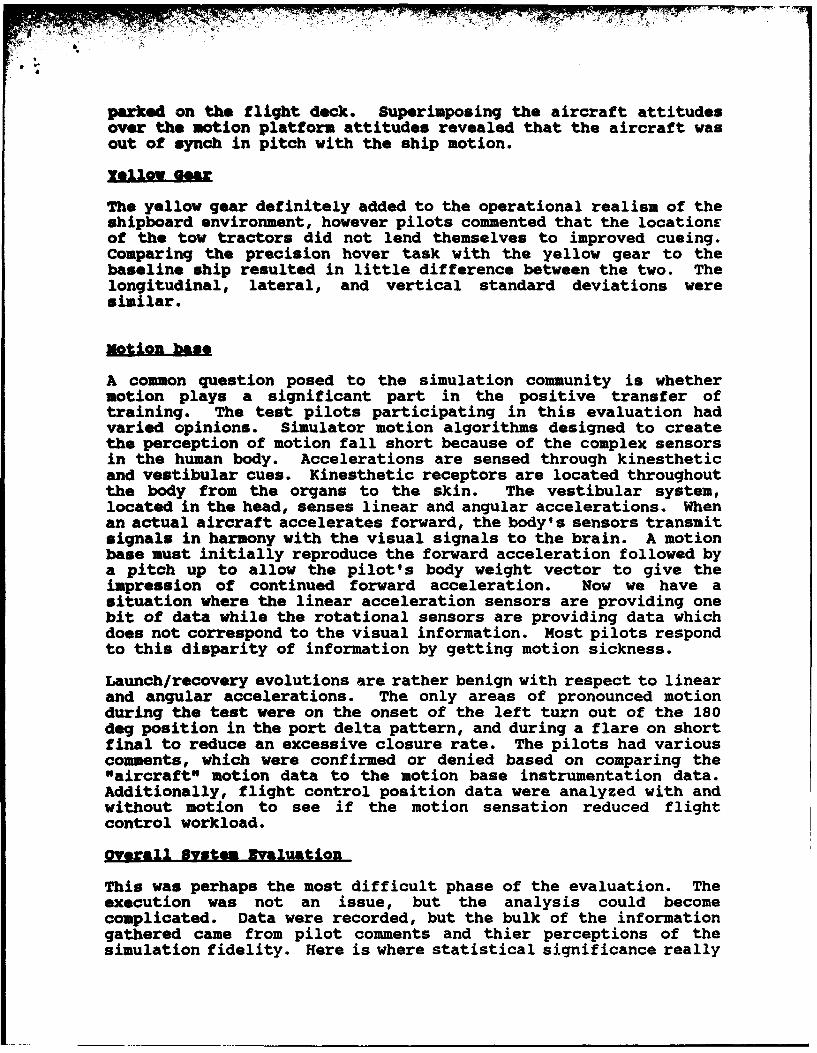
parked on the flight deck. Superimposing the aircraft attitudesover the motion platform attitudes revealed that the aircraft wasout of synch in pitch with the ship motion.
The yellow gear definitely added to the operational realism of theshipboard environment, however pilots commented that the locationEof the tow tractors did not lend themselves to improved cueing.Comparing the precision hover task with the yellow gear to thebaseline ship resulted in little difference between the two. Thelongitudinal, lateral, and vertical standard deviations weresimilar.
Iotion base
A common question posed to the simulation community is whethermotion plays a significant part in the positive transfer oftraining. The test pilots participating in this evaluation hadvaried opinions. Simulator motion algorithms designed to createthe perception of motion fall short because of the complex sensorsin the human body. Accelerations are sensed through kinestheticand vestibular cues. Kinesthetic receptors are located throughoutthe body from the organs to the skin. The vestibular system,located in the head, senses linear and angular accelerations. Whenan actual aircraft accelerates forward, the body's sensors transmitsignals in harmony with the visual signals to the brain. A motionbase must initially reproduce the forward acceleration followed bya pitch up to allow the pilot's body weight vector to give theimpression of continued forward acceleration. Now we have asituation where the linear acceleration sensors are providing onebit of data while the rotational sensors are providing data whichdoes not correspond to the visual information. Most pilots respondto this disparity of information by getting motion sickness.
Launch/recovery evolutions are rather benign with respect to linearand angular accelerations. The only areas of pronounced motionduring the test were on the onset of the left turn out of the 180deg position in the port delta pattern, and during a flare on shortfinal to reduce an excessive closure rate. The pilots had variouscomments, which were confirmed or denied based on comparing the"aircraft" motion data to the motion base instrumentation data.Additionally, flight control position data were analyzed with andwithout motion to see if the motion sensation reduced flightcontrol workload.
overall System Bvaluation
This was perhaps the most difficult phase of the evaluation. Theexecution was not an issue, but the analysis could becomecomplicated. Data were recorded, but the bulk of the informationgathered came from pilot comments and thier perceptions of thesimulation fidelity. Here is where statistical significance really
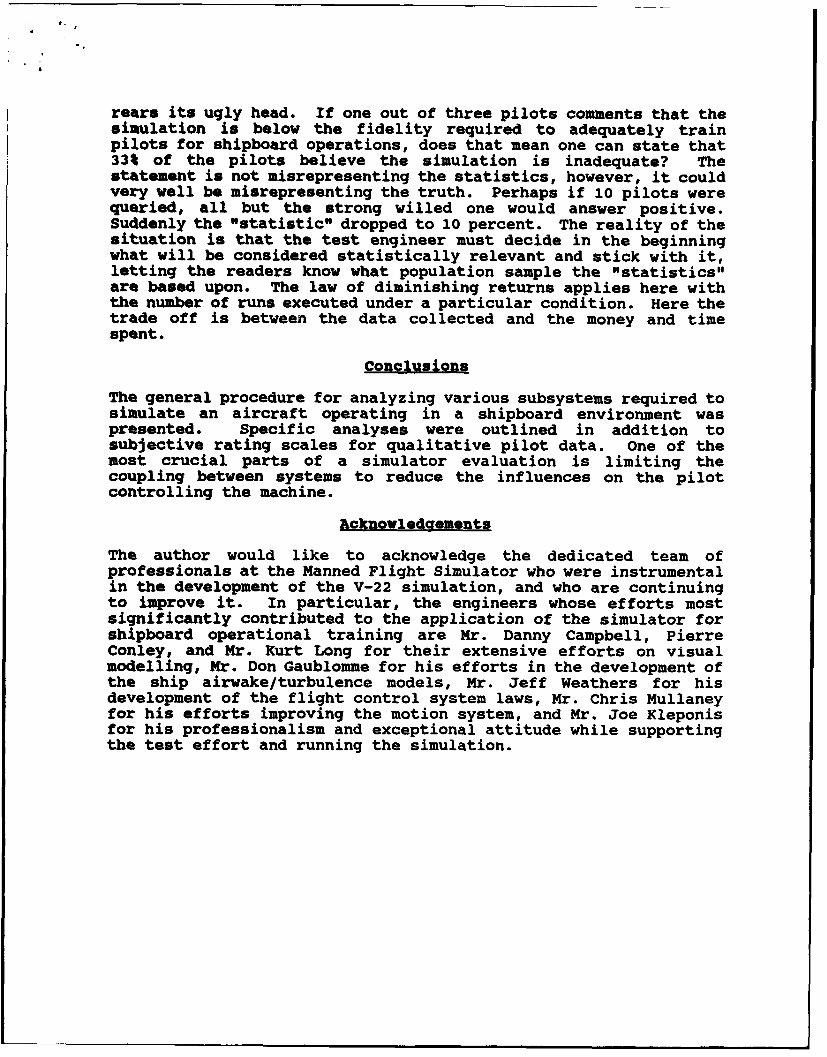
rears its ugly head. If one out of three pilots comments that thesimulation is below the fidelity required to adequately trainpilots for shipboard operations, does that mean one can state that33% of the pilots believe the simulation is inadequate? Thestatement is not misrepresenting the statistics, however, it couldvery well be misrepresenting the truth. Perhaps if 10 pilots werequeried, all but the strong willed one would answer positive.Suddenly the "statistic" dropped to 10 percent. The reality of thesituation is that the test engineer must decide in the beginningwhat will be considered statistically relevant and stick with it,letting the readers know what population sample the "statistics"are based upon. The law of diminishing returns applies here withthe number of runs executed under a particular condition. Here thetrade of f is between the data collected and the money and timespent.
Conclusions
The general procedure for analyzing various subsystems required tosimulate an aircraft operating in a shipboard environment waspresented. Specific analyses were outlined in addition tosubjective rating scales for qualitative pilot data. One of themost crucial parts of a simulator evaluation is limiting thecoupling between systems to reduce the influences on the pilotcontrolling the machine.
Acknowledgements
The author would like to acknowledge the dedicated team ofprofessionals at the Manned Flight Simulator who were instrumentalin the development of the V-22 simulation, and who are continuingto improve it. In particular, the engineers whose efforts mostsignificantly contributed to the application of the simulator forshipboard operational training are Mr. Danny Campbell, PierreConley, and Mr. Kurt Long for their extensive efforts on visualmodelling, Mr. Don Gaublomme for his efforts in the development ofthe ship airwake/turbulence models, Mr. Jeff Weathers for hisdevelopment of the flight control system laws, Mr. Chris Mullaneyfor his efforts improving the motion system, and Mr. Joe Kleponisfor his professionalism and exceptional attitude while supportingthe test effort and running the simulation.
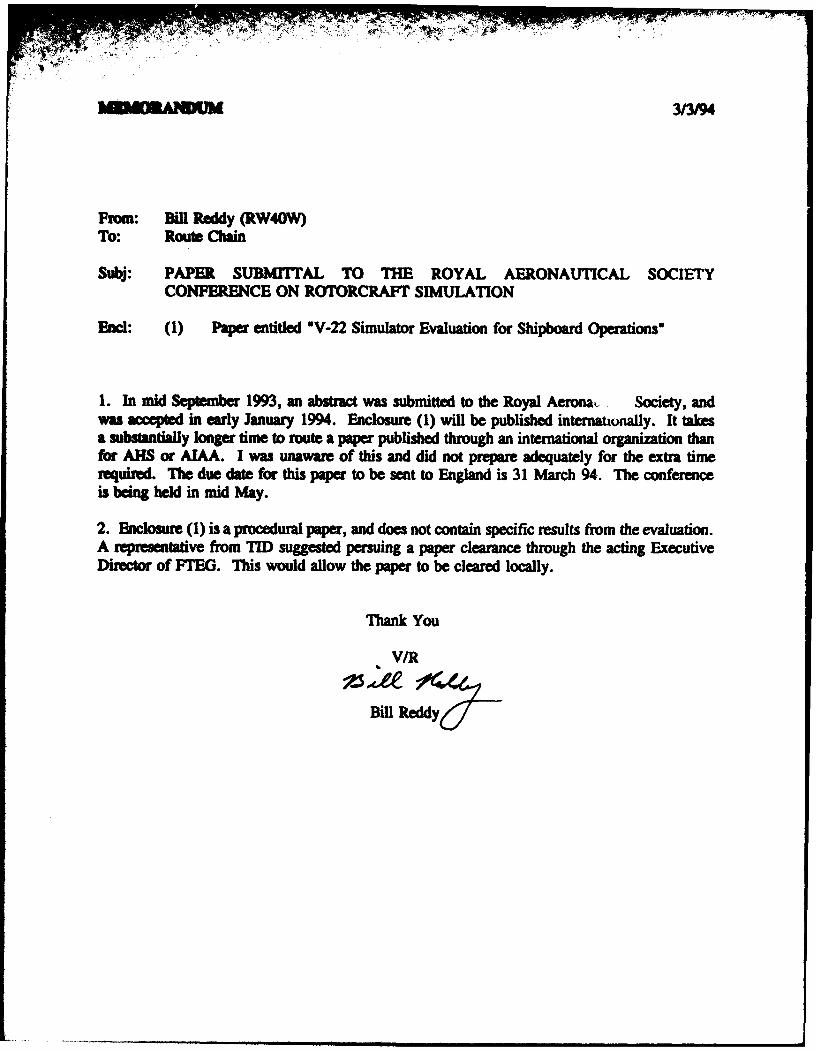
From: Bill Reddy (RW40W)To: Route Chain
Subj: PAPER SUBMITTAL TO THE ROYAL AERONAUTICAL SOCIETYCONFERENCE ON ROTORCRAFT SIMULATION
End: (1) Paper entitled *V-22 Simulator Evaluation for Shipboard Operations"
I. In mid September 1993, an abstract was submitted to the Royal AeronaL Society, andwas accepted in early January 1994. Enclosure (1) will be published internauunally. It takesa substantially longer time to route a paper published through an international organization thanfor AI.S or AIAA. I was unaware of this and did not prepare adequately for the extra timerequired. The due date for this paper to be sent to England is 31 March 94. The conferenceis being held in mid May.
2. Enclosure (1) is a procedural paper, and does not contain specific results from the evaluation.A representative from TID suggested persuing a paper clearance through the acting ExecutiveDirector of FTEG. This would allow the paper to be cleared locally.
Thank You
V/R
Bill Reddy%


![[ RODDY BRETT ]](https://img.pdfslide.net/doc/110x75/58a2bf3d1a28abaa338b4e40/-roddy-brett-.jpg)