Embed Size (px)
Citation preview

UPDATED 21 MAY 2020 NYSE:NREF
1Q 2020 FINANCIAL SUPPLEMENT
EXHIBIT 99.2

2
CAUTIONARY STATEMENTS
FORWARD LOOKING STATEMENTSThis presentation includes forward-looking statements. These statements reflect the current views of the Company’s management with respect to futureevents and financial performance. These statements include forward-looking statements within the meaning of the Private Securities Litigation Reform Act of1995 with respect to the Company’s business and industry in general and guidance for financial results for the second quarter of 2020. Statements that includethe words “expect,” “intend,” “estimate,” “may,” “should,” “anticipate” and similar statements of a future or forward-looking nature identify forward-lookingstatements for purposes of the federal securities laws or otherwise. Forward-looking statements address matters that involve risks and uncertainties.Accordingly, there are or will be important factors that could cause the Company’s actual results to differ materially from those indicated in these statements,including the ultimate geographic spread, duration and severity of the coronavirus (COVID-19) outbreak, and the effectiveness of actions taken, or actions thatmay be taken, by governmental authorities to contain the outbreak or treat its impact, as well as the factors described under “Risk Factors” in our RegistrationStatement on Form S-11 filed with the SEC. The statements made herein speak only as of the date of this presentation, and the Company does not undertaketo update this information except as required by law. Past performance does not guarantee future results. Performance during time periods shown is limitedand may not reflect the performance in different economic and market cycles. There can be no assurance that similar performance will be experienced.
NON-GAAP FINANCIAL MEASURESThis presentation contains non-GAAP financial measures. A “non-GAAP financial measure” is defined as a numerical measure of a company’s financial performance that excludes or includes amounts so as to be different than the most directly comparable measure calculated and presented in accordance with GAAP in the statements of income, balance sheets or statements of cash flows of the Company. The non-GAAP financial measure used within this presentation is core earnings. Core earnings is defined as the net income (loss) attributable to our common stockholders computed in accordance with GAAP, including realized gains and losses not otherwise included in net income (loss), excluding any unrealized gains or losses or other similar non-cash items that are included in net income (loss) for the applicable reporting period, regardless of whether such items are included in other comprehensive income (loss), or in net income (loss) and adding back amortization of stock-based compensation. We use core earnings to evaluate our performance which excludes the effects of certain GAAP adjustments and transactions that we believe are not indicative of our current operations and loan performance. We believe providing core earnings as a supplement to GAAP net income (loss) to our investors is helpful to their assessment of our performance. We also use core earnings as a component of the management fee paid to NREA. Core earnings should not be considered as an alternative or substitute to net income (loss). Our computation of core earnings may not be comparable to core earnings reported by other REITs.
ADDITIONAL INFORMATIONFor additional information, see our filings with the SEC. Our filings with the SEC are available on our website, www.nexpointfinance.com, under the "InvestorRelations" tab.

3
NEXPOINT REAL ESTATE FINANCE
NexPoint Real Estate Finance is a publicly traded mortgage REIT (“mREIT”), with its shares listedon the New York Stock Exchange under the symbol “NREF”. The company primarily concentrateson investments in real estate sectors where its senior management team has operatingexpertise, including in the multifamily, single-family rental (”SFR”), and self-storage,predominantly in the top 50 metropolitan statistical areas. The company focuses on lending orinvesting in properties that are stabilized or have a “light-transitional” business plan.
NREF is externally managed by NexPoint Real Estate Advisors VII, L.P. (“NREA”), an affiliate ofNexPoint Advisors, L.P., an SEC-registered investment advisor with extensive real estate andfixed income experience.
COMPANY OVERVIEW
(1) BASED ON MARCH 31, 2020 BOOK VALUE INCLUDING REDEEMABLE NCI IN THE OPERATING PARTNERSHIP AS REPORTED BY THE COMPANY AND THE SHARE PRICE AS OF CLOSE OF TRADING MAY, 5, 2020(2) IMPLIED DIVIDEND YIELD IS CALCULATED USING THE ANNOUNCED 2Q DIVIDEND OF $0.40 PER COMMON SHARE, ANNUALIZED, DIVIDED BY THE SHARE PRICE AS OF CLOSE OF TRADING ON MAY 5, 2020(3) AS OF THE CLOSE OF TRADING MAY 5, 2020(4) TOTAL RETURN, INCLUDING DIVIDENDS, AS OF CLOSE OF TRADING MAY 5, 2020
8.2%INSIDER OWNERSHIP3
15.0%IMPLIED DIVIDEND YIELD2
39.8%DISCOUNT TO BOOK1
NREF TOTAL RETURN4
-90%
-80%
-70%
-60%
-50%
-40%
-30%
-20%
-10%
0%
10%
Feb-20 Mar-20 Apr-20

4
1Q 2020 HIGHLIGHTS
(1) SEE “RECONCILIATIONS” SLIDE(2) AS OF APRIL 30, 2020(3) LOAN TO VALUE IS GENERALLY BASED ON THE INITIAL LOAN AMOUNT DIVIDED BY THE AS –IS APPRAISED VALUE AS OF THE DATE THE LOAN WAS ORIGINATED OR BY THE CURRENT PRINCIPAL AMOUNT AS OF THE DATE OF THE MOST RECENT AS-IS
APPRAISED VALUE. FOR OUR CMBS B-PIECES, LTV IS BASED ON THE WEIGHTED AVERAGE LTV OF THE UNDERLYING LOAN POOL. (4) BASED ON ACTUAL COLLATERAL POSTED
• Net loss of $22.9MM, with net loss attributable to common stockholders of $6.4MM, or $(1.22) per diluted common share
• Core earnings of $1.2MM, or $0.23 per diluted common share1
• On March 9, 2020, the Board of Directors approved, and the company announced, a stock repurchase program of up to $10MM. As of May 5, 2020, NREF has repurchased 87,466 shares at an average price per share of $15.30 for a total of $1.3MM.
• Book value of $316.5MM or $17.72 per common share including redeemable non-controlling interests in the Operating Partnership
• Paid a pro-rated 1Q 2020 dividend of $0.2198 per common share• Announced 2Q 2020 dividend of $0.40 per common share to be paid on June 30, 2020
FINANCIAL
• Outstanding total portfolio of $1.1B, comprised of 37 investments2
• SFR and multifamily represent 96.5% of our portfolio, with the remainder being self-storage• Weighted average loan to value (“LTV”)3 and debt service coverage ratio (“DSCR”) on our SFR, CMBS, preferred and mezz
investments are 64.5% and 1.78x• As of May 21, 2020, we have received no forbearance requests in our CMBS B-Piece portfolio. There have been 8
forbearance requests approved in our SFR loan book representing 3.89% of NREF’s consolidated unpaid principal balance outstanding.
• On April 15, 2020, purchased $6.3MM of FHMS X3s at a 75% discount with a current yield of 12.0%• On April 23, 2020, purchased a fixed rate Freddie Mac K-Series B-Piece with a 10.75% bond equivalent yield (BEY), 3.55%
weighted average coupon (WAC) and a current yield of 6.10%.
PORTFOLIO
• Debt to book value ratio of 2.49x• Secured credit facility, matched in structure and duration of the underlying SFR loans, with a weighted average remaining
term of 8.1 years• As of May 5, 2020, outstanding repo financing of $49.8MM, which equates to 40.5% advance rate on our CMBS B-Piece
portfolio4
CAPITALIZATION
$s IN 0,000s EXCEPT PER SHARE DATA OR AS OTHERWISE INDICATED
5
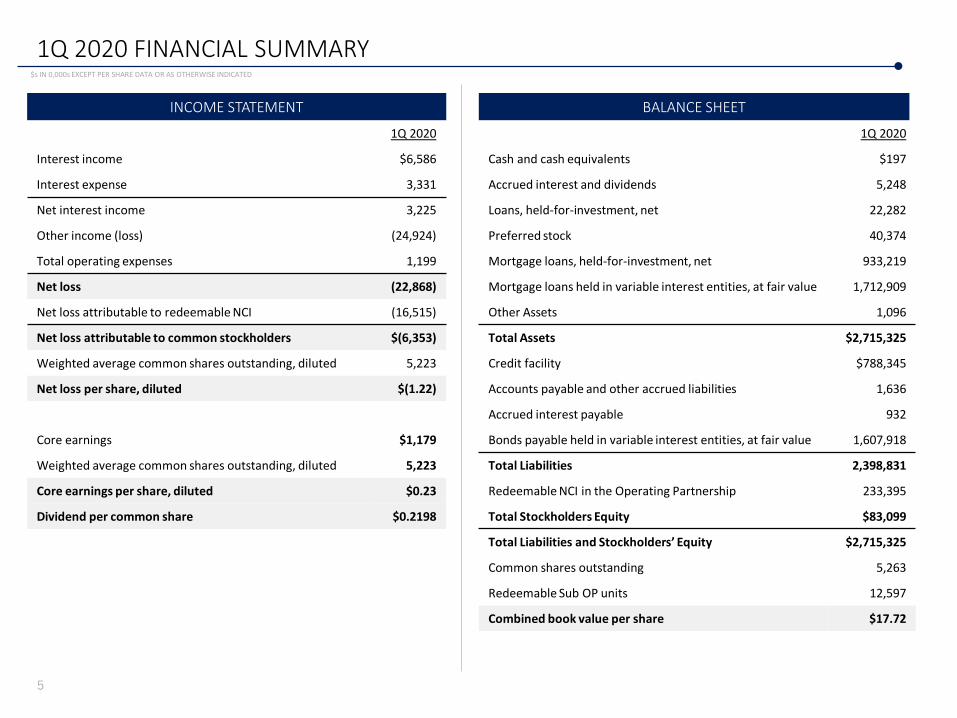
1Q 2020 FINANCIAL SUMMARY
BALANCE SHEETINCOME STATEMENT
1Q 2020
Interest income $6,586
Interest expense 3,331
Net interest income 3,225
Other income (loss) (24,924)
Total operating expenses 1,199
Net loss (22,868)
Net loss attributable to redeemable NCI (16,515)
Net loss attributable to common stockholders $(6,353)
Weighted average common shares outstanding, diluted 5,223
Net loss per share, diluted $(1.22)
Core earnings $1,179
Weighted average common shares outstanding, diluted 5,223
Core earnings per share, diluted $0.23
Dividend per common share $0.2198
1Q 2020
Cash and cash equivalents $197
Accrued interest and dividends 5,248
Loans, held-for-investment, net 22,282
Preferred stock 40,374
Mortgage loans, held-for-investment, net 933,219
Mortgage loans held in variable interest entities, at fair value 1,712,909
Other Assets 1,096
Total Assets $2,715,325
Credit facility $788,345
Accounts payable and other accrued liabilities 1,636
Accrued interest payable 932
Bonds payable held in variable interest entities, at fair value 1,607,918
Total Liabilities 2,398,831
Redeemable NCI in the Operating Partnership 233,395
Total Stockholders Equity $83,099
Total Liabilities and Stockholders’ Equity $2,715,325
Common shares outstanding 5,263
Redeemable Sub OP units 12,597
Combined book value per share $17.72
$s IN 0,000s EXCEPT PER SHARE DATA OR AS OTHERWISE INDICATED

6
$19.16 $17.72
4Q 2019 1Q 2020
BOOK VALUE PER SHARE
1Q 2020 FINANCIAL SNAPSHOT
• Net loss of $22.9MM, with net loss attributable to common stockholders of $6.4MM, or $(1.22) per diluted common share
• Core earnings of $1.2MM, or $0.23 per diluted common share• BV per common share including redeemable NCI in the Operating Partnership decreased 7.52% to
$17.72/share, from $19.161 at IPO• $25.2MM net unrealized loss due to mark-to-market movement in the CMBS B-Piece portfolio
EARNINGS AND BOOK VALUE
(1) NET OF OFFERING COSTS OF $2.9MM, OR $0.16 PER SHARE(2) NET INCOME ATTRIBUTABLE TO COMMON STOCKHOLDERS IN 2Q2020 IS ESTIMATED TO BE $2.1MM AT THE MID-POINT. SEE “RECONCILIATIONS”
SLIDES.
• 1Q pro-rated dividend of $0.2198/common share was paid March 31, 2020• 1Q 2020 core earnings per diluted common share was $0.23
• 1Q core earnings dividend coverage ratio was 1.05x
• 2Q 2020 core earnings per diluted common share is projected to be $0.40 at the mid-point2
• 2Q 2020 dividend per common share of $0.40 to be paid on June 30, 2020• Estimated 2Q core earnings dividend coverage ratio is 1.0x
DIVIDEND AND CORE EARNINGS COVERAGE
$s IN 0,000s EXCEPT PER SHARE DATA OR AS OTHERWISE INDICATED
$0.23
$0.40
$0.22
$0.40
1Q 2020 2Q 2020
Core Earnings/Share Dividend/Share

7
PORTFOLIO COMMENTARY
The current portfolio consists of senior loans, mezzanine debt, preferred equity and preferred stock investments in short-duration lease-term assets (multifamily,SFR, self-storage) that are geographically diverse in the United States. The portfolio has no exposure to construction loans, heavy transitional loans, land loans orfor sale loans. As of May 5, 2020, we have received zero forbearance requests in our CMBS B-Piece and SFR portfolios.
• MULTIFAMILY: Historically low losses for Freddie Mac debt issuances secured by multifamily assets, including periods of market stress• Annual defaults have breached 1.0% of loans outstanding only three times since 19941
• Aggregate losses in Freddie Mac’s origination history have averaged 5 bps per year dating back to 19941
• Since 2009 and through February 2020, there have been $18.8MM in losses on $357.5B of combined issuance2
• Freddie Mac forbearance program helps mitigate potential cash flow interruptions to the bondholders, as principal and interests during forbearanceperiod is paid by Freddie Mac
• SINGLE-FAMILY RENTAL: Although this is a relatively new asset class that was institutionalized in the wake of the global financial crisis, we believe SFR willexhibit resiliency akin to multifamily
• Current portfolio of loans is capitalized by a secured credit facility with Freddie Mac, is matched in both duration and structure of the underlyingloans, has 8.1 years of average weighted term to maturity and a 250 bps interest rate spread3
• Subject to Freddie Mac forbearance program to help mitigate cash flow interruptions to the bondholders
• SELF-STORAGE: Limited human interaction and low costs should help the self-storage sector during current unprecedented times• Historically, self-storage has outperformed other real estate asset types during economic downturns
DEFENSIVE PORTFOLIO CHARACTERISTICS
(1) FREDDIE MAC; 2018(2) FREDDIE MAC; FEBRUARY 2020(3) AS OF MARCH 31, 2020 AND INCLUDING THE PURCHASE OF FREMF 2020-K107 (4) AS OF MARCH 31, 2020 AND INCLUDING THE TWO CMBS IO STRIPS, ONE CMBS B-PIECE PURCHASED APRIL 15, 2020 AND APRIL 23, 2020, RESPECTIVELY, AND EXCLUDING THE PREFERRED STOCK (JCAP SERIES A PREFERRED)
7.7YEARS AVERAGE REMAINING TERM4
64.5%WEIGHTED AVERAGE LOAN TO VALUE4
1.78xWEIGHTED AVERAGE DSCR4
99.7%OF PORTFOLIO STABILIZED4

8
PORTFOLIO COMMENTARY
(1) AS OF MARCH 31, 2020 AND INCLUDING THE TWO CMBS IO STRIPS, ONE CMBS B-PIECE PURCHASED APRIL 15, 2020 AND APRIL 23, 2020, RESPECTIVELY (2) AS A % OF OUTSTANDING PRINCIPAL AS OF MARCH 31, 2020 AND INCLUDING THE TWO CMBS IO STRIPS, ONE CMBS B-PIECE PURCHASED APRIL 15, 2020 AND APRIL 23, 2020, RESPECTIVELY, AND EXCLUDING THE PREFERRED STOCK (JCAP SERIES A
PREFERRED)
Single-Family Rental75.6%
Multifamily20.9%
Storage3.5%
• Diverse geographic exposure with the majority of the portfolio located in the Southeast and Southwest• Strategically focused on short-duration lease-term property types, with SFR and multifamily consisting of 75.6% and 20.9% of the portfolio, respectively1
• Majority of the portfolio invested in first mortgages and CMBS B-Pieces1
GEOGRAPHIC AND ASSET TYPE EXPOSURE
$1.1BCURRENT PRINCIPAL1
2
GA37%
FL22%
TX8%
4%
MN
LESS THAN 2.0% OF TOTAL
3%
AL
3%
AZ
2%
2%
NC
NJ
Senior Loans75.3%
CMBS19.2%
Preferred Stock3.5%
Preferred Equity1.6% Mezzanine
Loans0.3%
64.5%WEIGHTED AVG
LTV1

9
CAPITALIZATION$s IN 0,000s EXCEPT PER SHARE DATA
(1) AS OF APRIL 30, 2020. SEE “RECONCILIATIONS” SLIDES.(2) AS OF MARCH 31, 2020.(3) PAR VALUE OF CMBS PORTFOLIO AS OF APRIL 30, 2020
$49.8MMREPO FINANCING1
$788.3MMSENIOR CREDIT
FACILITY1
$838.1MTOTAL DEBT1 94.1%
OF TOTAL DEBT IS FIXED AND IS NOT SUBJECT TO MARK-TO-MARKET1
MOVEMENTS
5.9%OF TOTAL DEBT IS FLOATING AND IS SUBJECT
TO MARK-TO-MARKET1
2.65xDEBT TO BOOK VALUE OF EQUITY1
$83.1MMBOOK VALUE OF COMMON2
$233.4MMBOOK VALUE OF REDEEMABLE NONCONTROLLING INTERESTS
IN THE OPERATING PARTNERSHIP2
$316.5MTOTAL BOOK VALUE
OF EQUITY2
$49,835
$130.6MMIMPLIED EQUITY
VALUE IN CMBS PORTFOLIO
27.6%LTV1
$180.5MMPAR VALUE OF CMBS PORTFOLIO3
10
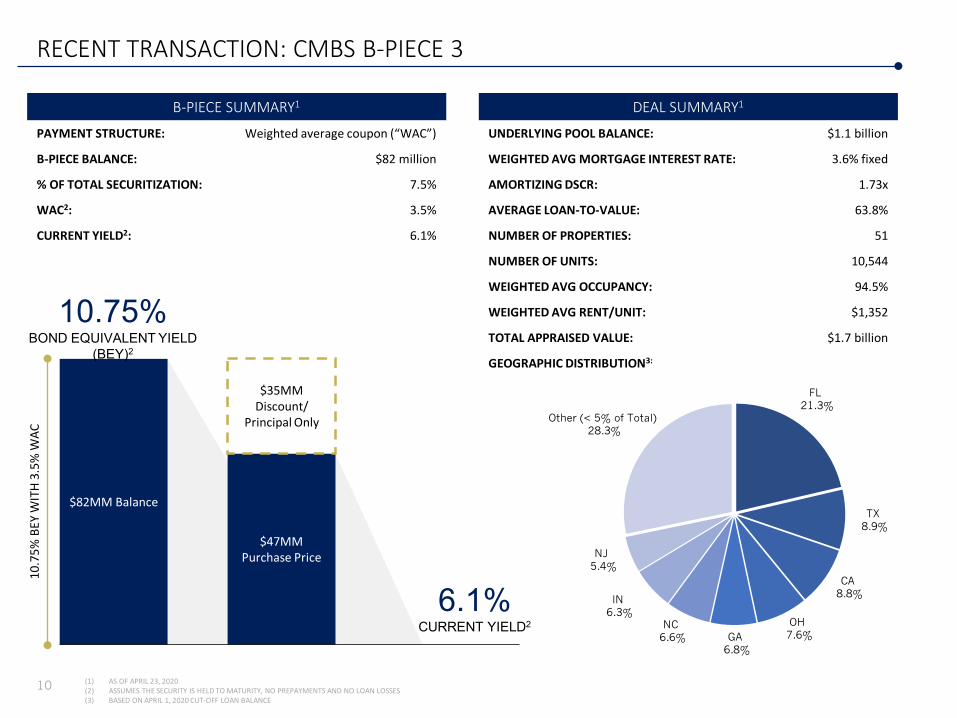
RECENT TRANSACTION: CMBS B-PIECE 3
DEAL SUMMARY1
UNDERLYING POOL BALANCE: $1.1 billion
WEIGHTED AVG MORTGAGE INTEREST RATE: 3.6% fixed
AMORTIZING DSCR: 1.73x
AVERAGE LOAN-TO-VALUE: 63.8%
NUMBER OF PROPERTIES: 51
NUMBER OF UNITS: 10,544
WEIGHTED AVG OCCUPANCY: 94.5%
WEIGHTED AVG RENT/UNIT: $1,352
TOTAL APPRAISED VALUE: $1.7 billion
GEOGRAPHIC DISTRIBUTION3:
(1) AS OF APRIL 23, 2020(2) ASSUMES THE SECURITY IS HELD TO MATURITY, NO PREPAYMENTS AND NO LOAN LOSSES(3) BASED ON APRIL 1, 2020 CUT-OFF LOAN BALANCE
B-PIECE SUMMARY1
PAYMENT STRUCTURE: Weighted average coupon (“WAC”)
B-PIECE BALANCE: $82 million
% OF TOTAL SECURITIZATION: 7.5%
WAC2: 3.5%
CURRENT YIELD2: 6.1%
FL21.3%
TX8.9%
CA8.8%
OH7.6% GA
6.8%
NC6.6%
IN6.3%
NJ5.4%
Other (< 5% of Total)28.3%
$47MM Purchase Price
$35MM Discount/
Principal Only
$82MM Balance
6.1%CURRENT YIELD2
10.7
5% B
EY W
ITH
3.5%
WAC
10.75%BOND EQUIVALENT YIELD
(BEY)2

11
APPENDICES
INTENTIONALLY LEFT BLANK

12
APPENDIX: PORTFOLIO
# Investment1 Location Property Type Investment Date Current Principal Net Equity2 Coupon3 Remaining Term4 Loan to Value DSCR
1 Senior Loan Various SFR 2/11/2020 $508.700 $85,754 4.65% 8.43 68.1%
2 Senior Loan Various SFR 2/11/2020 10,688 1,722 5.35% 7.84 72.5%
3 Senior Loan Various SFR 2/11/2020 5,633 908 5.33% 3.34 67.2%
4 Senior Loan Various SFR 2/11/2020 10,627 1,782 5.30% 8.43 70.3%
5 Senior Loan Various SFR 2/11/2020 7,647 1,283 5.08% 8.26 56.8%
6 Senior Loan Various SFR 2/11/2020 5,699 963 5.24% 8.51 57.6%
7 Senior Loan Various SFR 2/11/2020 12,373 2,085 5.54% 8.51 67.3%
8 Senior Loan Various SFR 2/11/2020 6,597 1,065 5.79% 3.42 57.7%
9 Senior Loan Various SFR 2/11/2020 8,308 1,421 5.85% 8.59 72.2%
10 Senior Loan Various SFR 2/11/2020 51,362 8,489 4.74% 5.51 54.2%
11 Senior Loan Various SFR 2/11/2020 9,875 1,684 6.10% 8.51 74.3%
12 Senior Loan Various SFR 2/11/2020 38,516 6,622 5.55% 8.59 73.5%
13 Senior Loan Various SFR 2/11/2020 6,399 1,095 5.47% 8.59 73.7%
14 Senior Loan Various SFR 2/11/2020 15,300 2,486 5.46% 3.59 55.8%
15 Senior Loan Various SFR 2/11/2020 5,760 981 5.99% 8.68 70.0%
16 Senior Loan Various SFR 2/11/2020 10,283 1,763 5.72% 8.68 65.9%
17 Senior Loan Various SFR 2/11/2020 10,704 1,837 5.60% 8.68 73.8%
18 Senior Loan Various SFR 2/11/2020 5,392 908 5.46% 8.76 73.9%
19 Senior Loan Various SFR 2/11/2020 9,284 1,568 5.88% 8.76 56.8%
20 Senior Loan Various SFR 2/11/2020 6,727 1,082 4.83% 3.84 68.9%
21 Senior Loan Various SFR 2/11/2020 4,736 789 5.35% 8.85 74.0%
22 Senior Loan Various SFR 2/11/2020 17,382 2,975 5.61% 8.85 65.0%
23 Senior Loan Various SFR 2/11/2020 7,797 1,304 5.34% 8.85 73.9%
24 Senior Loan Various SFR 2/11/2020 7,922 1,354 5.47% 8.85 56.6%
25 Senior Loan Various SFR 2/11/2020 6,851 1,141 5.46% 8.92 72.0%
26 Senior Loan Various SFR 2/11/2020 10,523 1,714 4.72% 5.92 63.2%
27 Senior Loan Various SFR 2/11/2020 62,023 10,311 4.95% 8.92 65.0%
Total SFR 863,109 145,086 4.91% 8.11 66.9%
$s IN 0,000s EXCEPT PER SHARE DATA
*SEE FOOTNOTES ON FOLLOWING PAGE

13
APPENDIX: PORTFOLIO
# Investment1 Location Property Type Investment Date Current Principal Net Equity2 Coupon3 Remaining Term4 Loan to Value DSCR
1 CMBS B-Piece Various Multifamily 2/11/2020 $75,5895 $34,460 6.99%6 5.91 65.4%
2 CMBS B-Piece Various Multifamily 2/11/2020 56,3965 21,741 6.99%6 6.66 64.9%
3 CMBS B-Piece Various Multifamily 4/23/2020 81,9995 46,885 3.55%7 9.9 63.8%
4 CMBS IO Strip Various Multifamily 4/15/2020 3,088 304 3.46% 16.8 65.2%
5 CMBS IO Strip Various Multifamily 4/15/2020 3,214 259 2.98% 17.7 66.6%
Total CMBS B-Piece 220,286 103,649 5.90% 7.5 64.8%
1 Mezzanine Charleston, SC Multifamily 2/11/2020 $3,250 $3,222 12.25%8 1.84 73.4%
1 Preferred Equity Jackson, MS Multifamily 2/11/2020 $5,056 $5,297 12.50% 7.67 75.6%
2 Preferred Equity Corpus Christi, TX Multifamily 2/11/2020 3,821 3,995 15.25% 2.34 57.0%
3 Preferred Equity Columbus, GA Multifamily 2/11/2020 10,000 9,768 11.50% 5.25 85.8%
Total Preferred Equity 18,877 19,060 12.53% 5.31 76.9%
1 Preferred Stock N/A Self-Storage 2/11/2020 $40,0009 $40,374 13.27% N/A N/A
Portfolio Total $1,145,522 $311,391 5.49% 7.7 64.5% 1.78x
$s IN 0,000s EXCEPT PER SHARE DATA
(1) OUR TOTAL PORTFOLIO REPRESENTS THE CURRENT PRINCIPAL AMOUNT OF THE CONSOLIDATED SFR LOANS, THE MEZZANINE LOAN, PREFERRED EQUITY, PREFFERED STOCK AS WELL AS THE NET EQUITY OF OUR CMBS B-PIECE INVESTMENTS.(2) NET EQUITY REPREESENTS THE CARRYING VALUE LESS BORROWRINGS.(3) THE WEIGHTED AVERAGE COUPON IS WEIGHTED ON THE CURRENT PRINCIPAL BALANCE.(4) THE WEIGHTED AVERAGE LIFE IS WEIGHTED ON THE CURRENT PRINCIPAL BALANCE AND ASSUMES NO PREPAYMENTS. THE MATURITY DATE USED FOR PREFERRED EQUITY INVESTMENTS REPRESENTS THE MATURITY DATE OF THE SENIOR
MORTGAGE, AS THE PREFERRED EQUITY INVESTMENTS HAVE NO STATED MATURITY DATE, AND REQUIRE REPAYMENT UPON THE SALE OR REFINANCING OF THE ASSET.(5) THE CMBS B-PIECES ARE SHOWN ON AN UNCONSOLIDATED BASIS REFLECTING THE VALUE OF OUR INVESTMENTS.(6) FLOATING RATE CMBS B-PIECES YIELD 1M LIBOR PLUS 600 BPS. AS OF MARCH 31, 2020, 1M LIBOR WAS 0.9929%.(7) FIXED RATE CMBS B-PIECE HAS A BOND EQUIVALENT YIELD OF APPROXIMATELY 10.75%, WAC OF 3.55% AND CURRENT YIELD OF 6.10% .(8) MEZZANINE INVESMENT IS FLOATING BASED ON WSJ PRIME PLUS 900 BPS, OF WHICH 8.00% IS FIXED AND PAID MONTHLY. AS OF MARCH 31, 2020, WSJ PRIME WAS 3.25%.(9) PREFERRED STOCK CONSISTS OF JCAP SERIES A PREFERRED.

14
APPENDIX: RECONCILIATIONS$s IN 0,000s EXCEPT PER SHARE DATA OR AS OTHERWISE INDICATED
RECONCILIATION OF NET LOSS TO CORE EARNINGS
1Q 2020
Net loss attributable to common stockholders $(6,353)
Adjustments:
Loan loss provision, net 59
Unrealized (gains) or losses 7,473
Core Earnings $1,179
Weighted average common shares outstanding, basic 5,223
Weighted average common shares outstanding, diluted 5,223
Core earnings per diluted weighted average share $0.23
RECONCILIATION APRIL 30, 2020 DEBT TO EQUITY
Credit facility1 $788,345
Repo 12 28,232
Repo 22 20,556
Repo 33 564
Repo 43 483
Total debt $838,180
Redeemable NCI in the Operating Partnership1 233,395
Total stockholders equity1 83,099
Total Equity $316,494
Debt to equity ratio 2.65x
(1) AS OF MARCH 31, 2020(2) REPURCHASE AGREEMENT ENTERED INTO ON APRIL 23, 2020(3) REPURCHASE AGREEMENT ENETERED INTO ON APRIL 15, 2020

15
APPENDIX: RECONCILIATIONS$s IN 0,000s EXCEPT PER SHARE DATA OR AS OTHERWISE INDICATED
RECONCILIATION OF 2Q 2020 NET INCOME TO CORE EARNINGS
Low Mid High
2Q 2020 2Q 2020 2Q 2020
Net income attributable to common stockholders $1,951 $2,060 $2,169
Adjustments:
Amortization of stock based compensation 122 122 122
Core Earnings $2,073 $2,182 $2,291
Weighted average common shares outstanding, basic 5,263 5,263 5,263
Weighted average common shares outstanding, diluted 5,455 5,455 5,455
Core earnings per diluted weighted average share $0.38 $0.40 $0.42


![FY2013 1Q Financial Results [PDF: 497KB]](https://img.pdfslide.net/doc/110x75/58a031621a28abd04d8bc560/fy2013-1q-financial-results-pdf-497kb.jpg)