Embed Size (px)
Citation preview
Actual ResultsDollars in thousands, except per share and unit 1Q 2016 2Q 2016 Full-Year 2016
Per Share MetricsFFO per common share and unit, diluted $0.43 $0.43 to $0.45 $1.75 to $1.81FFO as Adjusted per common share and unit, diluted $0.43 $0.43 to $0.45 $1.75 to $1.81Adjusted Funds from Operations ("AFFO") per common share and unit, diluted $0.41 $0.39 to $0.41 $1.59 to $1.65Dividend declared per share and unit $0.2950 $0.2950 $1.18 (2)
Same-Store Operating MetricsRevenue growth 6.4% -- 5.50% - 6.00%Expense growth 2.7% -- 3.00% - 3.50%NOI growth 8.0% -- 6.50% - 7.00%Physical Occupancy 96.5% -- 96.6%
Property Metrics Homes Communities % of Total NOISame-Store 34,017 117 73.4%Stabilized, Non-Mature 4,610 11 11.1%Acquired Communities - - -Redevelopment 2,101 4 4.5%Non-Residential / Other N/A N/A 1.4%Sold and Held for disposition - - 0.1%Joint Venture (includes completed JV developments) (3) 6,947 28 9.5%
Sub-total, completed homes 47,675 160 100%Under Development 1,101 2 -Joint Venture Development 922 4 -Preferred Equity Investments 1,533 5 -
Total expected homes (3)(4) 51,231 171 100%
Balance Sheet Metrics (adjusted for non-recurring items) Market Capitalization1Q 2016 1Q 2015 1Q 2016 % of Total
Interest Coverage Ratio 4.47x 4.09x Total debt 3,411,825$ 23.0%Fixed Charge Coverage Ratio 4.36x 3.98x Common stock equivalents (5) 11,422,714 77.0%Leverage Ratio 33.0% 37.5% Total market capitalization 14,834,539$ 100.0%Net Debt-to-EBITDA 5.4x 6.4x
West Coast Development Joint Venture
(2) Annualized for 2016.
(5) Based on a common share price of $38.53 at March 31, 2016.
(Unaudited)
(1) See Attachment 16 for definitions and other terms.
Guidance as of March 31, 2016
1
Financial HighlightsUDR, Inc.
As of End of First Quarter 2016 (1)
(3) Joint venture NOI is based on UDR's pro rata share. Homes and communities at 100%.(4) Excludes 218 homes at Steele Creek where we have a participating loan investment as described in Attachment 9(B).
Completion Date: 2Q168th & Republican - Seattle, WA Katella Grand I - Anaheim , CA Completion Date: 2Q16
Exhibit 99.2
In thousands, except per share amounts 2016 2015
REVENUES:Rental income 231,957$ 207,047$
Joint venture management and other fees (2) 2,858 12,706Total revenues 234,815 219,753
OPERATING EXPENSES:Property operating and maintenance 39,446 37,250Real estate taxes and insurance 28,377 26,222Property management 6,379 5,694Other operating expenses 1,752 1,766Real estate depreciation and amortization 105,339 88,777Acquisition costs - 199General and administrative 13,844 11,953Casualty-related (recoveries)/charges, net - 996Other depreciation and amortization 1,553 1,623
Total operating expenses 196,690 174,480
Operating income 38,125 45,273
Income/(loss) from unconsolidated entities (2) 679 59,159
Interest expense (31,104) (28,800)Interest income and other income/(expense), net 431 360
Income/(loss) before income taxes and gain/(loss) on sale of real estate owned 8,131 75,992Tax benefit/(provision), net 403 425
Income/(loss) from continuing operations 8,534 76,417
Gain/(loss) on sale of real estate owned, net of tax 3,070 -
Net income/(loss) 11,604 76,417Net (income)/loss attributable to redeemable noncontrolling interests in the OP and DownREIT Partnership (905) (2,588)Net (income)/loss attributable to noncontrolling interests (306) (7)
Net income/(loss) attributable to UDR, Inc. 10,393 73,822Distributions to preferred stockholders - Series E (Convertible) (929) (931)
Net income/(loss) attributable to common stockholders 9,464$ 72,891$
Income/(loss) per weighted average common share - basic: $0.04 $0.28Income/(loss) per weighted average common share - diluted: $0.04 $0.28
Common distributions declared per share $0.2950 $0.2775
Weighted average number of common shares outstanding - basic 262,456 256,834Weighted average number of common shares outstanding - diluted 264,285 258,662
(1) See Attachment 16 for definitions and other terms.
Three Months Ended
Attachment 1
UDR, Inc.Consolidated Statements of Operations (1)
(Unaudited)
(2) In January 2015, the eight communities held by the Texas Joint Venture were sold, generating proceeds to UDR of $43.5 million. The Company recorded promote and disposition fee income of approximately $9.6 million and a gain of approximately $59.1 million in connection with the sale during the three months ended March 31, 2015.
2
March 31,
In thousands, except per share and unit amounts 2016 2015
Net income/(loss) attributable to common stockholders 9,464$ 72,891$
Real estate depreciation and amortization 105,339 88,777Noncontrolling interests 1,211 2,595Real estate depreciation and amortization on unconsolidated joint ventures 10,350 9,850
Net gain on the sale of unconsolidated depreciable property (2) - (59,073)
Net gain on the sale of depreciable real estate owned (5) (1,385) -Funds from operations ("FFO") attributable to common stockholders and unitholders, basic 124,979$ 115,040$
Distributions to preferred stockholders - Series E (Convertible) (3) 929 931
FFO attributable to common stockholders and unitholders, diluted 125,908$ 115,971$
FFO per common share and unit, basic 0.43$ 0.43$FFO per common share and unit, diluted 0.43$ 0.43$
Weighted average number of common shares and OP/DownREIT Units outstanding - basic 287,647 265,999Weighted average number of common shares, OP/DownREIT Units, and common stock equivalents outstanding - diluted 292,504 270,863
Impact of adjustments to FFO: Acquisition-related costs/(fees), including joint ventures -$ 199$ Texas Joint Venture promote and disposition fee income (2) - (9,633) Long-term incentive plan transition costs 323 854 Net gain on the sale of non-depreciable real estate owned (5) (1,685) - Casualty-related (recoveries)/charges, including joint ventures, net (4) 1,126 996
(236)$ (7,584)$
FFO as Adjusted attributable to common stockholders and unitholders, diluted 125,672$ 108,387$
FFO as Adjusted per common share and unit, diluted 0.43$ 0.40$
Recurring capital expenditures (6,961) (7,243)AFFO attributable to common stockholders and unitholders 118,711$ 101,144$
AFFO per common share and unit, diluted 0.41$ 0.37$
(1) See Attachment 16 for definitions and other terms.
Attachment 2
UDR, Inc.Funds From Operations (1)
(Unaudited)
Three Months Ended
(4) Casualty-related charges for the three months ended March 31, 2016 include $1.1 million related to UDR's share of the 717 Olympic casualty, which is included in income/(loss) from unconsolidated entities in Attachment 1.
(2) In January 2015, the eight communities held by the Texas Joint Venture were sold, generating proceeds to UDR of $43.5 million. The Company recorded promote and disposition fee income of approximately $9.6 million and a gain of approximately $59.1 million in connection with the sale during the three months ended March 31, 2015.
(5) The GAAP gain for the three months ended March 31, 2016 is $3.1 million, of which $1.7 million is FFO gain related to the sale of two land parcels. The FFO gain is backed out for FFO as Adjusted.
(3) Series E preferred shares are dilutive for purposes of calculating FFO per share. Consequently, distributions to Series E preferred shareholders are added to FFO and the weighted average number of shares are included in the denominator when calculating FFO per common share and unit, diluted.
3
March 31,
March 31, December 31,In thousands, except share and per share amounts 2016 2015
ASSETS
Real estate owned:Real estate held for investment 9,000,652$ 9,053,599$
Less: accumulated depreciation (2,743,461) (2,646,044) Real estate held for investment, net 6,257,191 6,407,555
Real estate under development(net of accumulated depreciation of $0 and $0) 196,402 124,072
Real estate held for disposition(net of accumulated depreciation of $802 and $830) 31,744 11,775
Total real estate owned, net of accumulated depreciation 6,485,337 6,543,402
Cash and cash equivalents 3,668 6,742Restricted cash 21,030 20,798Notes receivable, net 16,694 16,694Investment in and advances to unconsolidated joint ventures, net 944,864 938,906Other assets 129,975 137,302
Total assets 7,601,568$ 7,663,844$
LIABILITIES AND EQUITY
Liabilities:Secured debt 1,374,670$ 1,376,945$Unsecured debt 2,037,155 2,193,850Real estate taxes payable 16,147 18,786Accrued interest payable 28,589 29,162Security deposits and prepaid rent 35,995 36,330Distributions payable 86,963 80,368Accounts payable, accrued expenses, and other liabilities 77,676 81,356
Total liabilities 3,657,195 3,816,797
Redeemable noncontrolling interests in the OP and DownREIT Partnership 970,620 946,436
Equity:Preferred stock, no par value; 50,000,000 shares authorized
2,796,903 shares of 8.00% Series E Cumulative Convertible issuedand outstanding (2,796,903 shares at December 31, 2015) 46,457 46,457
16,452,496 shares of Series F outstanding (16,452,496 shares at December 31, 2015) 1 1
Common stock, $0.01 par value; 350,000,000 shares authorized 267,137,288 shares issued and outstanding (261,844,521 shares at December 31, 2015) 2,671 2,618
Additional paid-in capital 4,620,946 4,447,816Distributions in excess of net income (1,685,173) (1,584,459)Accumulated other comprehensive income/(loss), net (12,035) (12,678)
Total stockholders' equity 2,972,867 2,899,755Noncontrolling interests 886 856
Total equity 2,973,753 2,900,611Total liabilities and equity 7,601,568$ 7,663,844$
(1) See Attachment 16 for definitions and other terms.
Attachment 3
UDR, Inc.Consolidated Balance Sheets (1)
(Unaudited)
4
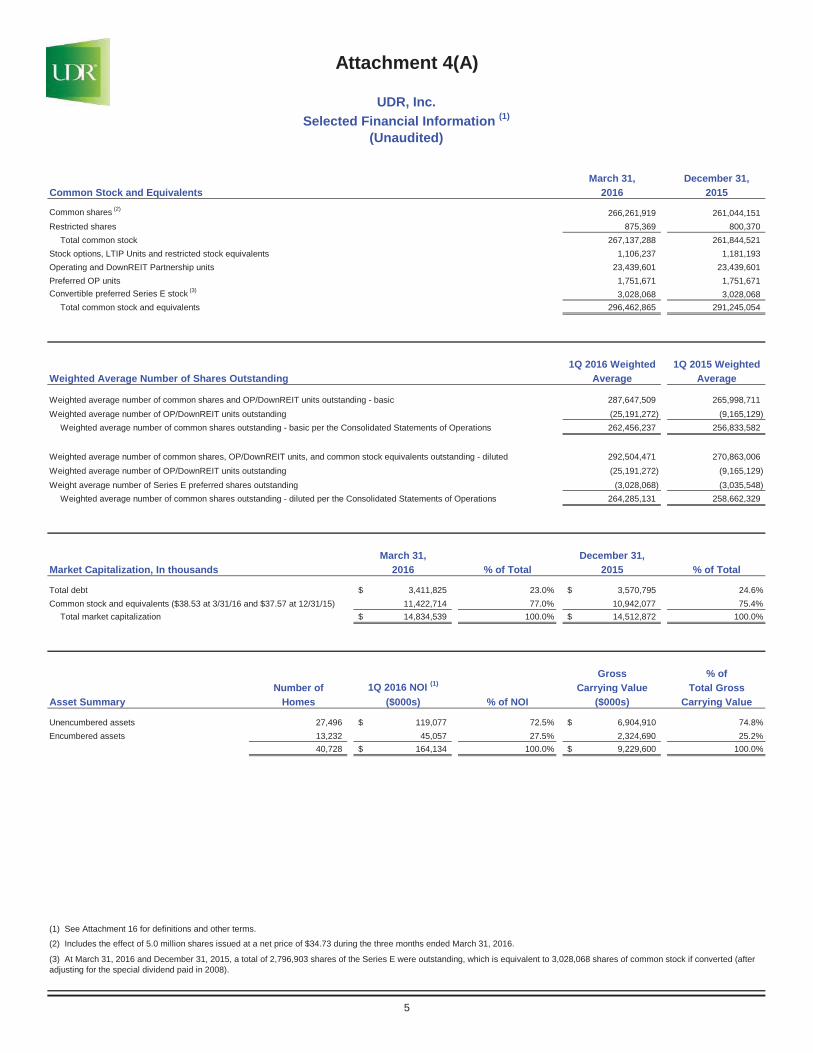
March 31, December 31,Common Stock and Equivalents 2016 2015
Common shares (2) 266,261,919 261,044,151Restricted shares 875,369 800,370
Total common stock 267,137,288 261,844,521Stock options, LTIP Units and restricted stock equivalents 1,106,237 1,181,193Operating and DownREIT Partnership units 23,439,601 23,439,601Preferred OP units 1,751,671 1,751,671Convertible preferred Series E stock (3) 3,028,068 3,028,068
Total common stock and equivalents 296,462,865 291,245,054
1Q 2016 Weighted 1Q 2015 WeightedWeighted Average Number of Shares Outstanding Average Average
Weighted average number of common shares and OP/DownREIT units outstanding - basic 287,647,509 265,998,711Weighted average number of OP/DownREIT units outstanding (25,191,272) (9,165,129)
Weighted average number of common shares outstanding - basic per the Consolidated Statements of Operations 262,456,237 256,833,582
Weighted average number of common shares, OP/DownREIT units, and common stock equivalents outstanding - diluted 292,504,471 270,863,006Weighted average number of OP/DownREIT units outstanding (25,191,272) (9,165,129)Weight average number of Series E preferred shares outstanding (3,028,068) (3,035,548)
Weighted average number of common shares outstanding - diluted per the Consolidated Statements of Operations 264,285,131 258,662,329
March 31, December 31,Market Capitalization, In thousands 2016 % of Total 2015 % of Total
Total debt 3,411,825$ 23.0% 3,570,795$ 24.6%Common stock and equivalents ($38.53 at 3/31/16 and $37.57 at 12/31/15) 11,422,714 77.0% 10,942,077 75.4%
Total market capitalization 14,834,539$ 100.0% 14,512,872$ 100.0%
Gross % ofNumber of 1Q 2016 NOI (1) Carrying Value Total Gross
Asset Summary Homes ($000s) % of NOI ($000s) Carrying Value
Unencumbered assets 27,496 119,077$ 72.5% 6,904,910$ 74.8%Encumbered assets 13,232 45,057 27.5% 2,324,690 25.2%
40,728 164,134$ 100.0% 9,229,600$ 100.0%
-
(1) See Attachment 16 for definitions and other terms.
Attachment 4(A)
UDR, Inc.Selected Financial Information (1)
(Unaudited)
5
(3) At March 31, 2016 and December 31, 2015, a total of 2,796,903 shares of the Series E were outstanding, which is equivalent to 3,028,068 shares of common stock if converted (after adjusting for the special dividend paid in 2008).
(2) Includes the effect of 5.0 million shares issued at a net price of $34.73 during the three months ended March 31, 2016.
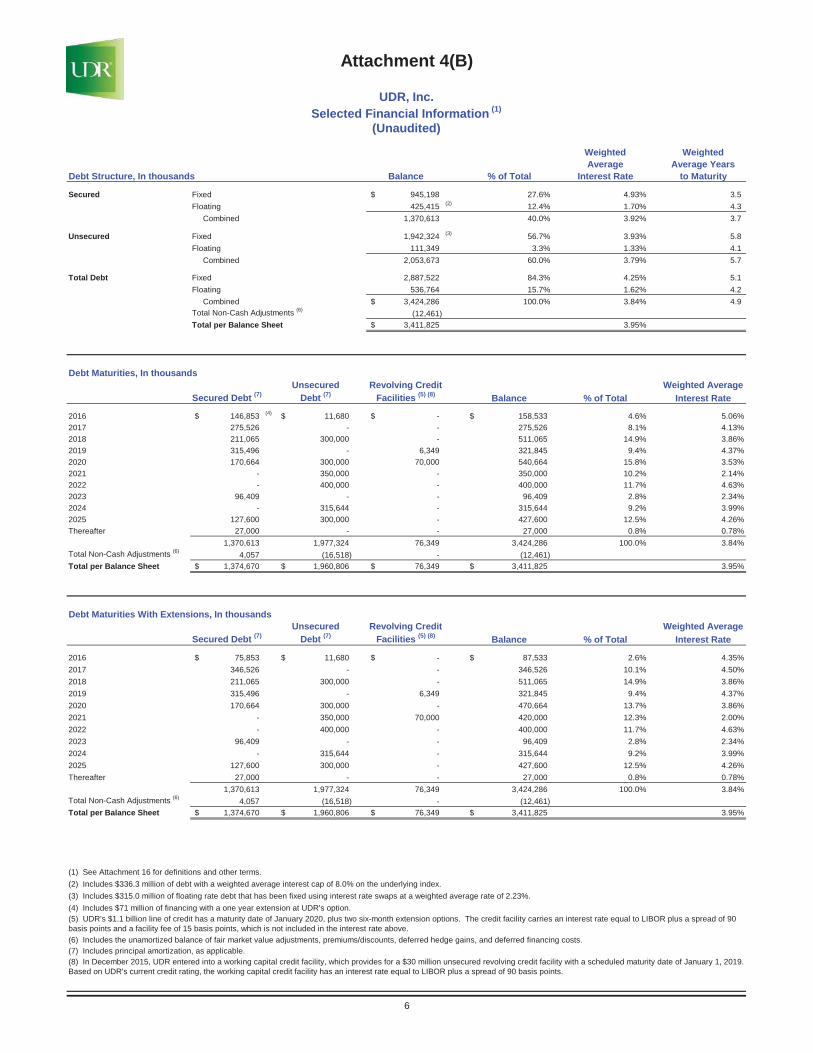
Weighted WeightedAverage Average Years
Debt Structure, In thousands Balance % of Total Interest Rate to Maturity
Secured Fixed 945,198$ 27.6% 4.93% 3.5Floating 425,415 (2) 12.4% 1.70% 4.3
1,370,613 40.0% 3.92% 3.7
Unsecured Fixed 1,942,324 (3) 56.7% 3.93% 5.8Floating 111,349 3.3% 1.33% 4.1
2,053,673 60.0% 3.79% 5.7
Total Debt Fixed 2,887,522 84.3% 4.25% 5.1Floating 536,764 15.7% 1.62% 4.2
3,424,286$ 100.0% 3.84% 4.9Total Non-Cash Adjustments (6) (12,461)Total per Balance Sheet 3,411,825$ 3.95%
Debt Maturities, In thousandsUnsecured Revolving Credit Weighted Average
Secured Debt (7) Debt (7) Facilities (5) (8) Balance % of Total Interest Rate
2016 146,853$ (4) 11,680$ -$ 158,533$ 4.6% 5.06%2017 275,526 - - 275,526 8.1% 4.13%2018 211,065 300,000 - 511,065 14.9% 3.86%2019 315,496 - 6,349 321,845 9.4% 4.37%2020 170,664 300,000 70,000 540,664 15.8% 3.53%2021 - 350,000 - 350,000 10.2% 2.14%2022 - 400,000 - 400,000 11.7% 4.63%2023 96,409 - - 96,409 2.8% 2.34%2024 - 315,644 - 315,644 9.2% 3.99%2025 127,600 300,000 - 427,600 12.5% 4.26%Thereafter 27,000 - - 27,000 0.8% 0.78%
1,370,613 1,977,324 76,349 3,424,286 100.0% 3.84%Total Non-Cash Adjustments (6) 4,057 (16,518) - (12,461)Total per Balance Sheet 1,374,670$ 1,960,806$ 76,349$ 3,411,825$ 3.95%
Debt Maturities With Extensions, In thousandsUnsecured Revolving Credit Weighted Average
Secured Debt (7) Debt (7) Facilities (5) (8) Balance % of Total Interest Rate
2016 75,853$ 11,680$ -$ 87,533$ 2.6% 4.35%2017 346,526 - - 346,526 10.1% 4.50%2018 211,065 300,000 - 511,065 14.9% 3.86%2019 315,496 - 6,349 321,845 9.4% 4.37%2020 170,664 300,000 - 470,664 13.7% 3.86%2021 - 350,000 70,000 420,000 12.3% 2.00%2022 - 400,000 - 400,000 11.7% 4.63%2023 96,409 - - 96,409 2.8% 2.34%2024 - 315,644 - 315,644 9.2% 3.99%2025 127,600 300,000 - 427,600 12.5% 4.26%Thereafter 27,000 - - 27,000 0.8% 0.78%
1,370,613 1,977,324 76,349 3,424,286 100.0% 3.84%Total Non-Cash Adjustments (6) 4,057 (16,518) - (12,461)Total per Balance Sheet 1,374,670$ 1,960,806$ 76,349$ 3,411,825$ 3.95%
(1) See Attachment 16 for definitions and other terms.
Attachment 4(B)
UDR, Inc.Selected Financial Information (1)
(Unaudited)
(5) UDR's $1.1 billion line of credit has a maturity date of January 2020, plus two six-month extension options. The credit facility carries an interest rate equal to LIBOR plus a spread of 90 basis points and a facility fee of 15 basis points, which is not included in the interest rate above.
6
(4) Includes $71 million of financing with a one year extension at UDR's option.
Combined
Combined
Combined
(2) Includes $336.3 million of debt with a weighted average interest cap of 8.0% on the underlying index.(3) Includes $315.0 million of floating rate debt that has been fixed using interest rate swaps at a weighted average rate of 2.23%.
(6) Includes the unamortized balance of fair market value adjustments, premiums/discounts, deferred hedge gains, and deferred financing costs.(7) Includes principal amortization, as applicable.(8) In December 2015, UDR entered into a working capital credit facility, which provides for a $30 million unsecured revolving credit facility with a scheduled maturity date of January 1, 2019. Based on UDR's current credit rating, the working capital credit facility has an interest rate equal to LIBOR plus a spread of 90 basis points.
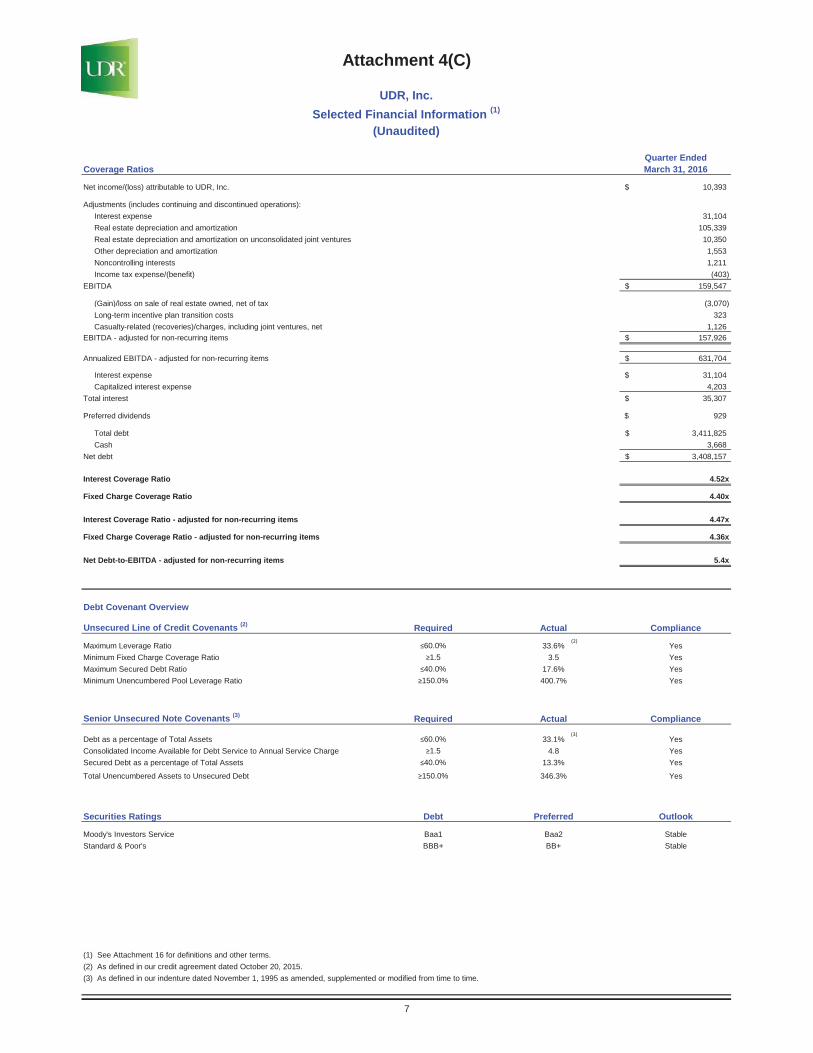
Quarter EndedCoverage Ratios March 31, 2016
Net income/(loss) attributable to UDR, Inc. 10,393$
Adjustments (includes continuing and discontinued operations):Interest expense 31,104Real estate depreciation and amortization 105,339Real estate depreciation and amortization on unconsolidated joint ventures 10,350Other depreciation and amortization 1,553Noncontrolling interests 1,211Income tax expense/(benefit) (403)
EBITDA 159,547$
(Gain)/loss on sale of real estate owned, net of tax (3,070)Long-term incentive plan transition costs 323Casualty-related (recoveries)/charges, including joint ventures, net 1,126
EBITDA - adjusted for non-recurring items 157,926$
Annualized EBITDA - adjusted for non-recurring items 631,704$
Interest expense 31,104$Capitalized interest expense 4,203
Total interest 35,307$
Preferred dividends 929$
Total debt 3,411,825$Cash 3,668
Net debt 3,408,157$
Interest Coverage Ratio 4.52x
Fixed Charge Coverage Ratio 4.40x
Interest Coverage Ratio - adjusted for non-recurring items 4.47x
Fixed Charge Coverage Ratio - adjusted for non-recurring items 4.36x
Net Debt-to-EBITDA - adjusted for non-recurring items 5.4x
Unsecured Line of Credit Covenants (2) Required Actual Compliance
Maximum Leverage Ratio 60.0% 33.6% YesMinimum Fixed Charge Coverage Ratio 1.5 3.5 YesMaximum Secured Debt Ratio 40.0% 17.6% YesMinimum Unencumbered Pool Leverage Ratio 150.0% 400.7% Yes
Senior Unsecured Note Covenants (3) Required Actual Compliance
Debt as a percentage of Total Assets 60.0% 33.1% YesConsolidated Income Available for Debt Service to Annual Service Charge 1.5 4.8 YesSecured Debt as a percentage of Total Assets 40.0% 13.3% Yes
Total Unencumbered Assets to Unsecured Debt 150.0% 346.3% Yes
Securities Ratings Debt Preferred Outlook
Moody's Investors Service Baa1 Baa2 StableStandard & Poor's BBB+ BB+ Stable
7
Debt Covenant Overview
(3) As defined in our indenture dated November 1, 1995 as amended, supplemented or modified from time to time.(2) As defined in our credit agreement dated October 20, 2015.
Attachment 4(C)
UDR, Inc.Selected Financial Information (1)
(Unaudited)
(1) See Attachment 16 for definitions and other terms.
(3)
(2)
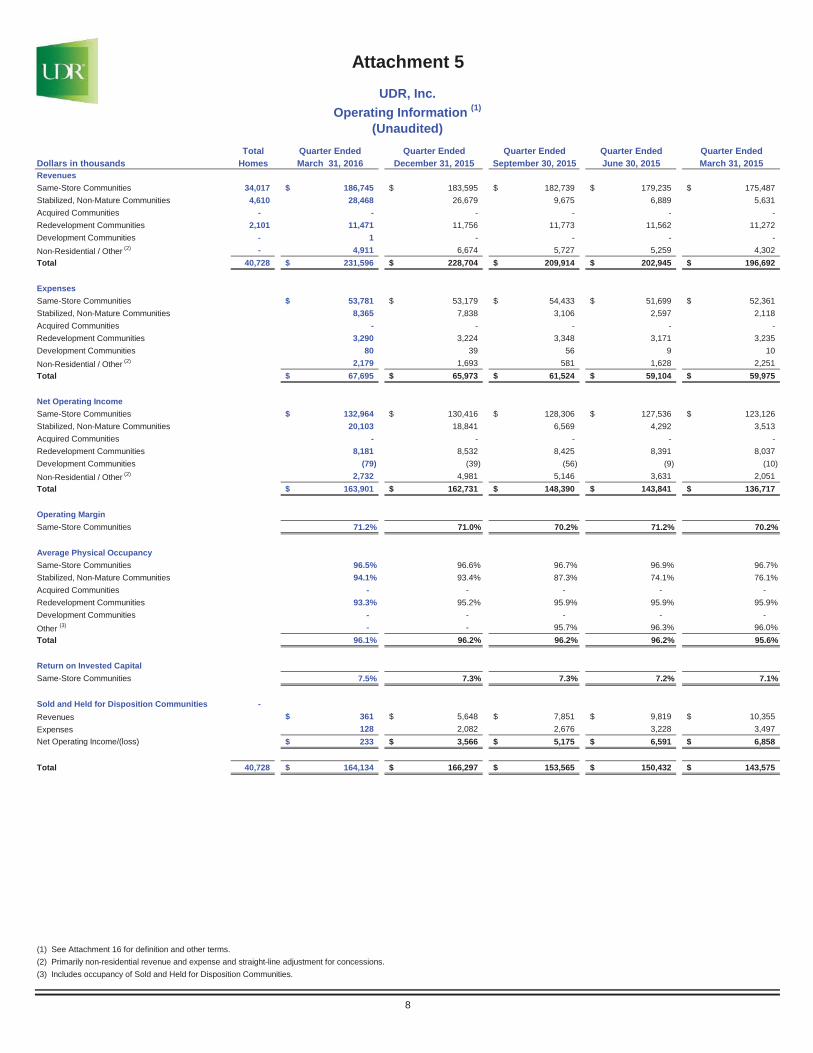
Total Quarter Ended Quarter Ended Quarter Ended Quarter Ended Quarter EndedDollars in thousands Homes March 31, 2016 December 31, 2015 September 30, 2015 June 30, 2015 March 31, 2015RevenuesSame-Store Communities 34,017 186,745$ 183,595$ 182,739$ 179,235$ 175,487$Stabilized, Non-Mature Communities 4,610 28,468 26,679 9,675 6,889 5,631Acquired Communities - - - - - -Redevelopment Communities 2,101 11,471 11,756 11,773 11,562 11,272Development Communities - 1 - - - -Non-Residential / Other (2) - 4,911 6,674 5,727 5,259 4,302Total 40,728 231,596$ 228,704$ 209,914$ 202,945$ 196,692$
ExpensesSame-Store Communities 53,781$ 53,179$ 54,433$ 51,699$ 52,361$Stabilized, Non-Mature Communities 8,365 7,838 3,106 2,597 2,118Acquired Communities - - - - -Redevelopment Communities 3,290 3,224 3,348 3,171 3,235Development Communities 80 39 56 9 10Non-Residential / Other (2) 2,179 1,693 581 1,628 2,251Total 67,695$ 65,973$ 61,524$ 59,104$ 59,975$
Net Operating IncomeSame-Store Communities 132,964$ 130,416$ 128,306$ 127,536$ 123,126$Stabilized, Non-Mature Communities 20,103 18,841 6,569 4,292 3,513Acquired Communities - - - - -Redevelopment Communities 8,181 8,532 8,425 8,391 8,037Development Communities (79) (39) (56) (9) (10)Non-Residential / Other (2) 2,732 4,981 5,146 3,631 2,051Total 163,901$ 162,731$ 148,390$ 143,841$ 136,717$
Operating MarginSame-Store Communities 71.2% 71.0% 70.2% 71.2% 70.2%
Average Physical OccupancySame-Store Communities 96.5% 96.6% 96.7% 96.9% 96.7%Stabilized, Non-Mature Communities 94.1% 93.4% 87.3% 74.1% 76.1%Acquired Communities - - - - -Redevelopment Communities 93.3% 95.2% 95.9% 95.9% 95.9%Development Communities - - - - -Other (3) - - 95.7% 96.3% 96.0%Total 96.1% 96.2% 96.2% 96.2% 95.6%
Return on Invested CapitalSame-Store Communities 7.5% 7.3% 7.3% 7.2% 7.1%
Sold and Held for Disposition Communities -Revenues 361$ 5,648$ 7,851$ 9,819$ 10,355$Expenses 128 2,082 2,676 3,228 3,497Net Operating Income/(loss) 233$ 3,566$ 5,175$ 6,591$ 6,858$
Total 40,728 164,134$ 166,297$ 153,565$ 150,432$ 143,575$
(2) Primarily non-residential revenue and expense and straight-line adjustment for concessions.(3) Includes occupancy of Sold and Held for Disposition Communities.
8
Attachment 5UDR, Inc.
Operating Information (1)
(Unaudited)
(1) See Attachment 16 for definition and other terms.
% of 1Q 2016SS Operating
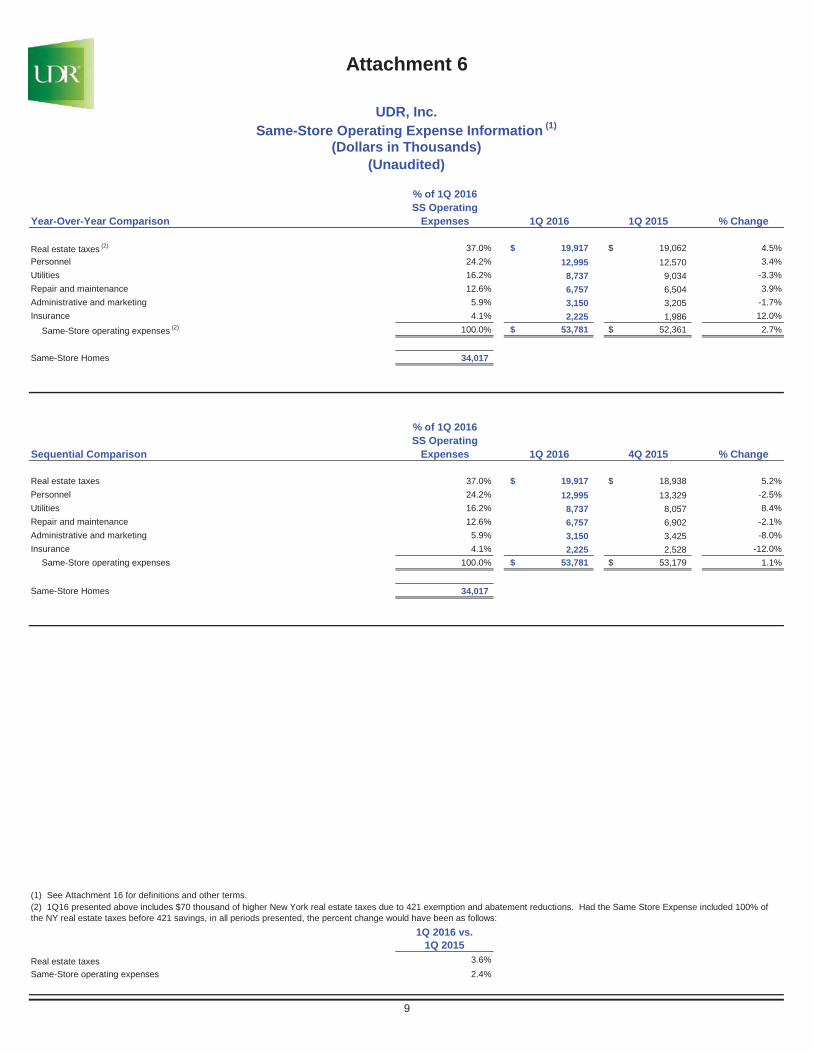
Year-Over-Year Comparison Expenses 1Q 2016 1Q 2015 % Change
Real estate taxes (2) 37.0% 19,917$ 19,062$ 4.5%Personnel 24.2% 12,995 12,570 3.4%Utilities 16.2% 8,737 9,034 -3.3%Repair and maintenance 12.6% 6,757 6,504 3.9%Administrative and marketing 5.9% 3,150 3,205 -1.7%Insurance 4.1% 2,225 1,986 12.0%
Same-Store operating expenses (2) 100.0% 53,781$ 52,361$ 2.7%
Same-Store Homes 34,017
% of 1Q 2016SS Operating
Sequential Comparison Expenses 1Q 2016 4Q 2015 % Change
Real estate taxes 37.0% 19,917$ 18,938$ 5.2%Personnel 24.2% 12,995 13,329 -2.5%Utilities 16.2% 8,737 8,057 8.4%Repair and maintenance 12.6% 6,757 6,902 -2.1%Administrative and marketing 5.9% 3,150 3,425 -8.0%Insurance 4.1% 2,225 2,528 -12.0%
Same-Store operating expenses 100.0% 53,781$ 53,179$ 1.1%
Same-Store Homes 34,017
(1) See Attachment 16 for definitions and other terms.
1Q 2016 vs. 1Q 2015
Real estate taxes 3.6%Same-Store operating expenses 2.4%
9
Attachment 6
UDR, Inc.Same-Store Operating Expense Information (1)
(Unaudited)(Dollars in Thousands)
(2) 1Q16 presented above includes $70 thousand of higher New York real estate taxes due to 421 exemption and abatement reductions. Had the Same Store Expense included 100% of the NY real estate taxes before 421 savings, in all periods presented, the percent change would have been as follows:
UnconsolidatedTotal Total Joint Venture Total
Same-Store Non- Consolidated Operating Homes Homes Stabilized (2) Stabil. / Other (3) Homes Homes (4) (incl. JV) (4)
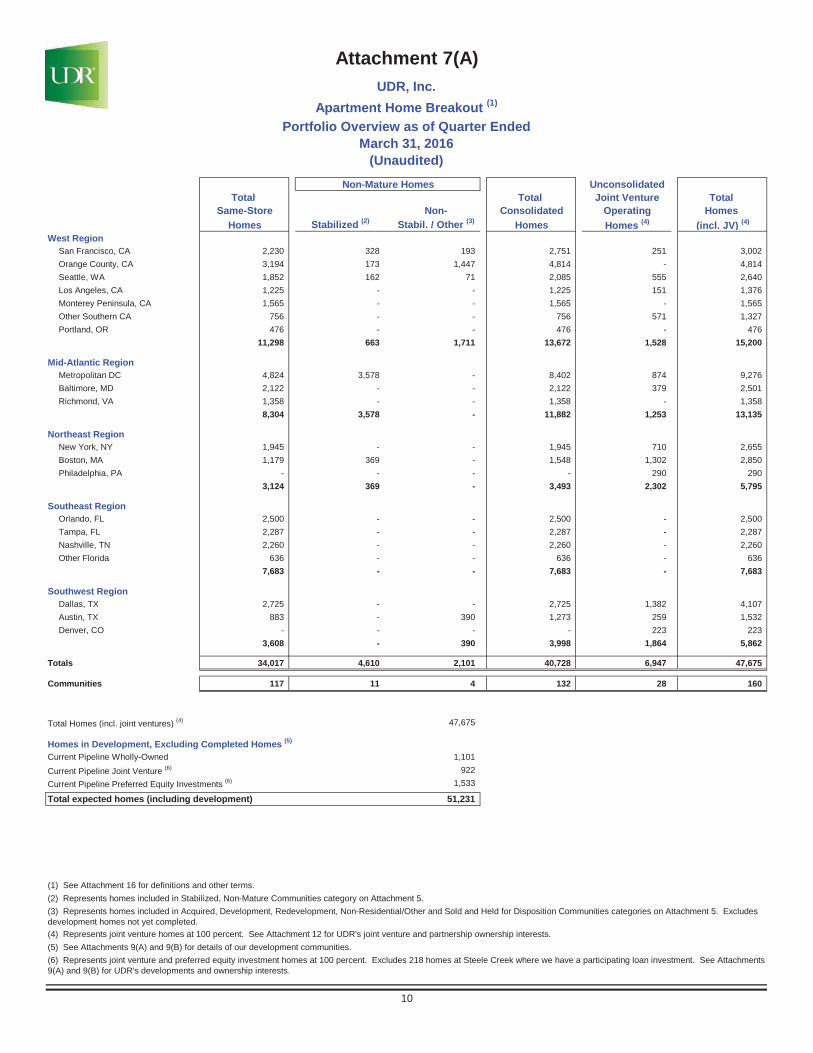
West RegionSan Francisco, CA 2,230 328 193 2,751 251 3,002Orange County, CA 3,194 173 1,447 4,814 - 4,814Seattle, WA 1,852 162 71 2,085 555 2,640Los Angeles, CA 1,225 - - 1,225 151 1,376Monterey Peninsula, CA 1,565 - - 1,565 - 1,565Other Southern CA 756 - - 756 571 1,327Portland, OR 476 - - 476 - 476
11,298 663 1,711 13,672 1,528 15,200
Mid-Atlantic RegionMetropolitan DC 4,824 3,578 - 8,402 874 9,276Baltimore, MD 2,122 - - 2,122 379 2,501Richmond, VA 1,358 - - 1,358 - 1,358
8,304 3,578 - 11,882 1,253 13,135
Northeast RegionNew York, NY 1,945 - - 1,945 710 2,655Boston, MA 1,179 369 - 1,548 1,302 2,850Philadelphia, PA - - - - 290 290
3,124 369 - 3,493 2,302 5,795
Southeast RegionOrlando, FL 2,500 - - 2,500 - 2,500Tampa, FL 2,287 - - 2,287 - 2,287Nashville, TN 2,260 - - 2,260 - 2,260Other Florida 636 - - 636 - 636
7,683 - - 7,683 - 7,683
Southwest RegionDallas, TX 2,725 - - 2,725 1,382 4,107Austin, TX 883 - 390 1,273 259 1,532Denver, CO - - - - 223 223
3,608 - 390 3,998 1,864 5,862
Totals 34,017 4,610 2,101 40,728 6,947 47,675
Communities 117 11 4 132 28 160
Total Homes (incl. joint ventures) (4) 47,675
Homes in Development, Excluding Completed Homes (5)
Current Pipeline Wholly-Owned 1,101Current Pipeline Joint Venture (6) 922Current Pipeline Preferred Equity Investments (6) 1,533
Total expected homes (including development) 51,231
(1) See Attachment 16 for definitions and other terms.(2) Represents homes included in Stabilized, Non-Mature Communities category on Attachment 5.
(4) Represents joint venture homes at 100 percent. See Attachment 12 for UDR's joint venture and partnership ownership interests.(5) See Attachments 9(A) and 9(B) for details of our development communities.
10
Attachment 7(A)
Apartment Home Breakout (1)
(Unaudited)Non-Mature Homes
UDR, Inc.
March 31, 2016Portfolio Overview as of Quarter Ended
(3) Represents homes included in Acquired, Development, Redevelopment, Non-Residential/Other and Sold and Held for Disposition Communities categories on Attachment 5. Excludes development homes not yet completed.
(6) Represents joint venture and preferred equity investment homes at 100 percent. Excludes 218 homes at Steele Creek where we have a participating loan investment. See Attachments 9(A) and 9(B) for UDR's developments and ownership interests.
Non-Mature Home Breakout - By Region (includes development homes that have been completed)
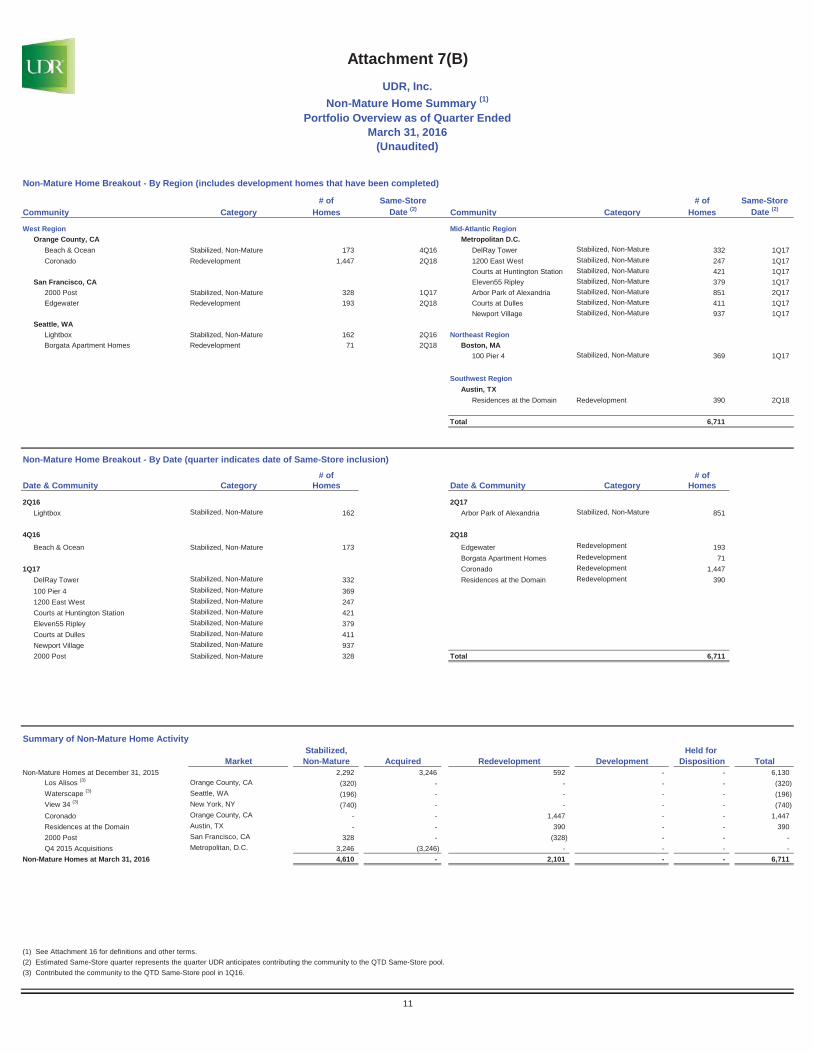
# of Same-Store # of Same-StoreCommunity Category Homes Date (2) Community Category Homes Date (2)
West Region Mid-Atlantic RegionOrange County, CA Metropolitan D.C.
Beach & Ocean Stabilized, Non-Mature 173 4Q16 DelRay Tower Stabilized, Non-Mature 332 1Q17Coronado Redevelopment 1,447 2Q18 1200 East West Stabilized, Non-Mature 247 1Q17
Courts at Huntington Station Stabilized, Non-Mature 421 1Q17San Francisco, CA Eleven55 Ripley Stabilized, Non-Mature 379 1Q17
2000 Post Stabilized, Non-Mature 328 1Q17 Arbor Park of Alexandria Stabilized, Non-Mature 851 2Q17Edgewater Redevelopment 193 2Q18 Courts at Dulles Stabilized, Non-Mature 411 1Q17
Newport Village Stabilized, Non-Mature 937 1Q17Seattle, WA
Lightbox Stabilized, Non-Mature 162 2Q16 Northeast RegionBorgata Apartment Homes Redevelopment 71 2Q18 Boston, MA
100 Pier 4 Stabilized, Non-Mature 369 1Q17
Southwest RegionAustin, TX
Residences at the Domain Redevelopment 390 2Q18
Total 6,711
Non-Mature Home Breakout - By Date (quarter indicates date of Same-Store inclusion)
# of # ofDate & Community Category Homes Date & Community Category Homes
2Q16 2Q17Lightbox Stabilized, Non-Mature 162 Arbor Park of Alexandria Stabilized, Non-Mature 851
4Q16 2Q18
Beach & Ocean Stabilized, Non-Mature 173 Edgewater Redevelopment 193Borgata Apartment Homes Redevelopment 71
1Q17 Coronado Redevelopment 1,447DelRay Tower Stabilized, Non-Mature 332 Residences at the Domain Redevelopment 390100 Pier 4 Stabilized, Non-Mature 3691200 East West Stabilized, Non-Mature 247Courts at Huntington Station Stabilized, Non-Mature 421Eleven55 Ripley Stabilized, Non-Mature 379Courts at Dulles Stabilized, Non-Mature 411Newport Village Stabilized, Non-Mature 9372000 Post Stabilized, Non-Mature 328 Total 6,711
Summary of Non-Mature Home ActivityStabilized, Held for
Market Non-Mature Acquired Redevelopment Development Disposition TotalNon-Mature Homes at December 31, 2015 2,292 3,246 592 - - 6,130
Los Alisos (3) Orange County, CA (320) - - - - (320)Waterscape (3) Seattle, WA (196) - - - - (196)View 34 (3) New York, NY (740) - - - - (740)Coronado Orange County, CA - - 1,447 - - 1,447Residences at the Domain Austin, TX - - 390 - - 3902000 Post San Francisco, CA 328 - (328) - - -Q4 2015 Acquisitions Metropolitan, D.C. 3,246 (3,246) - - - -
Non-Mature Homes at March 31, 2016 4,610 - 2,101 - - 6,711
(1) See Attachment 16 for definitions and other terms.(2) Estimated Same-Store quarter represents the quarter UDR anticipates contributing the community to the QTD Same-Store pool.(3) Contributed the community to the QTD Same-Store pool in 1Q16.
11
Attachment 7(B)UDR, Inc.
Portfolio Overview as of Quarter EndedMarch 31, 2016
(Unaudited)
Non-Mature Home Summary (1)
UnconsolidatedTotal Total Joint Venture Total
Same-Store Non- Consolidated Operating Homes Homes Stabilized (2) Stabilized (3) (4) Homes Homes (5) (incl. pro rata JV) (5)
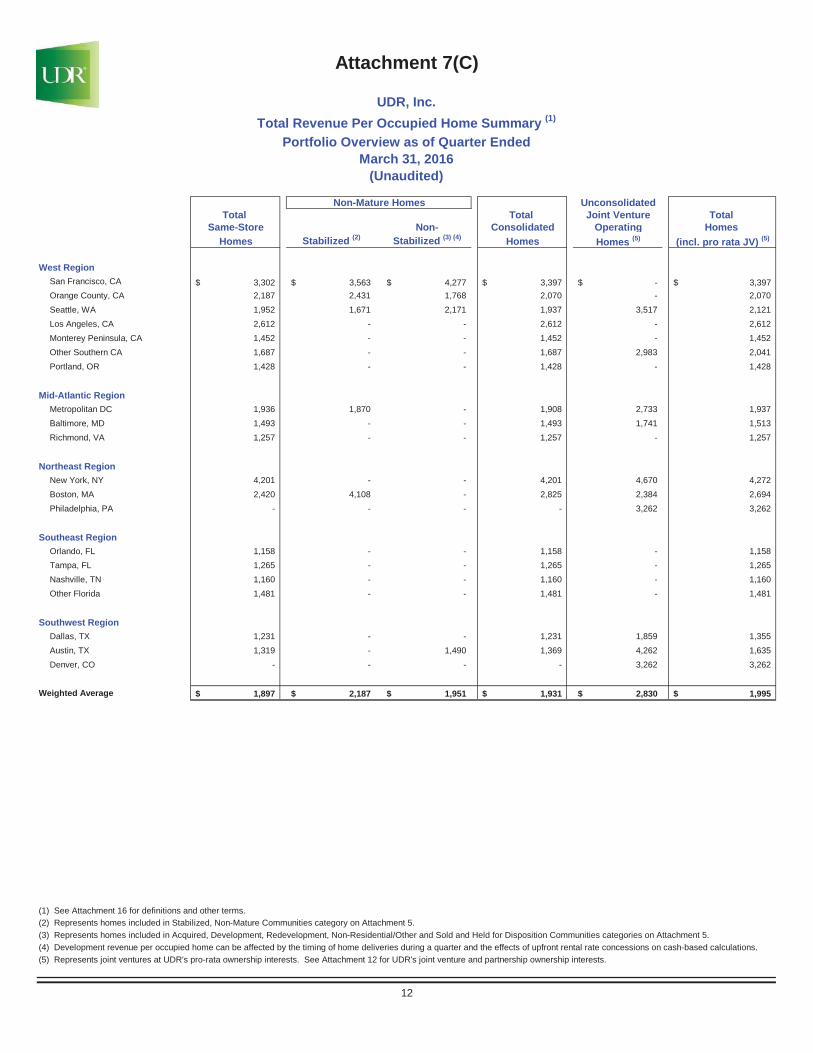
West RegionSan Francisco, CA 3,302$ 3,563$ 4,277$ 3,397$ -$ 3,397$Orange County, CA 2,187 2,431 1,768 2,070 - 2,070Seattle, WA 1,952 1,671 2,171 1,937 3,517 2,121Los Angeles, CA 2,612 - - 2,612 - 2,612Monterey Peninsula, CA 1,452 - - 1,452 - 1,452Other Southern CA 1,687 - - 1,687 2,983 2,041Portland, OR 1,428 - - 1,428 - 1,428
Mid-Atlantic RegionMetropolitan DC 1,936 1,870 - 1,908 2,733 1,937Baltimore, MD 1,493 - - 1,493 1,741 1,513Richmond, VA 1,257 - - 1,257 - 1,257
Northeast RegionNew York, NY 4,201 - - 4,201 4,670 4,272Boston, MA 2,420 4,108 - 2,825 2,384 2,694Philadelphia, PA - - - - 3,262 3,262
Southeast RegionOrlando, FL 1,158 - - 1,158 - 1,158Tampa, FL 1,265 - - 1,265 - 1,265Nashville, TN 1,160 - - 1,160 - 1,160Other Florida 1,481 - - 1,481 - 1,481
Southwest RegionDallas, TX 1,231 - - 1,231 1,859 1,355Austin, TX 1,319 - 1,490 1,369 4,262 1,635Denver, CO - - - - 3,262 3,262
Weighted Average 1,897$ 2,187$ 1,951$ 1,931$ 2,830$ 1,995$
(1) See Attachment 16 for definitions and other terms.(2) Represents homes included in Stabilized, Non-Mature Communities category on Attachment 5.(3) Represents homes included in Acquired, Development, Redevelopment, Non-Residential/Other and Sold and Held for Disposition Communities categories on Attachment 5.(4) Development revenue per occupied home can be affected by the timing of home deliveries during a quarter and the effects of upfront rental rate concessions on cash-based calculations.(5) Represents joint ventures at UDR's pro-rata ownership interests. See Attachment 12 for UDR's joint venture and partnership ownership interests.
12
Attachment 7(C)
UDR, Inc.
Portfolio Overview as of Quarter EndedMarch 31, 2016
(Unaudited)
Non-Mature Homes
Total Revenue Per Occupied Home Summary (1)
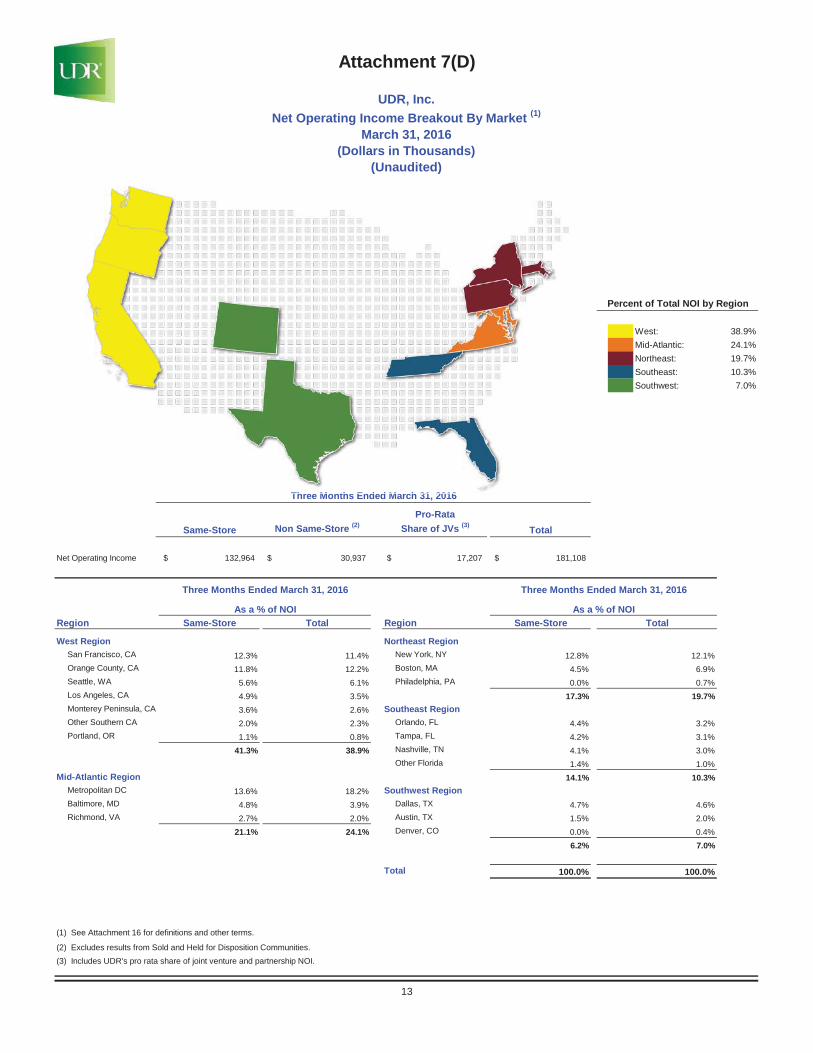
West: 38.9%Mid-Atlantic: 24.1%Northeast: 19.7%Southeast: 10.3%Southwest: 7.0%
Pro-RataSame-Store Non Same-Store (2) Share of JVs (3) Total
Net Operating Income 132,964$ 30,937$ 17,207$ 181,108$
Region Same-Store Total Region Same-Store
West Region Northeast RegionSan Francisco, CA 12.3% 11.4% New York, NY 12.8% 12.1%Orange County, CA 11.8% 12.2% Boston, MA 4.5% 6.9%Seattle, WA 5.6% 6.1% Philadelphia, PA 0.0% 0.7%Los Angeles, CA 4.9% 3.5% 17.3% 19.7%Monterey Peninsula, CA 3.6% 2.6% Southeast RegionOther Southern CA 2.0% 2.3% Orlando, FL 4.4% 3.2%Portland, OR 1.1% 0.8% Tampa, FL 4.2% 3.1%
41.3% 38.9% Nashville, TN 4.1% 3.0%Other Florida 1.4% 1.0%
Mid-Atlantic Region 14.1% 10.3%Metropolitan DC 13.6% 18.2% Southwest RegionBaltimore, MD 4.8% 3.9% Dallas, TX 4.7% 4.6%Richmond, VA 2.7% 2.0% Austin, TX 1.5% 2.0%
21.1% 24.1% Denver, CO 0.0% 0.4%6.2% 7.0%
Total 100.0% 100.0%
(1) See Attachment 16 for definitions and other terms.
(2) Excludes results from Sold and Held for Disposition Communities.(3) Includes UDR's pro rata share of joint venture and partnership NOI.
As a % of NOI As a % of NOI
Three Months Ended March 31, 2016 Three Months Ended March 31, 2016
Total
Three Months Ended March 31, 2016
13
Percent of Total NOI by Region
(Dollars in Thousands)
Attachment 7(D)
UDR, Inc.Net Operating Income Breakout By Market (1)
March 31, 2016
(Unaudited)
Th M th E d d M h 31 2016
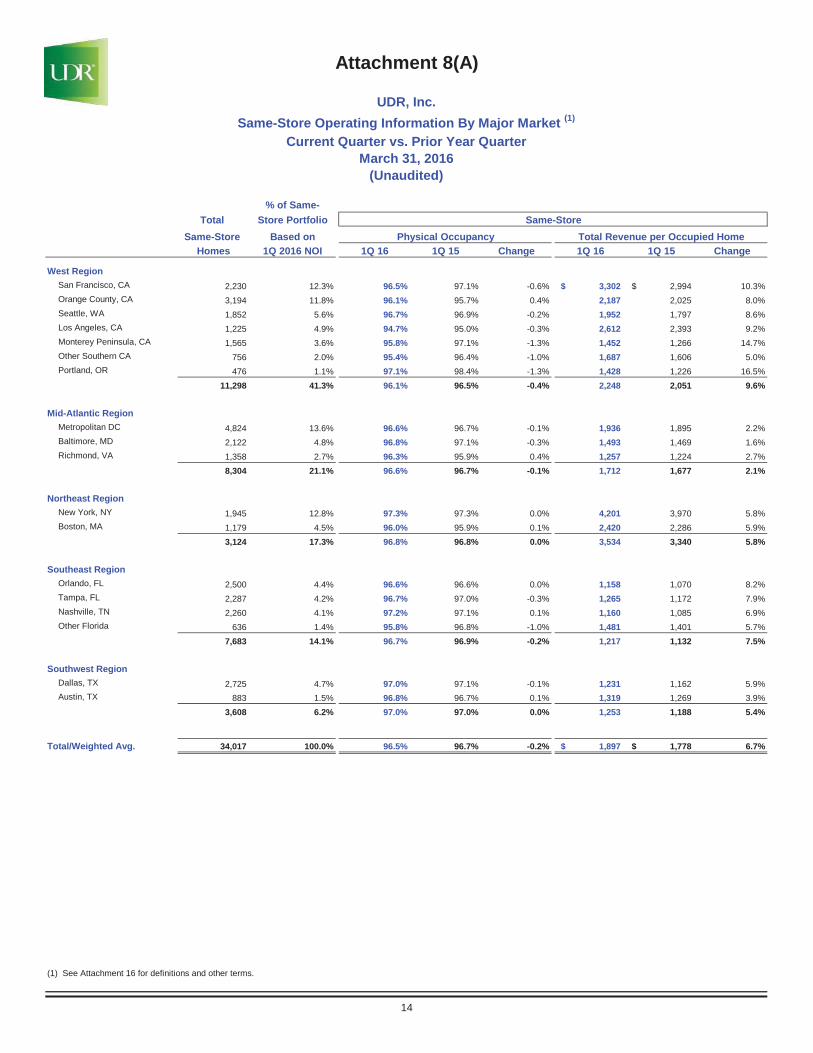
% of Same-Total Store Portfolio
Same-Store Based onHomes 1Q 2016 NOI 1Q 16 1Q 15 Change 1Q 16 1Q 15 Change
West RegionSan Francisco, CA 2,230 12.3% 96.5% 97.1% -0.6% 3,302$ 2,994$ 10.3%Orange County, CA 3,194 11.8% 96.1% 95.7% 0.4% 2,187 2,025 8.0%Seattle, WA 1,852 5.6% 96.7% 96.9% -0.2% 1,952 1,797 8.6%Los Angeles, CA 1,225 4.9% 94.7% 95.0% -0.3% 2,612 2,393 9.2%Monterey Peninsula, CA 1,565 3.6% 95.8% 97.1% -1.3% 1,452 1,266 14.7%Other Southern CA 756 2.0% 95.4% 96.4% -1.0% 1,687 1,606 5.0%Portland, OR 476 1.1% 97.1% 98.4% -1.3% 1,428 1,226 16.5%
11,298 41.3% 96.1% 96.5% -0.4% 2,248 2,051 9.6%
Mid-Atlantic RegionMetropolitan DC 4,824 13.6% 96.6% 96.7% -0.1% 1,936 1,895 2.2%Baltimore, MD 2,122 4.8% 96.8% 97.1% -0.3% 1,493 1,469 1.6%Richmond, VA 1,358 2.7% 96.3% 95.9% 0.4% 1,257 1,224 2.7%
8,304 21.1% 96.6% 96.7% -0.1% 1,712 1,677 2.1%
Northeast RegionNew York, NY 1,945 12.8% 97.3% 97.3% 0.0% 4,201 3,970 5.8%Boston, MA 1,179 4.5% 96.0% 95.9% 0.1% 2,420 2,286 5.9%
3,124 17.3% 96.8% 96.8% 0.0% 3,534 3,340 5.8%
Southeast RegionOrlando, FL 2,500 4.4% 96.6% 96.6% 0.0% 1,158 1,070 8.2%Tampa, FL 2,287 4.2% 96.7% 97.0% -0.3% 1,265 1,172 7.9%Nashville, TN 2,260 4.1% 97.2% 97.1% 0.1% 1,160 1,085 6.9%Other Florida 636 1.4% 95.8% 96.8% -1.0% 1,481 1,401 5.7%
7,683 14.1% 96.7% 96.9% -0.2% 1,217 1,132 7.5%
Southwest RegionDallas, TX 2,725 4.7% 97.0% 97.1% -0.1% 1,231 1,162 5.9%Austin, TX 883 1.5% 96.8% 96.7% 0.1% 1,319 1,269 3.9%
3,608 6.2% 97.0% 97.0% 0.0% 1,253 1,188 5.4%
Total/Weighted Avg. 34,017 100.0% 96.5% 96.7% -0.2% 1,897$ 1,778$ 6.7%
(1) See Attachment 16 for definitions and other terms.
14
Physical Occupancy Total Revenue per Occupied HomeSame-Store
Attachment 8(A)
UDR, Inc.Same-Store Operating Information By Major Market (1)
March 31, 2016(Unaudited)
Current Quarter vs. Prior Year Quarter
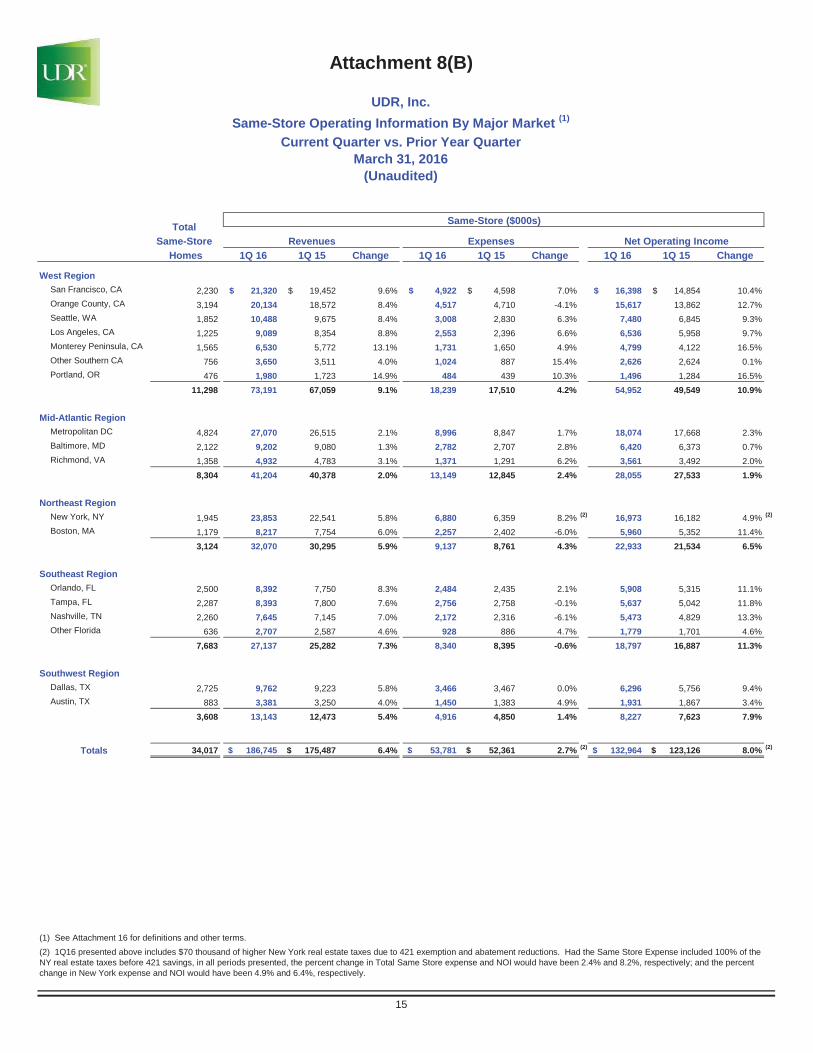
Same-Store Homes 1Q 16 1Q 15 Change 1Q 16 1Q 15 Change 1Q 16 1Q 15 Change
West RegionSan Francisco, CA 2,230 21,320$ 19,452$ 9.6% 4,922$ 4,598$ 7.0% 16,398$ 14,854$ 10.4%Orange County, CA 3,194 20,134 18,572 8.4% 4,517 4,710 -4.1% 15,617 13,862 12.7%Seattle, WA 1,852 10,488 9,675 8.4% 3,008 2,830 6.3% 7,480 6,845 9.3%Los Angeles, CA 1,225 9,089 8,354 8.8% 2,553 2,396 6.6% 6,536 5,958 9.7%Monterey Peninsula, CA 1,565 6,530 5,772 13.1% 1,731 1,650 4.9% 4,799 4,122 16.5%Other Southern CA 756 3,650 3,511 4.0% 1,024 887 15.4% 2,626 2,624 0.1%Portland, OR 476 1,980 1,723 14.9% 484 439 10.3% 1,496 1,284 16.5%
11,298 73,191 67,059 9.1% 18,239 17,510 4.2% 54,952 49,549 10.9%
Mid-Atlantic RegionMetropolitan DC 4,824 27,070 26,515 2.1% 8,996 8,847 1.7% 18,074 17,668 2.3%Baltimore, MD 2,122 9,202 9,080 1.3% 2,782 2,707 2.8% 6,420 6,373 0.7%Richmond, VA 1,358 4,932 4,783 3.1% 1,371 1,291 6.2% 3,561 3,492 2.0%
8,304 41,204 40,378 2.0% 13,149 12,845 2.4% 28,055 27,533 1.9%
Northeast RegionNew York, NY 1,945 23,853 22,541 5.8% 6,880 6,359 8.2% (2) 16,973 16,182 4.9% (2)
Boston, MA 1,179 8,217 7,754 6.0% 2,257 2,402 -6.0% 5,960 5,352 11.4%3,124 32,070 30,295 5.9% 9,137 8,761 4.3% 22,933 21,534 6.5%
Southeast RegionOrlando, FL 2,500 8,392 7,750 8.3% 2,484 2,435 2.1% 5,908 5,315 11.1%Tampa, FL 2,287 8,393 7,800 7.6% 2,756 2,758 -0.1% 5,637 5,042 11.8%Nashville, TN 2,260 7,645 7,145 7.0% 2,172 2,316 -6.1% 5,473 4,829 13.3%Other Florida 636 2,707 2,587 4.6% 928 886 4.7% 1,779 1,701 4.6%
7,683 27,137 25,282 7.3% 8,340 8,395 -0.6% 18,797 16,887 11.3%
Southwest RegionDallas, TX 2,725 9,762 9,223 5.8% 3,466 3,467 0.0% 6,296 5,756 9.4%Austin, TX 883 3,381 3,250 4.0% 1,450 1,383 4.9% 1,931 1,867 3.4%
3,608 13,143 12,473 5.4% 4,916 4,850 1.4% 8,227 7,623 7.9%
Totals 34,017 186,745$ 175,487$ 6.4% 53,781$ 52,361$ 2.7% (2) 132,964$ 123,126$ 8.0% (2)
(1) See Attachment 16 for definitions and other terms.
Expenses Net Operating Income
(2) 1Q16 presented above includes $70 thousand of higher New York real estate taxes due to 421 exemption and abatement reductions. Had the Same Store Expense included 100% of the NY real estate taxes before 421 savings, in all periods presented, the percent change in Total Same Store expense and NOI would have been 2.4% and 8.2%, respectively; and the percent change in New York expense and NOI would have been 4.9% and 6.4%, respectively.
Attachment 8(B)
UDR, Inc.Same-Store Operating Information By Major Market (1)
Current Quarter vs. Prior Year QuarterMarch 31, 2016
15
(Unaudited)
Total Same-Store ($000s)
Revenues
Total Same-Store
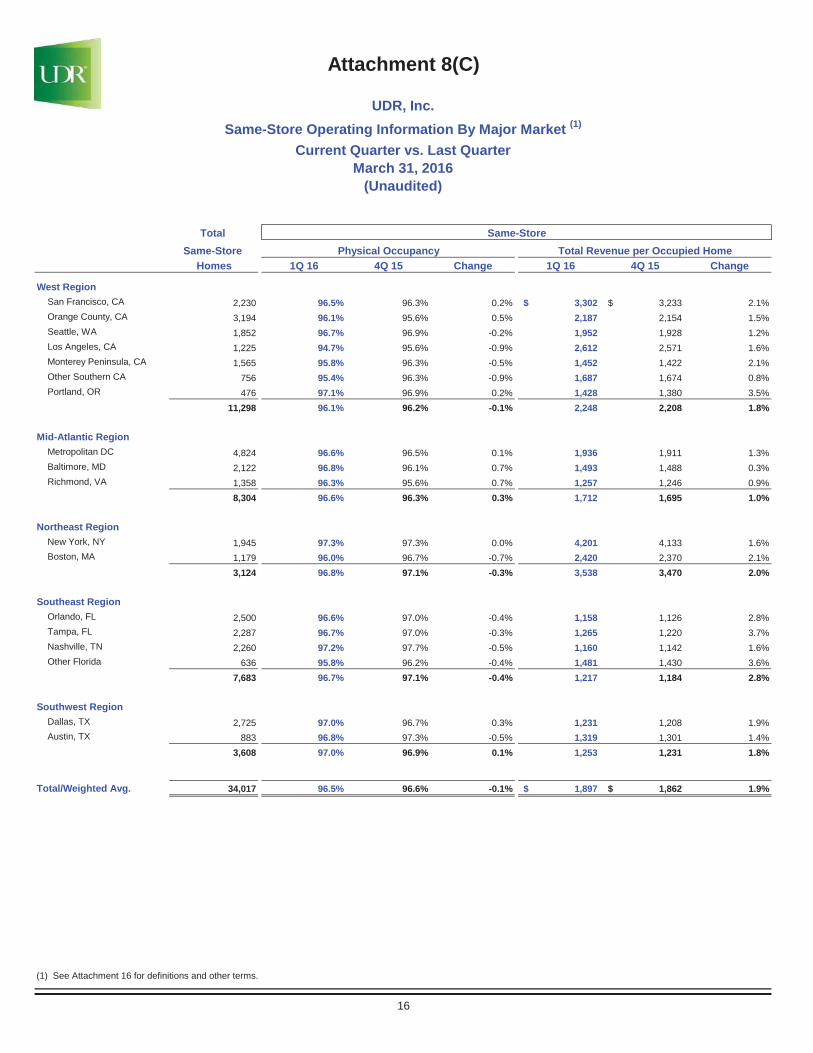
Homes 1Q 16 4Q 15 Change 1Q 16 4Q 15 Change
West RegionSan Francisco, CA 2,230 96.5% 96.3% 0.2% 3,302$ 3,233$ 2.1%Orange County, CA 3,194 96.1% 95.6% 0.5% 2,187 2,154 1.5%Seattle, WA 1,852 96.7% 96.9% -0.2% 1,952 1,928 1.2%Los Angeles, CA 1,225 94.7% 95.6% -0.9% 2,612 2,571 1.6%Monterey Peninsula, CA 1,565 95.8% 96.3% -0.5% 1,452 1,422 2.1%Other Southern CA 756 95.4% 96.3% -0.9% 1,687 1,674 0.8%Portland, OR 476 97.1% 96.9% 0.2% 1,428 1,380 3.5%
11,298 96.1% 96.2% -0.1% 2,248 2,208 1.8%
Mid-Atlantic RegionMetropolitan DC 4,824 96.6% 96.5% 0.1% 1,936 1,911 1.3%Baltimore, MD 2,122 96.8% 96.1% 0.7% 1,493 1,488 0.3%Richmond, VA 1,358 96.3% 95.6% 0.7% 1,257 1,246 0.9%
8,304 96.6% 96.3% 0.3% 1,712 1,695 1.0%
Northeast RegionNew York, NY 1,945 97.3% 97.3% 0.0% 4,201 4,133 1.6%Boston, MA 1,179 96.0% 96.7% -0.7% 2,420 2,370 2.1%
3,124 96.8% 97.1% -0.3% 3,538 3,470 2.0%
Southeast RegionOrlando, FL 2,500 96.6% 97.0% -0.4% 1,158 1,126 2.8%Tampa, FL 2,287 96.7% 97.0% -0.3% 1,265 1,220 3.7%Nashville, TN 2,260 97.2% 97.7% -0.5% 1,160 1,142 1.6%Other Florida 636 95.8% 96.2% -0.4% 1,481 1,430 3.6%
7,683 96.7% 97.1% -0.4% 1,217 1,184 2.8%
Southwest RegionDallas, TX 2,725 97.0% 96.7% 0.3% 1,231 1,208 1.9%Austin, TX 883 96.8% 97.3% -0.5% 1,319 1,301 1.4%
3,608 97.0% 96.9% 0.1% 1,253 1,231 1.8%
Total/Weighted Avg. 34,017 96.5% 96.6% -0.1% 1,897$ 1,862$ 1.9%
(1) See Attachment 16 for definitions and other terms.
16
Same-StorePhysical Occupancy Total Revenue per Occupied Home
Attachment 8(C)
UDR, Inc.Same-Store Operating Information By Major Market (1)
Current Quarter vs. Last QuarterMarch 31, 2016
(Unaudited)
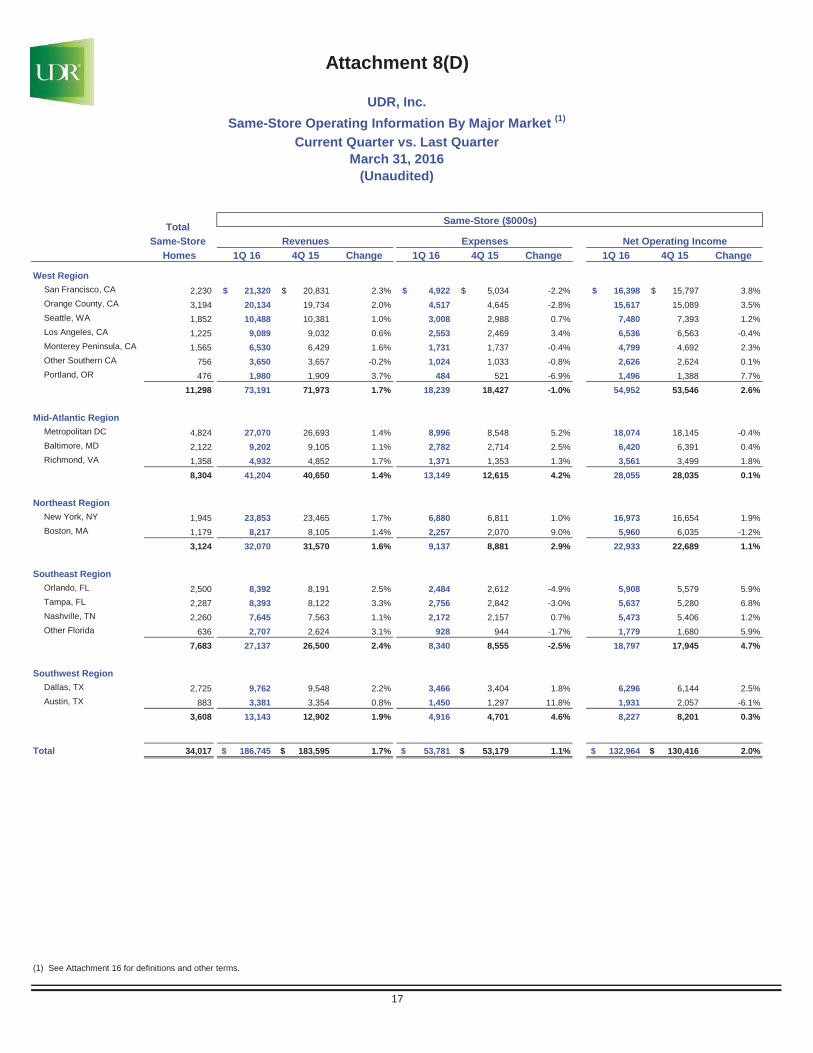
Same-Store Homes 1Q 16 4Q 15 Change 1Q 16 4Q 15 Change 1Q 16 4Q 15 Change
West RegionSan Francisco, CA 2,230 21,320$ 20,831$ 2.3% 4,922$ 5,034$ -2.2% 16,398$ 15,797$ 3.8%Orange County, CA 3,194 20,134 19,734 2.0% 4,517 4,645 -2.8% 15,617 15,089 3.5%Seattle, WA 1,852 10,488 10,381 1.0% 3,008 2,988 0.7% 7,480 7,393 1.2%Los Angeles, CA 1,225 9,089 9,032 0.6% 2,553 2,469 3.4% 6,536 6,563 -0.4%Monterey Peninsula, CA 1,565 6,530 6,429 1.6% 1,731 1,737 -0.4% 4,799 4,692 2.3%Other Southern CA 756 3,650 3,657 -0.2% 1,024 1,033 -0.8% 2,626 2,624 0.1%Portland, OR 476 1,980 1,909 3.7% 484 521 -6.9% 1,496 1,388 7.7%
11,298 73,191 71,973 1.7% 18,239 18,427 -1.0% 54,952 53,546 2.6%
Mid-Atlantic RegionMetropolitan DC 4,824 27,070 26,693 1.4% 8,996 8,548 5.2% 18,074 18,145 -0.4%Baltimore, MD 2,122 9,202 9,105 1.1% 2,782 2,714 2.5% 6,420 6,391 0.4%Richmond, VA 1,358 4,932 4,852 1.7% 1,371 1,353 1.3% 3,561 3,499 1.8%
8,304 41,204 40,650 1.4% 13,149 12,615 4.2% 28,055 28,035 0.1%
Northeast RegionNew York, NY 1,945 23,853 23,465 1.7% 6,880 6,811 1.0% 16,973 16,654 1.9%Boston, MA 1,179 8,217 8,105 1.4% 2,257 2,070 9.0% 5,960 6,035 -1.2%
3,124 32,070 31,570 1.6% 9,137 8,881 2.9% 22,933 22,689 1.1%
Southeast RegionOrlando, FL 2,500 8,392 8,191 2.5% 2,484 2,612 -4.9% 5,908 5,579 5.9%Tampa, FL 2,287 8,393 8,122 3.3% 2,756 2,842 -3.0% 5,637 5,280 6.8%Nashville, TN 2,260 7,645 7,563 1.1% 2,172 2,157 0.7% 5,473 5,406 1.2%Other Florida 636 2,707 2,624 3.1% 928 944 -1.7% 1,779 1,680 5.9%
7,683 27,137 26,500 2.4% 8,340 8,555 -2.5% 18,797 17,945 4.7%
Southwest RegionDallas, TX 2,725 9,762 9,548 2.2% 3,466 3,404 1.8% 6,296 6,144 2.5%Austin, TX 883 3,381 3,354 0.8% 1,450 1,297 11.8% 1,931 2,057 -6.1%
3,608 13,143 12,902 1.9% 4,916 4,701 4.6% 8,227 8,201 0.3%
Total 34,017 186,745$ 183,595$ 1.7% 53,781$ 53,179$ 1.1% 132,964$ 130,416$ 2.0%
(1) See Attachment 16 for definitions and other terms.
Expenses Net Operating Income
Attachment 8(D)
UDR, Inc.Same-Store Operating Information By Major Market (1)
Current Quarter vs. Last QuarterMarch 31, 2016
17
(Unaudited)
Total Same-Store ($000s)
Revenues
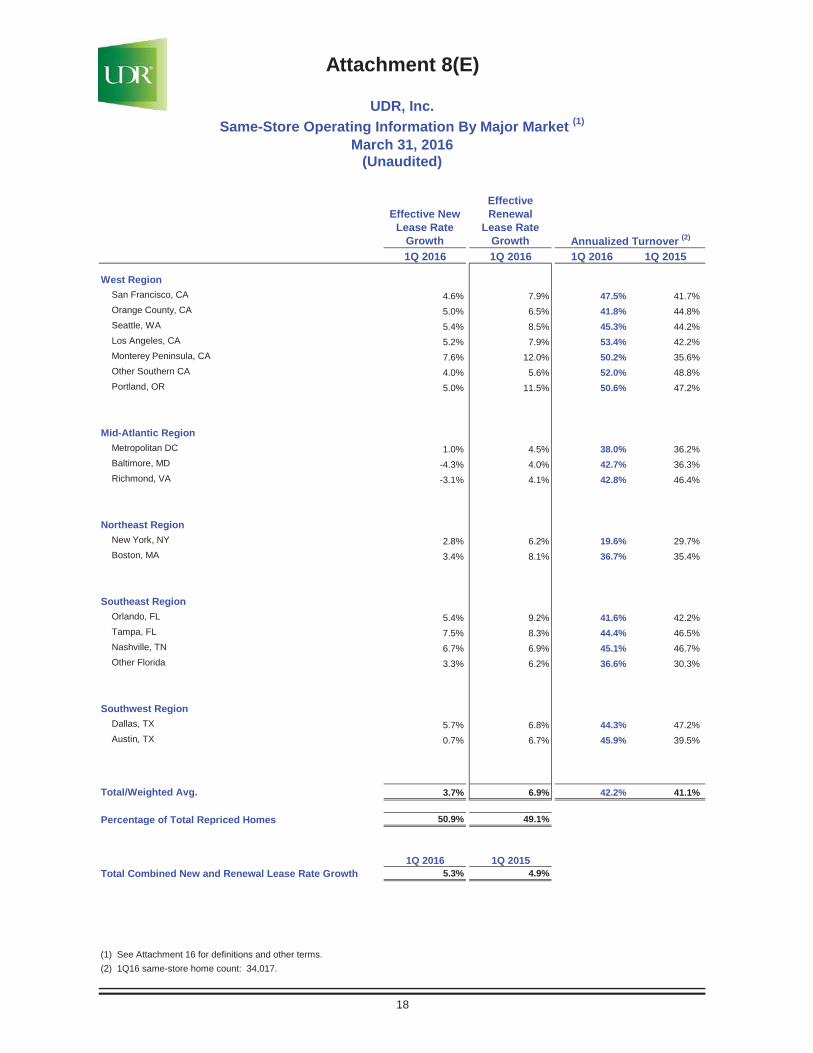
Effective New Lease Rate
Growth
Effective Renewal
Lease Rate Growth
1Q 2016 1Q 2016 1Q 2016 1Q 2015
West RegionSan Francisco, CA 4.6% 7.9% 47.5% 41.7%Orange County, CA 5.0% 6.5% 41.8% 44.8%Seattle, WA 5.4% 8.5% 45.3% 44.2%Los Angeles, CA 5.2% 7.9% 53.4% 42.2%Monterey Peninsula, CA 7.6% 12.0% 50.2% 35.6%Other Southern CA 4.0% 5.6% 52.0% 48.8%Portland, OR 5.0% 11.5% 50.6% 47.2%
Mid-Atlantic RegionMetropolitan DC 1.0% 4.5% 38.0% 36.2%Baltimore, MD -4.3% 4.0% 42.7% 36.3%Richmond, VA -3.1% 4.1% 42.8% 46.4%
Northeast RegionNew York, NY 2.8% 6.2% 19.6% 29.7%Boston, MA 3.4% 8.1% 36.7% 35.4%
Southeast RegionOrlando, FL 5.4% 9.2% 41.6% 42.2%Tampa, FL 7.5% 8.3% 44.4% 46.5%Nashville, TN 6.7% 6.9% 45.1% 46.7%Other Florida 3.3% 6.2% 36.6% 30.3%
Southwest RegionDallas, TX 5.7% 6.8% 44.3% 47.2%Austin, TX 0.7% 6.7% 45.9% 39.5%
Total/Weighted Avg. 3.7% 6.9% 42.2% 41.1%
Percentage of Total Repriced Homes 50.9% 49.1%
1Q 2016 1Q 2015Total Combined New and Renewal Lease Rate Growth 5.3% 4.9%
(1) See Attachment 16 for definitions and other terms.(2) 1Q16 same-store home count: 34,017.
Annualized Turnover (2)
18
Attachment 8(E)
UDR, Inc.Same-Store Operating Information By Major Market (1)
March 31, 2016(Unaudited)
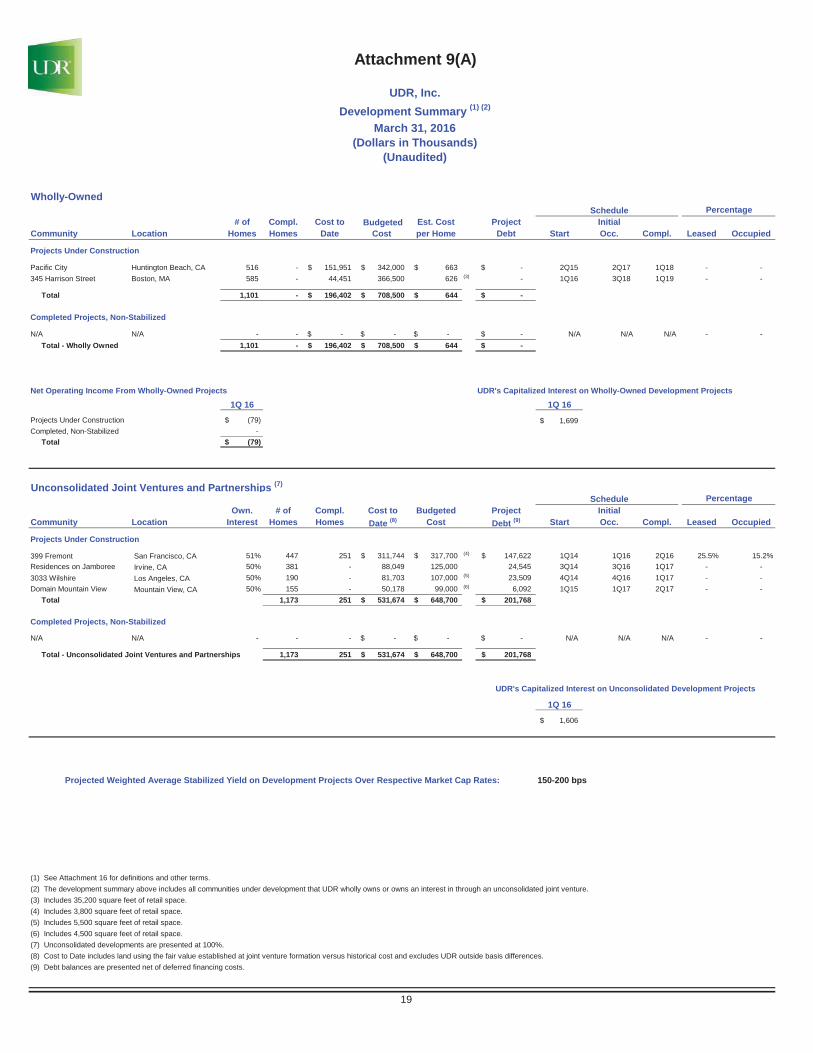
Wholly-OwnedSchedule
# of Compl. Cost to Budgeted Est. Cost Project InitialCommunity Location Homes Homes Date Cost per Home Debt Start Occ. Compl. Leased Occupied
Projects Under Construction
Pacific City Huntington Beach, CA 516 - 151,951$ 342,000$ 663$ -$ 2Q15 2Q17 1Q18 - -345 Harrison Street Boston, MA 585 - 44,451 366,500 626 (3) - 1Q16 3Q18 1Q19 - -
Total 1,101 - 196,402$ 708,500$ 644$ -$
Completed Projects, Non-Stabilized
N/A N/A - - -$ -$ -$ -$ N/A N/A N/A - -Total - Wholly Owned 1,101 - 196,402$ 708,500$ 644$ -$
Net Operating Income From Wholly-Owned Projects UDR's Capitalized Interest on Wholly-Owned Development Projects
1Q 16 1Q 16Projects Under Construction (79)$ 1,699$Completed, Non-Stabilized -
Total (79)$
Unconsolidated Joint Ventures and Partnerships (7)
ScheduleOwn. # of Compl. Cost to Budgeted Project Initial
Community Location Interest Homes Homes Date (8) Cost Debt (9) Start Occ. Compl. Leased Occupied
Projects Under Construction
399 Fremont San Francisco, CA 51% 447 251 311,744$ 317,700$ (4) 147,622$ 1Q14 1Q16 2Q16 25.5% 15.2%Residences on Jamboree Irvine, CA 50% 381 - 88,049 125,000 24,545 3Q14 3Q16 1Q17 - -3033 Wilshire Los Angeles, CA 50% 190 - 81,703 107,000 (5) 23,509 4Q14 4Q16 1Q17 - -Domain Mountain View Mountain View, CA 50% 155 - 50,178 99,000 (6) 6,092 1Q15 1Q17 2Q17 - -
Total 1,173 251 531,674$ 648,700$ 201,768$
Completed Projects, Non-Stabilized
N/A N/A - - - -$ -$ -$ N/A N/A N/A - -
Total - Unconsolidated Joint Ventures and Partnerships 1,173 251 531,674$ 648,700$ 201,768$
1Q 16
1,606$
150-200 bps
(1) See Attachment 16 for definitions and other terms.(2) The development summary above includes all communities under development that UDR wholly owns or owns an interest in through an unconsolidated joint venture.(3) Includes 35,200 square feet of retail space.(4) Includes 3,800 square feet of retail space.(5) Includes 5,500 square feet of retail space.(6) Includes 4,500 square feet of retail space.(7) Unconsolidated developments are presented at 100%.(8) Cost to Date includes land using the fair value established at joint venture formation versus historical cost and excludes UDR outside basis differences. (9) Debt balances are presented net of deferred financing costs.
Attachment 9(A)
UDR, Inc.Development Summary (1) (2)
March 31, 2016(Dollars in Thousands)
UDR's Capitalized Interest on Unconsolidated Development Projects
Projected Weighted Average Stabilized Yield on Development Projects Over Respective Market Cap Rates:
19
(Unaudited)
Percentage
Percentage
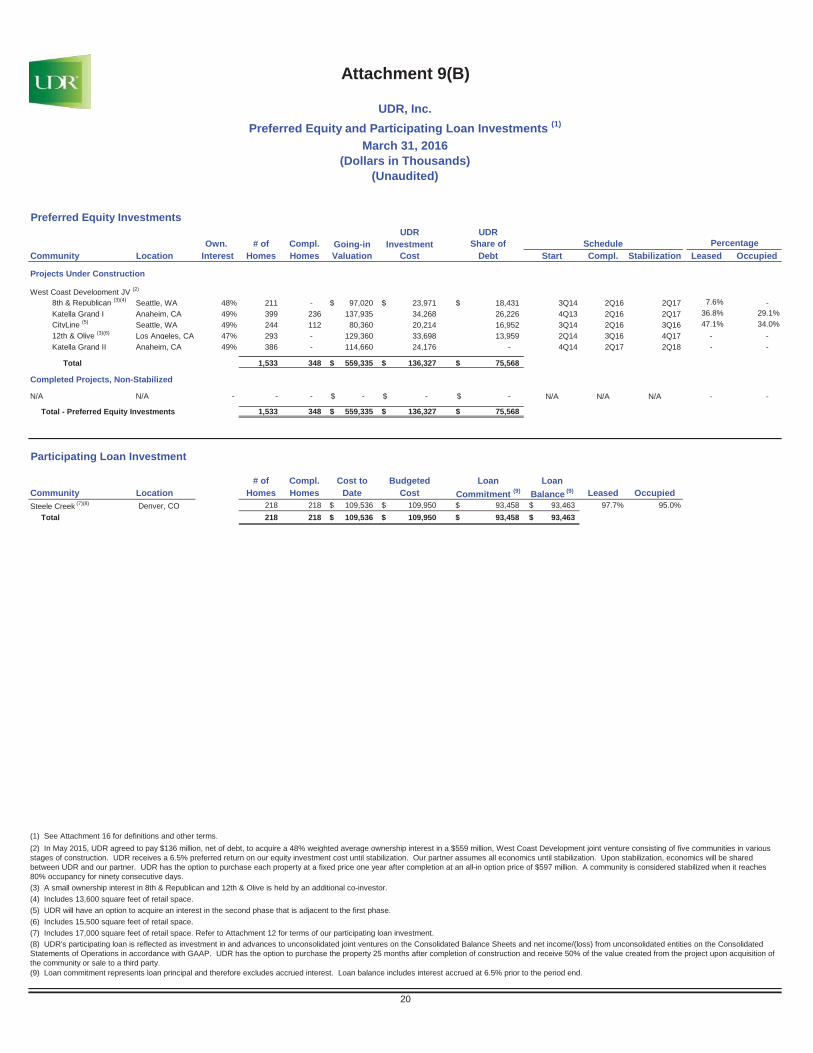
Preferred Equity InvestmentsUDR UDR
Own. # of Compl. Going-in Investment Share of ScheduleCommunity Location Interest Homes Homes Valuation Cost Debt Start Compl. Stabilization Leased Occupied
Projects Under Construction
West Coast Development JV (2)
8th & Republican (3)(4) Seattle, WA 48% 211 - 97,020$ 23,971$ 18,431$ 3Q14 2Q16 2Q17 7.6% -Katella Grand I Anaheim, CA 49% 399 236 137,935 34,268 26,226 4Q13 2Q16 2Q17 36.8% 29.1%CityLine (5) Seattle, WA 49% 244 112 80,360 20,214 16,952 3Q14 2Q16 3Q16 47.1% 34.0%12th & Olive (3)(6) Los Angeles, CA 47% 293 - 129,360 33,698 13,959 2Q14 3Q16 4Q17 - -Katella Grand II Anaheim, CA 49% 386 - 114,660 24,176 - 4Q14 2Q17 2Q18 - -
Total 1,533 348 559,335$ 136,327$ 75,568$
Completed Projects, Non-Stabilized
N/A N/A - - - -$ -$ -$ N/A N/A N/A - -
Total - Preferred Equity Investments 1,533 348 559,335$ 136,327$ 75,568$
Participating Loan Investment
# of Compl. Cost to Budgeted Loan LoanCommunity Location Homes Homes Date Cost Commitment (9) Balance (9) Leased OccupiedSteele Creek (7)(8) Denver, CO 218 218 109,536$ 109,950$ 93,458$ 93,463$ 97.7% 95.0%
Total 218 218 109,536$ 109,950$ 93,458$ 93,463$
(1) See Attachment 16 for definitions and other terms.
(3) A small ownership interest in 8th & Republican and 12th & Olive is held by an additional co-investor.(4) Includes 13,600 square feet of retail space.(5) UDR will have an option to acquire an interest in the second phase that is adjacent to the first phase.(6) Includes 15,500 square feet of retail space.(7) Includes 17,000 square feet of retail space. Refer to Attachment 12 for terms of our participating loan investment.
Percentage
(9) Loan commitment represents loan principal and therefore excludes accrued interest. Loan balance includes interest accrued at 6.5% prior to the period end.
(8) UDR's participating loan is reflected as investment in and advances to unconsolidated joint ventures on the Consolidated Balance Sheets and net income/(loss) from unconsolidated entities on the Consolidated Statements of Operations in accordance with GAAP. UDR has the option to purchase the property 25 months after completion of construction and receive 50% of the value created from the project upon acquisition of the community or sale to a third party.
20
(2) In May 2015, UDR agreed to pay $136 million, net of debt, to acquire a 48% weighted average ownership interest in a $559 million, West Coast Development joint venture consisting of five communities in various stages of construction. UDR receives a 6.5% preferred return on our equity investment cost until stabilization. Our partner assumes all economics until stabilization. Upon stabilization, economics will be shared between UDR and our partner. UDR has the option to purchase each property at a fixed price one year after completion at an all-in option price of $597 million. A community is considered stabilized when it reaches 80% occupancy for ninety consecutive days.
Attachment 9(B)
UDR, Inc.Preferred Equity and Participating Loan Investments (1)
March 31, 2016(Dollars in Thousands)
(Unaudited)
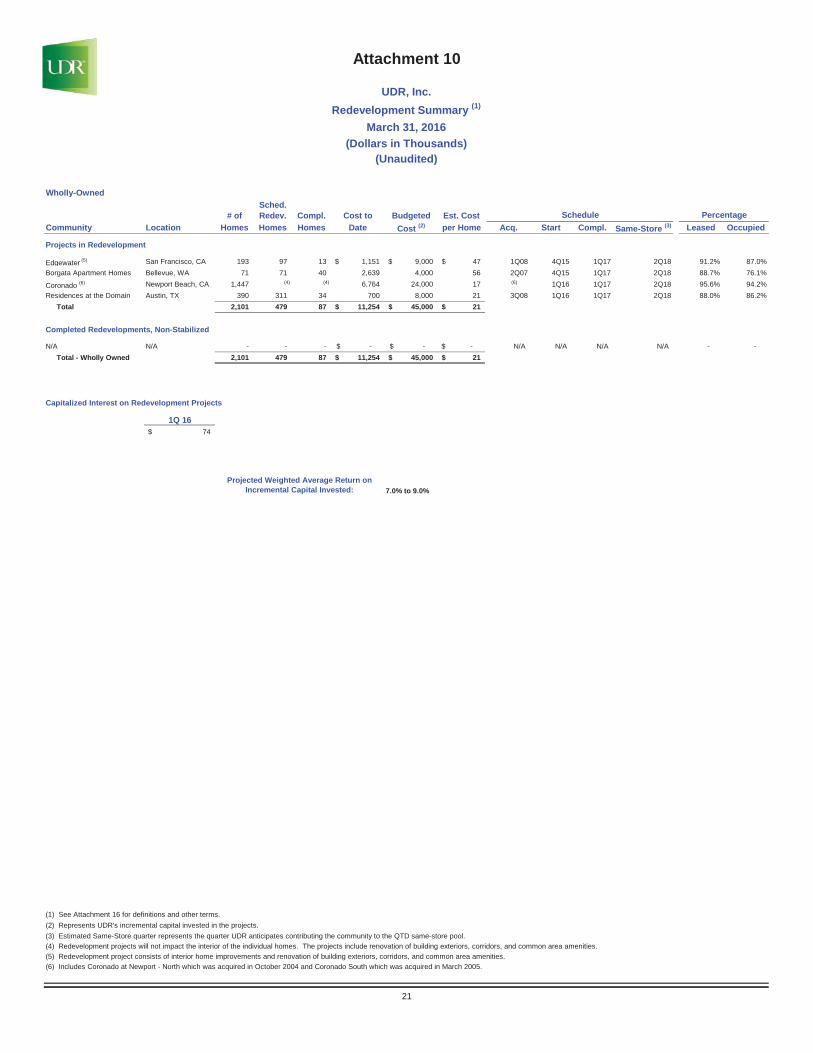
Wholly-OwnedSched.
# of Redev. Compl. Cost to Budgeted Est. CostCommunity Location Homes Homes Homes Date Cost (2) per Home Acq. Start Compl. Same-Store (3) Leased Occupied
Projects in Redevelopment
Edgewater (5) San Francisco, CA 193 97 13 1,151$ 9,000$ 47$ 1Q08 4Q15 1Q17 2Q18 91.2% 87.0%Borgata Apartment Homes Bellevue, WA 71 71 40 2,639 4,000 56 2Q07 4Q15 1Q17 2Q18 88.7% 76.1%
Coronado (6) Newport Beach, CA 1,447 (4) (4) 6,764 24,000 17 (6) 1Q16 1Q17 2Q18 95.6% 94.2%Residences at the Domain Austin, TX 390 311 34 700 8,000 21 3Q08 1Q16 1Q17 2Q18 88.0% 86.2%
Total 2,101 479 87 11,254$ 45,000$ 21$
Completed Redevelopments, Non-Stabilized
N/A N/A - - - -$ -$ -$ N/A N/A N/A N/A - -Total - Wholly Owned 2,101 479 87 11,254$ 45,000$ 21$
Capitalized Interest on Redevelopment Projects
1Q 1674$
7.0% to 9.0%
(1) See Attachment 16 for definitions and other terms.(2) Represents UDR's incremental capital invested in the projects.(3) Estimated Same-Store quarter represents the quarter UDR anticipates contributing the community to the QTD same-store pool.(4) Redevelopment projects will not impact the interior of the individual homes. The projects include renovation of building exteriors, corridors, and common area amenities.(5) Redevelopment project consists of interior home improvements and renovation of building exteriors, corridors, and common area amenities.(6) Includes Coronado at Newport - North which was acquired in October 2004 and Coronado South which was acquired in March 2005.
Attachment 10
UDR, Inc.Redevelopment Summary (1)
March 31, 2016(Dollars in Thousands)
Percentage
Projected Weighted Average Return on Incremental Capital Invested:
21
(Unaudited)
Schedule
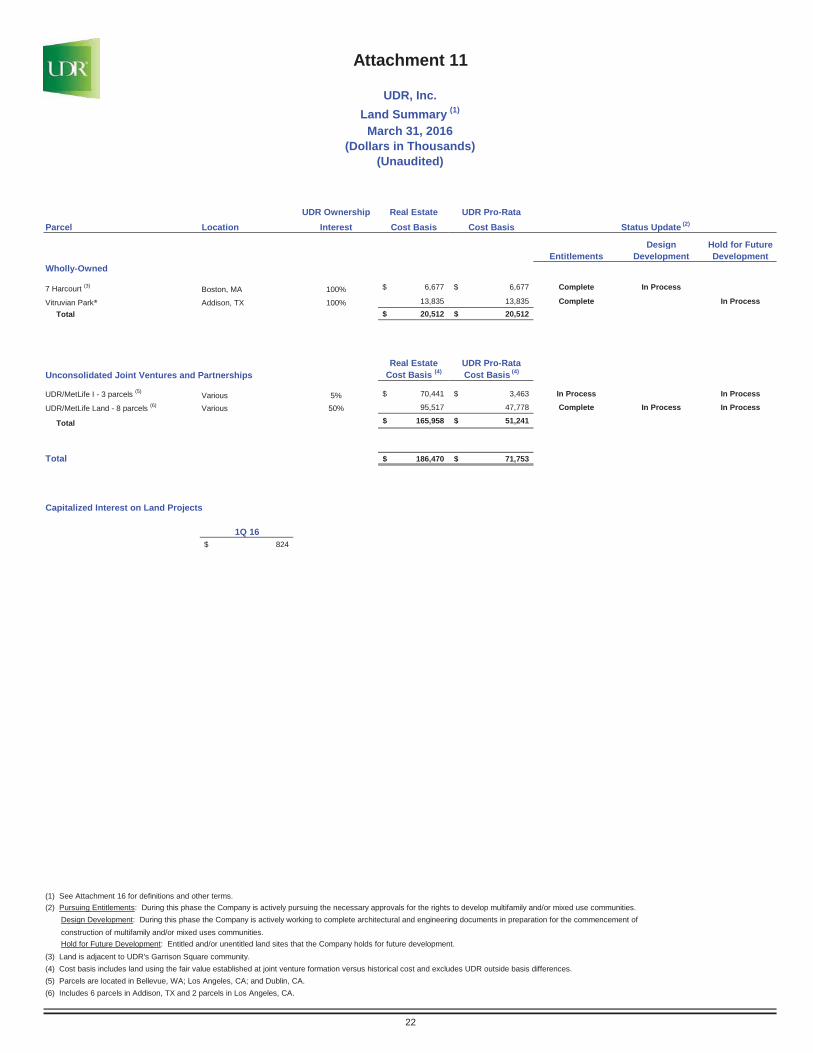
UDR Ownership Real Estate UDR Pro-RataParcel Location Interest Cost Basis Cost Basis
Design Hold for FutureEntitlements Development Development
Wholly-Owned
7 Harcourt (3) Boston, MA 100% 6,677$ 6,677$ Complete In Process
Vitruvian Park® Addison, TX 100% 13,835 13,835 Complete In ProcessTotal 20,512$ 20,512$
Real Estate UDR Pro-RataUnconsolidated Joint Ventures and Partnerships Cost Basis (4) Cost Basis (4)
UDR/MetLife I - 3 parcels (5) Various 5% 70,441$ 3,463$ In Process In Process
UDR/MetLife Land - 8 parcels (6) Various 50% 95,517 47,778 Complete In Process In Process
Total 165,958$ 51,241$
Total 186,470$ 71,753$
Capitalized Interest on Land Projects
1Q 16824$
(1) See Attachment 16 for definitions and other terms.(2) Pursuing Entitlements: During this phase the Company is actively pursuing the necessary approvals for the rights to develop multifamily and/or mixed use communities.
Design Development: During this phase the Company is actively working to complete architectural and engineering documents in preparation for the commencement of construction of multifamily and/or mixed uses communities.
Hold for Future Development: Entitled and/or unentitled land sites that the Company holds for future development. (3) Land is adjacent to UDR's Garrison Square community. (4) Cost basis includes land using the fair value established at joint venture formation versus historical cost and excludes UDR outside basis differences. (5) Parcels are located in Bellevue, WA; Los Angeles, CA; and Dublin, CA.(6) Includes 6 parcels in Addison, TX and 2 parcels in Los Angeles, CA.
March 31, 2016(Dollars in Thousands)
(Unaudited)
Attachment 11
Status Update (2)
22
UDR, Inc.Land Summary (1)
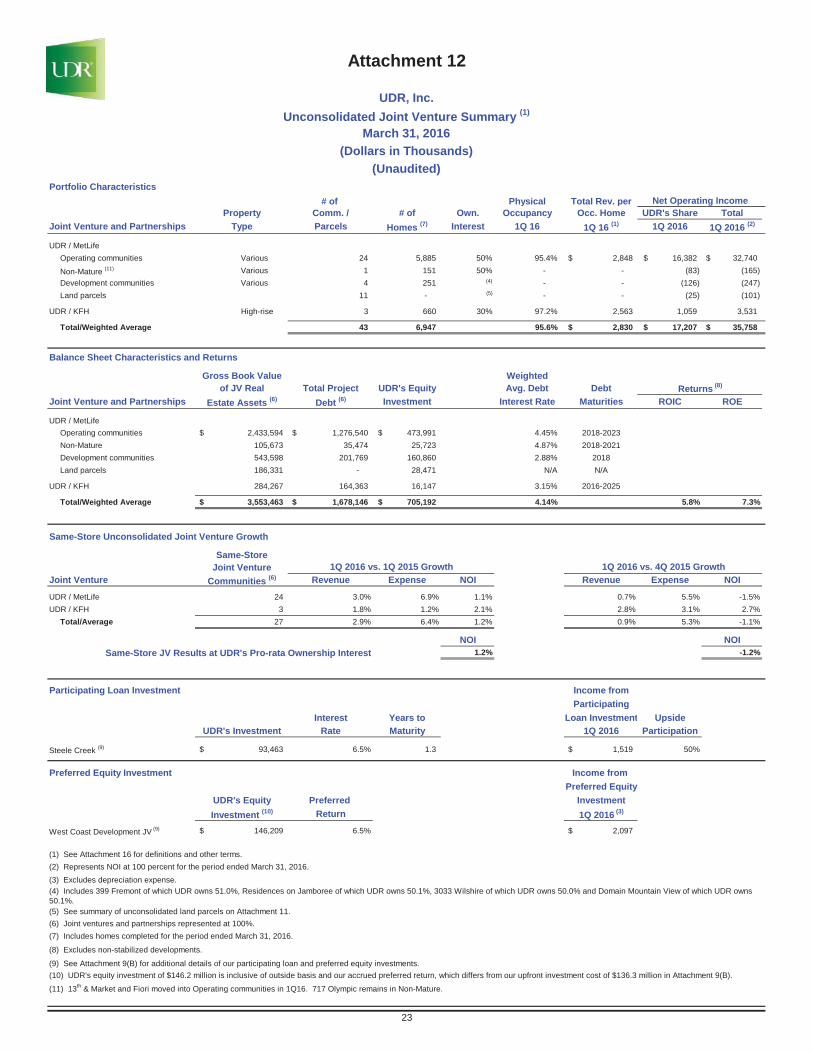
Portfolio Characteristics# of Physical Total Rev. per
Property Comm. / # of Own. Occupancy Occ. Home UDR's Share TotalJoint Venture and Partnerships Type Parcels Homes (7) Interest 1Q 16 1Q 16 (1) 1Q 2016 1Q 2016 (2)
UDR / MetLife Operating communities Various 24 5,885 50% 95.4% 2,848$ 16,382$ 32,740$
Non-Mature (11) Various 1 151 50% - - (83) (165)Development communities Various 4 251 (4) - - (126) (247)Land parcels 11 - (5) - - (25) (101)
UDR / KFH High-rise 3 660 30% 97.2% 2,563 1,059 3,531
Total/Weighted Average 43 6,947 95.6% 2,830$ 17,207$ 35,758$
Balance Sheet Characteristics and Returns
Gross Book Value Weightedof JV Real Total Project UDR's Equity Avg. Debt Debt
Joint Venture and Partnerships Estate Assets (6) Debt (6) Investment Interest Rate Maturities ROIC ROE
UDR / MetLife Operating communities 2,433,594$ 1,276,540$ 473,991$ 4.45% 2018-2023Non-Mature 105,673 35,474 25,723 4.87% 2018-2021Development communities 543,598 201,769 160,860 2.88% 2018Land parcels 186,331 - 28,471 N/A N/A
UDR / KFH 284,267 164,363 16,147 3.15% 2016-2025
Total/Weighted Average 3,553,463$ 1,678,146$ 705,192$ 4.14% 5.8% 7.3%
Same-Store Unconsolidated Joint Venture Growth
Same-StoreJoint Venture
Joint Venture Communities (6) Revenue Expense NOI Revenue Expense NOI
UDR / MetLife 24 3.0% 6.9% 1.1% 0.7% 5.5% -1.5%UDR / KFH 3 1.8% 1.2% 2.1% 2.8% 3.1% 2.7%
Total/Average 27 2.9% 6.4% 1.2% 0.9% 5.3% -1.1%
NOI NOI1.2% -1.2%
Participating Loan Investment Income fromParticipating
Interest Years to Loan Investment UpsideUDR's Investment Rate Maturity 1Q 2016 Participation
Steele Creek (9) 93,463$ 6.5% 1.3 1,519$ 50%
Preferred Equity Investment Income from Preferred Equity
UDR's Equity Preferred InvestmentInvestment (10) Return 1Q 2016 (3)
West Coast Development JV (9) 146,209$ 6.5% 2,097$
(1) See Attachment 16 for definitions and other terms.(2) Represents NOI at 100 percent for the period ended March 31, 2016.(3) Excludes depreciation expense.
(6) Joint ventures and partnerships represented at 100%.(7) Includes homes completed for the period ended March 31, 2016.
(8) Excludes non-stabilized developments.
(9) See Attachment 9(B) for additional details of our participating loan and preferred equity investments.
(11) 13th & Market and Fiori moved into Operating communities in 1Q16. 717 Olympic remains in Non-Mature.
Returns (8)
Attachment 12
UDR, Inc.Unconsolidated Joint Venture Summary (1)
March 31, 2016(Dollars in Thousands)
(Unaudited)
Net Operating Income
1Q 2016 vs. 1Q 2015 Growth 1Q 2016 vs. 4Q 2015 Growth
23
Same-Store JV Results at UDR's Pro-rata Ownership Interest
(5) See summary of unconsolidated land parcels on Attachment 11.
(10) UDR's equity investment of $146.2 million is inclusive of outside basis and our accrued preferred return, which differs from our upfront investment cost of $136.3 million in Attachment 9(B).
(4) Includes 399 Fremont of which UDR owns 51.0%, Residences on Jamboree of which UDR owns 50.1%, 3033 Wilshire of which UDR owns 50.0% and Domain Mountain View of which UDR owns 50.1%.
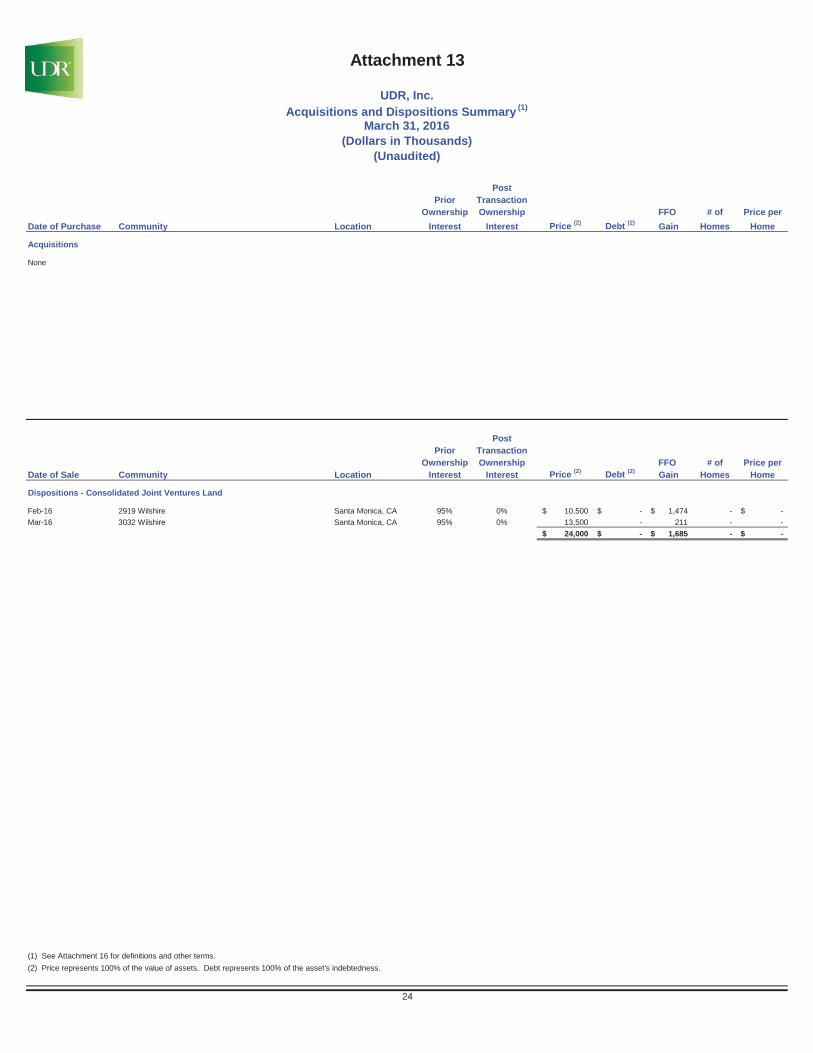
PostPrior Transaction
Ownership Ownership FFO # of Price perDate of Purchase Community Location Interest Interest Price (2) Debt (2) Gain Homes Home
Acquisitions
None
PostPrior Transaction
Ownership Ownership FFO # of Price perDate of Sale Community Location Interest Interest Price (2) Debt (2) Gain Homes Home
Dispositions - Consolidated Joint Ventures Land
Feb-16 2919 Wilshire Santa Monica, CA 95% 0% 10,500$ -$ 1,474$ - -$Mar-16 3032 Wilshire Santa Monica, CA 95% 0% 13,500 - 211 - -
24,000$ -$ 1,685$ - -$
(1) See Attachment 16 for definitions and other terms.(2) Price represents 100% of the value of assets. Debt represents 100% of the asset's indebtedness.
24
Attachment 13
UDR, Inc.Acquisitions and Dispositions Summary (1)
(Unaudited)
March 31, 2016(Dollars in Thousands)
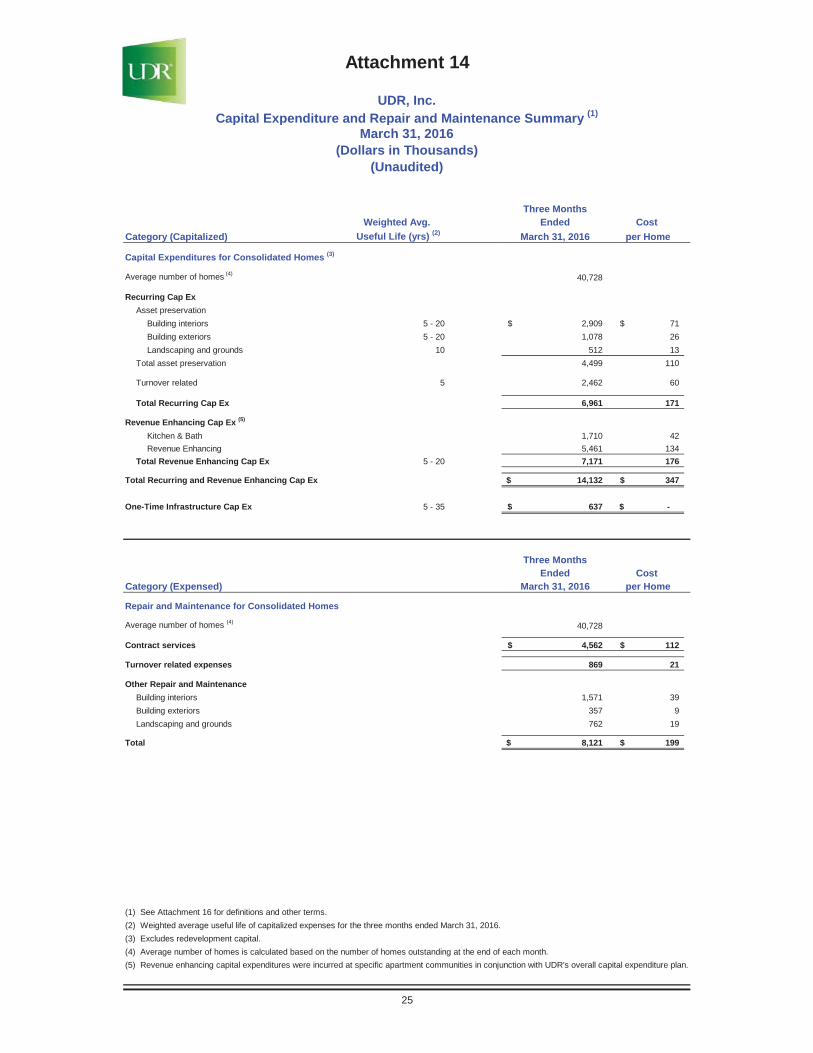
Three MonthsWeighted Avg. Ended Cost
Category (Capitalized) Useful Life (yrs) (2) March 31, 2016 per Home
Capital Expenditures for Consolidated Homes (3)
Average number of homes (4) 40,728
Recurring Cap ExAsset preservation
Building interiors 5 - 20 2,909$ 71$Building exteriors 5 - 20 1,078 26Landscaping and grounds 10 512 13
Total asset preservation 4,499 110
Turnover related 5 2,462 60
Total Recurring Cap Ex 6,961 171
Revenue Enhancing Cap Ex (5)
Kitchen & Bath 1,710 42Revenue Enhancing 5,461 134
Total Revenue Enhancing Cap Ex 5 - 20 7,171 176
Total Recurring and Revenue Enhancing Cap Ex 14,132$ 347$
One-Time Infrastructure Cap Ex 5 - 35 637$ -$
Three MonthsEnded Cost
Category (Expensed) March 31, 2016 per Home
Repair and Maintenance for Consolidated Homes
Average number of homes (4) 40,728
Contract services 4,562$ 112$
Turnover related expenses 869 21
Other Repair and MaintenanceBuilding interiors 1,571 39Building exteriors 357 9Landscaping and grounds 762 19
Total 8,121$ 199$
(1) See Attachment 16 for definitions and other terms.(2) Weighted average useful life of capitalized expenses for the three months ended March 31, 2016.(3) Excludes redevelopment capital.(4) Average number of homes is calculated based on the number of homes outstanding at the end of each month.
25
(5) Revenue enhancing capital expenditures were incurred at specific apartment communities in conjunction with UDR's overall capital expenditure plan.
Attachment 14
UDR, Inc.Capital Expenditure and Repair and Maintenance Summary (1)
March 31, 2016(Dollars in Thousands)
(Unaudited)
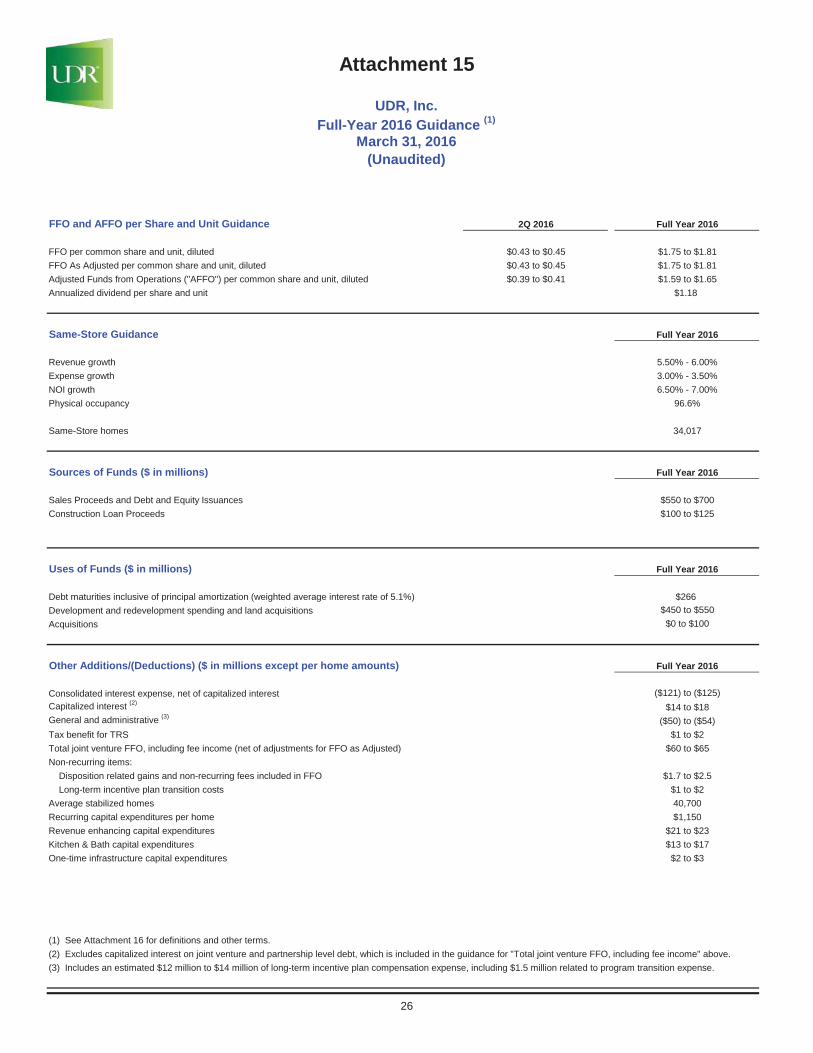
FFO and AFFO per Share and Unit Guidance 2Q 2016 Full Year 2016
FFO per common share and unit, diluted $0.43 to $0.45 $1.75 to $1.81FFO As Adjusted per common share and unit, diluted $0.43 to $0.45 $1.75 to $1.81Adjusted Funds from Operations ("AFFO") per common share and unit, diluted $0.39 to $0.41 $1.59 to $1.65Annualized dividend per share and unit $1.18
Same-Store Guidance Full Year 2016
Revenue growth 5.50% - 6.00%Expense growth 3.00% - 3.50%NOI growth 6.50% - 7.00%Physical occupancy 96.6%
Same-Store homes 34,017
Sources of Funds ($ in millions) Full Year 2016
Sales Proceeds and Debt and Equity Issuances $550 to $700Construction Loan Proceeds $100 to $125
Uses of Funds ($ in millions) Full Year 2016
Debt maturities inclusive of principal amortization (weighted average interest rate of 5.1%) $266Development and redevelopment spending and land acquisitions $450 to $550Acquisitions $0 to $100
Other Additions/(Deductions) ($ in millions except per home amounts) Full Year 2016
Consolidated interest expense, net of capitalized interest ($121) to ($125)Capitalized interest (2) $14 to $18General and administrative (3) ($50) to ($54)Tax benefit for TRS $1 to $2Total joint venture FFO, including fee income (net of adjustments for FFO as Adjusted) $60 to $65Non-recurring items: Disposition related gains and non-recurring fees included in FFO $1.7 to $2.5 Long-term incentive plan transition costs $1 to $2Average stabilized homes 40,700Recurring capital expenditures per home $1,150Revenue enhancing capital expenditures $21 to $23Kitchen & Bath capital expenditures $13 to $17One-time infrastructure capital expenditures $2 to $3
(1) See Attachment 16 for definitions and other terms.(2) Excludes capitalized interest on joint venture and partnership level debt, which is included in the guidance for "Total joint venture FFO, including fee income" above.(3) Includes an estimated $12 million to $14 million of long-term incentive plan compensation expense, including $1.5 million related to program transition expense.
Attachment 15
UDR, Inc.
March 31, 2016Full-Year 2016 Guidance (1)
26
(Unaudited)
Interest Coverage Ratio: The Company defines Interest Coverage Ratio as net income, excluding the impact of interest expense, real estate depreciation and amortization of wholly owned and joint venture communities, other depreciation and amortization, noncontrolling interests, net gain/(loss) on the sale of real estate owned, TRS income tax, divided by total interest.
Management considers interest coverage ratio a useful metric for investors as it provides ratings agencies, investors and lending partners with a widely-used measure of the Company’s ability to service its debt obligations as well as compare leverage against that of its peer REITs. A reconciliation of the components that comprise interest coverage ratio is provided on Attachment 4(C) of the Company's quarterly supplemental disclosure.
Attachment 16(A)
UDR, Inc.Definitions and Reconciliations
March 31, 2016(Unaudited)
Adjusted Funds From Operations ("AFFO") attributable to common stockholders and unitholders: The Company defines AFFO as FFO as Adjusted attributable to common stockholders and unitholders less recurring capital expenditures that are necessary to help preserve the value of and maintain functionality at our communities.
Effective New Lease Rate Growth: The Company defines effective new lease rate growth as the increase in gross potential rent realized less all concessions for the new lease term (current effective rent) versus prior resident effective rent for the prior lease term on all new leases commenced during the current quarter.
Management considers effective new lease rate growth a useful metric for investors as it assesses market-level new demand trends.
Management considers effective renewal lease rate growth a useful metric for investors as it assesses market-level, in-place demand trends.
Effective Renewal Lease Rate Growth: The Company defines effective renewal lease rate growth as the increase in gross potential rent realized less all concessions for the new lease term (current effective rent) versus prior effective rent for the prior lease term on all renewed leases commenced during the current quarter.
Acquired Communities: The Company defines Acquired Communities as those communities acquired by the Company, other than development and redevelopment activity, that did not achieve stabilization as of the most recent quarter.
Development Communities: The Company defines Development Communities as those communities recently developed or under development by the Company, that are currently majority owned by the Company and have not achieved stabilization as of the most recent quarter.
Management considers AFFO a useful supplemental performance metric for investors as it is more indicative of the Company's operational performance than FFO or FFO as Adjusted. AFFO is not intended to represent cash flow or liquidity for the period, and is only intended to provide an additional measure of our operating performance. The Company believes that net income attributable to common stockholders is the most directly comparable GAAP financial measure to AFFO. Management believes that AFFO is a widely recognized measure of the operations of REITs, and presenting AFFO will enable investors to assess our performance in comparison to other REITs. However, other REITs may use different methodologies for calculating AFFO and, accordingly, our AFFO may not always be comparable to AFFO calculated by other REITs. AFFO should not be considered as an alternative to net income (determined in accordance with GAAP) as an indication of financial performance, or as an alternative to cash flows from operating activities (determined in accordance with GAAP) as a measure of our liquidity, nor is it indicative of funds available to fund our cash needs, including our ability to make distributions. A reconciliation from net income attributable to common stockholders to AFFO is provided on Attachment 2.
27
Estimated Quarter of Completion: The Company defines estimated quarter of completion of a development or redevelopment project as the date on which construction is expected to be completed, but does not represent the date of stabilization.
Funds From Operations as Adjusted attributable to common stockholders and unitholders: The Company defines FFO attributable to common stockholders and unitholders as Adjusted as FFO excluding the impact of acquisition-related costs and other non-comparable items including, but not limited to, prepayment costs/benefits associated with early debt retirement, gains on sales of marketable securities and TRS property, deferred tax valuation allowance increases and decreases, casualty-related expenses and recoveries, severance costs and legal costs.
Management believes that FFO as Adjusted is useful supplemental information regarding our operating performance as it provides a consistent comparison of our operating performance across time periods and allows investors to more easily compare our operating results with other REITs. FFO as Adjusted is not intended to represent cash flow or liquidity for the period, and is only intended to provide an additional measure of our operating performance. The Company believes that net income attributable to common stockholders is the most directly comparable GAAP financial measure to FFO as Adjusted. However, other REITs may use different methodologies for calculating FFO as Adjusted or similar FFO measures and, accordingly, our FFO as Adjusted may not always be comparable to FFO as Adjusted or similar FFO measures calculated by other REITs. FFO as Adjusted should not be considered as an alternative to net income (determined in accordance with GAAP) as an indication of financial performance, or as an alternative to cash flows from operating activities (determined in accordance with GAAP) as a measure of our liquidity. A reconciliation from net income attributable to common stockholders to FFO as Adjusted is provided on Attachment 2.
Fixed Charge Coverage Ratio: The Company defines Fixed Charge Coverage Ratio as net income, excluding the impact of interest expense, real estate depreciation and amortization of wholly owned and other joint venture communities, other depreciation and amortization, noncontrolling interests, net gain/(loss) on the sale of real estate owned, TRS income tax, divided by total interest plus preferred dividends.
Management considers fixed charge coverage a useful metric for investors as it provides ratings agencies, investors and lending partners with a widely-used measure of the Company’s ability to service its debt obligations as well as compare leverage against that of its peer REITs. A reconciliation of the components that comprise fixed charge coverage is provided on Attachment 4(C) of the Company's quarterly supplemental disclosure.
Funds From Operations ("FFO") attributable to common stockholders and unitholders: The Company defines FFO as net income attributable to common stockholders and unitholders, excluding impairment write-downs of depreciable real estate or of investments in non-consolidated investees that are driven by measurable decreases in the fair value of depreciable real estate held by the investee, gains (or losses) from sales of depreciable property, plus real estate depreciation and amortization, and after adjustments for noncontrolling interests, unconsolidated partnerships and joint ventures. This definition conforms with the National Association of Real Estate Investment Trust's definition issued in April 2002. In the computation of diluted FFO, unvested restricted stock, unvested LTIP units, stock options, and the shares of Series E Cumulative Convertible Preferred Stock are dilutive; therefore, they are included in the diluted share count.
Activities of our taxable REIT subsidiary (TRS), include development and land entitlement. From time to time, we develop and subsequently sell a TRS property which results in a short-term use of funds that produces a profit that differs from the traditional long-term investment in real estate for REITs. We believe that the inclusion of these TRS gains in FFO is consistent with the standards established by NAREIT as the short-term investment is incidental to our main business. TRS gains on sales, net of taxes, are defined as net sales proceeds less a tax provision and the gross investment basis of the asset before accumulated depreciation.
Management considers FFO a useful metric for investors as the Company uses FFO in evaluating property acquisitions and its operating performance and believes that FFO should be considered along with, but not as an alternative to, net income and cash flow as a measure of the Company's activities in accordance with GAAP. FFO does not represent cash generated from operating activities in accordance with GAAP and is not necessarily indicative of funds available to fund our cash needs. A reconciliation from net income attributable to common stockholders to FFO is provided on Attachment 2.
Held For Disposition Communities: The Company defines Held for Disposition Communities as those communities that were held for sale as of the end of the most recent quarter.
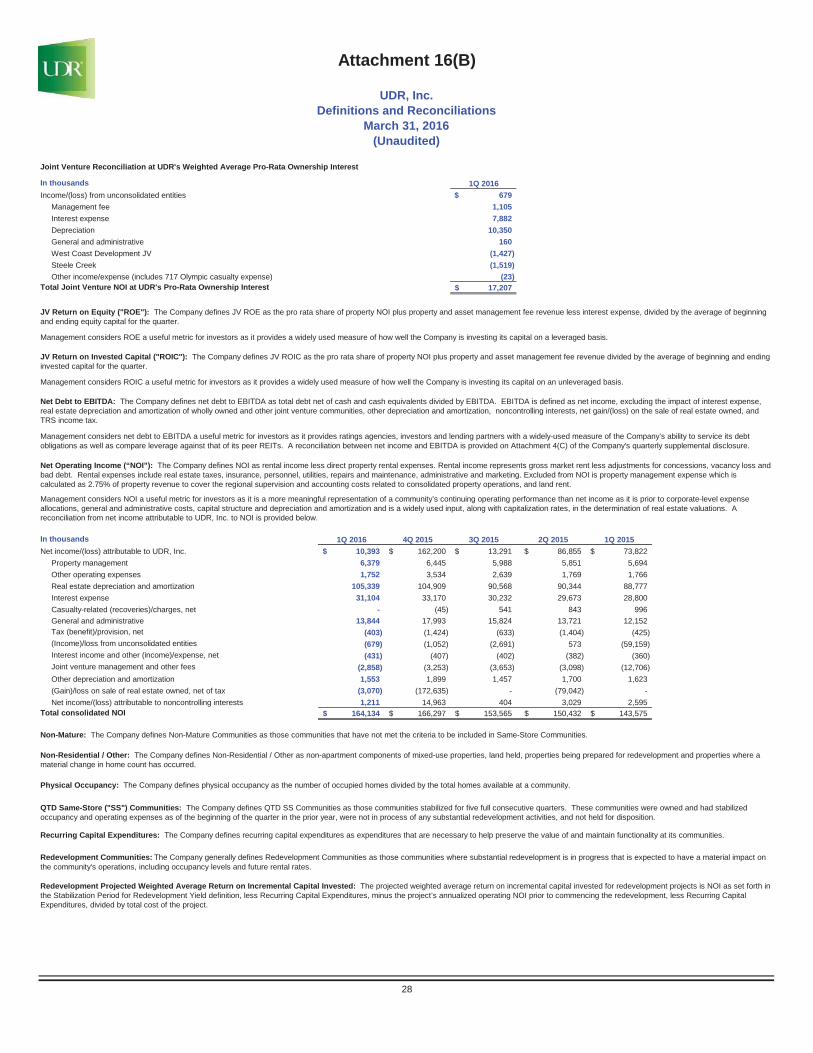
In thousands 1Q 2016Income/(loss) from unconsolidated entities 679$
Management fee 1,105Interest expense 7,882Depreciation 10,350General and administrative 160West Coast Development JV (1,427)Steele Creek (1,519)Other income/expense (includes 717 Olympic casualty expense) (23)
17,207$
In thousands 1Q 2016 4Q 2015 3Q 2015 2Q 2015 1Q 2015Net income/(loss) attributable to UDR, Inc. 10,393$ 162,200$ 13,291$ 86,855$ 73,822$
Property management 6,379 6,445 5,988 5,851 5,694Other operating expenses 1,752 3,534 2,639 1,769 1,766Real estate depreciation and amortization 105,339 104,909 90,568 90,344 88,777Interest expense 31,104 33,170 30,232 29,673 28,800Casualty-related (recoveries)/charges, net - (45) 541 843 996General and administrative 13,844 17,993 15,824 13,721 12,152Tax (benefit)/provision, net (403) (1,424) (633) (1,404) (425)(Income)/loss from unconsolidated entities (679) (1,052) (2,691) 573 (59,159)Interest income and other (income)/expense, net (431) (407) (402) (382) (360)Joint venture management and other fees (2,858) (3,253) (3,653) (3,098) (12,706)Other depreciation and amortization 1,553 1,899 1,457 1,700 1,623(Gain)/loss on sale of real estate owned, net of tax (3,070) (172,635) - (79,042) -Net income/(loss) attributable to noncontrolling interests 1,211 14,963 404 3,029 2,595
Total consolidated NOI 164,134$ 166,297$ 153,565$ 150,432$ 143,575$
Physical Occupancy: The Company defines physical occupancy as the number of occupied homes divided by the total homes available at a community.
QTD Same-Store ("SS") Communities: The Company defines QTD SS Communities as those communities stabilized for five full consecutive quarters. These communities were owned and had stabilized occupancy and operating expenses as of the beginning of the quarter in the prior year, were not in process of any substantial redevelopment activities, and not held for disposition.
Recurring Capital Expenditures: The Company defines recurring capital expenditures as expenditures that are necessary to help preserve the value of and maintain functionality at its communities.
Redevelopment Communities: The Company generally defines Redevelopment Communities as those communities where substantial redevelopment is in progress that is expected to have a material impact on the community's operations, including occupancy levels and future rental rates.
Management considers NOI a useful metric for investors as it is a more meaningful representation of a community’s continuing operating performance than net income as it is prior to corporate-level expense allocations, general and administrative costs, capital structure and depreciation and amortization and is a widely used input, along with capitalization rates, in the determination of real estate valuations. A reconciliation from net income attributable to UDR, Inc. to NOI is provided below.
JV Return on Invested Capital ("ROIC"): The Company defines JV ROIC as the pro rata share of property NOI plus property and asset management fee revenue divided by the average of beginning and ending invested capital for the quarter.
Management considers ROE a useful metric for investors as it provides a widely used measure of how well the Company is investing its capital on a leveraged basis.
Attachment 16(B)
UDR, Inc.Definitions and Reconciliations
March 31, 2016(Unaudited)
JV Return on Equity ("ROE"): The Company defines JV ROE as the pro rata share of property NOI plus property and asset management fee revenue less interest expense, divided by the average of beginning and ending equity capital for the quarter.
28
Management considers net debt to EBITDA a useful metric for investors as it provides ratings agencies, investors and lending partners with a widely-used measure of the Company’s ability to service its debt obligations as well as compare leverage against that of its peer REITs. A reconciliation between net income and EBITDA is provided on Attachment 4(C) of the Company's quarterly supplemental disclosure.
Management considers ROIC a useful metric for investors as it provides a widely used measure of how well the Company is investing its capital on an unleveraged basis.
Net Debt to EBITDA: The Company defines net debt to EBITDA as total debt net of cash and cash equivalents divided by EBITDA. EBITDA is defined as net income, excluding the impact of interest expense, real estate depreciation and amortization of wholly owned and other joint venture communities, other depreciation and amortization, noncontrolling interests, net gain/(loss) on the sale of real estate owned, and TRS income tax.
Net Operating Income (“NOI”): The Company defines NOI as rental income less direct property rental expenses. Rental income represents gross market rent less adjustments for concessions, vacancy loss and bad debt. Rental expenses include real estate taxes, insurance, personnel, utilities, repairs and maintenance, administrative and marketing. Excluded from NOI is property management expense which is calculated as 2.75% of property revenue to cover the regional supervision and accounting costs related to consolidated property operations, and land rent.
Joint Venture Reconciliation at UDR's Weighted Average Pro-Rata Ownership Interest
Total Joint Venture NOI at UDR's Pro-Rata Ownership Interest
Redevelopment Projected Weighted Average Return on Incremental Capital Invested: The projected weighted average return on incremental capital invested for redevelopment projects is NOI as set forth in the Stabilization Period for Redevelopment Yield definition, less Recurring Capital Expenditures, minus the project’s annualized operating NOI prior to commencing the redevelopment, less Recurring Capital Expenditures, divided by total cost of the project.
Non-Mature: The Company defines Non-Mature Communities as those communities that have not met the criteria to be included in Same-Store Communities.
Non-Residential / Other: The Company defines Non-Residential / Other as non-apartment components of mixed-use properties, land held, properties being prepared for redevelopment and properties where a material change in home count has occurred.
Management considers ROE a useful metric for investors as it provides a widely used measure of how well the Company is investing its capital on a leveraged basis.
Sold Communities: The Company defines Sold Communities as those communities that were disposed of prior to the end of the most recent quarter.
Return on Invested Capital ("ROIC"): The Company defines ROIC as a referenced quarter's NOI, annualized, divided by the average of beginning and ending invested capital for the quarter.
Attachment 16(C)
UDR, Inc.Definitions and Reconciliations
March 31, 2016(Unaudited)
Return on Equity ("ROE"): The Company defines ROE as a referenced quarter's NOI less interest expense, annualized, divided by the average of beginning and ending equity capital for the quarter.
Revenue Enhancing Capital Expenditures: The Company defines revenue-enhancing capital expenditures as expenditures that result in increased income generation over time.
Management considers ROIC a useful metric for investors as it provides a widely used measure of how well the Company is investing its capital on an unleveraged basis.
Stabilization Period for Redevelopment Yield: The Company defines the stabilization period for a redevelopment property yield for purposes of computing the Projected Weighted Average Return on Incremental Capital Invested, as the forward twelve month NOI, excluding any remaining lease-up concessions outstanding, commencing one year following the delivery of the final home of a project.
TRS: The Company's taxable REIT subsidiary ("TRS") focuses on development, land entitlement and short-term hold investments. TRS gains on sales, net of taxes, is defined as net sales proceeds less a tax provision and the gross investment basis of the asset before accumulated depreciation.
Management considers total revenue per occupied home a useful metric for investors as it serves as a proxy for portfolio quality, both geographic and physical.
Management considers estimated stabilized yield on development as a useful metric for investors as it helps provide context to the expected effects that development projects will have on the Company’s future performance once stabilized.
Stabilization for Same Store Classification: The Company generally defines stabilization as when a community’s occupancy reaches 90% or above for at least three consecutive months.
Stabilization Period for Development Yield: The Company defines the stabilization period for development property yield as the forward twelve month NOI, excluding any remaining lease-up concessions outstanding, commencing one year following the delivery of the final home of the project.
YTD Same-Store ("SS") Communities: The Company defines YTD SS Communities as those communities stabilized for two full consecutive calendar years. These communities were owned and had stabilized occupancy and operating expenses as of the beginning of the prior year, were not in process of any substantial redevelopment activities, and not held for disposition.
Stabilized, Non-Mature Communities: The Company defines Stabilized, Non-Mature Communities as those communities that are stabilized but not yet in the Company's Same-Store portfolio.
Stabilized Yield on Developments: Expected stabilized yields on development are calculated as follows, projected stabilized NOI less management fees divided by budgeted construction cost on a project-specific basis. Projected stabilized NOI for development projects, calculated in accordance with the NOI reconciliation provided on Attachment 16(B), is set forth in the definition of Stabilization Period for Development Yield. Given the differing completion dates and years for which NOI is being projected for these communities as well as the complexities associated with estimating other expenses upon completion such as corporate overhead allocation, general and administrative costs and capital structure, a reconciliation to GAAP measures is not meaningful. Projected NOI for these projects is neither provided, nor is representative of Management’s expectations for the Company’s overall financial performance or cash flow growth and there can be no assurances that forecast NOI growth implied in the estimated construction yield of any project will be achieved.
29
Total Revenue per Occupied Home: The Company defines total revenue per occupied home as rental and other revenues, calculated in accordance with GAAP, divided by the product of occupancy and the number of apartment homes.
Management considers revenue enhancing capital expenditures a useful metric for investors as it quantifies the amount of capital expenditures that are expected to grow, not just maintain, revenues.
Low High
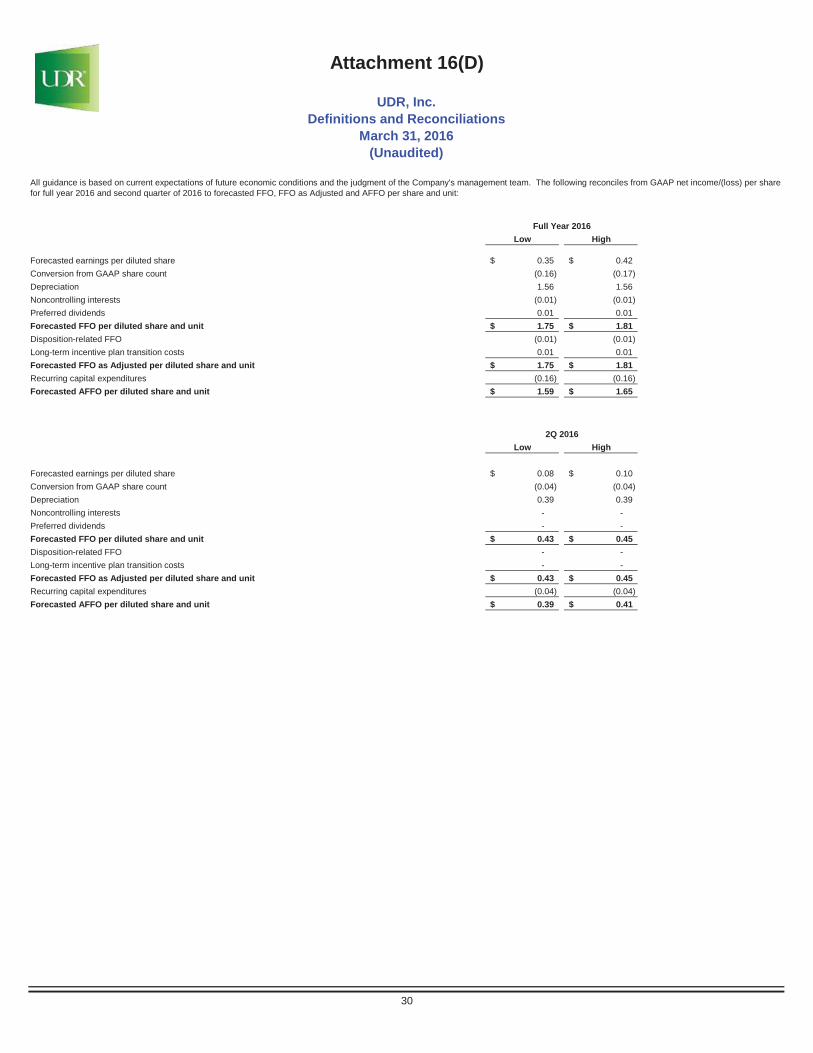
Forecasted earnings per diluted share 0.35$ 0.42$Conversion from GAAP share count (0.16) (0.17)Depreciation 1.56 1.56Noncontrolling interests (0.01) (0.01)Preferred dividends 0.01 0.01Forecasted FFO per diluted share and unit 1.75$ 1.81$Disposition-related FFO (0.01) (0.01)Long-term incentive plan transition costs 0.01 0.01Forecasted FFO as Adjusted per diluted share and unit 1.75$ 1.81$Recurring capital expenditures (0.16) (0.16)Forecasted AFFO per diluted share and unit 1.59$ 1.65$
Low High
Forecasted earnings per diluted share 0.08$ 0.10$Conversion from GAAP share count (0.04) (0.04)Depreciation 0.39 0.39Noncontrolling interests - -Preferred dividends - -Forecasted FFO per diluted share and unit 0.43$ 0.45$Disposition-related FFO - -Long-term incentive plan transition costs - -Forecasted FFO as Adjusted per diluted share and unit 0.43$ 0.45$Recurring capital expenditures (0.04) (0.04)Forecasted AFFO per diluted share and unit 0.39$ 0.41$
30
Full Year 2016
Attachment 16(D)
UDR, Inc.Definitions and Reconciliations
March 31, 2016(Unaudited)
All guidance is based on current expectations of future economic conditions and the judgment of the Company's management team. The following reconciles from GAAP net income/(loss) per share for full year 2016 and second quarter of 2016 to forecasted FFO, FFO as Adjusted and AFFO per share and unit:
2Q 2016

Page intentionally left blank