Embed Size (px)
Citation preview

Copyright Autoliv Inc., All Rights Reserved
Copyright Autoliv Inc., All Rights ReservedOctober 26, 20181
1st
Earnings Conference Call and Webcast3rd Quarter 2018 Financial Results
October 26, 2018
ALV – Q3-2018 Earnings Call and Webcast

Copyright Autoliv Inc., All Rights Reserved
Safe Harbor Statement*
This presentation contains statements that are not historical facts but rather forward-looking statements within the meaning of the Private Securities Litigation Reform Act of 1995. Such forward-looking statements include those that address activities, events or developments that Autoliv, Inc. or its management believes or anticipates may occur in the future. All forward-looking statements, are based upon our current expectations, various assumptions and/or data available from third parties. Our expectations and assumptions are expressed in good faith and we believe there is a reasonable basis for them. However, there can be no assurance that such forward-looking statements will materialize or prove to be correct as forward-looking statements are inherently subject to known and unknown risks, uncertainties and other factors which may cause actual future results, performance or achievements to differ materially from the future results, performance or achievements expressed in or implied by such forward-looking statements. In some cases, you can identify these statements by forward-looking words such as “estimates”, “expects”, “anticipates”, “projects”, “plans”, “intends”, “believes”, “may”, “likely”, “might”, “would”, “should”, “could”, or the negative of these terms and other comparable terminology, although not all forward-looking statements contain such words. Because these forward-looking statements involve risks and uncertainties, the outcome could differ materially from those set out in the forward-looking statements for a variety of reasons, including without limitation, changes in light vehicle production; fluctuation in vehicle production schedules for which the Company is a supplier, changes in general industry and market conditions or regional growth or decline; changes in and the successful execution of our capacity alignment, restructuring and cost reduction initiatives and the market reaction thereto; loss of business from increased competition; higher raw material, fuel and energy costs; changes in consumer and customer preferences for end products; customer losses; changes in regulatory conditions; customer bankruptcies, consolidations, or restructurings; divestiture of customer brands; unfavorable fluctuations in currencies or interest rates among the various jurisdictions in which we operate; component shortages; market acceptance of our new products; costs or difficulties related to the integration of any new or acquired businesses and technologies; continued uncertainty in pricing negotiations with customers; successful integration of acquisitions and operations of joint ventures; successful implementation of strategic partnerships and collaborations; our ability to be awarded new business; product liability, warranty and recall claims and investigations and other litigation and customer reactions thereto; (including the resolution of the Toyota recall); higher expenses for our pension and other postretirement benefits, including higher funding requirements for our pension plans; work stoppages or other labor issues; possible adverse results of pending or future litigation or infringement claims; our ability to protect our intellectual property rights; negative impacts of antitrust investigations or other governmental investigations and associated litigation relating to the conduct of our business; tax assessments by governmental authorities and changes in our effective tax rate; dependence on key personnel; legislative or regulatory changes impacting or limiting our business; political conditions; dependence on and relationships with customers and suppliers; and other risks and uncertainties identified under the headings “Risk Factors” and “Management’s Discussion and Analysis of Financial Condition and Results of Operations” in our Annual Reports and Quarterly Reports on Forms 10-K and 10-Q and any amendments thereto. For any forward-looking statements contained in this or any other document, we claim the protection of the safe harbor for forward-looking statements contained in the Private Securities Litigation Reform Act of 1995, and we assume no obligation to update publicly or revise any forward-looking statements in light of new information or future events, except as required by law.
October 26, 2018 ALV – Q3-2018 Earnings Call and Webcast2
(*) Non-US GAAP reconciliations are disclosed in our regulatory filings available at www.sec.gov or www.autoliv.com

Copyright Autoliv Inc., All Rights Reserved
Q3’18 Highlights
▪ Strong organic growth, despite weaker market development
− Execution on strong order book
− Launches on track albeit still with elevated launch related costs
− Continued high order intake supporting our strong market position longer term
▪ Operating cash flow on a high level, supporting our full year indication of reaching last year’s level for continuing operations
▪ Unfavorable market fundamentals taking its toll on global auto demand/production in the quarter
− LVP in W. Europe is estimated to have declined 9% mainly as a result of the new emission testing (WLTP)
− China LVP declined 4%, more than 7pp worse than expected. The decline was more pronounced among local OEMs due to their higher exposure to lower tier cities where sales declined the most (partly due to government’s restrictions on peer to peer lending)
− Trade policy and tariff uncertainties complicating planned process flows
▪ Implementing actions to mitigate market softening and reduce elevated costs related to product launches
3 October 26, 2018 ALV – Q3-2018 Earnings Call and Webcast

Copyright Autoliv Inc., All Rights Reserved
Step-up in sales growth from strong order book
October 26, 2018 ALV – Q3-2018 Earnings Call and Webcast4
Q3´18 Financial Highlights
2,033
Q3´17 Q3´18
Consolidated Sales$ million
205
194
Q3´17 Q3´18
Adjusted Operating Income* $ million
1.21
1.34
Q3´17 Q3´18
Reported EPS $
6%** ~(5)% ~11%
(*) Non-US GAAP measures exclude costs for capacity alignments, antitrust related matters and and separation of our business segments,
(**) Organic sales growth.
Copyright Autoliv Inc., All Rights Reserved
AMERICAS
21.8%LVP* 2%
EUROPE
(3.6)%LVP* (5)%
REST OF ASIA
1.5%LVP* 2%
JAPAN
2.1%LVP* (3)%
CHINA
4.5%LVP* (4)%
Q3´18 Sales Growth
Regional Organic Growth**Sales Bridge
+4.1%
Org. growth**
+6.4%
October 26, 2018 ALV – Q3-2018 Earnings Call and Webcast5
(*) Light Vehicle Production (LVP) according to IHS @ October 16, 2018,
(**) Non-US GAAP measure.
$ million
Copyright Autoliv Inc., All Rights Reserved
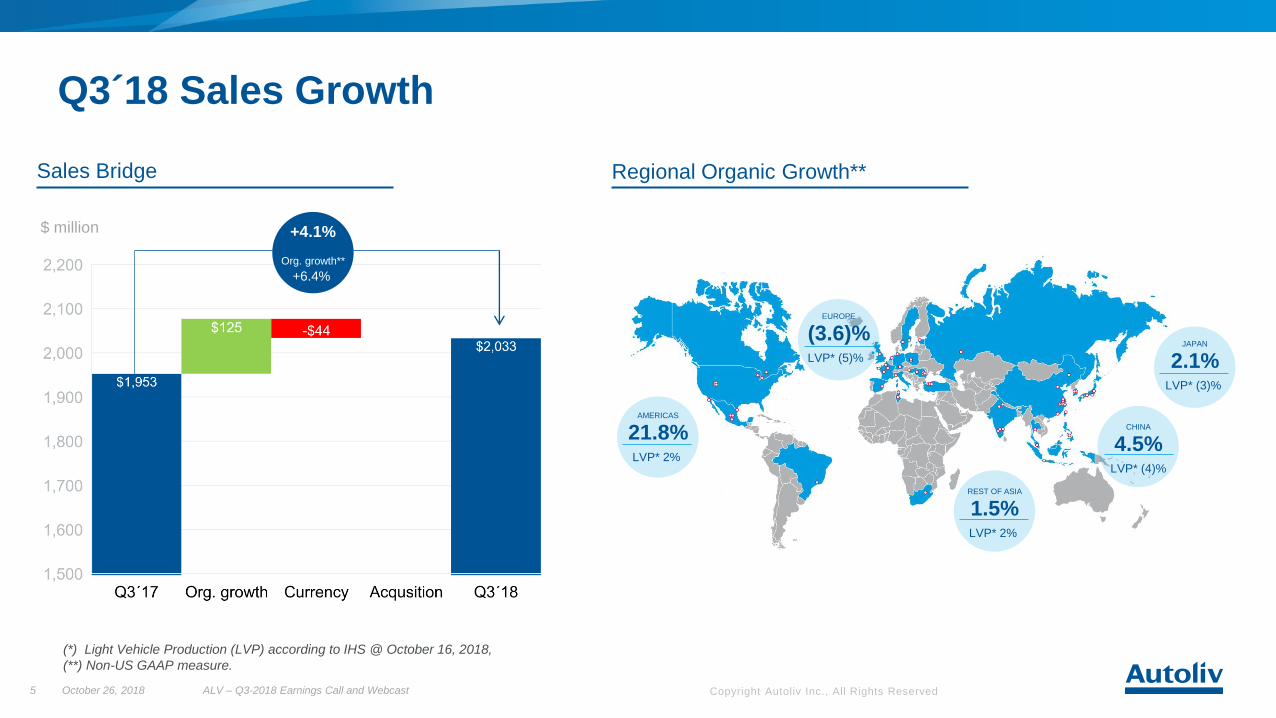
Q3’18 - Key Model Launches
Honda Crider.
Audi Q3.
Chevrolet Silverado
Subaru Forester.
Haval F7.
BMW X5.
Audi A1
Nissan Altima
VW Tharu
ALV – Q3-2018 Earnings Call and WebcastOctober 26, 20186

Copyright Autoliv Inc., All Rights Reserved
Product Launches per Quarter
October 26, 2018 ALV – Q3-2018 Earnings Call and Webcast7
0
50
100
150
200
250
Num
be
r o
f L
au
nch
es
2016 2017 2018 2019
~600
~740
YTD increased >30% YoY
~600
+25%

Copyright Autoliv Inc., All Rights Reserved
Softening of Major light vehicle markets
October 26, 2018 ALV – Q3-2018 Earnings Call and Webcast8
Overall Market Conditions
FY’18 Light Vehicle Production*
RegionMillions of
Vehicles
YoY Chg.
@ Oct 16th
China 26.6 0%
Japan 9.0 0%
RoA* 13.1 4%
North America 15.8 0%
South America 3.5 7%
Europe 22.2 0%
Global 92.9 1%
▪ Asia− In September, China’s LV sales declined by 11%, marking the third consecutive monthly decline
− LVP in the third quarter declined by 4%, this was more than 7 pp lower than expected in July
− The Q4’18 LVP* is expected to decline YoY* by ~3% in China. While RoA and Japan are expected to
grow by ~8% and by ~1%, respectively
▪ Americas− US SAAR** rebounded slightly in September from slowdowns in July and August. Inventories remain
flat YoY at 3.7 million units, or ~65 days by the end of Q3’18
− LVP in third quarter increased 2%, 6 pp lower than expected in the beginning of the quarter
− Q4’18 LVP in North America is expected to increase ~3% YoY despite continued headwinds from rising
interest and tough comps from Hurricane Harvey
− South America continues to rebound and is expected to increase ~7% YoY
▪ Europe− EU28** light vehicle registrations fell by 23% in September, reversing August’s inflated sales ahead of
the introduction of the new more stringent WLTP CO2 emission testing
− LVP in W. Europe fell by ~9% in Q3 on WLTP headwinds at some OEMs, 7 pp lower than expected
− Q4’18 LVP in Europe is expected to decline by less than 1%, whereof WEU* is expected to decrease
by ~3% while EEU* is expected to increase by ~5%
Latest FY’18 GLVP forecast stands at 92.9 million units, ~1.3 million units lower than the July forecast
(*) Light Vehicle Production (LVP) according to IHS @ October 16, 2018, Year over Year (YoY), Rest of Asia (RoA), Western Europe (WEU), Eastern Europe (EEU),
(**) Source: ACEA, Ward’s Auto, CAAM, CADA.
Light Vehicle Sales LTM**

Copyright Autoliv Inc., All Rights ReservedOctober 26, 2018 ALV – Q3-2018 Earnings Call and Webcast9
(*) Non-US GAAP measures exclude costs for capacity alignments, antitrust related matters and separation of our business segments. (**) Return on Capital Employed (RoCE) and
Return on Equity (RoE), (***) Global Light Vehicle Production (GLVP) according to IHS @ October 16, 2018.
(US $ Millions unless specified) Q3’18 Q3’17
Sales $2,033 $1,953
Gross Profit $386 19.0% $395 20.2%
Operating Income* $194 9.5% $205 10.5%
EPS (assuming dilution) $1.34 $1.21
RoCE** 20.4% n/a
RoE** 23.2% n/a
Operating cash flow $238 $218
Dividend per share $0.62 $0.60
GLVP*** (annual run rate) ~85M ~87M
Q3´18 Financial Overview

Copyright Autoliv Inc., All Rights Reserved
Q3’18 vs. Prior Year
ALV – Q3-2018 Earnings Call and Webcast10
Adj. Operating Margin* Bridge
Adjusted Operating Margin of 9.5% includes ~40 bps increase in Raw material and Currency impact
(1.0)pp
Adj. EBIT*
(5.5)%
October 26, 2018
(*) Non-US GAAP measure excludes costs for capacity alignments, antitrust related matters and separation of our business segments.
Copyright Autoliv Inc., All Rights ReservedALV – Q3-2018 Earnings Call and Webcast11
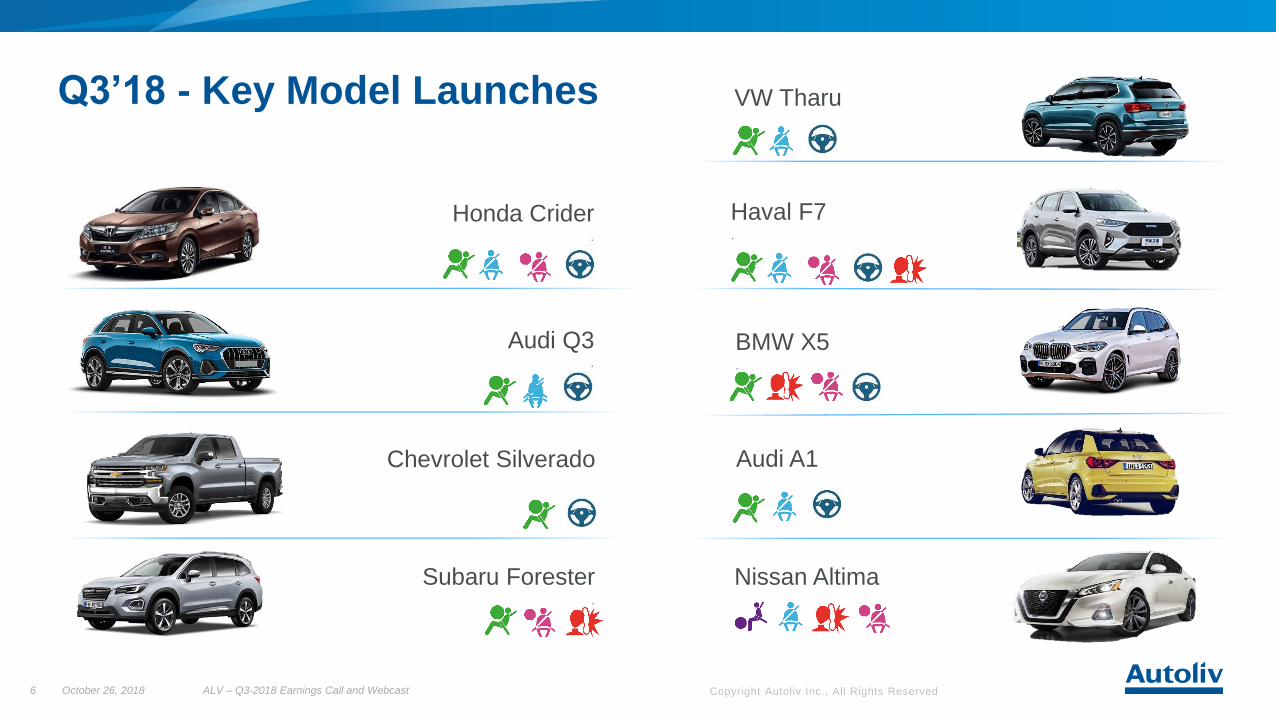
Margin headwinds Q3´18
▪ Raw material− Continued YoY headwinds from raw materials
▪ Currencies− Currency effects, translation and transaction, slightly worse than expected
▪ Supply chain, production and logistic challenges− Exceptional growth in Americas with continued elevated launch costs to
secure quality and delivery
− Lower and unbalanced capacity utilization in Europe due to uneven WLTP
effects
− Frequent and late changes of call-offs, especially in Europe and China,
create challenges in production and resource management -20 -10 0 10 20
Americas
Europe
China
Asia
Unbalanced Organic Sales Growth*
%
October 26, 2018
(*) Non-US GAAP measure.

Copyright Autoliv Inc., All Rights Reserved
Cash Flow – including discontinued operations
(US $ Millions unless specified) Q3’18 Q3’17 LTM* 2017 2016 2015
Net Income 118 88 219 303 562 458
Depreciation & Amortization*** 85 104 650 660 383 319
Other, net (8) (6) 27 (27) 1 0
Change in operating WC** 43 32 (205) (0) (78) (26)
Operating cash flow 238 218 691 936 868 751
Capital Expenditures, net (117) (142) (589) (570) (499) (450)
Free cash flow** 121 76 102 366 369 301
Acquisitions, net**** 0 2 88 128 227 128
Dividends paid 54 52 213 209 203 196
Shares repurchased 0 0 0 157 0 104
Investments for growth and shareholder returns
October 26, 2018 ALV – Q3-2018 Earnings Call and Webcast12
Acquisitions and CapEx for growth along with Shareholder returns are ~$0.9B over the LTM
(*) Last Twelve Months (LTM), (**) Non-US GAAP measure, before acquisitions, reconciliation of free cash flow is provided above,
(***) Includes one-time Goodwill impairment charge related to the ANBS JV in 2017, (****) includes investments in affiliates.

Copyright Autoliv Inc., All Rights Reserved13
EPS development
$1.21
$1.34
Q3´17 Q3´18
Earnings per Share
$
$1.64
$1.35
Q3´17 Q3´18
-18%11%
Earnings per Share excluding items
affecting comparability* $
(*) Non-US GAAP measures exclude costs for capacity alignments, antitrust related matters and separation of our business segments. Assuming dilution.
ALV – Q3-2018 Earnings Call and Webcast
The main items impacting EPS* were
▪ ~14 cents from higher tax
▪ ~9 cents from lower adjusted operating
income*
October 26, 2018

Copyright Autoliv Inc., All Rights Reserved
Higher ROCE* and ROE* in the new corporate structure
October 26, 2018 ALV – Q3-2018 Earnings Call and Webcast14
Capital Structure
20% 20%
13%
20.4%
2015 2016 2017 Q3´18
ROCE* ROE* Shareholder returns*
0
200
400
600
800
'09 '11 '13 '15 '17 LTM
Share Repurchase
Dividend
Free Cash flow
14%15%
7%
23.2%
2015 2016 2017 Q3'18
(*) Non-US GAAP measures Return on Capital Employed (ROCE), Return on Equity (ROE). For the periods 2015-2017 all returns are on a pre-spin basis.
$M

Copyright Autoliv Inc., All Rights Reserved
(*) Autoliv Inc. group statistics, prior to spin; Non-US GAAP measure, Leverage Ratio and Net Debt includes Pension Liability.
✓ Provided $1B of cash liquidity for Veoneer at time of spin-off
‒ Mix of new debt and existing cash
✓ S&P confirmed long-term credit rating A- (stable outlook)
✓ Q4’18 dividend set at unchanged level following the spinoff
Strong Balance Sheet and Prudent Financial PolicyCommitted to Maintain “Strong Investment Grade” Rating Supported by High FCF Conversion
0.0
0.5
1.0
1.5
2.0
03A 04A 05A 06A 07A 08A 09A 10A 11A 12A 13A 14A 15A 16A 17AQ3'18
Net Debt/ EBITDA*
x
Long-Term Target: 1.0x 0.5-1.5xLong-Term Range
October 26, 2018 ALV – Q3-2018 Earnings Call and Webcast15
1.6
▪ Focus unchanged,
‒ Prudent balance sheet
‒ Shareholder friendly capital allocation
▪ Primary tools remain buybacks and dividends
▪ Long term target remains Net Debt/ EBITDA of 1.0x

Copyright Autoliv Inc., All Rights Reserved
Financial Outlook
October 26, 2018 ALV – Q3-2018 Earnings Call and Webcast16
Consolidated sales, net and operating margin*
FY’18
Sales
Organic* ~6%
Fx** ~2%
Consolidated Sales, net ~8%
Operating Margin* ~10.5%
(*) Non-US GAAP measures exclude costs for capacity alignments, antitrust related matters and separation of our business segments,
(**) Mid-October 2018 exchange rates.
Exchange rates** FY’18
EUR / US$ 1,1858
US$ / JPY 110,31
US$ / KRW 1103
US$ / MXN 18,98
US$ / CNY 6,61

autoliv.com
Each year, Autoliv’sproducts save over30,000 lives

Copyright Autoliv Inc., All Rights Reserved
Appendix
Date18 Name of presentation

Copyright Autoliv Inc., All Rights Reserved
Strong volume growth in high value-added Seatbelts
October 26, 2018 ALV – Q3-2018 Earnings Call and Webcast19
Autoliv Quantities Delivered(Millions unless specified)
Q3´18 vs. PY** (%)
Seatbelts 34.7 (3)%▪ Pretensioners (of which) 17.1 2%
▪ Active Seatbelts (of which) 1.2 1%
Frontal Airbags 13.4 8%▪ Knee Airbags (of which) 1.3 (5)%
Side Airbags 23.4 0%▪ Chest (Thorax) 12.7 0%
▪ Head (Curtain) 10.7 1%
Steering Wheels 4.8 18%
LVP* (Triad) 8.9 (3.3)%
LVP* (Global) 21.4 (2.1)%
Q3´18 Product Volumes
(*) Light Vehicle Production (LVP) according to IHS @ October 16, 2018, TRIAD (Western Europe, North America, Japan), (**) Prior Year (PY).
Copyright Autoliv Inc., All Rights Reserved
Definition of Symbols
▪ Driver and/or Passenger airbags
▪ Seatbelts
▪ Side airbags
▪ Steering Wheel
▪ Head/Inflatable Curtain airbags
▪ Knee airbag
October 26, 2018 ALV – Q3-2018 Earnings Call and Webcast20