Embed Size (px)
Citation preview
Emotional speech recognition: Resources, features, and methods
Dimitrios Ververidis and Constantine Kotropoulos ∗Artificial Intelligence and Information Analysis Laboratory, Department of Informatics, Aristotle University of
Thessaloniki, Box 451, Thessaloniki 541 24, Greece.
Abstract
In this paper we overview emotional speech recognition having in mind three goals. The first goal is to provide anup-to-date record of the available emotional speech data collections. The number of emotional states, the language,the number of speakers, and the kind of speech are briefly addressed. The second goal is to present the mostfrequent acoustic features used for emotional speech recognition and to assess how the emotion affects them. Typicalfeatures are the pitch, the formants, the vocal-tract cross-section areas, the mel-frequency cepstral coefficients,the Teager energy operator-based features, the intensity of the speech signal, and the speech rate. The thirdgoal is to review appropriate techniques in order to classify speech into emotional states. We examine separatelyclassification techniques that exploit timing information from which that ignore it. Classification techniques basedon hidden Markov models, artificial neural networks, linear discriminant analysis, k-nearest neighbors, supportvector machines are reviewed.
Key words: Emotions, emotional speech data collections, emotional speech classification, stress, interfaces, acoustic features.PACS:
1. Introduction
Emotional speech recognition aims at automat-ically identifying the emotional or physical stateof a human being from his or her voice. The emo-tional and physical states of a speaker are knownas emotional aspects of speech and are included inthe so called paralinguistic aspects. Although theemotional state does not alter the linguistic con-tent, it is an important factor in human commu-nication, because it provides feedback informationin many applications as it is outlined next.
∗ Corresponding author. Tel.-Fax: ++30 2310 998225.E-mail address: [email protected]
Making a machine to recognize emotions fromspeech is not a new idea. The first investigationswere conducted around the mid-eighties usingstatistical properties of certain acoustic features(Van Bezooijen, 1984; Tolkmitt and Scherer,1986). Ten years later, the evolution of computerarchitectures made the implementation of morecomplicated emotion recognition algorithms fea-sible. Market requirements for automatic servicesmotivate further research. In environments likeaircraft cockpits, speech recognition systems weretrained by employing stressed speech instead ofneutral (Hansen and Cairns, 1995). The acousticfeatures were estimated more precisely by itera-tive algorithms. Advanced classifiers exploitingtiming information were proposed (Cairns and
Preprint submitted to Elsevier Science 19 April 2006

Hansen, 1994; Womack and Hansen, 1996; Polzinand Waibel, 1998). Nowadays, research is focusedon finding powerful combinations of classifiersthat advance the classification efficiency in real lifeapplications. The wide use of telecommunicationservices and multimedia devices paves also the wayfor new applications. For example, in the projects“Prosody for dialogue systems” and “SmartKom”,ticket reservation systems are developed that em-ploy automatic speech recognition being able torecognize the annoyance or frustration of a userand change their response accordingly (Ang et al.,2002; Schiel et al., 2002). Similar scenarios are alsopresented for call center applications (Petrushin,1999; Lee and Narayanan, 2005). Emotional speechrecognition can be employed by therapists as a di-agnostic tool in medicine (France et al., 2000). Inpsychology, emotional speech recognition methodscan cope with the bulk of enormous speech datain real-time extracting the speech characteristicsthat convey emotion and attitude in a systematicmanner (Mozziconacci and Hermes, 2000).
In the future, the emotional speech research willprimarily be benefited by the on-going availabilityof large-scale emotional speech data collections,and will focus on the improvement of theoreticalmodels for speech production (Flanagan, 1972)or models related to the vocal communicationof emotion (Scherer, 2003). Indeed, on the onehand, large data collections which include a vari-ety of speaker utterances under several emotionalstates are necessary in order to faithfully assessthe performance of emotional speech recognitionalgorithms. The already available data collectionsconsist only of few utterances, and therefore it isdifficult to demonstrate reliable emotion recogni-tion results. The data collections listed in section2 provide initiatives to set up more relaxed andclose to real-life specifications for recording large-scale emotional speech data collections that arecomplementary to the already existing resources.On the other hand, theoretical models of speechproduction and vocal communication of emo-tion will provide the necessary background for asystematic study and will deploy more accurateemotional cues through time. In the following, thecontributions of the paper are identified and itsoutline is given.
1.1. Contributions of the paper
Several reviews on emotional speech analy-sis have already appeared (Van Bezooijen, 1984;Scherer et al., 1991; Cowie et al., 2001; Pantic andRothkrantz, 2003; Scherer, 2003; Douglas-Cowieet al., 2003). However, as the research towards un-derstanding human emotions increasingly attractsthe attention of the research community, the shortlist of 19 data collections appeared in (Douglas-Cowie et al., 2003) does not adequately cover thetopic. In this tutorial, 64 data collections are re-viewed. Furthermore, an up-to-date literature sur-vey is provided, complementing the previous stud-ies in (Van Bezooijen, 1984; Scherer et al., 1991;Cowie et al., 2001). Finally, the paper is focusedon describing the feature extraction methods andthe emotion classification techniques, topics thathave not been treated in (Scherer, 2003; Panticand Rothkrantz, 2003).
1.2. Outline
In section 2, a corpus of 64 data collections isreviewed putting emphasis on the data collectionprocedures, the kind of speech (natural, simu-lated, or elicited), the content, and other physio-logical signals that may accompany the emotionalspeech. In section 3, short-term features (i.e. fea-tures that are extracted on speech frame basis)that are related to the emotional content of speechare discussed. In addition to short-term features,their contours are of fundamental importance foremotional speech recognition. The emotions affectthe contour characteristics, such as statistics andtrends as is summarized in section 4. Emotionclassification techniques that exploit timing in-formation and other techniques that ignore it aresurveyed in section 5. Therefore, sections 3 and 4aim at describing the appropriate features to beused with the emotional classification techniquesreviewed in section 5. Finally, section 6 concludesthe tutorial by indicating future research direc-tions.
2

2. Data collections
A record of emotional speech data collectionsis undoubtedly useful for researchers interested inemotional speech analysis. An overview of 64 emo-tional speech data collections is presented in Ta-ble 1. For each data collection additional informa-tion is also described such as the speech language,the number and the profession of the subjects,other physiological signals possibly recorded simul-taneously with speech, the data collection purpose(emotional speech recognition, expressive synthe-sis), the emotional states recorded, and the kind ofthe emotions (natural, simulated, elicited).
From Table 1, it is evident that the research onemotional speech recognition is limited to certainemotions. The majority of emotional speech datacollections encompasses 5 or 6 emotions, althoughthe emotion categories are much more in real life.For example, many words “with emotional conno-tation”, originally found in the semantic Atlas ofEmotional Concepts, are enlisted in (Cowie andCornelius, 2003). In the early seventies, the pallettheory was proposed by Anscombe and Geach inan attempt to describe all emotions as a mixture ofsome primary emotions like what exactly happenswith colors (Anscombe and Geach, 1970). Thisidea has been rejected and the term “basic emo-tions” is now widely used without implying thatsuch emotions can be mixed to produce others(Eckman, 1992). It is commonly agreed that thebasic emotions are more primitive and universalthan the others. Eckman proposed the followingbasic emotions: anger, fear, sadness, sensory plea-sure, amusement, satisfaction, contentment, ex-citement, disgust, contempt, pride, shame, guilt,embarrassment, and relief. Non-basic emotions arecalled “higher-level” emotions (Buck, 1999) andthey are rarely represented in emotional speechdata collections.
Three kinds of speech are observed. Naturalspeech is simply spontaneous speech where allemotions are real. Simulated or acted speech isspeech expressed in a professionally deliberatedmanner. Finally, elicited speech is speech in whichthe emotions are induced. The elicited speechis neither neutral nor simulated. For example,
portrayals of non-professionals while imitating aprofessional produce elicited speech, which canalso be an acceptable solution when an adequatenumber of professionals is not available (Nakatsuet al., 1999). Acted speech from professionals isthe most reliable for emotional speech recognitionbecause professionals can deliver speech colored byemotions that possess a high arousal, i.e. emotionswith a great amplitude or strength.
Additional synchronous physiological signalssuch as sweat indication, heart beat rate, bloodpressure, and respiration could be recorded duringthe experiments. They provide a ground truth forthe degree of subjects’ arousal or stress (Rahurkarand Hansen, 2002; Picard et al., 2001). There isa direct evidence that the aforementioned signalsare related more to the arousal information ofspeech than to the valence of the emotion, i.e.the positive or negative character of the emotions(Wagner et al., 2005). As regards other physiolog-ical signals, such as EEG or signals derived fromblood analysis, no sufficient and reliable resultshave been reported yet.
The recording scenarios employed in data col-lections are presumably useful for repeating oraugmenting the experiments. Material from radioor television is always available (Douglas-Cowieet al., 2003). However, such material raises copy-right issues and impedes the data collection distri-bution. An alternative is speech from interviewswith specialists, such as psychologists and sci-entists specialized in phonetics (Douglas-Cowieet al., 2003). Furthermore, speech from real lifesituations such as oral interviews of employeeswhen they are examined for promotion can bealso used (Rahurkar and Hansen, 2002). Parentstalking to infants, when they try to keep themaway from dangerous objects can be another reallife example (Slaney and McRoberts, 2003). Inter-views between a doctor and a patient before andafter medication was used in (France et al., 2000).Speech can be recorded while the subject faces amachine, e.g. during telephone calls to automaticspeech recognition (ASR) call centers (Lee andNarayanan, 2005), or when the subjects are talk-ing to fake-ASR machines, which are operated bya human (wizard-of-OZ method, WOZ) (Fischer,1999). Giving commands to a robot is another idea
3
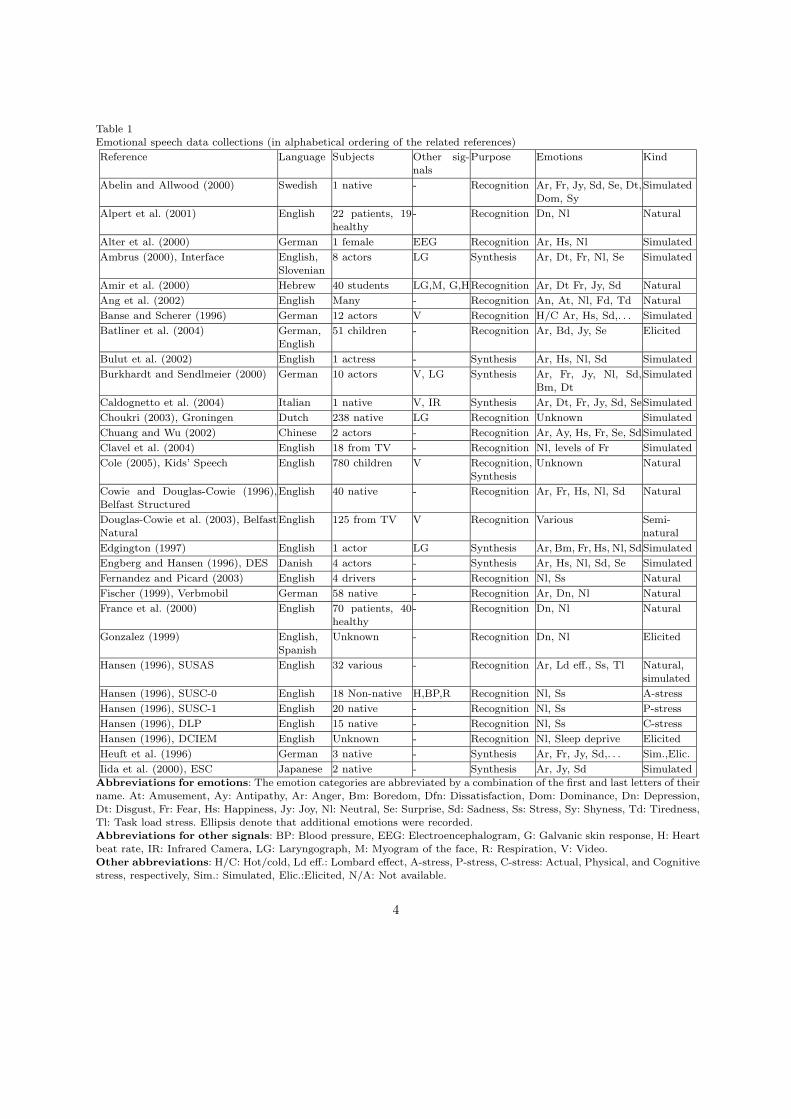
Table 1Emotional speech data collections (in alphabetical ordering of the related references)
Reference Language Subjects Other sig-nals
Purpose Emotions Kind
Abelin and Allwood (2000) Swedish 1 native - Recognition Ar, Fr, Jy, Sd, Se, Dt,Dom, Sy
Simulated
Alpert et al. (2001) English 22 patients, 19healthy
- Recognition Dn, Nl Natural
Alter et al. (2000) German 1 female EEG Recognition Ar, Hs, Nl Simulated
Ambrus (2000), Interface English,Slovenian
8 actors LG Synthesis Ar, Dt, Fr, Nl, Se Simulated
Amir et al. (2000) Hebrew 40 students LG,M, G,HRecognition Ar, Dt Fr, Jy, Sd Natural
Ang et al. (2002) English Many - Recognition An, At, Nl, Fd, Td Natural
Banse and Scherer (1996) German 12 actors V Recognition H/C Ar, Hs, Sd,. . . Simulated
Batliner et al. (2004) German,English
51 children - Recognition Ar, Bd, Jy, Se Elicited
Bulut et al. (2002) English 1 actress - Synthesis Ar, Hs, Nl, Sd Simulated
Burkhardt and Sendlmeier (2000) German 10 actors V, LG Synthesis Ar, Fr, Jy, Nl, Sd,Bm, Dt
Simulated
Caldognetto et al. (2004) Italian 1 native V, IR Synthesis Ar, Dt, Fr, Jy, Sd, SeSimulated
Choukri (2003), Groningen Dutch 238 native LG Recognition Unknown Simulated
Chuang and Wu (2002) Chinese 2 actors - Recognition Ar, Ay, Hs, Fr, Se, SdSimulated
Clavel et al. (2004) English 18 from TV - Recognition Nl, levels of Fr Simulated
Cole (2005), Kids’ Speech English 780 children V Recognition,Synthesis
Unknown Natural
Cowie and Douglas-Cowie (1996),Belfast Structured
English 40 native - Recognition Ar, Fr, Hs, Nl, Sd Natural
Douglas-Cowie et al. (2003), BelfastNatural
English 125 from TV V Recognition Various Semi-natural
Edgington (1997) English 1 actor LG Synthesis Ar, Bm, Fr, Hs, Nl, SdSimulated
Engberg and Hansen (1996), DES Danish 4 actors - Synthesis Ar, Hs, Nl, Sd, Se Simulated
Fernandez and Picard (2003) English 4 drivers - Recognition Nl, Ss Natural
Fischer (1999), Verbmobil German 58 native - Recognition Ar, Dn, Nl Natural
France et al. (2000) English 70 patients, 40healthy
- Recognition Dn, Nl Natural
Gonzalez (1999) English,Spanish
Unknown - Recognition Dn, Nl Elicited
Hansen (1996), SUSAS English 32 various - Recognition Ar, Ld eff., Ss, Tl Natural,simulated
Hansen (1996), SUSC-0 English 18 Non-native H,BP,R Recognition Nl, Ss A-stress
Hansen (1996), SUSC-1 English 20 native - Recognition Nl, Ss P-stress
Hansen (1996), DLP English 15 native - Recognition Nl, Ss C-stress
Hansen (1996), DCIEM English Unknown - Recognition Nl, Sleep deprive Elicited
Heuft et al. (1996) German 3 native - Synthesis Ar, Fr, Jy, Sd,. . . Sim.,Elic.
Iida et al. (2000), ESC Japanese 2 native - Synthesis Ar, Jy, Sd Simulated
Abbreviations for emotions: The emotion categories are abbreviated by a combination of the first and last letters of theirname. At: Amusement, Ay: Antipathy, Ar: Anger, Bm: Boredom, Dfn: Dissatisfaction, Dom: Dominance, Dn: Depression,Dt: Disgust, Fr: Fear, Hs: Happiness, Jy: Joy, Nl: Neutral, Se: Surprise, Sd: Sadness, Ss: Stress, Sy: Shyness, Td: Tiredness,Tl: Task load stress. Ellipsis denote that additional emotions were recorded.Abbreviations for other signals: BP: Blood pressure, EEG: Electroencephalogram, G: Galvanic skin response, H: Heartbeat rate, IR: Infrared Camera, LG: Laryngograph, M: Myogram of the face, R: Respiration, V: Video.Other abbreviations: H/C: Hot/cold, Ld eff.: Lombard effect, A-stress, P-stress, C-stress: Actual, Physical, and Cognitive
stress, respectively, Sim.: Simulated, Elic.:Elicited, N/A: Not available.
4

Emotional speech data collections (continued).
Reference Language Subjects Othersignals
Purpose Emotions Kind
Iriondo et al. (2000) Spanish 8 actors - Synthesis Fr, Jy, Sd, Se,. . . Simulated
Kawanami et al. (2003) Japanese 2 actors - Synthesis Ar, Hs, Nl, Sd Simulated
Lee and Narayanan (2005) English Unknown - Recognition Negative - positive Natural
Liberman (2005), Emotional Prosody English Actors - Unknown Anxty, H/C Ar, Hs,
Nl, Pc, Sd, Se, . . .
Simulated
Linnankoski et al. (2005) English 13 native - Recognition An, Ar, Fr, Sd,. . . Elicited
Lloyd (1999) English 1 native - Recognition Phonological stress Simulated
Makarova and Petrushin (2002), RUSS-
LANA
Russian 61 native - Recognition Ar, Hs, Se, Sd, Fr, NlSimulated
Martins et al. (1998), BDFALA Portuguese 10 native - Recognition Ar, Dt, Hs, Iy Simulated
McMahon et al. (2003), ORESTEIA English 29 native - Recognition Ae, Sk, Ss Elicited
Montanari et al. (2004) English 15 children V Recognition Unknown Natural
Montero et al. (1999), SES Spanish 1 actor - Synthesis Ar, Dt, Hs, Sd Simulated
Mozziconacci and Hermes (1997) Dutch 3 native - Recognition Ar, Bm, Fr, Jy, Iy, Nl,Sd
Simulated
Niimi et al. (2001) Japanese 1 male - Synthesis Ar, Jy, Sd Simulated
Nordstrand et al. (2004) Swedish 1 native V, IR Synthesis Hs, Nl Simulated
Nwe et al. (2003) Chinese 12 native - Recognition Ar, Fr, Dt, Jy, . . . Simulated
Pereira (2000) English 2 actors - Recognition H/C Ar, Hs, Nl, Sd Simulated
Petrushin (1999) English 30 native - Recognition Ar, Fr, Hs, Nl, Sd Simulated,Natural
Polzin and Waibel (2000) English Unknown - Recognition Ar, Fr, Nl, Sd Simulated
Polzin and Waibel (1998) English 5 drama stu-dents
LG Recognition Ar, Fr, Hs, Nl, Sd Simulated
Rahurkar and Hansen (2002), SOQ English 6 soldiers H,R,BP,BL
Recognition 5 stress levels Natural
Scherer (2000b) Lost Luggage Various 109 passengersV Recognition Ar, Hr, Ie, Sd, Ss Natural
Scherer (2000a) German 4 actors - Ecological Ar, Dt, Fr, Jy, Sd Simulated
Scherer et al. (2002) English,German
100 native - Recognition 2 Tl, 2 Ss Natural
Schiel et al. (2002), SmartKom German 45 native V Recognition Ar, Dn, Nl Natural
Schroder and Grice (2003) German 1 male - Synthesis Soft, modal, loud Simulated
Schroder (2000) German 6 native - Recognition Ar, Bm, Dt, Wy,. . . Simulated
Slaney and McRoberts (2003), BabyearsEnglish 12 native - Recognition Al, An, Pn Natural
Stibbard (2000), Leeds English Unknown - Recognition Wide range Natural,elicited
Tato (2002), AIBO German 14 native - Synthesis Ar, Bm, Hs, Nl, Sd Elicited
Tolkmitt and Scherer (1986) German 60 native - Recognition Cognitive Ss Elicited
Wendt and Scheich (2002), MagdeburgerGerman 2 actors - Recognition Ar, Dt, Fr, Hs, Sd Simulated
Yildirim et al. (2004) English 1 actress - Recognition Ar, Hs, Nl, Sd Simulated
Yu et al. (2001) Chinese Native fromTV
- Recognition Ar, Hs, Nl, Sd Simulated
Yuan (2002) Chinese 9 native - Recognition Ar, Fr, Jy, Nl, Sd Elicited
Abbreviations for emotions: The emotion categories are abbreviated by a combination of the first and last letters oftheir name. Ae: Annoyance, Al: Approval, Ar: Anger, An: Attention, Anxty: Anxiety, Bm: Boredom, Dn: Dissatisfaction,Dt: Disgust, Fr: Fear, Hs: Happiness, Ie: Indifference, Iy: Irony, Jy: Joy, Nl: Neutral, Pc: Panic, Pn: Prohibition, Se: Surprise,Sd: Sadness, Sk: Shock, Ss: Stress, Sy: Shyness, Wy: Worry. An ellipsis denotes that additional emotions were recorded.Abbreviations for other signals: BL: Blood examination, BP: Blood pressure, H: Heart beat rate, IR: Infrared Camera,LG: Laryngograph, R: Respiration, V: Video.Other abbreviations: H/C: Hot/cold, Ld eff.: Lombard effect.
5
explored (Batliner et al., 2004). Speech can bealso recorded during imposed stressed situations.For example when the subject adds numbers whiledriving a car at various speeds (Fernandez andPicard, 2003), or when the subject reads distantcar plates on a big computer screen (Steenekenand Hansen, 1999). Finally, subjects’ readings ofemotionally neutral sentences located betweenemotionally biased ones can be another manner ofrecording emotional speech.
3. Estimation of short-term acousticfeatures
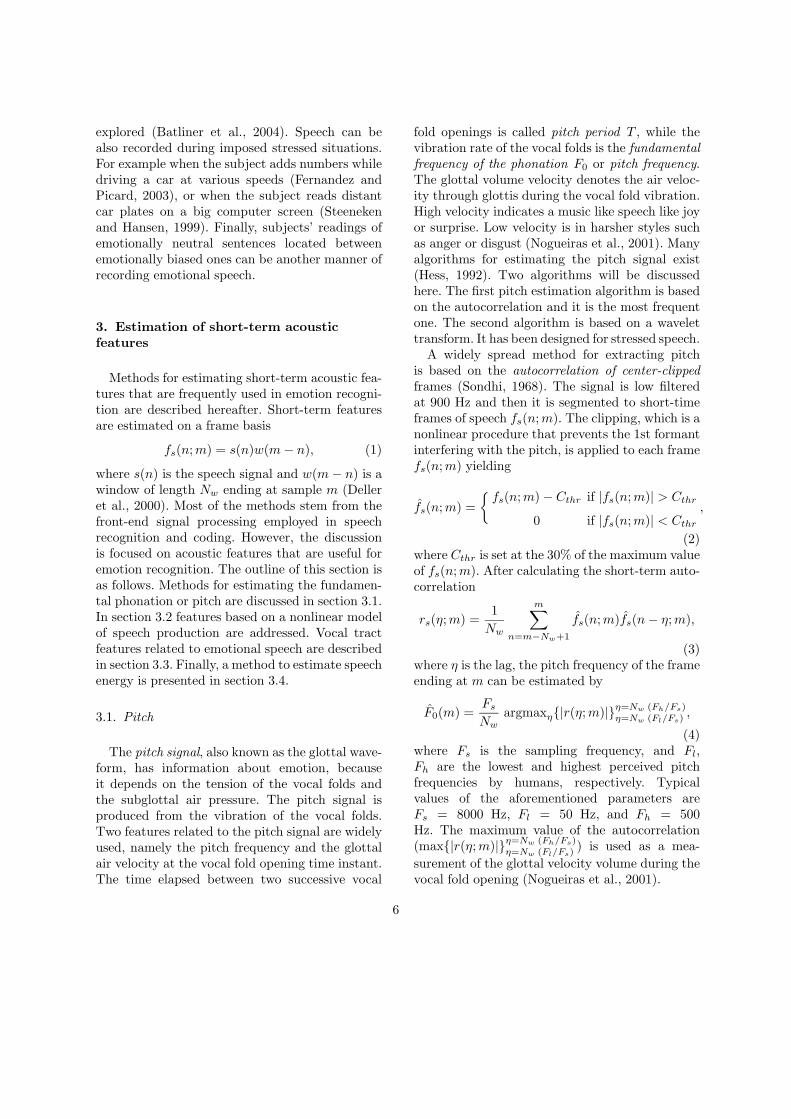
Methods for estimating short-term acoustic fea-tures that are frequently used in emotion recogni-tion are described hereafter. Short-term featuresare estimated on a frame basis
fs(n;m) = s(n)w(m − n), (1)
where s(n) is the speech signal and w(m − n) is awindow of length Nw ending at sample m (Delleret al., 2000). Most of the methods stem from thefront-end signal processing employed in speechrecognition and coding. However, the discussionis focused on acoustic features that are useful foremotion recognition. The outline of this section isas follows. Methods for estimating the fundamen-tal phonation or pitch are discussed in section 3.1.In section 3.2 features based on a nonlinear modelof speech production are addressed. Vocal tractfeatures related to emotional speech are describedin section 3.3. Finally, a method to estimate speechenergy is presented in section 3.4.
3.1. Pitch
The pitch signal, also known as the glottal wave-form, has information about emotion, becauseit depends on the tension of the vocal folds andthe subglottal air pressure. The pitch signal isproduced from the vibration of the vocal folds.Two features related to the pitch signal are widelyused, namely the pitch frequency and the glottalair velocity at the vocal fold opening time instant.The time elapsed between two successive vocal
fold openings is called pitch period T , while thevibration rate of the vocal folds is the fundamentalfrequency of the phonation F0 or pitch frequency.The glottal volume velocity denotes the air veloc-ity through glottis during the vocal fold vibration.High velocity indicates a music like speech like joyor surprise. Low velocity is in harsher styles suchas anger or disgust (Nogueiras et al., 2001). Manyalgorithms for estimating the pitch signal exist(Hess, 1992). Two algorithms will be discussedhere. The first pitch estimation algorithm is basedon the autocorrelation and it is the most frequentone. The second algorithm is based on a wavelettransform. It has been designed for stressed speech.
A widely spread method for extracting pitchis based on the autocorrelation of center-clippedframes (Sondhi, 1968). The signal is low filteredat 900 Hz and then it is segmented to short-timeframes of speech fs(n;m). The clipping, which is anonlinear procedure that prevents the 1st formantinterfering with the pitch, is applied to each framefs(n;m) yielding
fs(n;m) =
fs(n;m) − Cthr if |fs(n;m)| > Cthr
0 if |fs(n;m)| < Cthr
,
(2)where Cthr is set at the 30% of the maximum valueof fs(n;m). After calculating the short-term auto-correlation
rs(η;m) =1
Nw
m∑n=m−Nw+1
fs(n;m)fs(n − η;m),
(3)where η is the lag, the pitch frequency of the frameending at m can be estimated by
F0(m) =Fs
Nwargmaxη|r(η;m)|η=Nw (Fh/Fs)
η=Nw (Fl/Fs) ,
(4)where Fs is the sampling frequency, and Fl,Fh are the lowest and highest perceived pitchfrequencies by humans, respectively. Typicalvalues of the aforementioned parameters areFs = 8000 Hz, Fl = 50 Hz, and Fh = 500Hz. The maximum value of the autocorrelation(max|r(η;m)|η=Nw (Fh/Fs)
η=Nw (Fl/Fs) ) is used as a mea-surement of the glottal velocity volume during thevocal fold opening (Nogueiras et al., 2001).
6

The autocorrelation method for pitch estima-tion was used with low error in emotion classifica-tion (Tolkmitt and Scherer, 1986; Iida et al., 2003).However, it is argued that this method of extract-ing pitch is affected by the interference of the 1stformant in the pitch frequency, no matter whichthe parameters of the center clipping are (Tolk-mitt and Scherer, 1986). The clipping of small sig-nal values may not remove the effect of the nonlin-ear propagation of the air through the vocal tractwhich is an indication of the abnormal spectralcharacteristics during emotion.
The second method for estimating the pitchuses the wavelet transform (Cairns and Hansen,1994). It is a derivation of the method describedin (Kadambe and Boudreaux-Bartels, 1992). Thepitch period extraction is based on a two passdyadic wavelet transform over the signal. Let bdenote a time index, 2j be a scaling parameter,s(n) be the sampled speech signal, and φ(n) be acubic spline wavelet generated with the methodin (Mallat and Zhong, 1989). The dyadic wavelettransform is defined by
DyWT (b, 2j) =12j
n=+∞∑n=−∞
s(n) φ(n − b
2j). (5)
It represents a convolution of the time-reversedwavelet with the speech signal. This procedure isrepeated for 3 wavelet scales. In the first pass, theresult of the transform is windowed by a 16 ms rect-angular window shifted with a rate of 8 ms. Thepitch frequency is found by estimating the maximaof DyWT (b, 2j) across the 3 scales. Although themethod tracks the pitch epochs for neutral speech,it skips epochs for stressed speech. For marking thespeech epochs in stressed speech, a second pass ofwavelets is invented. In the second pass, the samewavelet transform is applied only in the intervalsbetween the first pass pitch periods found to have apitch epoch greater than 150% of the median valueof the pitch epochs measured during the first pass.The result of the second wavelet transform is win-dowed by a 8 ms window with a 4 ms skip rate tocapture the sudden pitch epochs that occur oftenin stressed speech.
The pitch period and the glottal volume velocityat the time instant of vocal fold opening are not
the only characteristics of the glottal waveform.The shape of the glottal waveform during a pitchperiod is also informative about the speech signaland probably has to do with the emotional coloringof the speech, a topic that has not been studiedadequately yet.
3.2. Teager energy operator
Another useful feature for emotion recognition isthe number of harmonics due to the nonlinear airflow in the vocal tract that produces the speech sig-nal. In the emotional state of anger or for stressedspeech, the fast air flow causes vortices located nearthe false vocal folds providing additional excitationsignals other than the pitch (Teager and Teager,1990; Zhou et al., 2001). The additional excitationsignals are apparent in the spectrum as harmonicsand cross-harmonics. In the following, a procedureto calculate the number of harmonics in the speechsignal is described.
Let us assume that a speech frame fs(n;m) hasa single harmonic which can be considered as anAM-FM sinewave. In discrete time, the AM-FMsinewave fs(n;m) can be represented as (Quatieri,2002)
fs(n;m) = α(n;m) cos(Φ(n;m)) =
α(n;m) cos(ωcn + ωh
∫ n
0
q(k)dk + θ)
(6)
with instantaneous amplitude α(n;m) and instan-taneous frequency
ωi(n;m) =dΦ(n;m)
dn= ωc + ωhq(n), |q(n)| ≤ 1,
(7)where ωc is the carrier frequency, ωh ∈ [0, ωc] is themaximum frequency deviation, and θ is a constantphase offset.
The Teager energy operator (TEO) (Teager andTeager, 1990)
Ψ[fs(n;m)] =(fs(n;m)
)2−fs(n+1;m)fs(n−1;m)(8)
when applied to an AM-FM sinewave yields thesquared product of the AM-FM components
Ψ[fs(n;m)] = α2(n;m) sin(ω2i (n;m)). (9)
7

The unknown parameters α(n;m) and ωi(n;m)can be estimated approximately with
ωi(n;m)≈ arcsin(
√Ψ[∆2]
4Ψ[fs(n;m)]), and (10)
α(n;m)≈ 2Ψ[fs(n;m)]√Ψ[∆2]
, (11)
where ∆2 = fs(n + 1;m) − fs(n − 1;m). Let usassume that within a speech frame each harmonichas an almost constant instantaneous amplitudeand constant instantaneous frequency. If the signalhas a single harmonic, then from (9) it is deducedthat the TEO profile is a constant number. Oth-erwise, if the signal has more than one harmonicthen the TEO profile is a function of n.
Since it is certain that more than one harmonicexist in the spectrum, it is more convenient tobreak the bandwidth into 16 small bands, andstudy each band independently. The polynomialcoefficients, which describe the TEO autocorre-lation envelope area, can be used as features forclassifying the speech into emotional states (Zhouet al., 2001). This method achieves a correct clas-sification rate of 89% in classifying neutral vs.stressed speech whereas MFCCs yield 67% in thesame task.
Pitch frequency also affects the number ofharmonics in the spectrum. Less harmonics areproduced when the pitch frequency is high. Moreharmonics are expected when the pitch frequencyis low. It seems that the harmonics from the addi-tional excitation signals due to vortices are moreintense than those caused by the pitch signal.The interaction of the two factors is a topic forfurther research. A method which can be usedto alleviate the presence of harmonics due to thepitch frequency factor is to normalize the speechso that it has a constant pitch frequency (Cairnsand Hansen, 1994).
3.3. Vocal tract features
The shape of the vocal tract is modified by theemotional states. Many features have been used todescribe the shape of the vocal tract during emo-tional speech production. Such features include
– the formants which are a representation of thevocal tract resonances,
– the cross-section areas when the vocal tractis modeled as a series of concatenated losslesstubes (Flanagan, 1972),
– the coefficients derived from frequency transfor-mations.The formants are one of the quantitative char-
acteristics of the vocal tract. In the frequency do-main, the location of vocal tract resonances de-pends upon the shape and the physical dimensionsof the vocal tract. Since the resonances tend to“form” the overall spectrum, speech scientists re-fer to them as formants. Each formant is charac-terized by its center frequency and its bandwidth.It has been found that subjects during stress orunder depression do not articulate voiced soundswith the same effort as in the neutral emotionalstate (Tolkmitt and Scherer, 1986; France et al.,2000). The formants can be used to discriminatethe improved articulated speech from the slackenedone. The formant bandwidth during slackened ar-ticulated speech is gradual, whereas the formantbandwidth during improved articulated speech isnarrow with steep flanks. Next, we describe meth-ods to estimate formant frequencies and formantbandwidths.
A simple method to estimate the formants relieson linear prediction analysis. Let an M -order all-pole vocal tract model with linear prediction coef-ficients (LPCs) a(i) be
Θ(z) =1
1 −∑M
i=1 a(i)z−i. (12)
The angles of Θ(z) poles which are further fromthe origin in the z-plane are indicators of theformant frequencies (Atal and Schroeder, 1967;Markel and Gray, 1976). When the distance of apole from the origin is large then the bandwidthof the corresponding formant is narrow with steepflanks, whereas when a pole is close to the originthen the bandwidth of the corresponding formantis wide with gradual flanks. Experimental analysishas shown that the first and second formants areaffected by the emotional states of speech morethan the other formants (Tolkmitt and Scherer,1986; France et al., 2000).
8

A problem faced with the LPCs in formant track-ing procedure is the false identification of the for-mants. For example, during the emotional statesof happiness and anger, the second formant (F2)is confused with the first formant (F1) and F1 in-terferes with the pitch frequency (Yildirim et al.,2004). A formant tracking method which does notsuffer from the aforementioned problems is pro-posed in (Cairns and Hansen, 1994), which wasoriginally developed by (Hanson et al., 1994). Han-son et al. (1994) found that an approximate esti-mate of a formant location, ωi(n;m) calculated by(10), could be used to iteratively refine the formantcenter frequency via
f l+1c (m) =
12πNw
m∑n=m−Nw+1
ωi(n;m), (13)
where f l+1c (m) is the formant center frequency dur-
ing iteration l+1. If the distance between f l+1c (m)
and f lc(m) is smaller than 10 Hz, then the method
stops and f l+1c is the formant frequency estimate.
In detail, f1c (m) is estimated by the formant fre-
quency estimation procedure that employs LPCs.The signal is filtered with a bandpass filter in orderto isolate the band which includes the formant. LetGl(n) be the impulse response of a Gabor band-pass filter
Gl(n) = exp[−(βnT )2] cos(2πf lcTn) (14)
where f lc is the center frequency, β the bandwidth
of the filter, and T is the sampling period. If f lc <
1000 Hz, then β equals to 800 Hz, otherwise β =1100 Hz. The value of β is chosen small enoughso as not to have more than one formant insidethe bandwidth and large enough to capture thechange of the instantaneous frequency. Then, f l+1
c
is estimated by (13). If the criterion |f l+1c −f l
c| < 10is satisfied, then the method stops, otherwise theframe is refiltered with the Gabor filter centered atf l+1
c . The latter is re-estimated with (13) and thecriterion is checked again. The method stops aftera few iterations. However, it is reported that thereare a few exceptions where the method does notconverge. This could be a topic for further study.
The second feature is the cross-section areas ofthe vocal tract modeled by the multitube losslessmodel (Flanagan, 1972). Each tube is describedby its cross-section area and its length. To a first
approximation, one may assume that there is noloss of energy due to soft wall vibrations, heat con-duction, and thermal viscosity. For a large numberof tubes, the model becomes a realistic represen-tation of the vocal tract, but it is not possible tobe computed in real time. A model that can eas-ily be computed is that of 10 cross-section areasof fixed length (Mrayati et al., 1988). The cross-section area near the glottis is indexed by A1 andthe others are following sequentially until the lips.The back vocal tract area A2 can be used to dis-criminate the neutral speech from that by angercolored, as A2 is greater in the former emotion thanin the latter one (Womack and Hansen, 1996).
The third feature is the energy of certain fre-quency bands. There are many contradictionsin identifying the best frequency band of thepower spectrum in order to classify emotions.Many investigators put high significance on thelow frequency bands, such as the 0-1.5 kHz band(Tolkmitt and Scherer, 1986; Banse and Scherer,1996; France et al., 2000) whereas other suggestthe opposite (Nwe et al., 2003). An explanationfor both opinions is that stressed or colored byanger speech may be expressed with a low artic-ulation effort, a fact which causes formant peaksmoothing and spectral flatness as well as energyshifting from low to high frequencies in the powerspectrum. The Mel-frequency cepstral coefficients(MFCCs) (Davis and Mermelstein, 1980) providea better representation of the signal than the fre-quency bands since they additionally exploit thehuman auditory frequency response. Nevertheless,the experimental results have demonstrated thatthe MFCCs achieve poor emotion classificationresults (Zhou et al., 2001; Nwe et al., 2003), whichmight be due to the textual dependency and theembedded pitch filtering during cepstral analysis(Davis and Mermelstein, 1980). Better featuresthan MFCCs for emotion classification in practiceare the log-frequency power coefficients (LFPCs)which include the pitch information (Nwe et al.,2003). The LFPCs are simply derived by filteringeach short-time spectrum with 12 bandpass filtershaving bandwidths and center frequencies corre-sponding to the critical bands of the human ear(Rabiner and Juang, 1993).
9

3.4. Speech energy
The short-term speech energy can be exploitedfor emotion recognition, because it is related to thearousal level of emotions. The short-term energyof the speech frame ending at m is
Es(m) =1
Nw
m∑n=m−Nw+1
|fs(n;m)|2. (15)
4. Cues to emotion
In this section, we review how the contour ofselected short-term acoustic features is affected bythe emotional states of anger, disgust, fear, joy, andsadness. A short-term feature contour is formed byassigning the feature value computed on a framebasis to all samples belonging to the frame. Forexample, the energy contour is given by
e(n) = Es(m), n = m − Nw + 1, . . . ,m. (16)
The contour trends (i.e. its plateaux, its rising orfalling slopes) is a valuable feature for emotionrecognition, because they describe the temporalcharacteristics of an emotion. The survey is limitedto those acoustic features for which at least tworeferences are found in the literature (Van Bezooi-jen, 1984; Cowie and Douglas-Cowie, 1996; Panticand Rothkrantz, 2003; Gonzalez, 1999; Heuft et al.,1996; Iida et al., 2000; Iriondo et al., 2000; Monteroet al., 1999; Mozziconacci and Hermes, 2000; Mur-ray and Arnott, 1996; Pollerman and Archinard,2002; Scherer, 2003; Ververidis and Kotropoulos,2004b; Yuan, 2002). The following statistics aremeasured for the extracted features:– Mean, range, variance, and the pitch contour
trends.– Mean and range of the intensity contour.– Rate of speech and transmission duration be-
tween utterances.The speech rate is calculated as the inverse dura-tion of the voiced part of speech determined bythe presence of pitch pulses (Dellaert et al., 1996;Banse and Scherer, 1996) or it can be found by therate of syllabic units. The speech signal can be seg-mented into syllabic units using the maxima andthe minima of energy contour (Mermelstein, 1975).
In Table 2, the behavior of the most studiedacoustic features for the five emotional states un-der consideration is outlined. Anger is the emo-tion of the highest energy and pitch level. Angrymales show higher levels of energy than angry fe-males. It is found that males express anger witha slow speech rate as opposed to females who em-ploy a fast speech rate under similar circumstances(Heuft et al., 1996; Iida et al., 2000). Disgust is ex-pressed with a low mean pitch level, a low inten-sity level, and a slower speech rate than the neu-tral state does. The emotional state of fear is corre-lated with a high pitch level and a raised intensitylevel. The majority of research outcomes reportsa wide pitch range. The pitch contour has fallingslopes and sometimes plateaux appear. The lapseof time between speech segments is shorter thanthat in the neutral state. Low levels of the meanintensity and mean pitch are measured when thesubjects express sadness. The speech rate undersimilar circumstances is generally slower than thatin the neutral state. The pitch contour trend is avaluable parameter, because it separates fear fromjoy. Fear resembles sadness having an almost down-wards slope in the pitch contour, whereas joy ex-hibits a rising slope. The speech rate varies withineach emotion. An interesting observation is thatmales speak faster when they are sad than whenthey are angry or disgusted.
The trends of prosody contours include discrimi-natory information about emotions. However, veryfew the efforts to describe the shape of feature con-tours in a systematic manner can be found in theliterature. In (Leinonen et al., 1997; Linnankoskiet al., 2005), several statistics are estimated onthe syllables of the word ‘Sarah’. However, thereis no consensus if the results obtained from a wordare universal due to textual dependency. Anotheroption is to estimate feature statistics on the ris-ing or falling slopes of contours as well as at theirplateaux at minima/maxima (McGilloway et al.,2000; Ververidis and Kotropoulos, 2004b; Banzigerand Scherer, 2005). Statistics such as the mean andthe variance are rather rudimentary. An alterna-tive is to transcribe the contour into discrete ele-ments, i.e. a sequence of symbols that provide in-formation about the tendency of a contour on ashort-time basis. Such elements can be provided by
10

Table 2Summary of the effects of several emotion states on selected acoustic features.
Pitch Intensity Timing
Mean Range Variance Contour Mean Range Speech rate Transmission duration
Anger >> > >> >>M , >F > <M , >F <
Disgust < >M , <F < <<M , <F
Fear >> > => <
Joy > > > > > <
Sadness < < < < < >M , <F >
Explanation of Symbols: >: increases, <: decreases, =: no change from neutral, : inclines, :declines. Double symbols indicate a change of increased predicted strength. The subscripts referto gender information: M stands for males and F stands for females.
the ToBI (Tones and Breaks Indices) system (Sil-verman et al., 1992). For example, the pitch con-tour is transcribed into a sequence of binary ele-ments L,H, where L stands for low and H standsfor high values, respectively. There is evidence thatsome sequences of L and H elements provide infor-mation about emotions (Stibbard, 2000). A simi-lar investigation for 10 elements that describe theduration and the inclination of rising and fallingslopes of pitch contour also exists (Mozziconacciand Hermes, 1997). Classifiers based on discrete el-ements have not been studied yet. In the followingsection, several techniques for emotion classifica-tion are described.
5. Emotion classification techniques
The output of emotion classification techniquesis a prediction value (label) about the emotionalstate of an utterance. An utterance uξ is a speechsegment corresponding to a word or a phrase. Letuξ, ξ ∈ 1, 2, . . . Ξ be an utterance of the datacollection. In order to evaluate the performanceof a classification technique, the crossvalidationmethod is used. According to this method, the ut-terances of the whole data collection are dividedinto the design set Ds containing NDs
utterancesand the test set Ts comprised of NTs
utterances.The classifiers are trained using the design set andthe classification error is estimated on the test set.The design and the test set are chosen randomly.This procedure is repeated for several times defined
by the user and the estimated classification error isthe average classification error over all repetitions(Efron and Tibshirani, 1993).
The classification techniques can be divided intotwo categories, namely those employing– prosody contours, i.e. sequences of short-time
prosody features,– statistics of prosody contours, like the mean, the
variance, etc. or the contour trends.The aforementioned categories will be reviewed in-dependently in this section.
5.1. Classification techniques that employ prosodycontours
The emotion classification techniques that em-ploy prosody contours exploit the temporal infor-mation of speech, and therefore could be usefulfor speech recognition. Three emotion classifi-cation techniques were found in the literature,namely a technique based on artificial neural net-works (ANNs) (Womack and Hansen, 1996), themulti-channel hidden Markov Model (Womack andHansen, 1999), and the mixture of hidden Markovmodels (Fernandez and Picard, 2003).
In the first classification technique, the short-time features are used as an input to an ANN inorder to classify utterances into emotional states(Womack and Hansen, 1996). The algorithm is de-picted in Figure 1. The utterance uξ is partitionedinto Q bins containing K frames each. Q variesaccording to the utterance length, whereas K isa constant number. Let xξq denote a bin of uξ,
11

where q ∈ 1, 2, . . . , Q. xξq is classified automati-cally to a phoneme group, such as fricatives (FR),vowels (VL), semi-vowels (SV) etc. by meansof hidden Markov Models (HMMs) (Pellom andHansen, 1996). Let Θλ denote the λth phonemegroup, where λ = 1, 2, . . . ,Λ. From each framet = 1, 2, . . . , K of the bin xξq, D features relatedto the emotional state of speech are extracted.Let yξqtd be the dth feature of the tth frame forthe bin xξq, where d ∈ 1, 2, . . . ,D. The K × Dmatrix of feature values is rearranged to a vectorof length KD, by lexicographic ordering of therows of the K × D matrix. This feature vector ofKD feature values extracted from the bin xξq isinput to the ANN described in section 5.2. Let Ωc
be an emotional state, where c ∈ 1, 2, . . . , C. AnANN is trained on the cth emotional state of theλth phoneme group. The output node of the ANNdenotes the likelihood of xξq given the emotionalstate Ωc and the phoneme group Θλ. The likeli-hood of an utterance uξ given the emotional stateΩc is the sum of the likelihoods for all xξq ∈ uξ
given Ωc and Θλ
P (uξ|Ωc) =Q∑
q=1
Λ∑λ=1
P (xξq|Ωc,Θλ)P (Θλ). (17)
The aforementioned technique achieves a correctclassification rate of 91% for 10 stress categoriesusing vocal tract cross-section areas (Womack andHansen, 1996). An issue for further study is theevolution of the emotional cues through time. Sucha study can be accomplished through a new clas-sifier which employs as input the output of eachANN.
The second emotion classification technique iscalled multi-channel hidden Markov model (Wom-ack and Hansen, 1999). Let si, i = 1, 2, . . . , V bea sequence of states of a single-channel HMM.By using a single-channel HMM, a classificationsystem can be described at any time as beingin one of V distinct states that correspond tophonemes, as is presented in Figure 2(a) (Ra-biner and Juang, 1993). The multi-channel HMMcombines the benefits of emotional speech clas-sification with a traditional single-channel HMMfor speech recognition. For example a C-channel
u =x 1,x 2,...,x Qx 1 x Q
P(x q| c, )
y q1Dy qK1 y qKDy q11
x 2 x q
y q11 y qK1
y q1D y qKD
1 2 KD
Fig. 1. An emotion classification technique that employsHMMs for phoneme classification and ANNs for emotionclassification.
HMM could be formulated to model speech fromC emotional states with one dimension allocatedfor each emotional state, as is depicted in Figure2(b). In detail, the multi-channel HMM consistsof states scv, v = 1, 2, . . . , V , c = 1, 2, . . . , C. Thestates scv, c = 1, 2, . . . , C form a disc. Transitionsare allowed from left to right as in a single-channelHMM, across emotional states within the samedisc, and across emotional states in the next disc.It offers the additional benefit of a sub-phonemespeech model at the emotional state level insteadof the phoneme level. The overall flexibility of themulti-channel HMM is improved by allowing acombined model where the integrity of each di-mension is preserved (Womack and Hansen, 1999).In addition to a C mixture single channel HMM itoffers separate state transition probabilities.
The training phase of the multi-channel HMMconsists of two steps. The first step requires train-ing of each single-channel HMM to an emotionalstate, and the second step combines the emotion-dependent single-channel HMMs into a multi-channel HMM. In order to classify an utterance, aprobability measurement is constructed. The like-lihood of an utterance given an emotional stateΩc is the ratio of the number of passes throughstates scv, v = 1, 2, . . . , V versus the total num-ber of state transitions. The multi-channel HMMwas used firstly for stress classification, and sec-
12

ondly for speech recognition on a data collectionconsisting of 35 words spoken in 4 stress styles.The correct stress classification rate achieved was57.6% using MFCCs, which was almost equal tothe stress classification rate of 58.6% achieved bythe single-channel HMM using the same features.A reason for the aforementioned performance de-terioration might be the small size of the datacollection (Womack and Hansen, 1999). However,the multi-channel HMM achieved a correct speechclassification rate of 94.4%, whereas the single-channel HMM achieved a rate of 78.7% in thesame task. The great performance of the multi-channel HMM in speech recognition experimentsmight be an indication that the proposed modelcan be useful for stress classification in large datacollections. A topic for further investigation wouldbe to model the transitions across the disks withan additional HMM or an ANN (Bou-Ghazale andHansen, 1998).
DISC 1
DISC 2
DISC V
s21
s22
s2V
s1V
s11
sc1
s12
sc2
scV
s1s2
sV
Fig. 2. Two structures of HMMs that can be used foremotion recognition: (a) a single-channel HMM, (b) amulti-channel HMM.
The third technique used for emotion classificationis the so called mixture of HMMs (Fernandez andPicard, 2003). The technique consists of two train-ing stages. In the first stage, an unsupervised itera-
tive clustering algorithm is used to discover M clus-ters in the feature space of the training data, whereit is assumed that the data of each cluster are gov-erned by a single underlying HMM. In the secondstage, a number of HMMs are trained on the clus-ters. Each HMM is trained on the cth emotionalstate of the mth cluster, where c = 1, 2, . . . , C andm = 1, 2, . . . ,M . Both training stages and the clas-sification of an utterance which belongs to the testset are described next.
In the first training stage, the utterances ofthe training set are divided into M clusters. LetΓ(l) = γ(l)
1 , . . . , γ(l)m , . . . , γ
(l)M be the clusters
at the lth iteration of the clustering algorithm,∆(l) = δ(l)
1 , . . . , δ(l)m , . . . , δ
(l)M be the HMM pa-
rameters for the cluster set Γ(l), P (uξ|δ(l)m ) be
the likelihood of uξ given the cluster with HMMparameters δ
(l)m , and
P (l) =M∑
m=1
∑uξ∈γ
(l)m
log P (uξ|δ(l)m ) (18)
be the log-likelihood of all utterances during thelth iteration. The iterative clustering procedure isdescribed in Figure 3. In the second training stage,
Step 1. Assign randomly the utterances to obtainthe initial clusters Γ(0). Calculate ∆(0) given Γ(0)
using the Viterbi algorithm (Rabiner and Juang,1993). Estimate P (0) using (18).Step 2. Re-assign the utterances using ∆(0) tothe cluster with the highest likelihood in orderto obtain Γ(1), i.e. assign uξ to γ
(1)
k, where k =
arg maxm P (uξ|δ(0)m ). Calculate ∆(1) from Γ(1). Es-
timate P (1).Step 3. Re-assign the utterances using ∆(l−1) toobtain Γ(l). Calculate ∆(l) from Γ(l). Estimate P (l).Step 4. If |P (l) − P (l−1)| < ε stop, where ε is auser-defined threshold. The procedure stops when(18) reaches a maximum. Otherwise, l = l + 1 andgo to Step 3.
Fig. 3. A clustering procedure that it is based on HMMs.
the utterances which have already been classifiedinto a cluster γm are used to train C HMMs, whereeach HMM corresponds to an emotional state. LetP (δm|Ωc) be the ratio of the utterances that were
13

assigned to cluster γm and belong to Ωc over thenumber of the training utterances. In order to clas-sify a test utterance uξ into an emotional state theBayes classifier is used. The probability of an emo-tional state Ωc given an utterance is
P (Ωc|uξ) =M∑
m=1
P (Ωc, δm|uξ) =
M∑m=1
P (uξ|Ωc, δm)P (δm|Ωc)P (Ωc), (19)
where P (uξ|Ωc, δm) is the output of the HMMwhich was trained on the emotional state Ωc ofthe cluster γm, and P (Ωc) is the likelihood of eachemotional state in the data collection. The correctclassification rate achieved for 4 emotional statesby the mixture of HMMs was 62% using energycontours in several frequency bands, whereas asingle-channel HMM yields a smaller classificationrate by 10% using the same features. A topic offuture investigation might be the clustering algo-rithm described in Figure 3. It is not clear whateach cluster of utterances represents. Also, theconvergence of the clustering procedure has notbeen investigated yet.
5.2. Classification techniques that employstatistics of prosody contours
Statistics of prosody contours have also beenused as features for emotion classification tech-niques. The major drawback of such classificationtechniques is the loss of the timing information. Inthis section, the emotion classification techniquesare separated into two classes, namely those thatestimate the probability density function (pdf) ofthe features and those that discriminate emotionalstates without any estimation of the feature distri-butions for each emotional state. In Table 3, theliterature related to discriminant classifiers appliedto emotion recognition is summarized. First, theBayes classifier when the class pdfs are modeledeither as Gaussians, or mixtures of Gaussians, orestimated via Parzen windows is described. Next,we briefly discuss classifiers that do not employ anypdf modeling such as the k-nearest neighbors, the
support vector machines, and the artificial neuralnetworks.
The features used for emotion classification arestatistics of the prosody contours such as the mean,the variance, etc. A full list of such features can befound in (Ververidis and Kotropoulos, 2004b). Letyξ = (yξ1 yξ2 . . . yξD)T be the measurement vectorcontaining yξd statistics extracted from uξ, whered = 1, 2, . . . ,D denotes the feature index.
According to the Bayes classifier, an utteranceuξ is assigned to emotional state Ωc, if
c = arg maxCc=1P (yξ|Ωc)P (Ωc), (20)
where P (y|Ωc) is the pdf of yξ given the emotionalstate Ωc, and P (Ωc) is the prior probability of hav-ing the emotional state Ωc. P (Ωc) represents theknowledge we have about the emotional state of anutterance before the measurement vector of thatutterance is available. Three methods for estimat-ing P (y|Ωc) will be summarized, namely the sin-gle Gaussian model, the mixture of Gaussian den-sities model or Gaussian Mixture Model (GMM),and the estimation via Parzen windows.
Suppose that a measurement vector yξ comingfrom utterances that belong to Ωc is distributedaccording to a single multivariate Gaussian distri-bution:
P (y|Ωc) = g(y;µc,Σc) =
exp[− 12 (y − µc)T Σ−1
c (y − µc)](2π)D/2|det(Σc)|1/2
, (21)
where µc,Σc are the mean vector and the covari-ance matrix, and det is the determinant of a matrix.The Bayes classifier, when the class conditionalpdfs of the energy and pitch contour statistics aremodeled by (21), achieves a correct classificationrate of a 56% for 4 emotional states (Dellaert et al.,1996). The benefit of the Gaussian model is that itis estimated fast. Its drawback is that the assump-tion of Gaussian distributed features may not betrue for real data. Linear discriminant analysis is amethod to improve the classification rates achievedby the Bayes classifier, when each P (y|Ωc) is mod-eled as in (21).
In linear discriminant analysis the measurementspace is transformed so that the separability be-tween the emotional states is maximized. We will
14

Table 3Discriminant classifiers for emotion recognition.
Classifier References
With pdf modeling Bayes classifier using one Gaussian pdf Dellaert et al. (1996); Schuller et al. (2004)
Bayes classifier using one Gaussian pdfwith linear discriminant analysis
France et al. (2000); Lee and Narayanan (2005)
Bayes classifier using pdfs estimated byParzen windows
Dellaert et al. (1996); Ververidis et al. (2004a)
Bayes classifier using a mixture of Gaus-sian pdfs
Slaney and McRoberts (2003); Schuller et al. (2004); Jiangand Cai (2004); Ververidis and Kotropoulos (2005)
Without pdf modeling K-Nearest Neighbors Dellaert et al. (1996); Petrushin (1999); Picard et al. (2001)
Support Vector Machines McGilloway et al. (2000); Fernandez and Picard (2003);Kwon et al. (2003)
Artificial Neural Networks Petrushin (1999); Tato (2002); Shi et al. (2003); Fernandezand Picard (2003); Schuller et al. (2004)
focus on the problem of two emotional states Ω1
and Ω2 to maintain simplicity. Let N1 and N2 bethe number of utterances that belong to Ω1 and Ω2,respectively. The separability between the emo-tional states can be expressed by several criteria.One such criterion is the
J = tr(S−1w Sb), (22)
where Sw is the within emotional states scattermatrix defined by
Sw =N1
NsΣ1 +
N2
NsΣ2, (23)
and Sb is the between emotional states scatter ma-trix given by
Sb =N1
Ns(µ1 − µ0)(µ1 − µ0)
T +
N2
Ns(µ2 − µ0)(µ2 − µ0)
T (24)
where µ0 is the gross mean vector. A linear trans-formation z = AT y of measurements from spaceY to space Z which maximizes J is sought. Thescatter matrices SbZ and SwZ in the Z-space arecalculated from Sb and Sw in the Y -space by
SbZ = AT SbY A, (25)
SwZ = AT SwY A.
Thus, the problem of transformation is to find Awhich optimizes J in the Z-space. It can be shownthat the optimum A is the matrix formed by the
eigenvectors that correspond to the maximal eigen-values of S−1
wY SbY . A linear discriminant classifierachieves a correct classification of 93% for 2 emo-tional classes using statistics of pitch and energycontours (Lee and Narayanan, 2005). Linear dis-crimination analysis has a disadvantage. The cri-terion in (22) may not be a good measure of emo-tional state separability when the pdf of each emo-tional state in the measurement space Y is not aGaussian (21) (Fukunaga, 1990).
In the GMM, it is assumed that the measure-ment vectors yξ of an emotional state Ωc are di-vided into clusters, and the measurement vectorsin each cluster follow a Gaussian pdf. Let Kc bethe number of clusters in the emotional state Ωc.The complete pdf estimate is
P (y|Ωc) =Kc∑k=1
g(y;µck,Σck) (26)
which depends on the mean vector µck, the covari-ance matrix Σck, and the mixing parameter πck
(∑Kc
k=1 πck = 1, πck ≥ 0) of the kth cluster in thecth emotional state. The parameters µck,Σck, πck
are calculated with the expectation maximizationalgorithm (EM) (Dempster et al., 1977), and Kc
can be derived by the Akaike information criterion(Akaike, 1974). A correct classification rate of 75%for 3 emotional states is achieved by the Bayes clas-sifier, when each P (y|Ωc) of pitch and energy con-tour statistics is modeled as a mixture of Gaussiandensities (Slaney and McRoberts, 2003). The ad-
15
vantage of the Gaussian mixture modeling is thatit might discover relationships between the clus-ters and the speakers. A disadvantage is that theEM converges to a local optimum.
By using Parzen windows an estimate of theP (y|Ωc) could also be obtained. It is certain that atyξ corresponding to uξ ∈ Ωc, p(yξ|Ωc) = 0. Sincean emotional state pdf is continuous over the mea-surement space, it is expected that P (y|Ωc) in theneighborhood of yξ should also be nonzero. Thefurther we move away from yξ, the less we can sayabout the P (y|Ωc). When using Parzen windowsfor class pdf estimation, the knowledge gained bythe measurement vector yξ is represented by afunction positioned at yξ and with an influence re-stricted to the neighborhood of yξ. Such a functionis called the kernel of the estimator. The kernelfunction h(·) can be any function from R
+ → R+
that admits a maximum at yξ and it is monoton-ically increasing as y → yξ. Let d(y,yξ) be theEuclidean, Mahalanobis or any other appropriatedistance measure. The pdf of an emotional stateΩc is estimated by (van der Heijden et al., 2004)
P (y|Ωc) =1
Nc
∑yξ∈Ωc
h(d(y,yξ)). (27)
A Bayes classifier achieves a correct classificationrate of 53% for 5 emotional states, when eachP (y|Ωc) of pitch and energy contour statistics isestimated via Parzen windows (Ververidis et al.,2004a). An advantage by estimating P (y|Ωc) viaParzen windows is that a prior knowledge aboutthe conditional pdf of the measurement vectors isnot required. The pdfs of the measurement vectorfor small data collections are hard to find. Theexecution time for modeling a conditional pdf byParzen windows is relatively shorter than by aGMM estimated with the EM algorithm. A dis-advantage is that the estimate of P (y|Ωc) has agreat number of peaks that are not present in thereal pdf.
A support vector classifier separates the emo-tional states with a maximal margin. The marginγ is defined by the width of the largest ‘tube’ notcontaining utterances that can be drawn around adecision boundary. The measurement vectors thatdefine the boundaries of the margin are called sup-
port vectors. We shall confine ourselves to a two-class problem without any loss of generality. A sup-port vector classifier was originally designed for atwo-class problem, but it can be expanded to moreclasses.
Let us assume that a training set of utterancesis denoted by uξNDs
ξ=1 = (yξ, lξ)NDs
ξ=1 , where lξ ∈−1,+1 is the emotional state membership ofeach utterance. The classifier is a hyperplane
g(y) = wT y + b, (28)
where w is the gradient vector which is perpendic-ular to the hyperplane, and b is the offset of thehyperplane from the origin. It can be shown thatthe margin is inversely proportional to ||w||2/2.The quantity lξg(yξ) can be used to indicate towhich side of the hyperplane the utterance belongsto. lξg(yξ) must be greater than 1, if lξ = +1 andsmaller than −1, if lξ = −1. Thus, the choice ofthe hyperplane can be rephrased to the followingoptimization problem in the separable case:
minimize12wT w
subject to lξ(wT y + b) ≥ 1, ξ = 1, 2, . . . , NDs.
(29)
A global optimum for the parameters w, b is foundby using Lagrange multipliers (Shawe-Taylor andCristianini, 2004). Extension to the non-separablecase can be made by employing slack variables.The advantage of support vector classifier is thatit can be extended to nonlinear boundaries by thekernel trick. For 4 stress styles, the support vectorclassifier can achieve a correct classification rateof 46% using energy contours in several frequencybands (Fernandez and Picard, 2003).
The k-nearest neighbor classifier (k-NN) assignsan utterance to an emotional state according to theemotional state of the k utterances that are closestto uξ in the measurement space. In order to mea-sure the distance between uξ and the neighbors,the Euclidean distance is used. The k-NN classi-fier achieves a correct classification rate of 64% for4 emotional states using statistics of pitch and en-ergy contours (Dellaert et al., 1996). The disad-vantages of k-NN is that systematic methods forselecting the optimum number of the closest neigh-
16

bors and the most suitable distance measure arehard to find. If k equals to 1, then the classifierwill classify all the utterances in the design set cor-rectly, but its performance on the test set will bepoor. As k → ∞, a less biased classifier is obtained.In the latter case, the optimality is not feasible fora finite number of utterances in the data collection(van der Heijden et al., 2004).
ANN-based classifiers are used for emotion clas-sification due to their ability to find nonlinearboundaries separating the emotional states. Themost frequently used class of neural networks isthat of feedforward ANNs, in which the input fea-ture values propagate through the network in aforward direction on a layer-by-layer basis. Typi-cally, the network consists of a set of sensory unitsthat constitute the input layer, one or more hid-den layers of computation nodes, and an outputlayer of computational nodes. Let us consider anone-hidden layer feedforward neural network thathas Q input nodes, A hidden nodes, and B outputnodes, as is depicted in Figure 4.
1 q Q
q1 qA
1 B
B1 b
1 A
Fig. 4. An one hidden layer feedforward neural network.
The neural network provides a mapping of the formz = f(y) defined by
va = g1(wTa y + w0), (30)
zb = g2(uTb v + u0), (31)
where W = [wqa] = [w1| . . . |wa| . . . |wA] is theweight matrix, wa is its ath column, w0 is the bias,and g1(·) is the activation function for the inputlayer. Similarly U = [uab] = [u1| . . . |ub| . . . |uB ] isthe weight matrix for the hidden layer ,ub is its bthcolumn, u0 is the bias, and g2(·) is the activationfunction for the hidden layer. Usually, g1(·) is thesigmoid function described by
g1(v) =1
1 + exp(−v), (32)
and g2(·) is the softmax function defined by
g2(v) =exp(v)∑B
b=1 exp(vb). (33)
Activation functions for the hidden units areneeded to introduce a nonlinearity into the net-work. The softmax function guarantees that theoutputs lie between zero and one and sum toone. Thus, the outputs of a network can be inter-preted as posterior probabilities for an emotionalstate. The weights are updated with the back-propagation learning method (Haykin, 1998). Theobjective of the learning method is to adjust thefree parameters of the network so that the meansquare error defined by a sum of squared errorsbetween the output of the neural network and thetarget is minimized:
JSE =12
NDs∑ξ=1
B∑b=1
(fb(yξ) − lξ,b)2, (34)
where fb denotes the value of the bth output node.The target is usually created by assigning lξ,b = 1,if the label of yξ is Ωb. Otherwise, lξb is 0. In emo-tion classification experiments, the ANN-basedclassifiers are used in two ways:– An ANN is trained to all emotional states.– A number of ANNs is used, where each ANN is
trained to a specific emotional state.In the first case, the number of output nodes ofthe ANN equals the number of emotional states,whereas in the latter case each ANN has one out-put node. An interesting property of ANNs is thatby changing the number of hidden nodes and hid-den layers we control the nonlinear decision bound-aries between the emotional states (Haykin, 1998;van der Heijden et al., 2004). The ANN-based clas-sifiers may achieve a correct classification rate of50.5% for 4 emotional states using energy contoursin several frequency bands (Fernandez and Picard,2003) or 75% for 7 emotional states using pitch andenergy contour statistics of another data collection(Schuller et al., 2004).
17
6. Concluding remarks
In this paper, several topics have been ad-dressed. First, a list of data collections was pro-vided including all available information about thedatabases such as the kinds of emotions, the lan-guage, etc. Nevertheless, there are still some copy-right problems since the material from radio orTV is held under a limited agreement with broad-casters. Furthermore, there is a need for adoptingprotocols such as those in (Douglas-Cowie et al.,2003; Scherer, 2003; Schroder, 2005) that addressissues related to data collection. Links with stan-dardization activities like MPEG-4 and MPEG-7concerning the emotion states and features shouldbe established. It is recommended the data to bedistributed by organizations (like LDC or ELRA),and not by individual research organizations orproject initiatives, under a reasonable fee so thatthe experiments reported using the specific datacollections could be repeated. This is not the casewith the majority of the databases reviewed inthis paper, whose terms of distribution are ratherunclear.
Second, our survey has been focussed on fea-ture extraction methods that are useful in emo-tion recognition. The most interesting features arethe pitch, the formants, the short-term energy, theMFCCs, the cross-section areas, and the Teagerenergy operator based features. Features that arebased on voice production models have not fullybeen investigated (Womack and Hansen, 1996).Nonlinear aspects of speech production also con-tribute to the emotional speech coloring. Revisit-ing the fundamental models of voice production isexpected to boost further the performance of emo-tional speech classification.
Third, techniques for speech classification intoemotional states have been reviewed. The classifi-cation rates reported in the related literature arenot directly comparable with each other, becausethey were measured on different data collections byapplying different experimental protocols. There-fore, besides the availability of data collections,common experimental protocols should be definedand adopted, as for example in speech/speakerrecognition, biometric person authentication,
etc. Launching competitions like those regularlyhosted by NIST ( i.e. TREC, TRECVID, FERET,etc.) would be worth pursuing. The techniqueswere separated into two categories, namely theones that exploit timing information and thoseignoring any timing information. In the formercategory, three techniques based on ANNs andHMMs were described. There are two differencesbetween HMM- and ANN-based classifiers. First,HMM-based classifiers require strong assumptionsabout the statistical characteristics of the input,such as the parameterization of the input densi-ties as GMMs. In many cases, correlation betweenthe features is not included. This assumption isnot required for ANN-based classifiers. An ANNlearns something about the correlation betweenthe acoustic features. Second, ANNs offer a goodmatch with discriminative objective functions. Forexample, it is possible to maximize discriminationbetween the emotional states rather than to mostfaithfully approximate the distributions withineach class (Morgan and Bourlard, 1995). The ad-vantage of techniques exploiting timing informa-tion is that they can be used for speech recognitionas well. A topic that has not been investigated isthe evolution of emotional cues through time. Suchan investigation can be achieved by a classifierthat uses timing information for long speech peri-ods. Well-known discrimination classifiers that donot exploit timing information have also been re-viewed. Such classifiers include the support vectormachines, the Bayes classifier with the class pdfsmodeled as mixtures of Gaussians, the k-nearestneighbors, etc. The techniques that model featurepdfs may reveal cues about the modalities of thespeech, such as the speaker gender and the speakeridentities. One of the major drawbacks of theseapproaches is the loss of the timing information,because the techniques employ statistics of theprosody features such as the mean, the variance,etc. and neglect the sampling order. A way to over-come the problem is to calculate statistics overrising/falling slopes or during the plateaux at min-ima/maxima (McGilloway et al., 2000; Ververidisand Kotropoulos, 2005). It appears that most ofthe contour statistics follow the Gaussian distri-bution or the X 2, or can be modeled by mixtureof Gaussians. However, an analytical study of the
18
feature distributions has not been undertaken yet.Most of the emotion research activity has been
focused on advancing the emotion classificationperformance. In spite of the extensive research inemotion recognition, efficient speech normaliza-tion techniques that exploit the emotional stateinformation to improve speech recognition havenot been developed yet.
Acknowledgments
This work has been supported by the researchproject 01ED312 “Use of Virtual Reality for train-ing pupils to deal with earthquakes” financed bythe Greek Secretariat of Research and Technology.
References
Abelin, A., Allwood, J., 2000. Cross linguistic interpreta-tion of emotional prosody. In: Proc. ISCA WorkshopSpeech and Emotion. Vol. 1. pp. 110–113.
Akaike, H., 1974. A new look at the statistical model iden-tification. IEEE Trans. Automatic Control 19 (6), 716–723.
Alpert, M., Pouget, E. R., Silva, R. R., 2001. Reflections ofdepression in acoustic measures of the patients speech.J. Affective Disorders 66, 59–69.
Alter, K., Rank, E., Kotz, S. A., 2000. Accentuation andemotions - two different systems? In: Proc. ISCA Work-shop Speech and Emotion. Vol. 1. Belfast, pp. 138–142.
Ambrus, D. C., 2000. Collecting and recording of an emo-tional speech database. Tech. rep., Faculty of ElectricalEngineering, Institute of Electronics, Univ. of Maribor.
Amir, N., Ron, S., Laor, N., 2000. Analysis of an emotionalspeech corpus in Hebrew based on objective criteria.In: Proc. ISCA Workshop Speech and Emotion. Vol. 1.Belfast, pp. 29–33.
Ang, J., Dhillon, R., Krupski, A., Shriberg, E., Stolcke, A.,2002. Prosody-based automatic detection of annoyanceand frustration in human-computer dialog. In: Proc. Int.Conf. Spoken Language Processing (ICSLP ’02). Vol. 3.pp. 2037–2040.
Anscombe, E., Geach, P. T. (Eds.), 1970. Descartes Philo-sophical Writings, 2nd Edition. Melbourne, Australia:Nelson. Original work published in 1952.
Atal, B., Schroeder, M., 1967. Predictive coding of speech
signals. In: Proc. Conference on Communications and
Processing. pp. 360–361.
Banse, R., Scherer, K., 1996. Acoustic profiles in vocalemotion expression. J. Personality and Social Psychol-ogy 70 (3), 641–636.
Banziger, T., Scherer, K., 2005. The role of intonation inemotional expressions. Speech Communication 46, 252–267.
Batliner, A., Hacker, C., Steidl, S., Noth, E., D’ Archy,S., Russell, M., Wong, M., 2004. “You stupid tin box”- children interacting with the AIBO robot: A cross-linguistic emotional speech corpus. In: Proc. LanguageResources and Evaluation (LREC ’04). Lisbon.
Bou-Ghazale, S. E., Hansen, J., 1998. Hmm based stressedspeech modelling with application to improved synthesisand recognition of isolated speech under stress. IEEETrans. Speech and Audio Processing 6, 201–216.
Buck, R., 1999. The biological affects, a typology. Psycho-logical Rev. 106 (2), 301–336.
Bulut, M., Narayanan, S. S., Sydral, A. K., 2002. Expres-sive speech synthesis using a concatenative synthesizer.In: Proc. Int. Conf. Spoken Language Processing (IC-SLP ’02). Vol. 2. pp. 1265–1268.
Burkhardt, F., Sendlmeier, W. F., 2000. Verification ofacoustical correlates of emotional speech using formant-synthesis. In: Proc. ISCA Workshop Speech and Emo-tion. Vol. 1. Belfast, pp. 151–156.
Cairns, D., Hansen, J. H. L., 1994. Nonlinear analysis anddetection of speech under stressed conditions. J. Acoust.Society of America 96 (6), 3392–3400.
Caldognetto, E. M., Cosi, P., Drioli, C., Tisato, G., Cav-icchio, F., 2004. Modifications of phonetic labial targetsin emotive speech: effects of the co-production of speechand emotions. Speech Communication 44, 173–185.
Choukri, K., 2003. European Language Resources Associ-ation, (ELRA). URL www.elra.info
Chuang, Z. J., Wu, C. H., 2002. Emotion recognition fromtextual input using an emotional semantic network. In:Proc. Int. Conf. Spoken Language Processing (ICSLP’02). Vol. 3. pp. 2033–2036.
Clavel, C., Vasilescu, I., Devillers, L., Ehrette, T., 2004.Fiction database for emotion detection in abnormal sit-uations. In: Proc. Int. Conf. Spoken Language Process.(ICSLP ’04). Korea, pp. 2277–2280.
Cole, R., 2005. The CU kids’ speech corpus. The Centerfor Spoken Language Research (CSLR). URL http://
cslr.colorado.edu/
Cowie, R., Cornelius, R. R., 2003. Describing the emotionalstates that are expressed in speech. Speech Communi-cation 40 (1), 5–32.
Cowie, R., Douglas-Cowie, E., 1996. Automatic statisticalanalysis of the signal and prosodic signs of emotion inspeech. In: Proc. Int. Conf. Spoken Language Processing(ICSLP ’96). Vol. 3. pp. 1989–1992.
Cowie, R., Douglas-Cowie, E., Tsapatsoulis, N., Votsis, G.,Kollias, S., Fellenz, W., Taylor, J. G., 2001. Emotionrecognition in human-computer interaction. IEEE SignalProcessing Magazine 18 (1), 32–80.
Davis, S. B., Mermelstein, P., 1980. Comparison of para-
19

metric representations for monosyllabic word recogni-tion in continuously spoken sentences. IEEE Trans.Acoustics, Speech and Signal Processing 28, 357–366.
Dellaert, F., Polzin, T., Waibel, A., 1996. Recognizing emo-tion in speech. In: Proc. Int. Conf. Spoken LanguageProcessing (ICSLP ’96). Vol. 3. pp. 1970–1973.
Deller, J. R., Hansen, J. H. L., Proakis, J. G., 2000. Discete-Time Processing of Speech Signals. N.Y.: Wiley.
Dempster, A. P., Laird, N. M., Rubin, D. B., 1977. Maxi-
mum likelihood from incomplete data via the em algo-
rithm. Journal of the Royal Statistical Society. Series B,
39, 1–88.Douglas-Cowie, E., Campbell, N., Cowie, R., Roach, P.,
2003. Emotional speech: Towards a new generation ofdatabases. Speech Communication 40, 33–60.
Eckman, P., 1992. An argument for basic emotions. Cog-nition and Emotion 6, 169–200.
Edgington, M., 1997. Investigating the limitations ofconcatenative synthesis. In: Proc. European Conf.Speech Communication and Technology (Eurospeech’97). Vol. 1. pp. 593–596.
Efron, B., Tibshirani, R. E., 1993. An Introduction to theBootstrap. N.Y.: Chapman & HALL/CRC.
Engberg, I. S., Hansen, A. V., 1996. Documentation ofthe Danish Emotional Speech database (DES). InternalAAU report, Center for Person Kommunikation, Aal-borg Univ., Denmark.
Fernandez, R., Picard, R., 2003. Modeling drivers’ speechunder stress. Speech Communication 40, 145–159.
Fischer, K., 1999. Annotating emotional language data.Tech. Rep. 236, Univ. of Hamburg.
Flanagan, J. L., 1972. Speech Analysis, Synthesis, and Per-ception, 2nd Edition. N.Y.: Springer-Verlag.
France, D. J., Shiavi, R. G., Silverman, S., Silverman, M.,Wilkes, M., 2000. Acoustical properties of speech asindicators of depression and suicidal risk. IEEE Trans.Biomedical Engineering 7, 829–837.
Fukunaga, K., 1990. Introduction to Statistical PatternRecognition, 2nd Edition. N.Y.: Academic Press.
Gonzalez, G. M., 1999. Bilingual computer-assisted psycho-logical assessment: An innovative approach for screeningdepression in Chicanos/Latinos. Tech. Rep. 39, Univ.Michigan.
Hansen, J. H. L., 1996. NATO IST-03 (Formerly RSG.10) speech under stress web page. URL http://cslr.
colorado.edu/rspl/stress.html
Hansen, J. H. L., Cairns, D. A., 1995. ICARUS: Source
generator based real-time recognition of speech in noisy
stressful and Lombard effect enviroments. Speech Com-
munication 16, 391–422.Hanson, H. M., Maragos, P., Potamianos, A., 1994. A sys-
tem for finding speech formants and modulations viaenergy separation. IEEE Trans. Speech and Audio Pro-cessing 2 (3), 436–442.
Haykin, S., 1998. Neural Networks: A Comprehensive Foun-dation, 2nd Edition. N.J.: Prentice Hall.
Hess, W. J., 1992. Pitch and voicing determination, In:
Furui, S., Sondhi, M.M., (Eds.) Advances in SpeechSignal Processing. N.Y.: Marcel Dekker.
Heuft, B., Portele, T., Rauth, M., 1996. Emotions in timedomain synthesis. In: Proc. Int. Conf. Spoken LanguageProcessing (ICSLP ’96). Vol. 3. pp. 1974–1977.
Iida, A., Campbell, N., Higuchi, F., Yasumura, M., 2003.
A corpus-based speech synthesis system with emotion.
Speech Communication 40, 161–187.Iida, A., Campbell, N., Iga, S., Higuchi, F., Yasumura, M.,
2000. A speech synthesis system with emotion for assist-
ing communication. In: Proc. ISCA Workshop Speech
and Emotion. Vol. 1. Belfast, pp. 167–172.Iriondo, I., Guaus, R., Rodriguez, A., 2000. Validation of
an acoustical modeling of emotional expression in Span-ish using speech synthesis techniques. In: Proc. ISCAWorkshop Speech and Emotion. Vol. 1. Belfast, pp. 161–166.
Jiang, D. N., Cai, L. H., 2004. Speech emotion classificationwith the combination of statistic features and tempo-ral features. In: Proc. Int. Conf. Multimedia and Expo(ICME ’04). Taipei.
Kadambe, S., Boudreaux-Bartels, G. F., 1992. Applicationof the wavelet transform for pitch detection of signals.IEEE Trans. Information Theory 38 (2), 917–924.
Kawanami, H., Iwami, Y., Toda, T., Shikano, K., 2003.GMM-based voice conversion applied to emotionalspeech synthesis. In: Proc. European Conf. Speech Com-munication and Technology (Eurospeech ’03). Vol. 4.pp. 2401–2404.
Kwon, O. W., Chan, K. L., Hao, J., Lee, T. W., 2003.Emotion recognition by speech signals. In: Proc. Eu-ropean Conf. Speech Communication and Technology(Eurospeech ’03). Vol. 1. pp. 125–128.
Lee, C. M., Narayanan, S. S., 2005. Toward detecting emo-tions in spoken dialogs. IEEE Trans. Speech and AudioProcess. 13 (2), 293–303.
Leinonen, L., Hiltunen, T., Linnankoski, I., Laakso, M.,1997. Expression of emotional motivational connotationswith a one-word utterance. J. Acoust. Soc. Am. 102 (3),1853–1863.
Liberman, M., 2005. Linguistic Data Consurtium (LDC).URL http://www.ldc.upenn.edu/
Linnankoski, I., Leinonen, L., Vihla, M., Laakso, M., Carl-son, S., 2005. Conveyance of emotional connotations bya single word in English. Speech Communication 45,27–39.
Lloyd, A. J., 1999. Comprehension of prosody in Parkin-
son’s disease. Proc. Cortex 35 (3), 389–402.Makarova, V., Petrushin, V. A., 2002. RUSLANA: A
database of russian emotional utterances. In: Proc. Int.Conf. Spoken Language Processing (ICSLP ’02). Vol. 1.pp. 2041–2044.
Mallat, S. G., Zhong, S., 1989. Complete signal represen-tation with multiscale edges. Tech. rep., Courant Inst.of Math. Sci., rRT-483-RR-219.
Markel, J. D., Gray, A. H., 1976. Linear Prediction ofSpeech. N.Y.: Springer-Verlag.
20

Martins, C., Mascarenhas, I., Meinedo, H., Oliveira, L.,Neto, J., Ribeiro, C., Trancoso, I., Viana, C., 1998. Spo-ken language corpora for speech recognition and synthe-sis in European Portuguese. In: Proc. Tenth PortugueseConf. Pattern Recognition (RECPAD ’98). Lisboa.
McGilloway, S., Cowie, R., Douglas-Cowie, E., Gielen,
C. C. A. M., Westerdijk, M. J. D., Stroeve, S. H.,
2000. Approaching automatic recognition of emotion
from voice: A rough benchmark. In: Proc. ISCA Work-
shop Speech and Emotion. Vol. 1. pp. 207–212.McMahon, E., Cowie, R., Kasderidis, S., Taylor, J., Kol-
lias, S., 2003. What chance that a DC could recognisehazardous mental states from sensor outputs? In: Talesof the Disappearing Computer. Santorini, Greece.
Mermelstein, P., 1975. Automatic segmentation of speechinto syllabic units. J. Acoust. Soc. America 58 (4), 880–883.
Montanari, S., Yildirim, S., Andersen, E., Narayanan,S., 2004. Reference marking in children ’s computed-directed speech: An integrated analysis of discourse andgestures. In: Proc. Int. Conf. Spoken Language Process-ing (ICSLP ’04). Vol. 1. Korea, pp. 1841–1844.
Montero, J. M., Gutierrez-Arriola, J., Colas, J., Enriquez,E., Pardo, J. M., 1999. Analysis and modelling of emo-tional speech in spanish. In: Proc. Int. Conf. Phoneticsand Speech (ICPhS ’99). Vol. 2. San Francisco, pp. 957–960.
Morgan, N., Bourlard, H., 1995. Continuous speech recog-nition. IEEE Signal Processing Magazine 12 (3), 24–42.
Mozziconacci, S. J. L., Hermes, D. J., 1997. A study ofintonation patterns in speech expressing emotion or at-titude: Production and perception. Tech. Rep. 32, Eind-hoven, IPO Annual Progress Report.
Mozziconacci, S. J. L., Hermes, D. J., 2000. Expression ofemotion and attitude through temporal speech varia-tions. In: Proc. Int. Conf. Spoken Language Processing(ICSLP ’00). Vol. 2. Beijing, pp. 373–378.
Mrayati, M., Carre, R., Guerin, B., 1988. Dinstictive re-gions and models:A new theory of speech production.Speech Communication 7 (3), 257–286.
Murray, I., Arnott, J. L., 1996. Synthesizing emotions inspeech: Is it time to get excited. In: Proc. Int. Conf.Spoken Language Processing (ICSLP ’96). Vol. 3. pp.1816–1819.
Nakatsu, R., Solomides, A., Tosa, N., 1999. Emotion recog-nition and its application to computer agents with spon-taneous interactive capabilities. In: Proc. Int. Conf. Mul-timedia Computing and Systems (ICMCS ’99). Vol. 2.Florence, pp. 804–808.
Niimi, Y., Kasamatu, M., Nishimoto, T., Araki, M., 2001.Synthesis of emotional speech using prosodically bal-anced VCV segments. In: Proc. ISCA Tutorial andWorkshop on Research Synthesis (SSW 4). Scotland.
Nogueiras, A., Marino, J. B., Moreno, A., Bonafonte, A.,2001. Speech emotion recognition using hidden Markovmodels. In: Proc. European Conf. Speech Communica-tion and Technology (Eurospeech ’01). Denmark.
Nordstrand, M., Svanfeldt, G., Granstrom, B., House, D.,2004. Measurements of ariculatory variation in expres-sive speech for a set of Swedish vowels. Speech Commu-nication 44, 187–196.
Nwe, T. L., Foo, S. W., De Silva, L. C., 2003. Speech emo-tion recognition using hidden Markov models. SpeechCommunication 41, 603–623.
Pantic, M., Rothkrantz, L. J. M., 2003. Toward an affect-sensitive multimodal human-computer interaction. Pro-ceedings of the IEEE 91 (9), 1370–1390.
Pellom, B. L., Hansen, J. H. L., 1996. Text-directed speechenhancement using phoneme classfication and featuremap constrained vector quantization. In: Proc. Inter.Conf. Acoustics, Speech, and Signal Processing (ICASSP’96). Vol. 2. pp. 645–648.
Pereira, C., 2000. Dimensions of emotional meaning inspeech. In: Proc. ISCA Workshop Speech and Emotion.Vol. 1. Belfast, pp. 25–28.
Petrushin, V. A., 1999. Emotion in speech recognition andapplication to call centers. In: Proc. Artificial NeuralNetworks in Engineering (ANNIE 99). Vol. 1. pp. 7–10.
Picard, R. W., Vyzas, E., Healey, J., 2001. Toward machineemotional intelligence: Analysis of affective physiologicalstate. IEEE Trans. on Pattern Analysis and MachineIntelligence 23 (10), 1175–1191.
Pollerman, B. Z., Archinard, M., 2002. Improvements inSpeech Synthesis. England: John Wiley & Sons Ltd.
Polzin, T., Waibel, A., 2000. Emotion-sensitive human-computer interfaces. In: Proc. ISCA Workshop Speechand Emotion. Vol. 1. Belfast, pp. 201–206.
Polzin, T. S., Waibel, A. H., 1998. Detecting emotions inspeech. In: Proc. Cooperative Multimodal Communica-tion (CMC ’98).
Quatieri, T. F., 2002. Discrete-Time Speech Signal Pro-cessing. NJ: Prentice-Hall.
Rabiner, L. R., Juang, B. H., 1993. Fundamentals of SpeechRecognition. NJ: Prentice-Hall.
Rahurkar, M., Hansen, J. H. L., 2002. Frequency bandanalysis for stress detection using a Teager energy oper-ator based feature. In: Proc. Int. Conf. Spoken LanguageProcessing (ICSLP ’02). Vol. 3. pp. 2021–2024.
Scherer, K. R., 2000a. A cross-cultural investigation of emo-tion inferences from voice and speech: Implications forspeech technology. In: Proc. Int. Conf. Spoken LanguageProcessing (ICSLP ’00). Vol. 1. pp. 379–382.
Scherer, K. R., 2000b. Emotion effects on voice and speech:Paradigms and approaches to evaluation. In: Proc. ISCAWorkshop Speech and Emotion. Belfast, invited paper.
Scherer, K. R., 2003. Vocal communication of emotion: Areview of research paradigms. Speech Communication40, 227–256.
Scherer, K. R., Banse, R., Wallbot, H. G., Goldbeck, T.,1991. Vocal clues in emotion encoding and decoding. In:Proc. Motiv Emotion. Vol. 15. pp. 123–148.
Scherer, K. R., Grandjean, D., Johnstone, L. T., G. Klas-meyer, T. B., 2002. Acoustic correlates of task load andstress. In: Proc. Int. Conf. Spoken Language Processing
21

(ICSLP ’02). Vol. 3. Colorado, pp. 2017–2020.Schiel, F., Steininger, S., Turk, U., 2002. The Smartkom
multimodal corpus at BAS. In: Proc. Language Re-sources and Evaluation (LREC ’02).
Schroder, M., 2000. Experimental study of affect bursts.In: Proc. ISCA Workshop Speech and Emotion. Vol. 1.pp. 132–137.
Schroder, M., 2005. Humaine consortium: Research onemotions and human-machine interaction. URL http:
//emotion-research.net/
Schroder, M., Grice, M., 2003. Expressing vocal effort inconcatenative synthesis. In: Proc. Int. Conf. PhoneticSciences (ICPhS ’03). Barcelona.
Schuller, B., Rigoll, G., Lang, M., 2004. Speech emotionrecognition combining acoustic features and linguisticinformation in a hybrid support vector machine-beliefnetwork architecture. In: Proc. Int. Conf. Acoustics,Speech and Signal Processing (ICASSP ’04). Vol. 1. pp.557–560.
Shawe-Taylor, J., Cristianini, N., 2004. Kernel Methods forPattern Analysis. Cambridge: University Press.
Shi, R. P., Adelhardt, J., Zeissler, V., Batliner, A., Frank,C., Noth, E., Niemann, H., 2003. Using speech and ges-ture to explore user states in multimodal dialogue sys-tems. In: Proc. ISCA Tutorial and Research WorkshopAudio Visual Speech Processing (AVSP ’03). Vol. 1. pp.151–156.
Silverman, K., Beckman, M., Pitrelli, J., Ostendorf, M.,Wightman, C., Price, P., Pierrehumbert, J., Hirschberg,J., 1992. ToBI: A standard for labeling english prosody.In: Proc. Inter. Conf. Spoken Language Processing (IC-SLP ’92). Vol. 2. pp. 867–870.
Slaney, M., McRoberts, G., 2003. Babyears: A recognitionsystem for affective vocalizations. Speech Comunnica-tion 39, 367–384.
Sondhi, M. M., 1968. New methods of pitch extraction.IEEE Trans. Audio and Electroacoustics 16, 262–266.
Steeneken, H. J. M., Hansen, J. H. L., 1999. Speech understress conditions: Overview of the effect of speech pro-duction and on system performance. In: Proc. Int. Conf.Acoustics, Speech, and Signal Processing (ICASSP ’99).Vol. 4. Phoenix, pp. 2079–2082.
Stibbard, R., 2000. Automated extraction of ToBI anno-tation data from the Reading/Leeds emotional speechcorpus. In: Proc. ISCA Workshop Speech and Emotion.Vol. 1. Belfast, pp. 60–65.
Tato, R., 2002. Emotional space improves emotion recog-
nition. In: Proc. Int. Conf. Spoken Language Processing
(ICSLP ’02). Vol. 3. Colorado, pp. 2029–2032.Teager, H. M., Teager, S. M., 1990. Evidence for nonlinear
sound production mechanisms in the vocal tract (NATOAdvanced Study Institute, Series D, vol. 15). Boston,MA: Kluwer.
Tolkmitt, F. J., Scherer, K. R., 1986. Effect of experi-mentally induced stress on vocal parameters. J. Experi-mental Psychology: Human Perception and Performance12 (3), 302–313.
Van Bezooijen, R., 1984. The Characterisitcs and Recog-nizability of Vocal Expression of Emotions. Drodrecht,The Netherlands: Foris.
van der Heijden, F., Duin, R. P. W., de Ridder, D., Tax,D. M. J., 2004. Classification, Parameter Estimationand State estimation - An Engineering Approach usingMatlab. London, U.K.: J. Wiley & Sons.
Ververidis, D., Kotropoulos, C., 2004b. Automatic speechclassification to five emotional states based on genderinformation. In: Proc. European Signal Processing Conf.(EUSIPCO ’04). Vol. 1. pp. 341–344.
Ververidis, D., Kotropoulos, C., 2005. Emotional speechclassification using Gaussian mixture models and thesequential floating forward selection algorithm. In: Proc.Int. Conf. Multimedia and Expo (ICME ’05).
Ververidis, D., Kotropoulos, C., Pitas, I., 2004a. Auto-matic emotional speech classification. In: Proc. Int.Conf. Acoustics, Speech and Signal Processing (ICASSP’04). Vol. 1. Montreal, pp. 593–596.
Wagner, J., Kim, J., Andre, E., 2005. From physiologicalsignals to emotions: implementing and comparing se-lected methods for feature extraction and classification.In: Proc. Int. Conf. Multimedia and Expo (ICME ’05).Amsterdam.
Wendt, B., Scheich, H., 2002. The Magdeburger prosodie-korpus. In: Proc. Speech Prosody Conf. pp. 699–701.
Womack, B. D., Hansen, J. H. L., 1996. Classification ofspeech under stress using target driven features. SpeechCommunication 20, 131–150.
Womack, B. D., Hansen, J. H. L., 1999. N-channel hiddenMarkov models for combined stressed speech classifica-tion and recognition. IEEE Trans. Speech and AudioProcessing 7 (6), 668–667.
Yildirim, S., Bulut, M., Lee, C. M., Kazemzadeh, A., Busso,C., Deng, Z., Lee, S., Narayanan, S., 2004. An acousticstudy of emotions expressed in speech. In: Proc. Int.Conf. Spoken Language Processing (ICSLP ’04). Vol. 1.Korea, pp. 2193–2196.
Yu, F., Chang, E., Xu, Y. Q., Shum, H. Y., 2001. Emotiondetection from speech to enrich multimedia content. In:Proc. IEEE Pacific-Rim Conf. Multimedia 2001. Vol. 1.Beijing, pp. 550–557.
Yuan, J., 2002. The acoustic realization of anger, fear, joyand sadness in Chinese. In: Proc. Int. Conf. SpokenLanguage Processing (ICSLP ’02). Vol. 3. pp. 2025–2028.
Zhou, G., Hansen, J. H. L., Kaiser, J. F., 2001. Nonlinearfeature based classification of speech under stress. IEEETrans. Speech and Audio Processing 9 (3), 201–216.
22