Embed Size (px)
Citation preview
Energy Dispersive X-Ray Fluorescence Evaluation of Debris from F- 18 Engine OilFilters
Gary R. HumphreyJoint Oil Analysis Program Technical Support Center (JOAP-TSC)
296 Farrar RoadPensacola, Florida 32508-5010
(850) 452-3191 ext 105
Robert WhitlockNaval Research Laboratory code 6680
4555 Overlook Avenue SW, Washington DC 20375(202) 404-4321
Capt. D. Little and Sgt. R. GodinCanadian Department of National Defence
Aerospace and Telecommunications Engineering Support SquardonCFB Trenton, Astra, Ontario
(613) 392-2811 ext 3163
Abstract: Traditionally, the primary analytical instrument that monitors the "health" ofmechanical oil systems in the U.S. Department of Defense (DoD) and CanadianDepartment of National Defence (CDND) is rotrode atomic emission spectroscopy(AES). The engine oil filter installed in the F- 18 engine captures particles from the engineoil stream as small as 0.3 microns. This phenomenon renders AES surveillance of theF- 18 engine oil system ineffective in detecting abnormal wear and impending enginefailure. The debris that is extracted from the F-18 engine oil filter and captured onexternal filter media contains all the information necessary to detect abnormal wear andengine failure in the oil wetted sections of the F- 18 engine. However, the debris is not ina suitable form to be analyzed by AES and requires considerable effort, time andhazardous chemicals to transform the debris into a form suitable for analysis by AES.[1]A method has been developed at the JOAP-TSC that utilizes Energy Dispersive X-RayFluorescence (EDXRF) to analyze the debris extracted from the engine oil filter andcaptured on filter media with little effort. Warning levels for elements have been <3)statistically derived. The EDXRF Filter Debris Analysis (FDA) method provided 100 ormore operating hours of advanced warning of engine failure. In addition, theEDXRF-FDA method can indicate the areas of wear in the engine. The Canadian Forces(CF) at Trenton in conjunction with GasTops LTD have developed and tested a prototypeDeployable Filter Debris Analysis (DFDA) machine that automatically cleans F- 18engine oil filters. The instrument also segregates particles according to size andferromagnetic properties. A comparison is made between the evaluations of the particleson the DFDA filter and EDXRF analysis of the same particulate samples.
MC __ 1tAMD
Keywords: Energy Dispersive X-Ray Fluorescence, rotrode Atomic EmissionSpectroscopy, Ferrography, wear condition.
Introduction: The JOAP-TSC has developed a method to analyze the debris fromlubricant filters utilizing Energy Dispersive X-Ray Fluorescence (EDXRF). EDXRF is amature technology however, the methodology and interpretation of the EDXRF signaldeveloped at the JOAP-TSC is a novel, cutting edge approach to applying EDXRFtechnology. The EDXRF- Filter Debris Analysis (FDA) technique is able to characterizedebris from the F404 engine oil system, an extraordinarily fine filtered lubricant system,and yields a condition monitoring technology that can predict failure 100 hours inadvance.
Background: Rotrode atomic emission spectroscopy (AES) has been used as theprimary analytical tool for monitoring the condition of weapon systems in the U.S.Department of Defense (DOD) and the Canadian Department of National Defence(CDND) for a number of years. The advantages of using AES include the following:
--- high numbers of samples can be analyzed per hour --- approximately 30 samplesper hour
--- simultaneous determination of 15 elements in lubricants--- no sample preparation required
However, AES has limitations:--- can not detect particles larger than 8-10 microns [2],--- matrix interference from the lubricant and--- ineffective as a condition monitoring tool for lubricant systems equipped with 3
micron absolute filtration
Particle counting offers insights into monitoring the condition of weapon systems.Particle counting yields the following:
--- high numbers of samples can be analyzed per hour --- approximately 25,--- distribution of particles by sizes,--- particle populations in specific particle size ranges and--- particulate loading of the system
Particulate analysis has limitations:--- fine filtration is a problem,--- no information about the elemental composition of the particles,--- no information on the source of the wear particulates and--- yields gross indication on the wear condition of the machine.
For particulate analysis to be successful, it must be used with a technology that canidentify the elemental composition of the particles.
Ferrography is a methodology in which microscopic examination of particles isperformed to classify the particles by particle morphology. It offers the analyst a methodto do the following:
--- Classify the shapes of particles as originating from surfaces experiencing cutting,sliding, bearing, etc. wear and
--- can be related to wear modes experienced by the machinery.Ferrography has disadvantages:
--- time per sample is high -- up to 1 hour per sample--- requires intensive training,--- labor intensive--- fine filtration of lubricant systems is a problem for ferrography of a lubricant
sample and--- only empirical identification of particles can be achieved by observing the color of
particles, heat treatment of particles to observe color changes associated with temperatureand by employing other, chemical analytical methods to identify particle composition.
Fine filters are employed in lubricant systems to eliminate the recirculation of particleslarger than 3 microns through the lubricant system. The particles are deemed harmfuland the elimination of the particles by the fine filter, 3 microns and above, would greatlyreduce the secondary wear these particles could induce. The inability of AES to monitorfine filtered lubricant systems and the subsequent removal of weapon systems equippedwith fine filtration mean that other techniques, e.g., magnetic chip detectors, physicalproperty analysis, etc., are employed in an attempt to monitor the wear condition of theseweapon systems. Magnetic chip detectors are inefficient and are designed to only captureferromagnetic particles. In the F404 engine, there are numerous alloys that are notferromagnetic, but are critical to assessing the wear condition of the engine and indetecting the onset failure modes in the F404 engine. The success of a magnetic chipdetector depends upon the size of the particle, morphology of the particle, strength of themagnetic field and the location of the chip detector.[3] Another approach to reducingfailures is to change out components, modules, etc. based solely upon the amount of timethe component or module is in operation. This can be an effective technique to reducethe number of failures. Even though all of these techniques are used to directly orindirectly monitor the condition of fine filtered systems - magnetic chip detectors andphysical property analysis in conjunction with the removal of components or modulesbased upon the time they are in operation - a fine filtered lubricant system like the F404engine still experiences failures. [4]
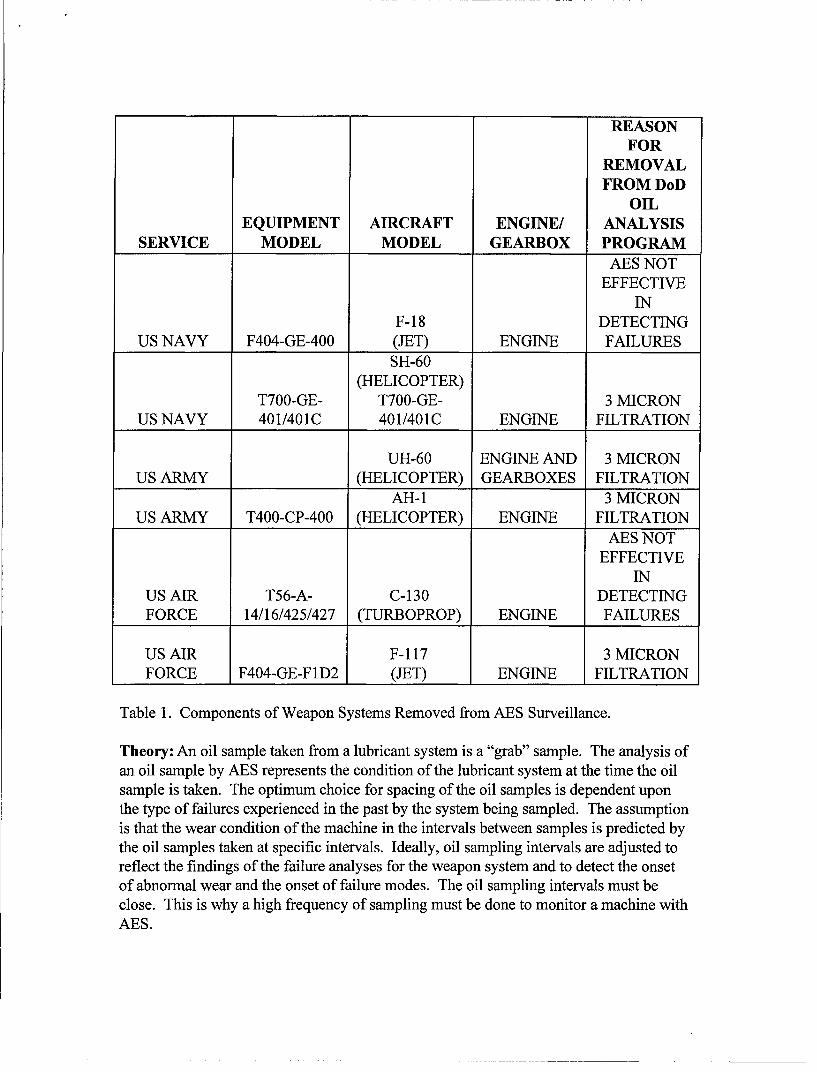
Table 1 depicts a few examples of weapon systems or components that had beenmonitored by AES, but were removed from monitoring due to fine filtration or becauseAES is ineffective in predicting the abnormal wear and onset of the failure modes of theweapon system. The F404 engine used in the F- 18 aircraft is the focus of this study. TheF404 is equipped with three separate lubricant systems - Airframe Mounted AccessoryDrive (AMAD), engine lubricant system and Variable Engine Nozzle (VEN). Eachsystem is lubricated with MIL-L-23699 synthetic oil and has an oil filter. The subject ofthe EDXRF study is the debris extracted from the engine oil filter.
REASONFOR
REMOVALFROM DoD
OILEQUIPMENT AIRCRAFT ENGINE/ ANALYSIS
SERVICE MODEL MODEL GEARBOX PROGRAMAES NOT
EFFECTIVEIN
F-18 DETECTINGUS NAVY F404-GE-400 (JET) ENGINE FAILURES
SH-60(HELICOPTER)
T700-GE- T700-GE- 3 MICRONUS NAVY 401/401C 401/401C ENGINE FILTRATION
UH-60 ENGINE AND 3 MICRONUS ARMY (HELICOPTER) GEARBOXES FILTRATION
AH-1 3 MICRONUS ARMY T400-CP-400 (HELICOPTER) ENGINE FILTRATION
AES NOTEFFECTIVE
INUS AIR T56-A- C-130 DETECTINGFORCE 14/16/425/427 (TURBOPROP) ENGINE FAILURES
US AIR F-117 3 MICRONFORCE F404-GE-F1D2 (JET) ENGINE FILTRATION
Table 1. Components of Weapon Systems Removed from AES Surveillance.
Theory: An oil sample taken from a lubricant system is a "grab" sample. The analysis ofan oil sample by AES represents the condition of the lubricant system at the time the oilsample is taken. The optimum choice for spacing of the oil samples is dependent uponthe type of failures experienced in the past by the system being sampled. The assumptionis that the wear condition of the machine in the intervals between samples is predicted bythe oil samples taken at specific intervals. Ideally, oil sampling intervals are adjusted toreflect the findings of the failure analyses for the weapon system and to detect the onsetof abnormal wear and the onset of failure modes. The oil sampling intervals must beclose. This is why a high frequency of sampling must be done to monitor a machine withAES.
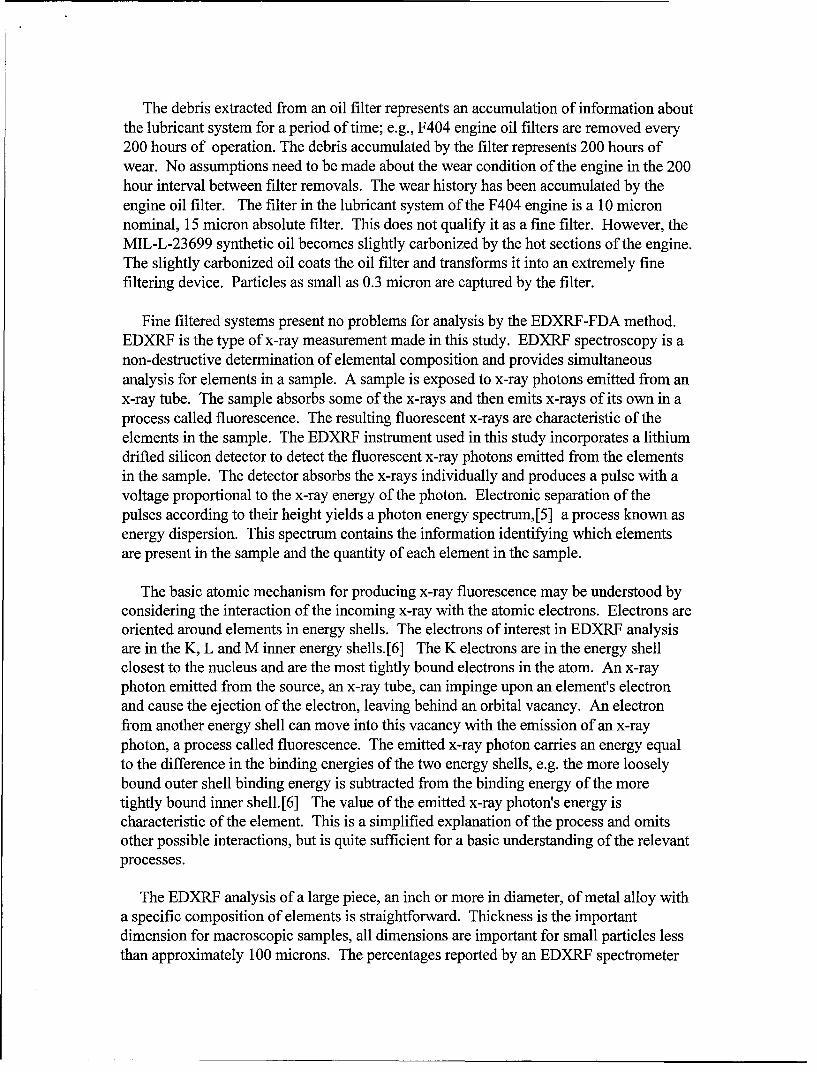
The debris extracted from an oil filter represents an accumulation of information aboutthe lubricant system for a period of time; e.g., F404 engine oil filters are removed every200 hours of operation. The debris accumulated by the filter represents 200 hours ofwear. No assumptions need to be made about the wear condition of the engine in the 200hour interval between filter removals. The wear history has been accumulated by theengine oil filter. The filter in the lubricant system of the F404 engine is a 10 micronnominal, 15 micron absolute filter. This does not qualify it as a fine filter. However, theMIL-L-23699 synthetic oil becomes slightly carbonized by the hot sections of the engine.The slightly carbonized oil coats the oil filter and transforms it into an extremely finefiltering device. Particles as small as 0.3 micron are captured by the filter.
Fine filtered systems present no problems for analysis by the EDXRF-FDA method.EDXRF is the type of x-ray measurement made in this study. EDXRF spectroscopy is anon-destructive determination of elemental composition and provides simultaneousanalysis for elements in a sample. A sample is exposed to x-ray photons emitted from anx-ray tube. The sample absorbs some of the x-rays and then emits x-rays of its own in aprocess called fluorescence. The resulting fluorescent x-rays are characteristic of theelements in the sample. The EDXRF instrument used in this study incorporates a lithiumdrifted silicon detector to detect the fluorescent x-ray photons emitted from the elementsin the sample. The detector absorbs the x-rays individually and produces a pulse with avoltage proportional to the x-ray energy of the photon. Electronic separation of thepulses according to their height yields a photon energy spectrum,[5] a process known asenergy dispersion. This spectrum contains the information identifying which elementsare present in the sample and the quantity of each element in the sample.
The basic atomic mechanism for producing x-ray fluorescence may be understood byconsidering the interaction of the incoming x-ray with the atomic electrons. Electrons areoriented around elements in energy shells. The electrons of interest in EDXRF analysisare in the K, L and M inner energy shells.[6] The K electrons are in the energy shellclosest to the nucleus and are the most tightly bound electrons in the atom. An x-rayphoton emitted from the source, an x-ray tube, can impinge upon an element's electronand cause the ejection of the electron, leaving behind an orbital vacancy. An electronfrom another energy shell can move into this vacancy with the emission of an x-rayphoton, a process called fluorescence. The emitted x-ray photon carries an energy equalto the difference in the binding energies of the two energy shells, e.g. the more looselybound outer shell binding energy is subtracted from the binding energy of the moretightly bound inner shell.[6] The value of the emitted x-ray photon's energy ischaracteristic of the element. This is a simplified explanation of the process and omitsother possible interactions, but is quite sufficient for a basic understanding of the relevantprocesses.
The EDXRF analysis of a large piece, an inch or more in diameter, of metal alloy witha specific composition of elements is straightforward. Thickness is the importantdimension for macroscopic samples, all dimensions are important for small particles lessthan approximately 100 microns. The percentages reported by an EDXRF spectrometer
analysis can be related to the concentration of each element in the alloy. However, thedebris from oil filters is composed of metal particles from many different alloys. Thepercentage of a given element in this mixture of several alloys does not have the samemeaning as the percentage of the element in a single alloy and is not directly related tothe elemental concentrations in any of the individual particles. The elemental analysis ofwear particulates by EDXRF, for the purposes of condition monitoring, can be carried outquite effectively by a statistical analysis of the percentages alone without addressing thetheoretically complicated issue of concentration for these particulates.
The particulate sample is also different from the bulk sample. A sufficiently thinsample will produce fewer total fluorescent x-rays, although the average number offluorescent x-rays per atom will be greater than for a bulk sample. The x-ray spectraldata was analyzed by an approach called thin film analysis. Thin film analysis applieswhere all of the atoms that compose the film transmit essentially all the fluorescent x-rays, which occurs for films and debris samples having a maximum thickness of about 1micron. [7] The real samples of wear particulates prepared in this application are amixture of infinitely thin films and intermediate thickness films (that fall between thickfilms and infinitely thin films). Such thickness effects, when discussed in terms ofparticulate samples, are often referred to as particle size effects. Fortunately, the effect ofparticle size is to increase the measurement sensitivity for smaller particles and isaccounted for in the statistical analysis of the data.
Intermediate thickness films, large particles, and bulk samples of alloys can exhibitmatrix effects, where the fluorescent intensity radiated, per atom of a given element,depends upon the alloy composition. This complication can be handled with aFundamental Parameters (FP) calculation. The FP calculation produces the matrixcorrection factors (alphas) and the estimate of sample thickness. The FP calculationestimates the thickness by comparing measured x-ray intensities to theoretical x-rayintensities expected from a sample of a given thickness. The FP calculation goes throughiterations until the program finds the thickness which matches the theoretical x-rayintensities with the measured x-ray intensities. Once the thickness is found, the matrixcorrection factors (alphas) are calculated for the unknown sample. [7] Once the FPanalysis is complete, the corrected data may be analyzed and compared with the enginehistory.
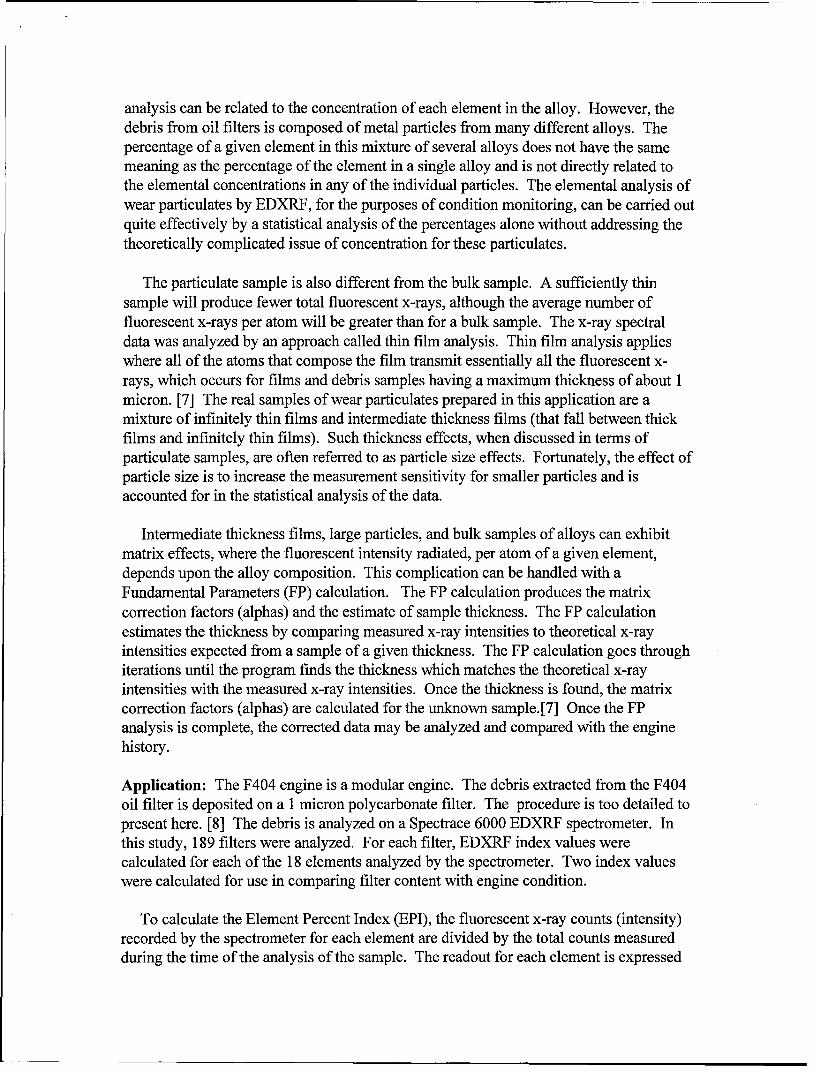
Application: The F404 engine is a modular engine. The debris extracted from the F404oil filter is deposited on a 1 micron polycarbonate filter. The procedure is too detailed topresent here. [8] The debris is analyzed on a Spectrace 6000 EDXRF spectrometer. Inthis study, 189 filters were analyzed. For each filter, EDXRF index values werecalculated for each of the 18 elements analyzed by the spectrometer. Two index valueswere calculated for use in comparing filter content with engine condition.
To calculate the Element Percent Index (EPI), the fluorescent x-ray counts (intensity)recorded by the spectrometer for each element are divided by the total counts measuredduring the time of the analysis of the sample. The readout for each element is expressed
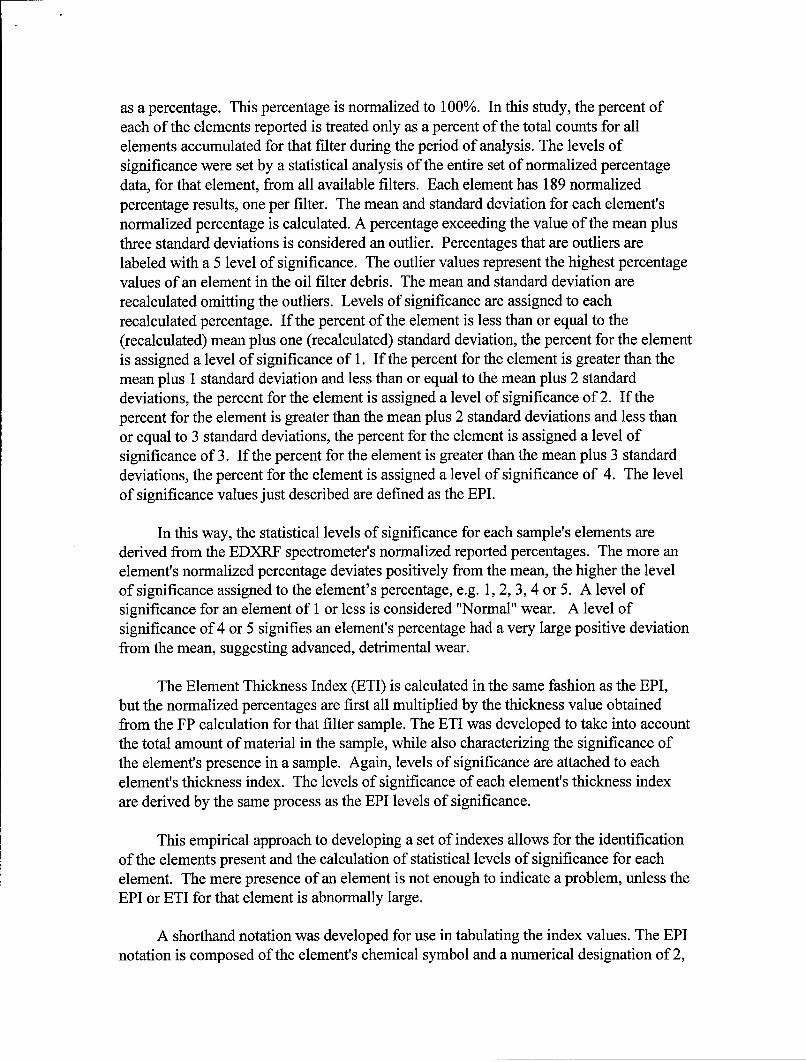
as a percentage. This percentage is normalized to 100%. In this study, the percent ofeach of the elements reported is treated only as a percent of the total counts for allelements accumulated for that filter during the period of analysis. The levels ofsignificance were set by a statistical analysis of the entire set of normalized percentagedata, for that element, from all available filters. Each element has 189 normalizedpercentage results, one per filter. The mean and standard deviation for each element'snormalized percentage is calculated. A percentage exceeding the value of the mean plusthree standard deviations is considered an outlier. Percentages that are outliers arelabeled with a 5 level of significance. The outlier values represent the highest percentagevalues of an element in the oil filter debris. The mean and standard deviation arerecalculated omitting the outliers. Levels of significance are assigned to eachrecalculated percentage. If the percent of the element is less than or equal to the(recalculated) mean plus one (recalculated) standard deviation, the percent for the elementis assigned a level of significance of 1. If the percent for the element is greater than themean plus 1 standard deviation and less than or equal to the mean plus 2 standarddeviations, the percent for the element is assigned a level of significance of 2. If thepercent for the element is greater than the mean plus 2 standard deviations and less thanor equal to 3 standard deviations, the percent for the element is assigned a level ofsignificance of 3. If the percent for the element is greater than the mean plus 3 standarddeviations, the percent for the element is assigned a level of significance of 4. The levelof significance values just described are defined as the EPI.
In this way, the statistical levels of significance for each sample's elements arederived from the EDXRF spectrometer's normalized reported percentages. The more anelement's normalized percentage deviates positively from the mean, the higher the levelof significance assigned to the element's percentage, e.g. 1, 2, 3, 4 or 5. A level ofsignificance for an element of 1 or less is considered "Normal" wear. A level ofsignificance of 4 or 5 signifies an element's percentage had a very large positive deviationfrom the mean, suggesting advanced, detrimental wear.
The Element Thickness Index (ETI) is calculated in the same fashion as the EPI,but the normalized percentages are first all multiplied by the thickness value obtainedfrom the FP calculation for that filter sample. The ETI was developed to take into accountthe total amount of material in the sample, while also characterizing the significance ofthe element's presence in a sample. Again, levels of significance are attached to eachelement's thickness index. The levels of significance of each element's thickness indexare derived by the same process as the EPI levels of significance.
This empirical approach to developing a set of indexes allows for the identificationof the elements present and the calculation of statistical levels of significance for eachelement. The mere presence of an element is not enough to indicate a problem, unless theEPI or ETI for that element is abnormally large.
A shorthand notation was developed for use in tabulating the index values. The EPInotation is composed of the element's chemical symbol and a numerical designation of 2,
3, 4 or 5 followed by a "P", e.g. Ti-5P for titanium with a significance level of 5. The ETInotation has the element's chemical symbol and a numerical designation of 2, 3, 4 or 5followed by a "T", e.g. Ti-5T.
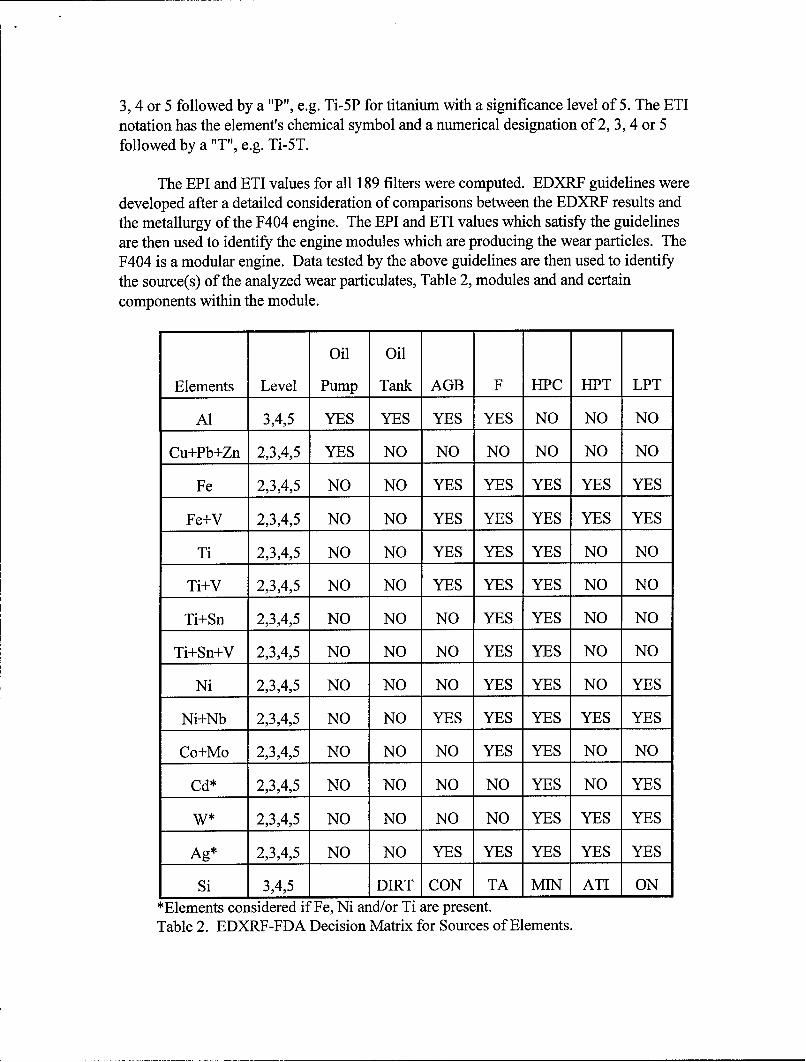
The EPI and ETI values for all 189 filters were computed. EDXRF guidelines weredeveloped after a detailed consideration of comparisons between the EDXRF results andthe metallurgy of the F404 engine. The EPI and ETI values which satisfy the guidelinesare then used to identify the engine modules which are producing the wear particles. TheF404 is a modular engine. Data tested by the above guidelines are then used to identifythe source(s) of the analyzed wear particulates, Table 2, modules and and certaincomponents within the module.
Oil Oil
Elements Level Pump Tank AGB F HPC HPT LPT
Al 3,4,5 YES YES YES YES NO NO NO
Cu+Pb+Zn 2,3,4,5 YES NO NO NO NO NO NO
Fe 2,3,4,5 NO NO YES YES YES YES YES
Fe+V 2,3,4,5 NO NO YES YES YES YES YES
Ti 2,3,4,5 NO NO YES YES YES NO NO
Ti+V 2,3,4,5 NO NO YES YES YES NO NO
Ti+Sn 2,3,4,5 NO NO NO YES YES NO NO
Ti+Sn+V 2,3,4,5 NO NO NO YES YES NO NO
Ni 2,3,4,5 NO NO NO YES YES NO YES
Ni+Nb 2,3,4,5 NO NO YES YES YES YES YES
Co+Mo 2,3,4,5 NO NO NO YES YES NO NO
Cd* 2,3,4,5 NO NO NO NO YES NO YES
W* 2,3,4,5 NO NO NO NO YES YES YES
Ag* 2,3,4,5 NO NO YES YES YES YES YES
Si 3,4,5 DIRT CON TA MIN ATI ON*Elements considered if Fe, Ni and/or Ti are present.
Table 2. EDXRF-FDA Decision Matrix for Sources of Elements.
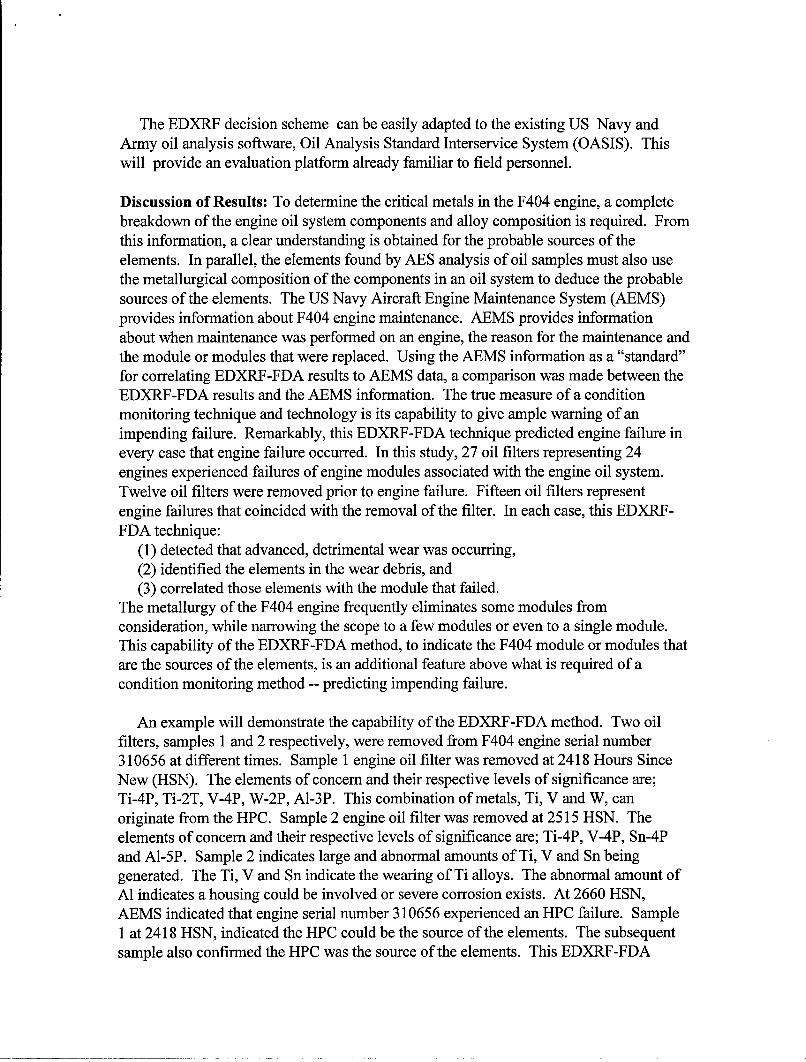
The EDXRF decision scheme can be easily adapted to the existing US Navy andArmy oil analysis software, Oil Analysis Standard Interservice System (OASIS). Thiswill provide an evaluation platform already familiar to field personnel.
Discussion of Results: To determine the critical metals in the F404 engine, a completebreakdown of the engine oil system components and alloy composition is required. Fromthis information, a clear understanding is obtained for the probable sources of theelements. In parallel, the elements found by AES analysis of oil samples must also usethe metallurgical composition of the components in an oil system to deduce the probablesources of the elements. The US Navy Aircraft Engine Maintenance System (AEMS)provides information about F404 engine maintenance. AEMS provides informationabout when maintenance was performed on an engine, the reason for the maintenance andthe module or modules that were replaced. Using the AEMS information as a "standard"for correlating EDXRF-FDA results to AEMS data, a comparison was made between theEDXRF-FDA results and the AEMS information. The true measure of a conditionmonitoring technique and technology is its capability to give ample warning of animpending failure. Remarkably, this EDXRF-FDA technique predicted engine failure inevery case that engine failure occurred. In this study, 27 oil filters representing 24engines experienced failures of engine modules associated with the engine oil system.Twelve oil filters were removed prior to engine failure. Fifteen oil filters representengine failures that coincided with the removal of the filter. In each case, this EDXRF-FDA technique:
(1) detected that advanced, detrimental wear was occurring,(2) identified the elements in the wear debris, and(3) correlated those elements with the module that failed.
The metallurgy of the F404 engine frequently eliminates some modules fromconsideration, while narrowing the scope to a few modules or even to a single module.This capability of the EDXRF-FDA method, to indicate the F404 module or modules thatare the sources of the elements, is an additional feature above what is required of acondition monitoring method -- predicting impending failure.
An example will demonstrate the capability of the EDXRF-FDA method. Two oilfilters, samples 1 and 2 respectively, were removed from F404 engine serial number310656 at different times. Sample 1 engine oil filter was removed at 2418 Hours SinceNew (HSN). The elements of concern and their respective levels of significance are;Ti-4P, Ti-2T, V-4P, W-2P, Al-3P. This combination of metals, Ti, V and W, canoriginate from the HPC. Sample 2 engine oil filter was removed at 2515 HSN. Theelements of concern and their respective levels of significance are; Ti-4P, V-4P, Sn-4Pand Al-5P. Sample 2 indicates large and abnormal amounts of Ti, V and Sn beinggenerated. The Ti, V and Sn indicate the wearing of Ti alloys. The abnormal amount ofAl indicates a housing could be involved or severe corrosion exists. At 2660 HSN,AEMS indicated that engine serial number 310656 experienced an HPC failure. Sample1 at 2418 HSN, indicated the HPC could be the source of the elements. The subsequentsample also confirmed the HPC was the source of the elements. This EDXRF-FDA
method indicated the HPC was the source of the elevated wear debris 142 operating hoursbefore the HPC failed.
Deployable Filter Debris Analysis (DFDA): The Canadian Forces (CF) at Trenton inconjunction with GasTops LTD have developed and tested a prototype Deployable FilterDebris Analysis (DFDA) machine that automatically cleans F- 18 engine oil filters. Theinstrument also segregates particles according to their size and ferromagnetic properties.Four filters for the particles extracted from each F404 lubricant filter were prepared bythe DFDA as follows:
-- a filter with ferromagnetic particles 20 micron to <200 micron (20 micron F),-- a filter with ferromagnetic particles 200 micron and greater (200 micron F),-- a filter with nonferromagnetic particles 20 to <200 microns (20 micron NF),-- and a filter with nonferromagnetic particles 200 microns and greater ( 200 micron
NF).The filters were analyzed by CF Trenton using ferrography terminology to identify thetype of wear.[1] Ferrography is a method that separates particles from the oil by passingan oil stream down a glass substrate that is placed in a magnetic field. The size,morphology and color of the particles can be observed with the aid of a microscope. Theinformation gathered from this analysis yields a concept of the type of wear occurring inthe system. The pore size of the filters that captured the particles in the DFDA machineare not the same as the pore size, 1 micron, used to develop the EDXRF-FDA method. Anew EDXRF-FDA database had to be developed to characterize the significance of thewear. The number of samples are limited, however some examples will demonstrate thecorrelation between the CF Trenton analysis of the DFDA filters and EDXRF-FDAmethod. EDXRF-FDA method will also yield considerably more detail about thecomposition of the particles on the DFDA filters and their relative significance. Nomaintenance data or pertinent information was available about the engines, therefore acorrelation between actual maintenance performed on an engine and the EDXRF-FDAmethod and the CF Trenton filter analysis method could not be done.
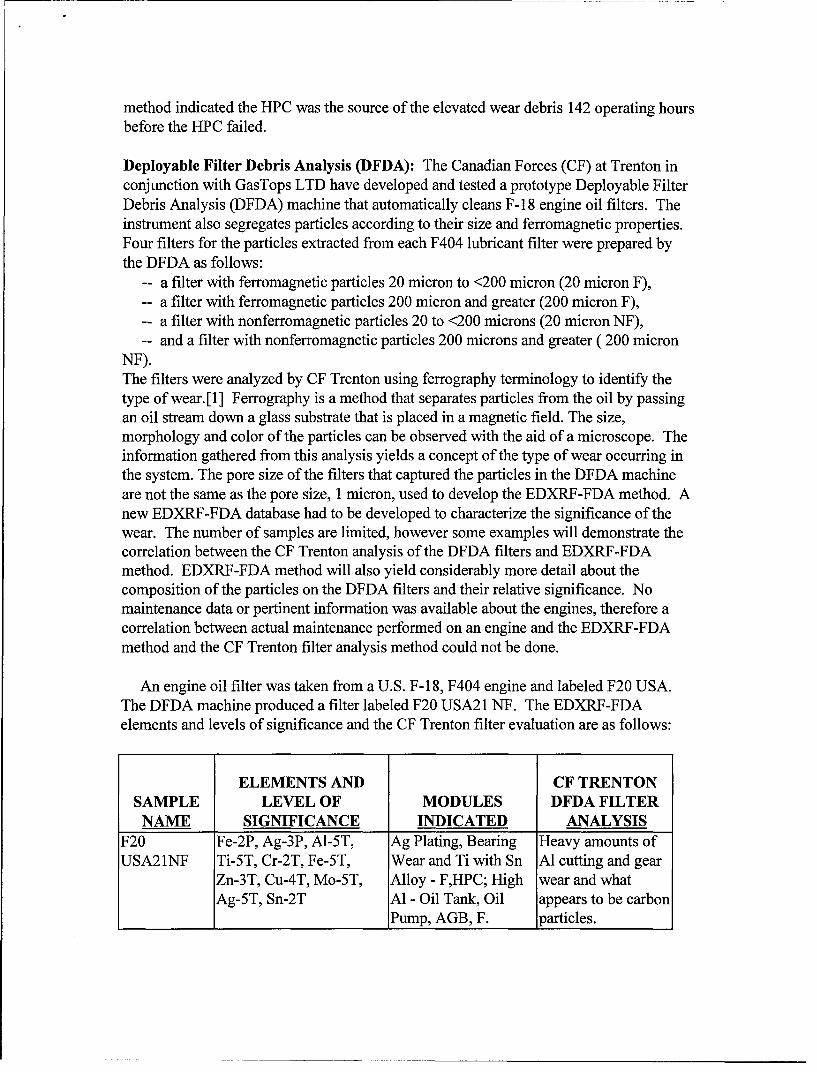
An engine oil filter was taken from a U.S. F-18, F404 engine and labeled F20 USA.The DFDA machine produced a filter labeled F20 USA21 NF. The EDXRF-FDAelements and levels of significance and the CF Trenton filter evaluation are as follows:
ELEMENTS AND CF TRENTONSAMPLE LEVEL OF MODULES DFDA FILTER
NAME SIGNIFICANCE INDICATED ANALYSISF20 Fe-2P, Ag-3P, Al-5T, Ag Plating, Bearing Heavy amounts ofUSA21NF Ti-5T, Cr-2T, Fe-5T, Wear and Ti with Sn Al cutting and gear
Zn-3T, Cu-4T, Mo-5T, Alloy - F,HPC; High wear and whatAg-5T, Sn-2T Al - Oil Tank, Oil appears to be carbon
Pump, AGB, F. particles.
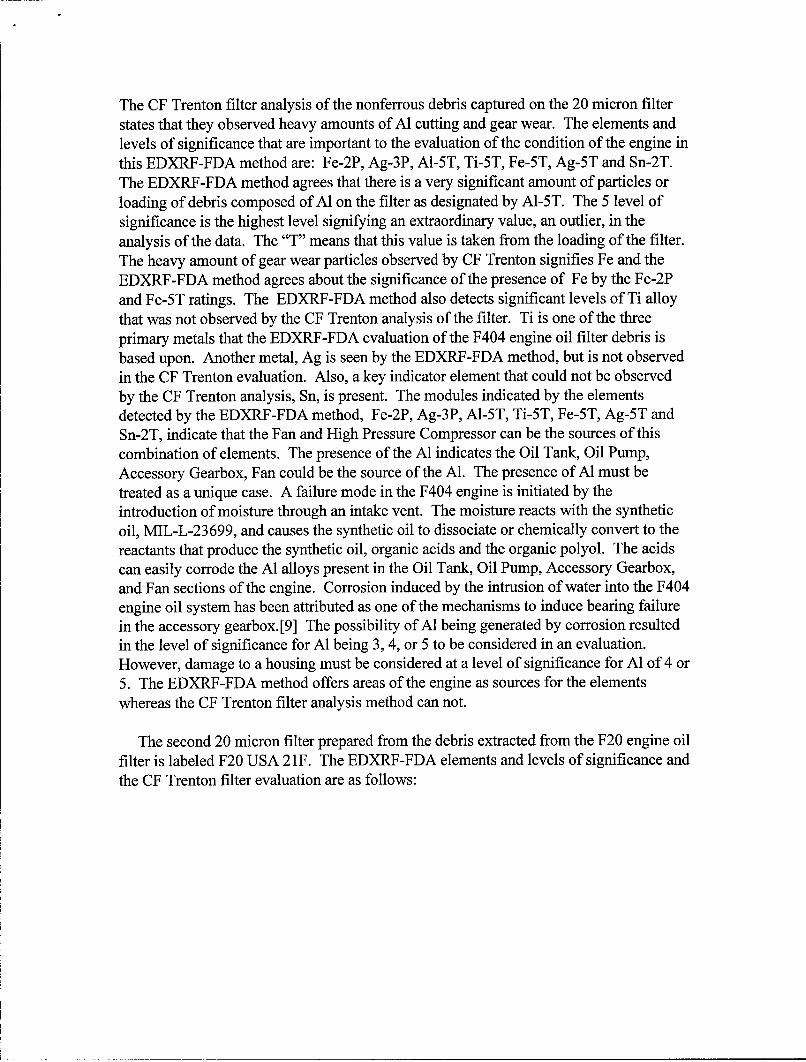
The CF Trenton filter analysis of the nonferrous debris captured on the 20 micron filterstates that they observed heavy amounts of Al cutting and gear wear. The elements andlevels of significance that are important to the evaluation of the condition of the engine inthis EDXRF-FDA method are: Fe-2P, Ag-3P, A1-5T, Ti-5T, Fe-5T, Ag-5T and Sn-2T.The EDXRF-FDA method agrees that there is a very significant amount of particles orloading of debris composed of Al on the filter as designated by Al-5T. The 5 level ofsignificance is the highest level signifying an extraordinary value, an outlier, in theanalysis of the data. The "T" means that this value is taken from the loading of the filter.The heavy amount of gear wear particles observed by CF Trenton signifies Fe and theEDXRF-FDA method agrees about the significance of the presence of Fe by the Fe-2Pand Fe-5T ratings. The EDXRF-FDA method also detects significant levels of Ti alloythat was not observed by the CF Trenton analysis of the filter. Ti is one of the threeprimary metals that the EDXRF-FDA evaluation of the F404 engine oil filter debris isbased upon. Another metal, Ag is seen by the EDXRF-FDA method, but is not observedin the CF Trenton evaluation. Also, a key indicator element that could not be observedby the CF Trenton analysis, Sn, is present. The modules indicated by the elementsdetected by the EDXRF-FDA method, Fe-2P, Ag-3P, A1-5T, Ti-5T, Fe-5T, Ag-5T andSn-2T, indicate that the Fan and High Pressure Compressor can be the sources of thiscombination of elements. The presence of the Al indicates the Oil Tank, Oil Pump,Accessory Gearbox, Fan could be the source of the Al. The presence of Al must betreated as a unique case. A failure mode in the F404 engine is initiated by theintroduction of moisture through an intake vent. The moisture reacts with the syntheticoil, MIL-L-23699, and causes the synthetic oil to dissociate or chemically convert to thereactants that produce the synthetic oil, organic acids and the organic polyol. The acidscan easily corrode the Al alloys present in the Oil Tank, Oil Pump, Accessory Gearbox,and Fan sections of the engine. Corrosion induced by the intrusion of water into the F404engine oil system has been attributed as one of the mechanisms to induce bearing failurein the accessory gearbox.[9] The possibility of Al being generated by corrosion resultedin the level of significance for Al being 3, 4, or 5 to be considered in an evaluation.However, damage to a housing must be considered at a level of significance for Al of 4 or5. The EDXRF-FDA method offers areas of the engine as sources for the elementswhereas the CF Trenton filter analysis method can not.
The second 20 micron filter prepared from the debris extracted from the F20 engine oilfilter is labeled F20 USA 21F. The EDXRF-FDA elements and levels of significance andthe CF Trenton filter evaluation are as follows:
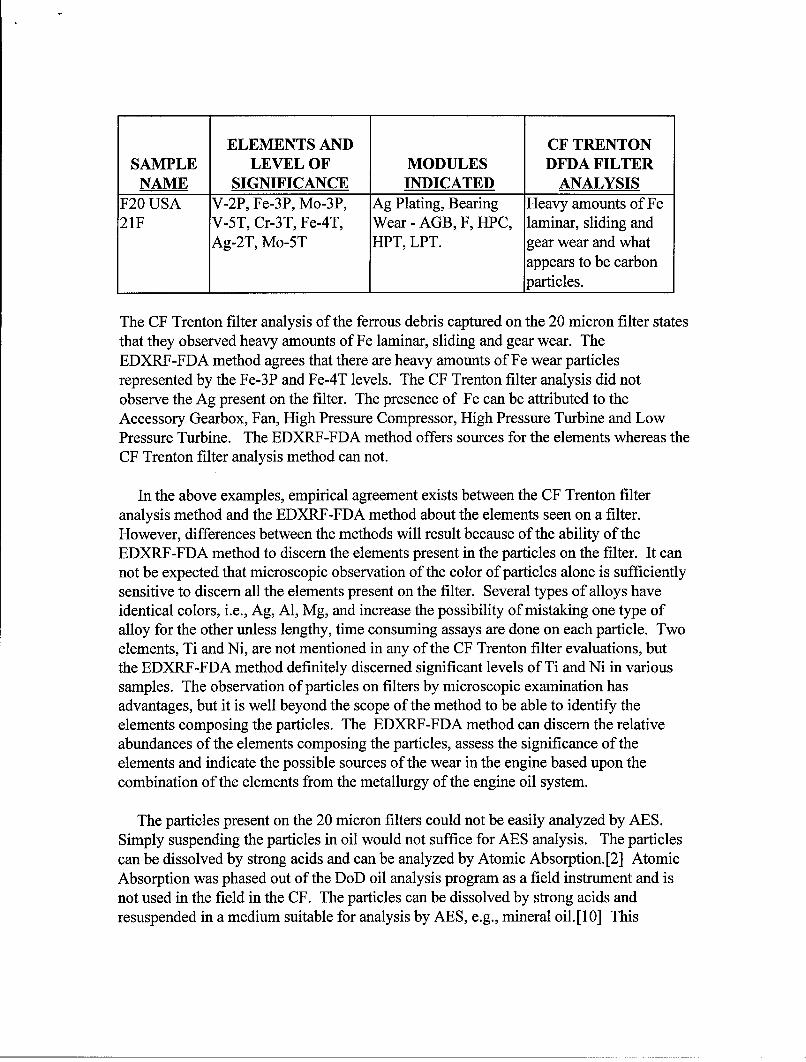
ELEMENTS AND CF TRENTONSAMPLE LEVEL OF MODULES DFDA FILTER
NAME SIGNIFICANCE INDICATED ANALYSISF20 USA V-2P, Fe-3P, Mo-3P, Ag Plating, Bearing Heavy amounts of Fe21F V-5T, Cr-3T, Fe-4T, Wear - AGB, F, HPC, laminar, sliding and
Ag-2T, Mo-5T HPT, LPT. gear wear and whatappears to be carbonparticles.
The CF Trenton filter analysis of the ferrous debris captured on the 20 micron filter statesthat they observed heavy amounts of Fe laminar, sliding and gear wear. TheEDXRF-FDA method agrees that there are heavy amounts of Fe wear particlesrepresented by the Fe-3P and Fe-4T levels. The CF Trenton filter analysis did notobserve the Ag present on the filter. The presence of Fe can be attributed to theAccessory Gearbox, Fan, High Pressure Compressor, High Pressure Turbine and LowPressure Turbine. The EDXRF-FDA method offers sources for the elements whereas theCF Trenton filter analysis method can not.
In the above examples, empirical agreement exists between the CF Trenton filteranalysis method and the EDXRF-FDA method about the elements seen on a filter.However, differences between the methods will result because of the ability of theEDXRF-FDA method to discern the elements present in the particles on the filter. It cannot be expected that microscopic observation of the color of particles alone is sufficientlysensitive to discern all the elements present on the filter. Several types of alloys haveidentical colors, i.e., Ag, Al, Mg, and increase the possibility of mistaking one type ofalloy for the other unless lengthy, time consuming assays are done on each particle. Twoelements, Ti and Ni, are not mentioned in any of the CF Trenton filter evaluations, butthe EDXRF-FDA method definitely discerned significant levels of Ti and Ni in varioussamples. The observation of particles on filters by microscopic examination hasadvantages, but it is well beyond the scope of the method to be able to identify theelements composing the particles. The EDXRF-FDA method can discern the relativeabundances of the elements composing the particles, assess the significance of theelements and indicate the possible sources of the wear in the engine based upon thecombination of the elements from the metallurgy of the engine oil system.
The particles present on the 20 micron filters could not be easily analyzed by AES.Simply suspending the particles in oil would not suffice for AES analysis. The particlescan be dissolved by strong acids and can be analyzed by Atomic Absorption. [2] AtomicAbsorption was phased out of the DoD oil analysis program as a field instrument and isnot used in the field in the CF. The particles can be dissolved by strong acids andresuspended in a medium suitable for analysis by AES, e.g., mineral oil.[10] This
procedure for using AES to measure particulate debris from F404 engine oil filters wasdeemed unsuitable for use in the field by CF military personnel.[1]
Conclusions: In the DoD and CF, F404 engine oil filters are changed every 200 hours.The oil filter that is removed is simply discarded. The analysis of debris from in-line oilfilters yields a cumulative history of the wear the engine is experiencing. TheEDXRF-FDA method described in this paper yields the relative abundances of eachelement, builds a database, statistically analyzes the database and sets limits based uponthe database.
The other methods AES, particle counting and ferrography depend upon frequent grabsamples to detect the particles that will indicate the onset of abnormal wear and/or failure.The grab sample only indicates the condition of the machine when the sample is taken.The frequency of sampling is dictated by the types of failures that are occurring in themachine. In the case of AES, it is assumed that the failure modes will generate sufficientquantities of particles in the size range that AES can detect within the frequency ofsampling. This is why sampling for AES analysis requires small intervals betweensamples and the sampling frequency must be high.
Fine filters severely limit the use of AES, particle counting and conventionalferrography to monitor the wear condition of the machine. Numerous weapon systemshave been removed from AES monitoring because of fine filtration and the inability ofAES to detect abnormal wear and/or failures in weapon systems. In the case of the F404engine, the effective ultra fine filtration of the engine oil system eliminates the use ofAES in monitoring the wear condition of the machine. Monitoring of the wear conditionof the F404 engine oil system is relegated to magnetic chip detectors and replacement ofcomponents/modules in the lubricant system based upon the hours of operation.However, F404 engines still experience failures. The EDXRF-FDA method representsthe condition monitoring capability required to detect the onset of abnormal wear and theonset of failure modes in the F404 engine.
The EDXRF-FDA method is a common sense approach to monitoring the wearcondition of the F404 engine and would give the DOD and CF a cutting edge,nondestructive technology that field personnel can easily use. The long lead times givenby the EDXRF-FDA method before a failure occurs would allow for a significantreduction in the frequency of sampling a machine. Typically, for a jet turbine engine anoil sample is taken every 10 operating hours. For example, if the engine oil filter for theEDXRF-FDA method is taken every 200 operating hours then 20 oil samples would haveto be taken in the same interval. In this example, the EDXRF-FDA method offers areduction of 19 samples.
The DFDA machine demonstrates great potential in automating the preparation ofsamples for EDXRF analysis. However, more F404 engine oil filters need to be cleanedand analyzed by the EDXRF-FDA method to demonstrate the potential application to theEDXRF-FDA condition monitoring process.
References
1. Lussier, L., Little, P.D., Gelinas, G.L.J. "Project D95153F, Evaluation of RMC QFDATechnique and GasTops DFDA", May 2, 1997.
2. Eisentraut, K.J., Saba, C.S., Kauffman, R.E., Rhine, W.E., "Spectrometric OilAnalysis, Detecting Engine Failures before they occur," Analytical Chemistry 56, Aug.1984, 1086A.
3. Fitch, E.C., "Fluid Contamination Control," FES, Inc., 1988, pp. 3 7 -4 0 ,7 0 .
4. Aircraft Engine Maintenance System, US Navy.
5. Spectrace Instruments, Inc., 345 Middlefield Road, Mountain View, California940343, "Spectrace 5000 Operators Manual," Rev. D, (November 1990), 2-1 to 2-20.
6. Jenkins, R., Gould, R.W., Gedcke, D., "Quantitative X-Ray Spectrometry, 2nd Ed.,Marcel Dekker, Inc. 1995.
7. Spectrace Instruments, Inc., 345 Middlefield Road, Mountain View, California940343, "Fundamental Parameters, Version 1.34," January 1991, p. 6-1.
8. Humphrey, G. R., "Characterization of Debris from F404 Engine Oil Filters by EnergyDispersive X-Ray Fluorescence," JOAP-TSC-TR-96-02, June 14, 1996.
9. Conversation with Martha Irene, F404 Engineer.
10.Swanson, S.A., "Quantitative Filter Debris Analysis: Sample Preparation for Analysisby Rotating Disk Electrode Atomic Emission Spectrophotometry," Royal MilitaryCollege of Canada, April 1995.